hydrodynamic and structural performance of the transverse … · hydrodynamic and structural...
TRANSCRIPT

Hydrodynamic and Structural Performance of the Transverse Horizontal Axis Water Turbine
Prof. Guy Houlsby, University of Oxford
Research and Industry Workshop, University of Leicester6th May 2011

Outline
• Why renewable power?• Why tidal stream?• The THAWT concept• Betz limit can be exceeded• 1/20th Scale tests: hydrodynamics• CFD adds understanding of flow• Loads on blades

Increase of atmospheric CO2
300.00
320.00
340.00
360.00
380.00
400.00
1950 1960 1970 1980 1990 2000 2010
Ann
ual a
vera
ge a
tmos
pher
ic C
O2
(ppm
v)Data from Manua Loa Observatory, HawaiiSource: Scripps Institution of Oceanography
The "Keeling Curve"
May 2009 – first monthly average over 390 ppmv

Increase of atmospheric CO2
0.00
0.50
1.00
1.50
2.00
2.50
3.00
1950 1960 1970 1980 1990 2000 2010
Ann
ual i
ncre
ase
of a
tmos
pher
ic C
O2
(ppm
v/ye
ar)
Data from Manua Loa Observatory, HawaiiSource: Scripps Institution of Oceanography

Historical records of atmospheric CO2
Source: GRID-Arendal (United Nations Environment Programme)

0
20
40
60
80
100
120
140
160
1985 1990 1995 2000 2005 2010
Oil (10^6 tonnes / year)
Gas (10^9 m3 / year)
UK oil and gas production
Source: Office for National Statistics

Problem:• Climate change due to fossil fuel use• Diminishing supply of hydrocarbons
Solution:• Nuclear• Renewables

Why Tidal Stream Energy?
• Potential to supply at least 18TWh/yr (6%) of UK electricity requirements (source: Black & Veatch/Carbon Trust)
– Minimal environmental impact - unlike a barrage
– Power is highly predictable - unlike wind
• Resident UK-based expertise in marine engineering
• Export potential

Tidal Resource – UK Target Areas
Pentland Firth, 4m/s
Irish Sea, 2m/s
Bristol Channel, 2m/s
English Channel, 2m/s
Peak tidal flow
Source: DTI Atlas of UK Marine Renewable Energy Resources
NB: Tides are cyclic but totally predictable

Options for tidal stream power (1)• Axial flow turbines
(“underwater windmills”)– “Unducted”
» MCT (most developed)» TidalStream» Tidel» … at least 8 others
– “Ducted”» Lunar Energy» Open Hydro» … at least 8 others
– Fixing options:• Fixed foundation• Pivoted• Anchored
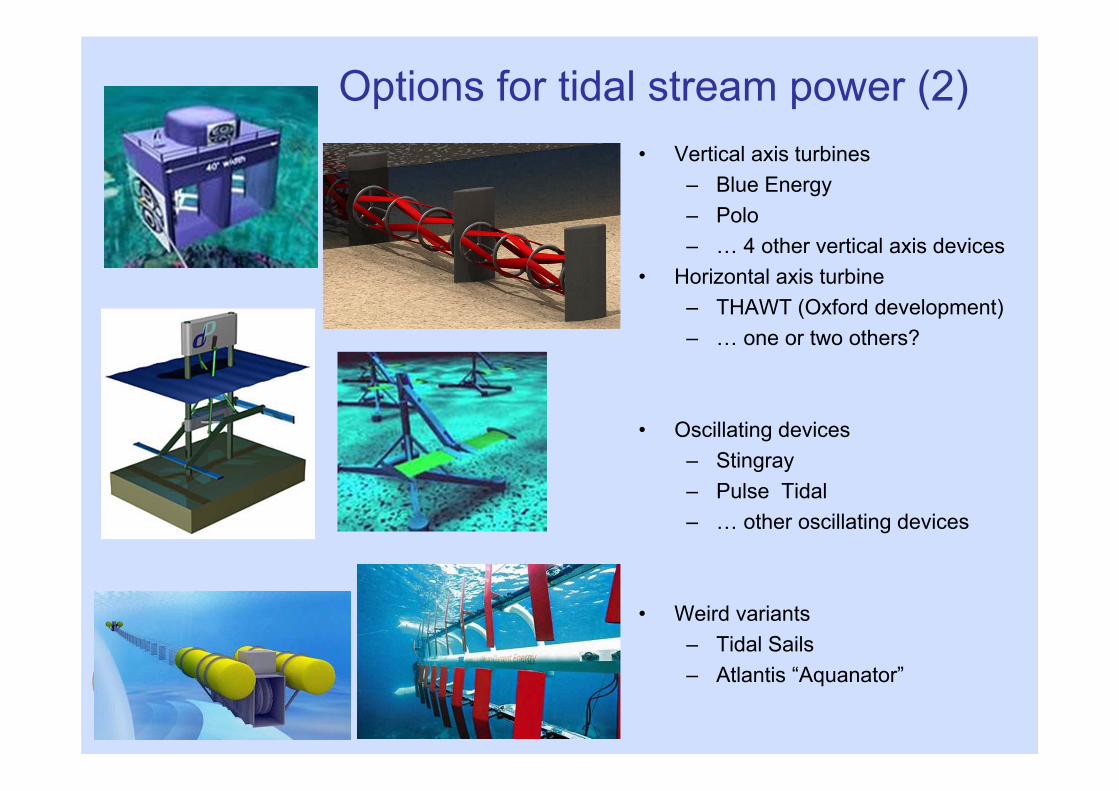
Options for tidal stream power (2)• Vertical axis turbines
– Blue Energy– Polo– … 4 other vertical axis devices
• Horizontal axis turbine– THAWT (Oxford development)– … one or two others?
• Oscillating devices– Stingray– Pulse Tidal– … other oscillating devices
• Weird variants– Tidal Sails– Atlantis “Aquanator”

Scalability of tidal devices
… stretch …

Scalability of tidal devices
THAWT
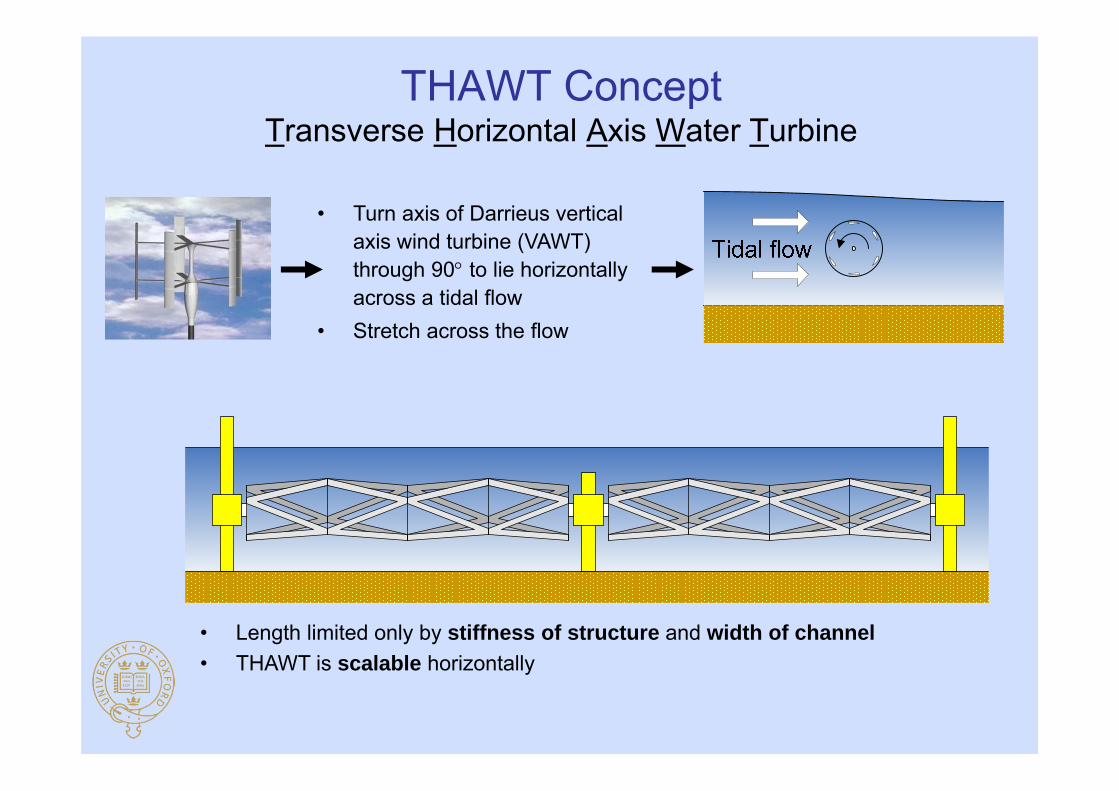
• Turn axis of Darrieus vertical axis wind turbine (VAWT) through 90 to lie horizontally across a tidal flow
• Stretch across the flow
THAWT ConceptTransverse Horizontal Axis Water Turbine
• Length limited only by stiffness of structure and width of channel• THAWT is scalable horizontally

Fluid Mechanics of Darrieus Cross-Flow Turbine
Driving mechanism:
Torque per blade = R (L sinα – D cos α)

A comparison: axial flow turbine v. THAWT
• Advantages:– fewer foundations– fewer (larger) generators– fewer moving parts
THAWTGeneric
Axial FlowTidal velocity (m/s) 2.5 2.5Depth (m) 20 20Rotor Dia. (m) 10 10Rotor length (m) 60Number of rotors 2 10Flow area intercepted sq. m) 1200 785Total length (m) 128.0 125.0Power Output (MW) 7.0 3.7Number of foundations 3 5Number of generators 1 10Number of primary seals 4 30Estimated manufacturing costs 60% 100%Estimated maintenance costs 40% 100%

Tests at Newcastle University at 1/20th scale• Tests on a single turbine bay
– 0.5m diameter– 0.875m length– up to 1m depth
• Power curves recorded using servo motor/generator control of turbine speed
• Performance in a range of realistic flow conditions explored
• Turbine optimisation explored

Froude number scaling of flow conditions• Choice between Froude number
or blade Reynolds number scaling
• Maximum power available to a device in an open channel flow only a function of Froude number and blockage ratio(G.T. Houlsby et al. (2008). Application of Linear Momentum Actuator Disc Theory to Open
Channel Flow, University of Oxford Internal report, OUEL 2296/08)
• Froude number scaling
• Lower Reynolds number flows result in poor hydrofoil performance and a conservative estimate of the full scale performance
Scale Model Full ScaleFlow depth 1m 20mFroude number range 0.09 ‐ 0.22 0.09 ‐ 0.22Flow velocity range (m/s) 0.3 – 0.7 1.3 ‐ 3.1
ChordubladeRe
ghu
Fr

0
0.1
0.2
0.3
0.4
0.5
0.6
0.7
0.8
0.9
0 1 2 3 4 5 6
Kin
etic
effi
cien
cy
Tip speed ratio
BetzFr=0.09Fr=0.13Fr=0.18Fr=0.22
Effect of flow rate on Truss THAWT performance
3
21
AuP
k
Blade transient stall at low speeds
Reduced angle of attack and increased drag at high speeds
Peak power

What about the Betz limit?
321
2716
AuP
For wind turbine in free air, mass/momentum analysis shows that stream tube area increases and velocity decreases through the turbine.
Max power is the Betz limit

Betz limit does not apply to tidal flows
Mixing
41 2 5
ub4
h5
At1
At4
ub4
u5ut4
h
h1 = h
u1 = u
3
AT
X
hbhugP
Head Efficiency Mass flow rate Change in depth
Power extracted from turbine best represented by Head efficiency
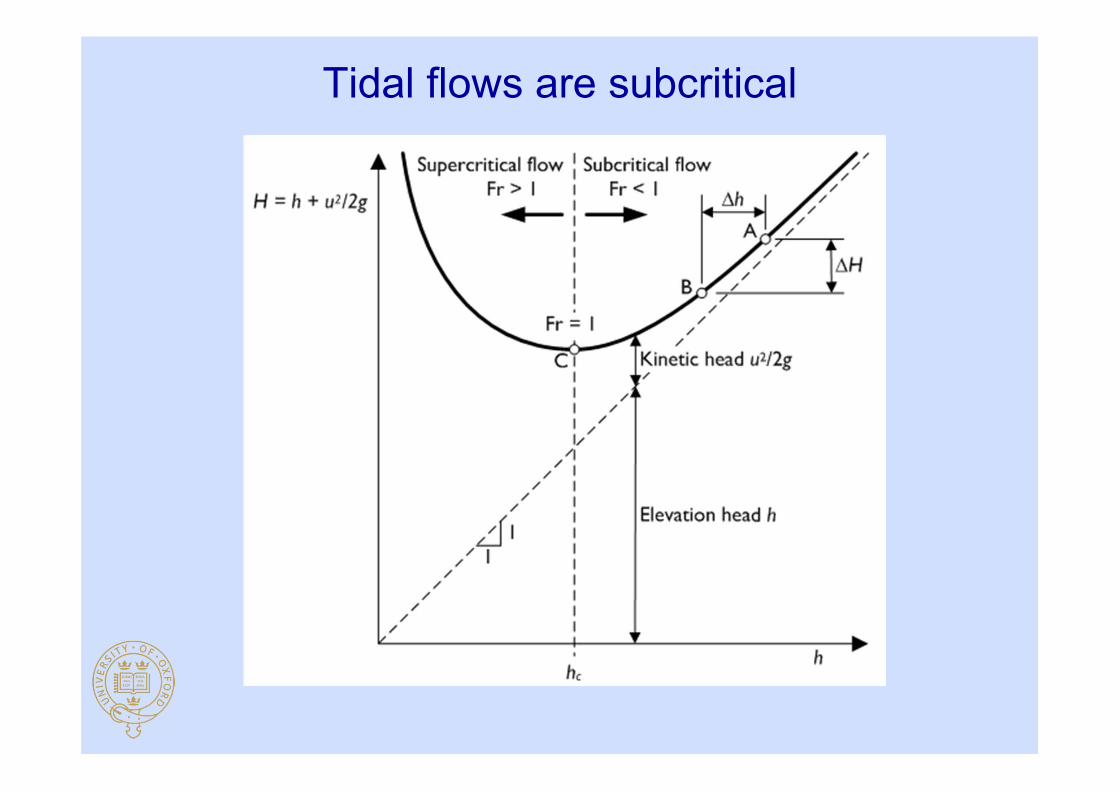
Tidal flows are subcritical

Downstream Mixing and Efficiency
022
123
21 22
223
BFrChhBFrCFr
hh
hh TT
1
22
/12/11
hhhhFr
hgubhP
PPP
W
Depth change may become an extremely important measure in light of environmental considerations

CFD : Computational Fluid Dynamics
• Calculation of flow through turbine is difficult– Unsteady, three dimensional, free surface, wide
range of length scales• Simplified analysis to calculate:
– Power– Forces on blades

CFD : Computational Fluid Dynamics
25 -1.2
-1
-0.8
-0.6
-0.4
-0.2
0
0.2
0.4
0.6
0.8
1
1.2
0 30 60 90 120 150 180 210 240 270 300 330 360
Equ
ival
ent l
ift c
oeff
icie
nt C
L
Angular position (degrees)

Phase 2 testing at Newcastle

Power curves
-0.2
0
0.2
0.4
0.6
0.8
1
0 1 2 3 4 5
Pow
er C
oeff
icie
nt C
P
Tip Speed Ratio TSR
-0.2
0
0.2
0.4
0.6
0.8
0 1 2 3 4 5
Pow
er C
oeff
icie
nt, C
P
Tip Speed Ratio, TSR

Exceeding the Betz limit
0
0.2
0.4
0.6
0.8
1
1.2
1.4
1.6
0.000 0.050 0.100 0.150 0.200
Pow
er c
oeff
icie
nt, C
P
Froude number, Fr
B = 0.48, ForwardB = 0.48, ReverseB = 0.5, COMSOLB = 0.6, ForwardB = 0.6, ReverseB = 0.625, COMSOL
Betz limit

Measurements of bending moment
-15
-10
-5
0
5
10
15
0 30 60 90 120 150 180 210 240 270 300 330 360
Ben
ding
mom
ent (
Nm
)
Angle (degrees)
End 1MidpointEnd 2

Measured loads on blades
-80
-60
-40
-20
0
20
40
60
80
0 30 60 90 120 150 180 210 240 270 300 330 360
Dis
trib
uted
load
(N/m
)
Angle (degrees)
-1.2
-1
-0.8
-0.6
-0.4
-0.2
0
0.2
0.4
0.6
0.8
1
1.2
0 30 60 90 120 150 180 210 240 270 300 330 360E
quiv
alen
t lift
coe
ffic
ient
CL
Angular position (degrees)

Measured “Lift Coefficients”
-2
-1.5
-1
-0.5
0
0.5
1
1.5
2
2.5
3
0.000 0.050 0.100 0.150 0.200
Lift
coe
ffic
ient
at p
eak,
CL
Froude number, Fr
B = 0.48, MaxB = 0.48, MinB = 0.5, COMSOL, MaxB = 0.5, COMSOL, MinB = 0.6, MaxB = 0.6, MinB = 0.625, COMSOL MaxB = 0.625, COMSOL, Min
221 uc
wCL

Performance in a reversed flow
-5
0
5
10
15
20
25
30
0 1 2 3 4 5
Pow
er (W
)
Tip Speed ratio
Standard
Reversed
Truss device tested in standard and reversed configurations at Fr = 0.18

Varying the fixed offset blade pitch
0
0.1
0.2
0.3
0.4
0.5
0.6
0.7
0.8
0.9
1
-6 -4 -2 0
Pow
er c
oeffi
cien
t, C
P
Pitch angle (degrees)
S = 0.25, Fr = 0.109S = 0.25, Fr = 0.143S = 0.25, Fr=0.172S = 0.25, Fr = 0.16, COMSOLS = 0.125, Fr = 0.109S = 0.125, Fr = 0.144

1/20th Scale Test Conclusions• Device is capable of exceeding the Betz
limit by utilising blockage effects
• THAWT has comparable performance to a parallel bladed equivalent
• Performance of the device may be improved using a fixed offset pitch
• Due to Reynolds number issues the results here are a conservative estimate of the full scale performance of the device
• Blade loading measurements have been made
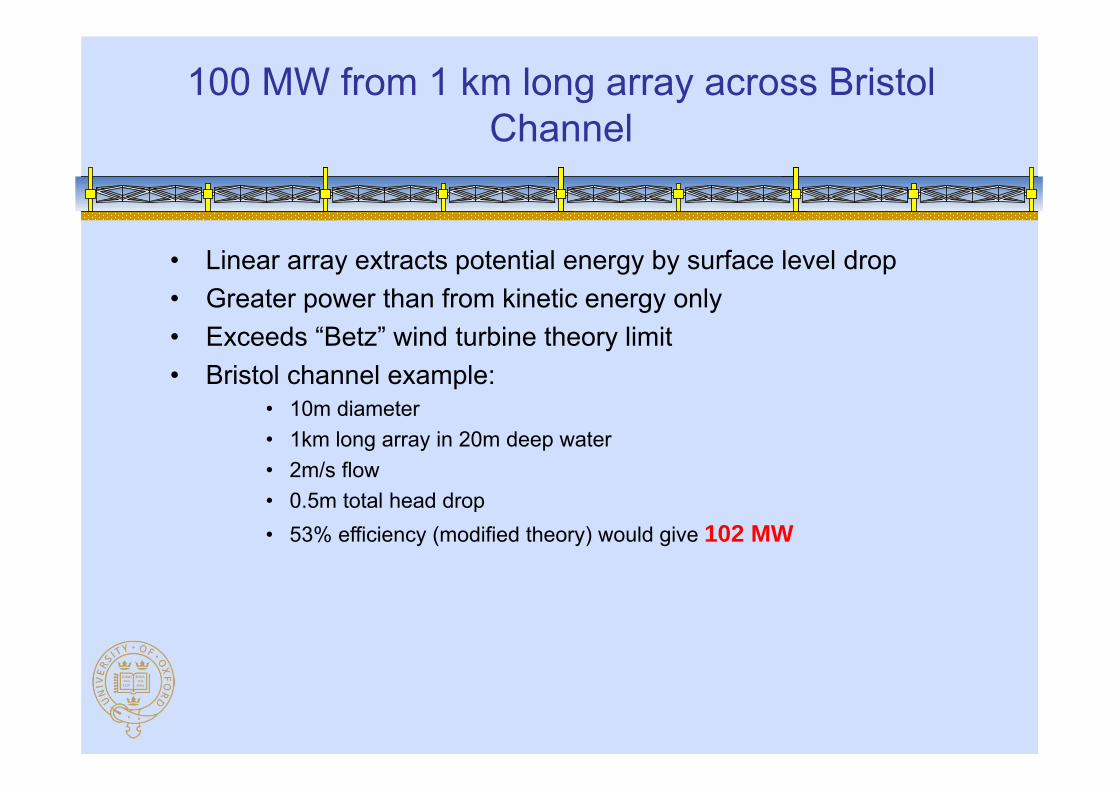
100 MW from 1 km long array across Bristol Channel
• Linear array extracts potential energy by surface level drop• Greater power than from kinetic energy only• Exceeds “Betz” wind turbine theory limit• Bristol channel example:
• 10m diameter• 1km long array in 20m deep water • 2m/s flow • 0.5m total head drop• 53% efficiency (modified theory) would give 102 MW

THAWT in the Bristol Channel
1 GW installation?

Acknowledgements• Oxford Tidal Engineering Group:
– Staff• Richard Willden, Alistair Borthwick, Martin Oldfield, Malcolm McCulloch
– Students/RAs• Ross McAdam, Claudio Consul, Scott Draper, Yihui Shi, Esteban
Ferrer, Clarissa Belloni, Tom Adcock, Simon McIntosh, Sena Serhadlioglu, Conor Fleming, Justine Schluntz, Chris Vogel, Taka Nishino
– THAWT Commercial Team• Sean Westrope, Peter Dixon, Stuart Wilkinson, James Mallinson
• Sponsors:– EPSRC, Oxford University UCSF, Isis Innovation Ltd., RCUK, John Fell
OUP Fund, Rhodes Trust, Energy Technologies Institute, Royal Academy of Engineering, German Academic Exchange Service, Oxford Martin School, TSB, Kepler Energy Ltd.
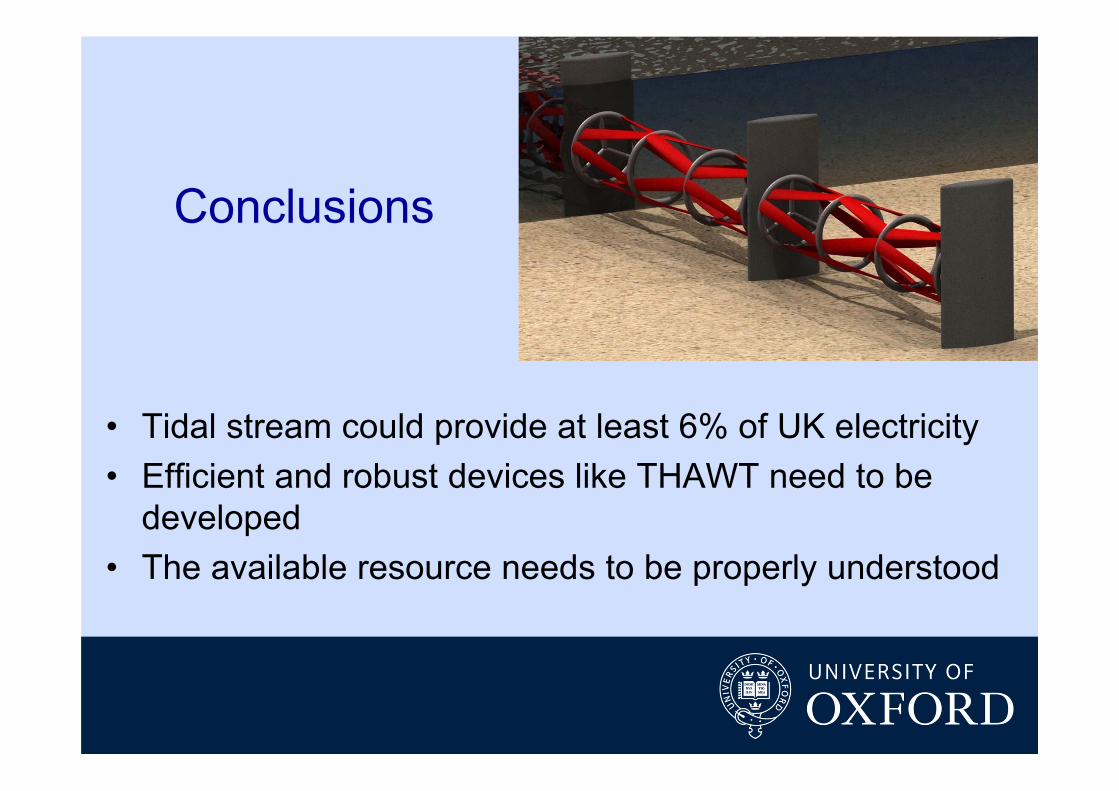
Conclusions
• Tidal stream could provide at least 6% of UK electricity• Efficient and robust devices like THAWT need to be
developed• The available resource needs to be properly understood
38