hydrogen analytical annex
TRANSCRIPT
August 2021
Hydrogen Analytical AnnexAnalytical Annex to the Hydrogen Strategy, Net Zero Hydrogen Fund consultation, Low Carbon Hydrogen Business Model consultation, and Low Carbon Hydrogen Standards consultation

© Crown copyright 2021
This publication is licensed under the terms of the Open Government Licence v3.0 except where otherwise stated. To view this licence, visit nationalarchives.gov.uk/doc/open-government-licence/version/3 or write to the Information Policy Team, The National Archives, Kew, London TW9 4DU, or email: [email protected].
Where we have identified any third-party copyright information you will need to obtain permission from the copyright holders concerned.
Any enquiries regarding this publication should be sent to us at: [email protected]

3
Contents Acronym Glossary __________________________________________________________ 4
Introduction _______________________________________________________________ 5
1. Strategic Context _________________________________________________________ 6
2. Market Barriers __________________________________________________________ 24
3. Hydrogen Production Support ______________________________________________ 35
4. Net Zero Hydrogen Fund __________________________________________________ 50
5. Low Carbon Hydrogen Business Model _______________________________________ 57
6. Low Carbon Hydrogen Standard ____________________________________________ 93

Analytical Annex
4
Acronym Glossary
Name Abbreviation
Auto-Thermal Reformer ATR
Business Model BM
Capital expenditure CAPEX
Carbon Capture, Usage and Storage CCUS
CO2 Transmission and Storage CO2 T&S
Final investment decision FID
Gas Heated Reformer GHR
Hydrogen H2
Levelised cost of hydrogen LCOH
Load factor LF
Megawatt MW
Megawatt-hour MWh
Operating expenditure OPEX
Proton Exchange Membrane PEM
Solid Oxide Electrolysis SOE
Steam Methane Reformation SMR

Analytical Annex
5
Introduction Low carbon hydrogen will be critical for meeting the UK’s legally binding commitment to achieve net zero by 2050, with potential to help decarbonise vital UK industry sectors and provide flexible energy across heat, power and transport. As part of the Ten Point Plan for a Green Industrial Revolution1, in November 2020 the prime minister announced the UK’s ambition to deploy 5GW of low carbon hydrogen production capacity by 2030, to be supported by a range of measures including a Net Zero Hydrogen Fund and a proposed hydrogen business model. In August 2021, the government published a package of policy documents building on these announcements and adding to the existing policies supporting growth of hydrogen economy2:
• Hydrogen Strategy3: strategy setting out a series of commitments from government which clearly set out how we will deliver our vision for a low carbon hydrogen economy in 2030 and beyond.
• Net Zero Hydrogen Fund (NZHF) consultation4: consultation on proposed position on the scope, design and delivery of upfront support under the NZHF.
• Low Carbon Hydrogen Business Models consultation5: consultation on our minded-to position on the commercial design of the business model for low carbon hydrogen production.
• Low Carbon Hydrogen Standards consultation6: consultation on a potential emissions standard to define and standardise what is meant by ‘low carbon’ hydrogen.
This document provides the analysis and evidence underpinning these publications. Chapters 1 and 2 focus on the whole hydrogen economy, setting out the strategic context and exploring the market barriers to uptake of low carbon hydrogen across the value chain. Building on this wider context, Chapters 3-5 focus on policy measures to support low carbon hydrogen production through the NZHF and hydrogen business models, and Chapter 6 focuses on low carbon hydrogen standards.
1 HM Government (2020), ‘The Ten Point Plan for a Green Industrial Revolution’ (viewed on 18 June 2021). 2 For more detail on existing policies see section 1.2 of the Designing the Net Zero Hydrogen Fund consultation document. 3 BEIS (2021), ‘UK Hydrogen Strategy’ (viewed in July 2021). 4 BEIS (2021), ‘Designing the Net Zero Hydrogen Fund’ (viewed in July 2021). 5 BEIS (2021), ‘Design of a Business Model for Low Carbon Hydrogen’ (viewed in July 2021). 6 BEIS (2021), ‘Designing a UK Low Carbon Hydrogen Standard’ (viewed in July 2021).

Analytical Annex
6
1. Strategic Context
Current role of hydrogen
In 2019, the International Energy Agency (IEA) estimated global hydrogen production was around 2,800 TWh per year7. The biggest uses of hydrogen worldwide are in oil refining (33%) and ammonia production (27%). Almost all hydrogen currently produced is not low carbon: the IEA report suggests the vast majority of the current global supply is produced through high carbon methods such as steam methane reformation (SMR) and coal gasification, with only 2% produced by electrolysis, which is still only as low carbon as the electricity source it uses8.
There is significant uncertainty around how much hydrogen is currently used in the UK: data are not regularly collected, and hydrogen production is often embedded in industrial processes, making it challenging to measure. A 2016 report by the Energy Research Partnership (ERP)9 estimated UK production was around 27 TWh/year, while evidence gathered for the Hy4Heat programme on known UK hydrogen production sites suggested production of around 10 TWh/year10. Data from the Fuel Cells and Hydrogen Observatory (FCHO)11 estimated less than 1% of UK hydrogen production capacity was electrolysis, with over 75% SMR; the remainder was mostly a by-product of industrial processes. Around 70% of production capacity was captive production, where hydrogen is produced and used on site, with another 20% produced as a by-product. Only 10% of production capacity was merchant production, where hydrogen is produced for sale to other users.
In chapter 5 of the Hydrogen Strategy, we have committed to collecting and publishing data on UK hydrogen production in the annual Digest of UK Energy Statistics (DUKES). This will improve our understanding of the current hydrogen landscape and allow us to monitor our progress against the outcomes set out in chapter 1 of the Hydrogen Strategy.
Future role of hydrogen
The Climate Change Committee’s (CCC) Carbon Budget 6 (CB6) advice12 suggests low carbon hydrogen will be essential for meeting net zero. Hydrogen could play a key role in decarbonising hard to electrify sectors and providing flexible energy across heat, power, industry and transport, contributing to meeting our CB6 target. This section presents evidence on the role hydrogen could play in different sectors and how low carbon hydrogen could be supplied.
7 IEA (2019), ‘The Future of Hydrogen’ (viewed on 18 June 2021). 8 Further detail on low carbon hydrogen production methods can be found in Chapter 3. 9 ERP (2016), ‘Potential Role of Hydrogen in the UK Energy System’ (viewed on 18 June 2021). 10 DNV GL (2019), ‘Hy4Heat, Hydrogen Purity – Final Report’ (viewed on 18 June 2021). 11 FCHO, ‘Hydrogen Supply Capacity’ (viewed on 18 June 2021). 12 CCC (2020), ‘The Sixth Carbon Budget – The UK’s path to Net Zero’ (viewed on 18 June 2021).

Analytical Annex
7
Hydrogen demand
To meet our CB6 and net zero targets, hydrogen demand is likely to increase rapidly over time. In most of the pathways modelled by BEIS for the CB6 impact assessment13, hydrogen demand doubles between 2030 and 2035, and continues to increase rapidly over the 2030s and 2040s. By 2050, 250 – 460 TWh of hydrogen could be needed, delivering 20 – 35% of final energy consumption14. Other pathways to net zero are possible, but these scenarios illustrate the potential scale and rate of increase of hydrogen demand over time.
This section presents potential ranges for hydrogen demand in end use sectors in 2030, 2035 and 2050: these aim to illustrate the potential scale of demand in each sector, and do not represent demand targets or policy positions. The ranges draw on a number of sources, including whole systems energy modelling in the UKTIMES model15 carried out by BEIS for the CB6 impact assessment; modelling of decarbonisation of specific end use sectors; and evidence on the project pipeline gathered through industry engagement. Further detail on how ranges for each sector were estimated can be found in boxes 1-4.
The analysis in this section suggests that hydrogen has a role to play in reaching net zero across a range of sectors. However, there is significant uncertainty around estimates of demand for hydrogen shown throughout this section. The ranges presented illustrate our current understanding of the opportunity presented by hydrogen in each sector, but in most cases do not represent a full range of potential outcomes for hydrogen. Changes in technologies and markets over the next decades could mean there are net zero-consistent scenarios where demand for hydrogen is higher or lower than the ranges presented.
Demand by 2030 Figure 1 below shows an overview of illustrative hydrogen demand across end use sectors in 2030.
13 BEIS (2021), ‘Impact Assessment for the sixth carbon budget’ (viewed on 18 June 2021). 14 Hydrogen as a proportion of final energy consumption in 2050 in agriculture, industry, residential, services and transport sectors. Excludes energy demand for resources, processing and electricity generation. 15 The UKTIMES model is a least-cost optimisation model for the whole UK emissions (including land use) and energy system covering the period 2010 to 2060. Based on input assumptions, the model identifies the least-cost way of meeting a given greenhouse gas emissions reduction trajectory while also meeting assumed demand for energy services. Further detail can be found on pages 26 and 63 (Annex 2) of the CB6 impact assessment.

Analytical Annex
8
Figure 1. Illustrative hydrogen demand in 203016
Source: see boxes for each sector (1-4).
• Industry is likely to be one of the main users of hydrogen in 2030, with the range driven by the availability of hydrogen outside of industrial clusters and the relative cost-effectiveness of hydrogen compared to electrification.
• Hydrogen could play an important role in power, playing a similar role to unabated gas in the generation mix, with range dependent on build out of hydrogen power plants and hydrogen availability and price.
• Hydrogen use for heat in buildings is expected to be low in 2030 due to lead-in times needed to complete safety testing and set up infrastructure, regulations and markets following strategic decisions on heat decarbonisation; demand is expected to be limited to hydrogen heating trials.
• Demand in transport is dependent on the speed of rollout of zero emission vehicles and supporting infrastructure and the relative costs and benefits of hydrogen relative to battery electrification.
In addition to demand in the sectors presented in Figure 1, there is potential for some blending of hydrogen in the gas grid prior to 2030, subject to evidence on the safety and value for money of blending. Blending could offer security for hydrogen production investment decisions by providing a commercial option to sell hydrogen for gas consumer use, up to around 35 TWh per annum by the year 203017. It is unlikely that this maximum potential will be reached, as the actual amount blended will depend on market conditions and how hydrogen
16 Note: figures do not include blending. 17 Assuming gas demand equal to 2019 gas demand, blending 20% on distribution network and 2% on the transmission network, blending maximised every day. This assumes that the delivery principle within the Hydrogen Strategy of blending low carbon hydrogen across the gas distribution networks up to 20% by volume (within safe limits) is maximised. This is consistent with evidence on the amount of blending that is tolerable without needing any alterations to existing gas boilers. We also assume a 2% blend onto the National Transmission System, as proposed by SGN (https://sgn.co.uk/about-us/future-of-gas/hydrogen/aberdeen-vision).
10 - 21
0 - 10
< 1
0 - 6
0
5
10
15
20
25
Industry Power Buildings Transport
TWh
Illustrative Hydrogen Demand Range in 2030

Analytical Annex
9
use evolves across other sectors. As set out in Chapter 2.5 of the Hydrogen Strategy, blending can support initial development of the low carbon hydrogen economy but is not a preferred long-term source of demand.
Demand over the 2030s Across all sectors, hydrogen demand is expected to ramp up significantly in the 2030s in order to meet our CB6 target. Figure 2 shows illustrative hydrogen demand in 2035.
Figure 2. Illustrative hydrogen demand in 2035
Source: see boxes for each sector (1-4).
• Industry, transport and power could all be significant sources of hydrogen demand in 2035, as decarbonisation across sectors accelerates to meet CB6.
• Significant further demand could come from buildings, but this is dependent on strategic decisions on heat decarbonisation: in a scenario where hydrogen is used for heat, appliance conversion is expected to start in the early 2030s.
Demand by 2050 Hydrogen is expected to play a significant role in meeting our target for net zero emissions by 2050. Figure 3 shows how hydrogen demand could be split across end use sectors by 2050.
25 - 45
10 - 300 - 45
20 - 45
0
10
20
30
40
50
Industry Power Buildings Transport
TWh
Illustrative Hydrogen Demand Range in 2035

Analytical Annex
10
Figure 3. Illustrative hydrogen demand in 2050
Source: see boxes for each sector (1-4).
• Hydrogen or hydrogen-based fuels (such as ammonia) are the leading option for decarbonisation of sectors that cannot be easily electrified, including shipping and some industrial processes.
• Demand for hydrogen in power is not as high as in other sectors, but hydrogen could play an important role in providing flexible low carbon electricity generation, helping us achieve a fully decarbonised low-cost power sector.
• There is more uncertainty in sectors such as heat, heavy road transport and other industry where there are a number of competing decarbonisation options, and the most cost-effective solution is dependent on how markets develop over the coming decades.
• Hydrogen demand for heat could range from zero in a scenario where heat is mostly electrified, to being the largest source of hydrogen demand if there is widespread use of hydrogen for heat.
25 - 105
25 - 40
0 - 210 75 - 140
0
50
100
150
200
250
Industry Power Buildings Transport
TWh
Illustrative Hydrogen Demand Range in 2050

Analytical Annex
11
Demand by sector
Box 1. Hydrogen demand in industry
Figure 4. Illustrative hydrogen demand in industry Key conclusions:
• Hydrogen will be one of several options to decarbonise industrial fuels including electrification and biofuels. Fuel availability and cost, technical feasibility of switching to hydrogen, and site locations in relation to potential hydrogen and CCUS networks will determine which option is most suitable for different sectors and sites, and hence the hydrogen demand in different industrial sectors.
• Hydrogen could play a significant role in the early decarbonisation of fuels used
on industrial clusters. For sites not on industrial clusters, some demand for hydrogen could be met by local electrolytic production. A larger role for hydrogen is likely in scenarios where it is increasingly available through local and national hydrogen networks.
• A significant proportion of early demand could come from a relatively small number of larger on-cluster sites that could act as ‘pathfinders’ to help foster initial demand.
• Hydrogen demand is expected to increase over time, as developments in technologies and networks mean hydrogen becomes available for a wider range of processes and sites, and as changes in costs including an increasing carbon price incentivise switching to low carbon fuels.
• Analysis for the Industrial Decarbonisation Strategy (IDS)18 suggests sectors consuming the most hydrogen are likely to include: chemicals, iron and steel, refining, paper, other minerals and food and drink.
• The steel sector could create substantial demand for hydrogen from the 2030s if it opts to decarbonise with hydrogen direct reduced iron coupled with electric arc furnace technology.
• Processes using industrial boilers and combined heat and power (CHP) units have the potential to drive the greatest demand and IDS analysis indicates this could represent up to two thirds of demand by 2050.
18 BEIS (2021), ‘Industrial Decarbonisation Strategy’ (viewed on 18 June 2021).
10 - 21
25 - 45
25 - 105
0
20
40
60
80
100
120
2030 2035 2050
TWh
Illustrative Hydrogen Demand Range for Industry

Analytical Annex
12
• IDS analysis also suggests a number of processes are able to opt solely for hydrogen conversion including furnaces for vehicles, non-cement kilns, generators and metal rolling and melting.
Methodology:
• Ranges based on BEIS analysis for the Industrial Decarbonisation Strategy (IDS) and CB6 impact assessment.
• IDS analysis is based on two scenarios: first where hydrogen availability is limited to industrial clusters and second where it becomes increasingly available at dispersed sites through national hydrogen networks. Analysis considers where hydrogen is the most cost-effective option to decarbonise, with assumptions for the availability of hydrogen and the cost of using it compared to alternatives technologies.
• IDS analysis is supplemented with CB6 analysis which has a different definition of ‘industry’ that includes non-road mobile machinery and excludes energy for industrial buildings.
• Range shows a set of plausible pathways to net zero, but does not represent a maximum or minimum conceivable demand for hydrogen in industry. Ranges for demand will change as our understanding of relevant technologies and industries develops.

Analytical Annex
13
Box 2. Hydrogen demand in power
Figure 5. Illustrative hydrogen demand in power
Key conclusions:
• Hydrogen is likely to play an important role in flexible electricity generation as we move towards net zero, providing a low carbon option for meeting peak demand.
• Hydrogen could play a role in the power sector in 2030, with some early deployment possible in the 2020s. This could include turbines using 100% hydrogen or blends of hydrogen and natural gas.
• Demand for hydrogen in the power sector is expected to increase in the
2030s, contributing to power sector decarbonisation and helping to achieve CB6 and net zero.
• As set out in chapter 2, there are a range of barriers to hydrogen uptake in end use sectors: while the strategy sets out a number of actions we will take to address these barriers and enable hydrogen use in power, there remains uncertainty around when and how much hydrogen could be available to the power sector in the CB6 period. To ensure we are able to meet our stretching CB6 target and maintain optionality, hydrogen in power will need to be developed alongside rapid deployment of other low carbon generation.
• Demand for hydrogen in power depends on overall and peak electricity demand levels, and the relative costs and benefits of hydrogen compared to other low carbon flexible generation technologies. It also depends on the mix of technologies in the power sector, for example a system with a higher share of renewables could need more hydrogen to address intermittency but could also use otherwise curtailed energy to produce hydrogen, while a system with more flexibility through demand side response, storage and interconnectors could be less dependent on hydrogen for both system balancing and meeting peak demand.
• If hydrogen is available, the power sector could achieve lower emissions at lower cost than scenarios without hydrogen. It is possible that hydrogen could reduce the requirement for other generation and reduce overall system costs, because hydrogen is assumed to operate with flexibility. The extent of the impact is dependent on the quantity and cost of hydrogen available for generating electricity.
0 - 10
10 - 30
25 - 40
0
5
10
15
20
25
30
35
40
45
2030 2035 2050
TWh
Illustrative Hydrogen Demand Range for Power

Analytical Annex
14
Methodology:
• 2050 range based on BEIS CB6 impact assessment analysis. Scenarios look at impact of technology availability and performance and resource conditions.
• 2030 and 2035 ranges supplemented with evidence on pipeline of hydrogen projects gathered through industry engagement.
• Evidence on impact of having hydrogen available in the power sector is based on the ‘Modelling 2050: electricity system analysis’ published alongside the Energy White Paper19. Further detail can be found in section 4.1 of the report.
19 BEIS (2020), ‘Modelling 2050: electricity system analysis’ (viewed on 18 June 2021).

Analytical Annex
15
Box 3. Hydrogen demand in buildings
Figure 6. Illustrative hydrogen demand in buildings
Key conclusions:
• Hydrogen demand in buildings is highly uncertain and dependent on strategic decisions on the role of hydrogen relative to electrification in heat.
• Demand for hydrogen for heat in buildings in 2030 is expected to be small. A programme of testing and trials is planned in the 2020s to inform strategic decisions on heat decarbonisation. If this programme concludes hydrogen has a role to play in heat, market and regulatory frameworks will need to be set up and infrastructure will
need to be rolled out. These are unlikely to be in place by 2030, so demand for hydrogen for heat outside of trials is expected to be low.
• In a scenario where hydrogen is used for heat, conversion of the gas grid and appliances to hydrogen is expected to start in the early 2030s, so the potential demand for hydrogen for heat in buildings in 2035 will be highly dependent on the timing and speed of this conversion. Given that 2035 represents an early stage of hydrogen deployment for heat we would not expect deployment in this period to strongly determine the range of potential demand in 2050.
• There is a wide range for demand in 2050, driven by uncertainty around the cost and performance of hydrogen relative to electrification of heat. The high scenario assumes widespread use of hydrogen for heat, while the low scenario assumes heat is fully electrified. There could be scenarios in between the high and low ranges where a mixture of hydrogen and electrification are deployed, for example where there are regional differences or where hybrid heating systems are used.
• There are potential scenarios with higher demand for hydrogen for heat, for example where hydrogen is used more widely in existing buildings on the gas grid. However, as flagged by the CCC in their CB6 advice, such scenarios may face challenges around residual emissions from increased use of methane reformation with CCUS to meet the demand, which could increase overall system costs.
Methodology:
• ‘Buildings’ covers both domestic and non-domestic buildings.
• 2030 demand is from trials only, including the potential hydrogen town pilot. Range does not include blending (see page 8).
< 1 0 - 45
0 - 210
0
50
100
150
200
250
2030 2035 2050
TWh
Illustrative Hydrogen Demand Range for Buildings

Analytical Annex
16
• 2035 demand based on the CCC’s analysis for their CB6 advice: high scenario uses hydrogen demand for buildings from the ‘Headwinds’ scenario, assuming grid conversion radiates out from industrial clusters. Low scenario assumes heat is fully electrified.
• 2050 demand based on BEIS CB6 analysis: high scenario assumes most existing homes on gas grid are converted to hydrogen boilers, except for segments of the housing stock where alternatives (e.g. heat pumps, heat networks) are potentially more cost-effective. Also assumes gas consumption in non-domestic buildings not covered by existing decarbonisation policies is replaced by hydrogen. Low scenario assumes heat is fully electrified.

Analytical Annex
17
Box 4. Hydrogen demand in transport
Figure 7. Illustrative hydrogen demand in transport
Key conclusions:
• In general, hydrogen and hydrogen-based fuels become more competitive with current battery electrification technology as vehicles get larger and travel longer distances, as hydrogen vehicles have higher energy density, longer range and/or faster refuelling times than battery electric vehicles. Subject to funding, there are trials planned across a range of transport modes in the 2020s that will improve our understanding of the role of hydrogen in transport (see Chapter 2.4.4 of the hydrogen strategy for detail).
• There is uncertainty around demand from HGVs, buses and rail, driven by uncertainty around the costs and benefits of hydrogen relative to battery electrification. Demand in 2030 and 2035 is also dependent on the rollout rate of heavy duty zero emission vehicles, which is expected to accelerate in the 2030s.
• It is estimated that the demand for hydrogen-based fuels from shipping could start ramping up significantly between 2030 and 2035. By 2050, it is estimated that there could be 75 – 95 TWh of demand for hydrogen-based fuels (principally in the form of ammonia) from UK domestic shipping and UK international shipping. However, these estimates do not reflect the full range of uncertainty. It is also important to note that hydrogen-based fuels used by UK shipping may not all be purchased in the UK.
• If it proves feasible and cost-effective, hydrogen use in aviation could be a significant additional source of demand, either through hydrogen planes which could be available in the long term, or hydrogen-based sustainable aviation fuels (SAF) in the nearer term. The Clean Sky 2 report20 suggests that by 2050 an average regional airport could need around 0.75 TWh of liquid hydrogen per year, and an average large hub airport would need around 7.5 TWh of liquid hydrogen per year, which is significant in the context of our range of 75 – 140 TWh from all other transport modes.
• The ranges do not include any hydrogen used in cars or vans, so demand could be higher than shown if some hydrogen does end up being used in a significant number of cars or vans.
20 Clean Sky 2 (2020), ‘Hydrogen-powered aviation’ (viewed on 18 June 2021).
0 - 6
20 - 45
75 - 140
0
20
40
60
80
100
120
140
160
2030 2035 2050
TWh
Illustrative Hydrogen Demand Range for Transport
Analytical Annex
18
Methodology:
• The estimated demand for hydrogen in HGVs, buses and rail is based on analysis by the Department for Transport (DfT) for the Transport Decarbonisation Plan21. Ranges reflect different assumptions on how the costs of hydrogen and other decarbonisation options will develop.
• The estimated demand for hydrogen-based fuels in shipping is based on research commissioned by DfT22, covering UK domestic shipping and UK international shipping23. The range for shipping reflects different levels of ambition for reducing the greenhouse gas emissions from international shipping24.
• No hydrogen use is modelled in aviation due to the relative immaturity of technology and lack of modelling to date. Illustrative estimates of hydrogen demand for an airport are based on the Clean Sky 2 report.
• No hydrogen use is modelled in cars or vans as current evidence suggests battery electrification is likely to be the preferred vehicle technology and the lowest cost route to zero emissions for cars and vans.
21 Department for Transport (2021), ‘Decarbonising transport: a better, greener Britain’ (viewed on 19 July 2021). 22 UMAS, E4Tech, Frontier Economics, CE Delft (2019), ‘Reducing the Maritime Sector’s Contribution to Climate Change and Air Pollution. Scenario Analysis: Take-up of Emissions Reduction Options and their Impacts on Emissions and Costs. A Report for the Department for Transport’ (viewed on 18 June 2021). 23 Based on the definition of UK international shipping that was adopted in the research above, the estimates for UK international shipping represent the potential hydrogen demand associated with the international shipping activity that transports UK imports. Other definitions of UK international shipping would result in different estimates. 24 Scenarios D and E from the research above have been used for UK international shipping. Scenario D has also been used for UK domestic shipping.

Analytical Annex
19
Hydrogen supply
2030 ambition The Government’s Ten Point Plan for a Green Industrial Revolution25 set out that, working with industry, the UK is aiming for 5GW of low carbon hydrogen production capacity by 2030, with a hope to see 1GW of hydrogen production capacity by 2025, putting us on a credible trajectory that aligns with a pathway to Carbon Budget 6 and Net Zero. Our analysis suggests that a 2030 5GW ambition is stretching but feasible. The ambition was informed by engagement with industry to understand the characteristics of both CCUS-enabled methane reformation and electrolytic hydrogen production projects in the pipeline. Based on the information provided we developed deployment scenarios. We then compared the scenarios against a variety of constraints, including technical certainty; demand readiness and availability; carbon capture, transport and storage readiness and availability; low cost and low carbon electricity availability; realistic build rates allowing learning benefits to be captured; and potential costs. This assessment, together with a consideration of other countries’ ambitions, led us to a 5GW ambition by 2030, consisting of both CCUS-enabled methane reformation and electrolytic hydrogen production projects. The mix of hydrogen production technologies making up supply in 2030 is dependent on a range of factors set out in the next section.
The success of the ambition will be judged in part by the decarbonisation it delivers through use of hydrogen in end use sectors. As such there is significant interdependency between the 5GW ambition and the demand for low carbon hydrogen. Delivering 5GW of low carbon hydrogen is dependent on stretching deployment rates being achieved across end use sectors, reaching near the top end of the ranges presented in the previous section.
Supply beyond 2030 As set out in the previous section, hydrogen demand is expected to increase rapidly over the 2030s and 2040s, so to ensure supply can meet demand, hydrogen production capacity will have to increase correspondingly. To meet the demand estimates presented above, hydrogen production capacity would have to increase from 5 GW in 2030 to 7 – 20 GW in 2035 and 15 – 60 GW in 2050 if plants run at a 95% load factor. In practice, plants may run at lower load factors, requiring even higher hydrogen production capacity to be installed.
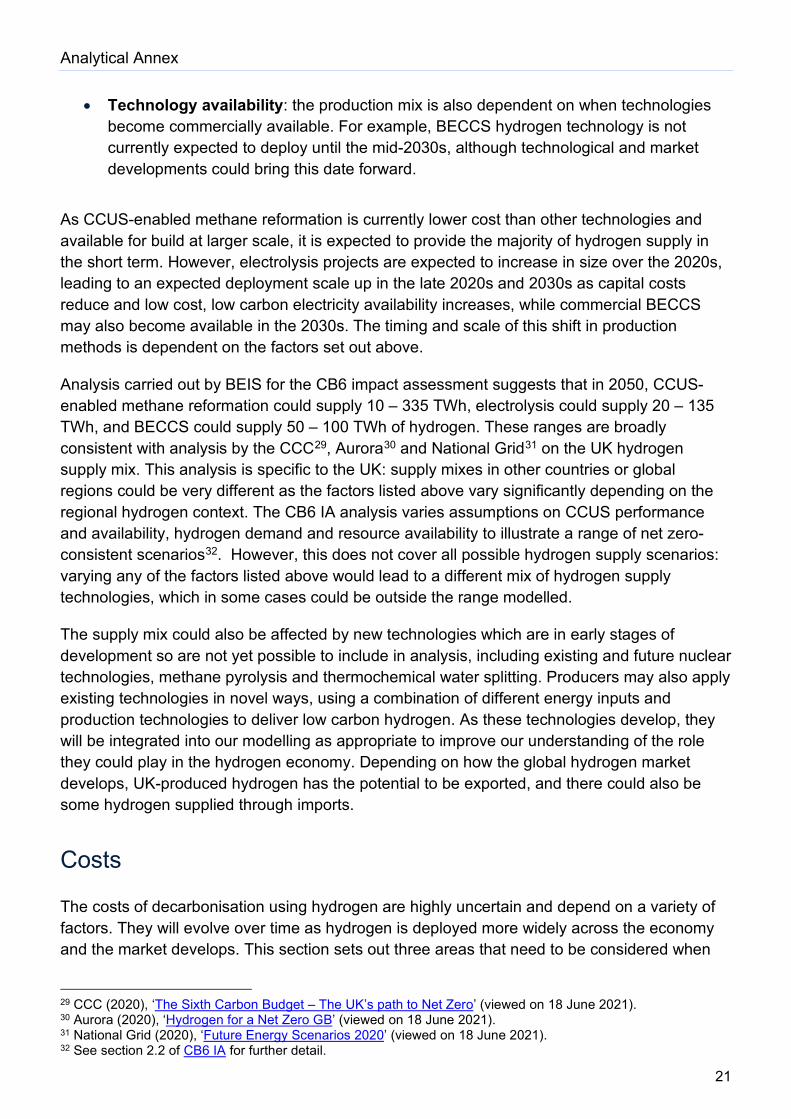
Analysis done by BEIS for the CB6 impact assessment26 suggests that in 2050, hydrogen produced in the UK could be supplied through a mix of methane reformation with CCS, electrolysis from renewable electricity, and biomass gasification with CCS (BECCS); this conclusion is supported by the CCC’s CB6 advice27. However, there is significant uncertainty around how hydrogen will be supplied over time: the proportion of hydrogen supplied by each technology depends on a range of assumptions around hydrogen production technologies and the wider energy system, including:
25 HM Government (2020), ‘The Ten Point Plan for a Green Industrial Revolution’ (viewed on 18 June 2021). 26 BEIS (2021), ‘Impact Assessment for the sixth carbon budget’ (viewed on 18 June 2021). 27 CCC (2020), ‘The Sixth Carbon Budget – The UK’s path to Net Zero’ (viewed on 18 June 2021).

Analytical Annex
20
• Relative cost and performance of each production technology: the mix of production technologies depends on the capital and operating costs of each technology, the efficiency of production processes, and the rate at which costs decrease and performance improves over time. The Hydrogen Production Cost 2021 report28 sets out our current evidence on the levelised cost of hydrogen production for different technologies, including sensitivity analysis which shows how levelised costs are affected by varying assumptions on fuel and electricity prices, capital and operating costs, efficiencies and load factors. Importantly, the report notes that the evidence base is fast moving and that we are seeking stakeholder views on the continued relevance of it. It also explains that further sensitivities are possible and therefore the range of results might be wider. The report highlights that it takes a simplistic, illustrative approach to technology configurations: for example, electrolysis either uses grid, dedicated or curtailed electricity sources, when in reality combinations of these are possible. The report suggests that CCUS-enabled methane reformation is currently the lowest cost hydrogen production technology, but over time, electrolysis costs are expected to decrease and in some cases become cost-competitive with CCUS-enabled methane reformation as early as from 2025 onwards. BECCS is relatively high cost, but costs fall rapidly when the value of negative emissions are included. Box 7 in chapter 3 gives more detail on costs of different production technologies, and further detail can be found in chapters 6 and 7 of the Hydrogen Production Cost report.
• CCUS performance: deployment of hydrogen produced via methane reformation depends on carbon capture rates, as residual emissions from CCUS-enabled hydrogen production need to be offset by removals elsewhere in the energy system. Higher capture rates reduce residual emissions, and hence the cost of offsetting these residual emissions; this could lead to higher deployment of CCUS-enabled methane reformation.
• Availability of low-cost and low carbon electricity: deployment of electrolytic hydrogen depends on availability of low-cost electricity. Power sector scenarios with a higher share of renewables could support more electrolysis, as electrolysers can use electricity that would have otherwise been curtailed to produce hydrogen at low cost and low emissions intensity.
• Availability of sustainable biomass: deployment of BECCS for hydrogen production depends on the overall availability of biomass in the economy, and the relative benefits of using biomass in hydrogen production relative to use in other sectors such as industry and electricity generation.
• Scale of hydrogen demand: the constraints on availability of biomass and low-cost electricity limit the amount of low-cost and low carbon hydrogen that can be produced by BECCS and electrolysis, so additional demand above this level is likely to be met by hydrogen production via CCUS-enabled methane reformation. Scenarios with very high hydrogen demand could therefore have a higher proportion of CCUS-enabled methane reformation.
28 BEIS (2021), ‘Hydrogen Production Cost 2021’ (viewed in July 2021).
Analytical Annex
21
• Technology availability: the production mix is also dependent on when technologies become commercially available. For example, BECCS hydrogen technology is not currently expected to deploy until the mid-2030s, although technological and market developments could bring this date forward.
As CCUS-enabled methane reformation is currently lower cost than other technologies and available for build at larger scale, it is expected to provide the majority of hydrogen supply in the short term. However, electrolysis projects are expected to increase in size over the 2020s, leading to an expected deployment scale up in the late 2020s and 2030s as capital costs reduce and low cost, low carbon electricity availability increases, while commercial BECCS may also become available in the 2030s. The timing and scale of this shift in production methods is dependent on the factors set out above.
Analysis carried out by BEIS for the CB6 impact assessment suggests that in 2050, CCUS-enabled methane reformation could supply 10 – 335 TWh, electrolysis could supply 20 – 135 TWh, and BECCS could supply 50 – 100 TWh of hydrogen. These ranges are broadly consistent with analysis by the CCC29, Aurora30 and National Grid31 on the UK hydrogen supply mix. This analysis is specific to the UK: supply mixes in other countries or global regions could be very different as the factors listed above vary significantly depending on the regional hydrogen context. The CB6 IA analysis varies assumptions on CCUS performance and availability, hydrogen demand and resource availability to illustrate a range of net zero-consistent scenarios32. However, this does not cover all possible hydrogen supply scenarios: varying any of the factors listed above would lead to a different mix of hydrogen supply technologies, which in some cases could be outside the range modelled.
The supply mix could also be affected by new technologies which are in early stages of development so are not yet possible to include in analysis, including existing and future nuclear technologies, methane pyrolysis and thermochemical water splitting. Producers may also apply existing technologies in novel ways, using a combination of different energy inputs and production technologies to deliver low carbon hydrogen. As these technologies develop, they will be integrated into our modelling as appropriate to improve our understanding of the role they could play in the hydrogen economy. Depending on how the global hydrogen market develops, UK-produced hydrogen has the potential to be exported, and there could also be some hydrogen supplied through imports.
Costs
The costs of decarbonisation using hydrogen are highly uncertain and depend on a variety of factors. They will evolve over time as hydrogen is deployed more widely across the economy and the market develops. This section sets out three areas that need to be considered when
29 CCC (2020), ‘The Sixth Carbon Budget – The UK’s path to Net Zero’ (viewed on 18 June 2021). 30 Aurora (2020), ‘Hydrogen for a Net Zero GB’ (viewed on 18 June 2021). 31 National Grid (2020), ‘Future Energy Scenarios 2020’ (viewed on 18 June 2021). 32 See section 2.2 of CB6 IA for further detail.

Analytical Annex
22
thinking about the costs of hydrogen, and some key factors that influence these costs. More detailed analysis on costs will be conducted as policies to develop the hydrogen economy are rolled out.
The relative costs of hydrogen’s role in decarbonising the UK economy depend on the cost of using hydrogen itself, but also on the relative cost of hydrogen compared to counterfactual fuels and alternative decarbonisation options, as shown in Figure 8 and detailed below.
Figure 8. Key aspects of the cost of hydrogen decarbonisation
Cost of using hydrogen
The first key component of the relative cost of decarbonisation using hydrogen is the absolute cost of using hydrogen, including the cost of hydrogen production, distribution, transmission and storage, as well as the cost of converting or replacing equipment to use hydrogen. Chapter 2 gives some detail on cost barriers across the value chain. The Hydrogen Production Cost 2021 report33 provides more detail on the levelised cost of hydrogen production using different production methods and the factors that influence this, including fuel and electricity prices, capital and operating costs, efficiencies and load factors. Costs can also be affected by location and developments in the energy system, for example the mix of technologies deployed in the power sector. The costs of hydrogen equipment vary depending on the end use sector and application.
33 BEIS (2021), ‘Hydrogen Production Cost 2021’ (viewed in July 2021).
Analytical Annex
23
Cost of counterfactual
As well as the absolute cost of using hydrogen, it is important to think about the cost of the energy vector being used currently, as this will determine the additional cost of hydrogen relative to the counterfactual. The counterfactual fuel varies depending on the end use sector and application: in many cases hydrogen will replace natural gas, but it could replace a range of other fuels, for example petrol, diesel, fuel oil or kerosene in transport applications. As well as fuel costs, counterfactual costs can also include taxes, charges, and policy costs such as carbon prices under the UK Emissions Trading Scheme. There is significant uncertainty around how all of these costs will change in future. Figure 14 in chapter 3 illustrates how costs vary across some different counterfactual fuels.
Cost of alternative decarbonisation options
Finally, the cost of hydrogen should be considered alongside the cost of other options for decarbonising a specific sector or application, including capital, fuel and operating costs. As set out in boxes 1 – 4, one of the key drivers of the ranges in hydrogen demand is the relative cost of hydrogen compared to other decarbonisation options such as electrification, CCUS or biofuels. The cost and feasibility of alternative options varies depending on the sector and application, as well as by location and developments in the wider UK energy system. In some sectors hydrogen is the leading option: for example, in shipping, hydrogen-based fuels are currently the leading option as the available evidence suggests that electrification is only expected to be competitive under limited circumstances. For other uses such as many industrial processes, HGVs, rail and buses, hydrogen competes with alternative options and it is not yet clear which technology will be most cost-effective.
Analytical Annex
24
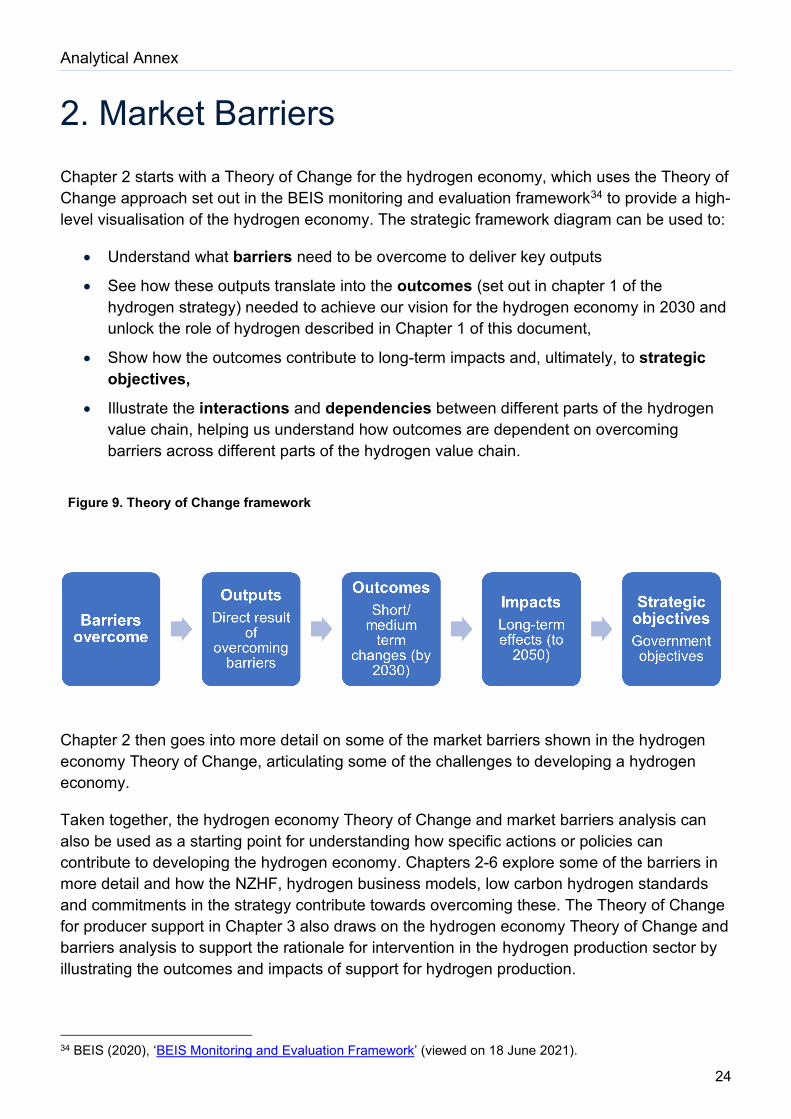
2. Market Barriers Chapter 2 starts with a Theory of Change for the hydrogen economy, which uses the Theory of Change approach set out in the BEIS monitoring and evaluation framework34 to provide a high-level visualisation of the hydrogen economy. The strategic framework diagram can be used to:
• Understand what barriers need to be overcome to deliver key outputs
• See how these outputs translate into the outcomes (set out in chapter 1 of the hydrogen strategy) needed to achieve our vision for the hydrogen economy in 2030 and unlock the role of hydrogen described in Chapter 1 of this document,
• Show how the outcomes contribute to long-term impacts and, ultimately, to strategic objectives,
• Illustrate the interactions and dependencies between different parts of the hydrogen value chain, helping us understand how outcomes are dependent on overcoming barriers across different parts of the hydrogen value chain.
Figure 9. Theory of Change framework
Chapter 2 then goes into more detail on some of the market barriers shown in the hydrogen economy Theory of Change, articulating some of the challenges to developing a hydrogen economy.
Taken together, the hydrogen economy Theory of Change and market barriers analysis can also be used as a starting point for understanding how specific actions or policies can contribute to developing the hydrogen economy. Chapters 2-6 explore some of the barriers in more detail and how the NZHF, hydrogen business models, low carbon hydrogen standards and commitments in the strategy contribute towards overcoming these. The Theory of Change for producer support in Chapter 3 also draws on the hydrogen economy Theory of Change and barriers analysis to support the rationale for intervention in the hydrogen production sector by illustrating the outcomes and impacts of support for hydrogen production.
34 BEIS (2020), ‘BEIS Monitoring and Evaluation Framework’ (viewed on 18 June 2021).

Analytical Annex
25
Chapter 5 of the Hydrogen Strategy sets out how we will track our progress against the outcomes, with potential indicators and metrics shown in Table 5.1.
The hydrogen economy Theory of Change and market barriers analysis are static, representing the key barriers to delivering the outcomes we want in 2030. The hydrogen economy will develop over time, as detailed in the 2020s roadmap in chapter 2 of the Hydrogen Strategy; for example, we would expect the number of end users for a typical hydrogen production project to increase over time. The desired outcomes will therefore evolve, and hence the barriers and their relative importance will change. The Theory of Change will be kept under review to reflect these developments.
Hydrogen Economy Theory of Change
The diagram in Figure 10 uses the Theory of Change framework shown in Figure 9 to show the outputs, outcomes and impacts of addressing specific barriers to low carbon hydrogen uptake across the value chain, and how these feed into the strategic objectives.

Analytical Annex
26
Figure 10. Hydrogen economy theory of change
Analytical Annex
27
Market barriers
This section provides some further detail on some of the barriers to achieving the capabilities set out in the hydrogen economy Theory of Change, in particular those relating to hydrogen production, demand, and transmission, distribution and storage infrastructure. These barriers are linked to market failures, where the free market results in outcomes that are not optimal at a societal level, but also consider some wider constraints currently holding back the development of a low carbon hydrogen system. Looking at barriers allows us to consider the full range of challenges to establishing a hydrogen economy. However, we also present how the barriers are underpinned by market failures to show where government intervention could be needed. Market failures are defined and mapped against barriers in Table 1.
Across all parts of the value chain, there are some common barriers, including high relative cost, risk, policy and regulatory uncertainty, safety testing, lack of market structure, and interdependencies with other parts of the value chain. However, the barriers affect each part of the value chain in different ways, which are explained further in the rest of this chapter.
As noted above, this section focusses on the key barriers to hydrogen deployment in the 2020s, but as the hydrogen economy develops and some outcomes are achieved, the barriers are likely to evolve, particularly as growth of hydrogen economy continues post- 2030.
Production barriers
The key market barriers to the production of low carbon hydrogen are summarised below. These barriers are explored in further detail in Chapter 3.
• Production cost: the cost of low carbon hydrogen is higher than most high-carbon fuel alternatives. The lack of a fully developed market, imperfect information and the presence of a negative externality linked to carbon (see Table 1 below for more detail) all contribute to the lack of cost competitiveness. On the one hand, this is due to the relative immaturity of low carbon hydrogen production technologies. Whilst this disadvantage might fall away over time, in the short-term, not only will hydrogen need to compete against cheaper alternatives for end users such as electricity, natural gas or biomass, but it will also rely on them for production inputs. This will generate efficiency losses, which are avoided when end use sectors directly use these alternatives. On the other hand, the high carbon alternatives have a cost advantage as their price does not capture the full societal cost of carbon they generate. UK carbon pricing policy (primarily the UK Emissions Trading Scheme (ETS)) addresses this by requiring businesses within scope to pay a price for every tonne of CO2 equivalent emitted. However, the scope of the UK ETS does not currently include all sectors of the economy where low carbon hydrogen potentially has value; and for sectors within scope, low carbon hydrogen is not yet competitive as an abatement option in the ETS market.
• Technological and commercial risk: there are considerable technological and commercial uncertainties and risks associated with developing low carbon hydrogen production projects, which are more acute for the earliest projects. Low carbon

Analytical Annex
28
hydrogen production technologies are risky for investors as they have not been proven at a commercial scale in the UK: this reflects market failures including nascent markets and imperfect information. There is a first mover disadvantage, where project developers for the first hydrogen production projects bear significant learning costs and risks but may not capture the full benefits of the investment, as market competitors capture their know-how.
• Demand uncertainty: as there is currently very limited use of low carbon hydrogen in the UK, its producers have no certainty if their supply will be matched by market demand. This could lead to the producers having to sell at low prices or build-up stocks and could pose a risk to the economic viability of the project. There are significant barriers to hydrogen use which contribute to this demand uncertainty, which are set out below. Once again, the market failures at play here are related to the market’s immaturity (nascent market) but also to coordination failures.
• Lack of market structure: there is currently no regulated market for low carbon hydrogen. In the short term, where suppliers are likely to be dependent on a small number of end users to buy their hydrogen (oligopsony), an unregulated market could risk abuse of market power by end users of hydrogen. This could lead to producers having to accept low prices or unfavourable conditions for selling their hydrogen, risking the profitability of the project.
• Distribution and storage barriers: coordination failures might lead to suboptimal market outcomes (e.g. undersupply) as lack of investment in one section of the market deters investment elsewhere. To facilitate sales, hydrogen production plants require infrastructure to transport hydrogen to the end users. They may also need hydrogen storage infrastructure to help balance hydrogen supply and demand, for example where offtakers have a variable demand profile. Insufficient investment in the infrastructure will limit entries on the production side. Equally, early infrastructure that is not sufficiently future-proofed (i.e. not ready to accommodate future expansion in production capacity) might limit market entry in the medium to long term. Barriers to distribution and storage are set out below.
• Policy and regulatory uncertainty: the lack of a clear and consistent long-term policy and regulatory framework for low carbon hydrogen deters investors as it adds risk to the investment process. Once again, this is linked to the immature market (nascent market & imperfect information). Investors may not have the information available to fully consider the implications of the 2050 net zero target when making investment decisions, and may also perceive a high risk of stranded assets if subsequent policy and regulatory decisions markedly change the operating environment for their chosen technologies (e.g. if policy framework is in development but not yet finalised). Hydrogen also sits within a broad and complex regulatory landscape, which can sometimes create barriers to hydrogen production: for example, Orkney Hydrogen Strategy 2019 cites regulatory barriers related to grid connections as one of the obstacles to implementation of

Analytical Annex
29
hydrogen into islands’ energy systems.35 Further detail on the regulatory framework can be found in Section 2.5 of the hydrogen strategy.
Demand barriers
There are also a range of barriers to hydrogen end use. These barriers broadly apply to new users across all end use sectors, but the relative importance of each barrier and the extent to which they prevent hydrogen uptake varies depending on the end use sector. Crucially, for the market to emerge all the relevant barriers will have to be addressed in a coordinated way.
• User cost: similarly to the producer side, hydrogen demand is affected by the issues related to nascent markets, imperfect information and negative externalities from high carbon fuels. As set out above, the cost of low carbon hydrogen is higher than fossil fuels or high carbon hydrogen, so hydrogen can be more expensive for users than high carbon alternatives. In addition, users will face up-front costs of transitioning to hydrogen, including investment in new equipment, such as boilers or fuel cells: these can be more expensive than conventional equipment as they do not benefit from economies of scale or mature supply chains. There can also be switching costs associated with changing to a new system.
• Technological and commercial risk: there is significant risk associated with switching to low carbon hydrogen as most technologies have not yet been commercially demonstrated. The market might fail to deliver optimal results due to its immaturity, imperfect information, and the fact there is a first mover disadvantage as the earliest users of hydrogen will bear learning costs and risks which create benefits captured by subsequent users.
• Supply uncertainty: there is currently no commercially available low carbon hydrogen in the UK, so potential users of hydrogen cannot be sure they will have a secure supply. Disruption in supply could have negative impacts on business, for example if an industrial process is unable to run, so supply uncertainty could deter end users from switching to hydrogen. This is an example of a suboptimal equilibrium where market growth requires sufficient number of participants to enter at the same time (coordination) but where the supply risks deter new entrants.
• Lack of market structure: in the short term, end users of hydrogen may be more likely to be dependent on a small number of suppliers (oligopoly). Lack of a regulated market (nascent market) could lead to abuse of market power by suppliers, which could lead to high prices for hydrogen.
• Distribution and storage barriers: markets can fail to deliver optimal results when there is insufficient coordination. Hydrogen end use requires infrastructure to transport hydrogen from the production facility to the end users, and for many end uses will also require hydrogen storage facilities. There is also some uncertainty whether the emerging infrastructure will be sufficiently future-proofed, i.e. able to accommodate new
35 Energy of Orkney (2019), ‘Orkney Hydrogen Strategy’ (viewed on 18 June 2021).

Analytical Annex
30
demand in the medium to long term. Barriers to distribution and storage are set out below.
• Policy and regulatory uncertainty: the current lack of a long-term policy and regulatory framework for low carbon hydrogen, resulting from the nascent character of the market, could deter investors from switching to hydrogen. Users face uncertainty in cases where policy framework is in development but not yet finalised and, as hydrogen sits within a complex regulatory framework, emerging regulations in related areas (e.g. energy market regulations) might affect the low carbon hydrogen market (see section 2.5 of hydrogen strategy).
• Safety and feasibility testing: as the market for hydrogen is still emerging, the safety and technical case for low carbon hydrogen use at scale has not been established for many end uses, and low carbon hydrogen use has not been demonstrated at commercial scale.
• Consumer awareness and acceptance: as low carbon hydrogen is an emerging technology in a nascent market, consumers may not be aware of the option of using it, or may not be willing to do so.
Transmission, distribution and storage infrastructure barriers
There is currently limited transmission, distribution and storage infrastructure for hydrogen, as hydrogen use is small-scale and the hydrogen is often produced and used in the same location. Transmission and distribution include both pipeline and non-pipeline (e.g. through road transport) distribution methods, as well as the potential for blending into the gas grid. Storage covers above ground vessels, underground storage, and the infrastructure allowing, for example, pressurisation, liquification or conversion to so called ‘hydrogen carriers’ (e.g. ammonia). There are a range of barriers to infrastructure being established:
• Supply and demand uncertainty: there is a risk of coordination failure if hydrogen infrastructure built to support early deployment is not suitable for wider rollout of hydrogen. There is uncertainty around the scale and location of hydrogen supply and demand, and hence the size and location of distribution and storage infrastructure required. This could lead to stranded assets. That said, in practice we do expect initial pipelines to be built in the industrial clusters and expand out from there.
• Cost and funding uncertainty: due to the nascent market, there is a lack of clarity on the commercial frameworks and ownership structures that will apply to building and operating distribution and storage infrastructure. There is also a first mover disadvantage as the earliest developers of infrastructure bear significant risks and costs.
• Lack of market structure: as the market for low carbon hydrogen is still emerging it is unclear how it will be structured and regulated.
• Regulatory uncertainty: there is currently no established regulatory framework for hydrogen distribution and storage (nascent market & imperfect information) and this might impede required investment. Private connections are exempt from regulations

Analytical Annex
31
covering existing gas infrastructure, but it is not clear at what point networks will stop being considered private and start to be regulated. Further detail on the regulatory framework can be found in section 2.5 of the hydrogen strategy.
• Safety and feasibility testing: outside of current industrial uses, distribution and storage of hydrogen has not been fully safety tested at scale, and it is not clear what purity standards are required for hydrogen distributed in pipelines to be used by different end users (nascent market & imperfect information). This also applies to blending, where the safety profile and commercial feasibility are still being established.
Market failures
Table 1 below summarises how the barriers identified in the previous sections map onto the market failures most relevant for hydrogen adoption. Market failures and barriers provide two alternative ways of conceptualising the obstacles for hydrogen roll-out.

Analytical Annex
32
Table 1. Market failures and barriers
Barriers underpinned by market failure
Market failure
Description Production barriers Demand barriers Distribution and storage barriers
Nascent markets & imperfect information
Market mechanisms can fail to support emerging technologies due to:
a) competitive disadvantage relative to mature technologies, b) uncertainties surrounding new technologies (e.g. around future demand, regulations, etc.); c) immature markets leading to inefficient outcomes (e.g. excessive market concentration).
Production cost; Technological and commercial risk; Demand uncertainty; Lack of market structure; Policy and regulatory uncertainty.
User cost; Technological and commercial risk; Lack of market structure; Policy and regulatory uncertainty; Safety and feasibility; Consumer awareness and acceptance
Cost and funding uncertainty; Lack of market structure; Regulatory uncertainty; Safety and feasibility testing.
First mover disadvantage
Underinvestment due to early adopters taking significant initial risks but ‘sharing’ benefits with later entrants (knowledge spill-overs).
Technological and commercial risk
Technological and commercial risk
Cost and funding uncertainty
Coordination failure
Lack of coordinated investment across the supply chain can lead to suboptimal market outcomes.
Demand uncertainty; Distribution and storage barriers
Supply uncertainty; Distribution and storage; Consumer awareness and acceptance
Supply and demand uncertainty
Negative externality – social cost of carbon
Low carbon fuels at a competitive disadvantage, due to the social cost of emissions not being captured in the market price for high carbon fuels.
Production cost User cost
Analytical Annex
33
Hydrogen Strategy Commitments
Our 5GW 2030 ambition sets a clear framework to consider what outcomes are needed. We considered the outcomes that were needed to achieve our ambition, taking a systematic approach considering the shape of the current and future hydrogen economy to determine a credible series of 2030 outcomes that we could measure success against and to establish a baseline for achieving CB6.
• Progress towards 2030 ambition: 5GW of low carbon hydrogen production capacity with potential for rapid expansion post 2030; hope to see 1GW production capacity by 2025.
• Decarbonisation of existing UK hydrogen economy: existing hydrogen supply decarbonised through CCUS and/or supplemented by electrolytic hydrogen injection.
• Lower cost of hydrogen production: a decrease in the cost of low carbon hydrogen production driven by learnings from early projects, more mature markets and technology innovation.
• End-to-end hydrogen system with a diverse range of users: end user demand in place across a range of sectors and locations across the UK, with significantly more end users able and willing to switch.
• Increased public awareness: public and consumers are aware of and accept use of hydrogen across the energy system.
• Promote UK economic growth and opportunities, including jobs: established UK capabilities and supply chain that translates into economic benefits, including through exports. UK is an international leader and attractive place for inward investment.
• Emissions reduction under Carbon Budgets 4 and 5: hydrogen makes a material contribution to the UK’s emissions reduction targets, including through setting us on a pathway to achieving CB6.
• Preparation for ramp up beyond 2030 – on a pathway to net zero: requisite hydrogen infrastructure and technologies are in place with potential for expansion. Well established regulatory and market framework in place.
Realising these outcomes means addressing a series of barriers, articulated in the hydrogen economy Theory of Change and in the market barriers section of this chapter. These barriers are focused on key parts of the value chain, and we recognise that there are more specific and detailed set of barriers and challenges that are presented in the main hydrogen strategy, as well as barriers, such as those needed to establish a strong UK supply chain and skills base.
Building on outcome and barrier identification, we then considered what existing commitments are addressing these barriers, and what additional commitments were needed to address them. As set out in chapter 5 of the Hydrogen Strategy, we will monitor our progress towards achieving our outcomes by tracking against a set of key indicators and metrics. Based on our

Analytical Annex
34
review of progress, and with consideration of our principles for government action, we will explore potential further action needed during the 2020s to deliver our 2030 ambition and to support further scale up in line with CB6.
The table below present a ‘flow chart’ articulating our approach to mapping our desired outcomes, barriers and commitments for key parts of the value chain across two of our outcomes by 2030, as a guide for the approach we have taken.
Table 2. Mapping of outcomes, barriers and commitments
Outcomes by 2030 Barriers faced Example commitments
Lower cost of hydrogen production: a decrease in the cost of low carbon hydrogen production driven by learnings from early projects, more mature markets and technology innovation.
Production cost, technology and commercial risk, demand uncertainty
We will work with industry to deliver our ambition for 5GW of low carbon hydrogen production capacity by 2030. In doing so, we would hope to see 1GW production capacity by 2025.
Launch ITT for £60m Low Carbon Hydrogen Supply 2 Expression of Interest which will develop novel hydrogen supply solutions for a growing hydrogen economy.
We will develop further detail on our production strategy and twin track approach including less developed production methods by early 2022.
End-to-end hydrogen system with a diverse range of users: end user demand in place across a range of sectors and locations across the UK, with significantly more end users able and willing to switch.
Production barriers plus:
Lack of market structure, distribution and storage barriers, policy and regulatory uncertainty, safety and feasibility testing of demand
We will undertake a review of hydrogen network requirements for first of a kind and next of a kind projects in the 2020s.
We will undertake a review of likely scenarios for storage need up to and beyond 2030, including its potential role as a critical enabler for some end use sectors.
We will engage with industry later this year on possible requirements for a hydrogen pilot research and innovation facility to support hydrogen use in industry and power.
We will work across Government to highlight the potential role of hydrogen in the future energy system and consider whether and how this should be reflected in the design of wider energy markets and policies (e.g. capacity market, green gas support scheme).
We will continue to work with industry and regulators to consider what regulatory changes may be appropriate across the hydrogen value chain, in line with the commitments made in this Strategy.

Analytical Annex
35
3. Hydrogen Production Support
Introduction
As set out in chapter 1 the low carbon hydrogen market is nascent, and the technology has not yet been commercially demonstrated at scale in the UK. Therefore, to achieve the strategic objectives set out in the Hydrogen Strategy a significant scaling up of low carbon hydrogen production and use is required. While there is a pipeline of privately led projects in development, government support is necessary to help remove significant barriers across the value chain, realise these projects and unlock further market development.
This chapter sets out our rationale for targeting support towards low carbon hydrogen production, based on characteristics of the value chain and further assessment of the market barriers set out in chapter 2. We then consider the types of support that could address the key barriers to production and apply the Theory of Change method to identify their expected contribution to achieving our strategic objectives.
Production technologies
This section summarises our evidence on the technical and economic characteristics of CCUS-enabled and electrolytic hydrogen production technologies to illustrate relative significance and drivers of the barriers that exist for producers.36 As set out in Chapter 1, hydrogen could also be produced using other technologies which are at earlier stages of development.
It is worth first noting that projects go through different phases. The duration, and associated costs and risks, of each phase is different. For example, at the early stages of development (feasibility, pre-FEED, FEED, post-FEED/pre-FID) resolving technological, regulatory and market uncertainties is critical to progressing a project to further stages. Once the feasibility of a project has been established, securing financing and ensuring future revenue stability would be crucial for the engineering, procurement and construction phase to be able to begin. Finally, at the operating phase risks to revenue stability take centre stage.
This means that different types of support might be needed at different points of the project lifecycle (including the need for support potentially tapering off in the operation phase). This is considered further in subsequent sections.
36 BEIS (2021), ‘Hydrogen Production Cost 2021’ (viewed in July 2021).
Analytical Annex
36
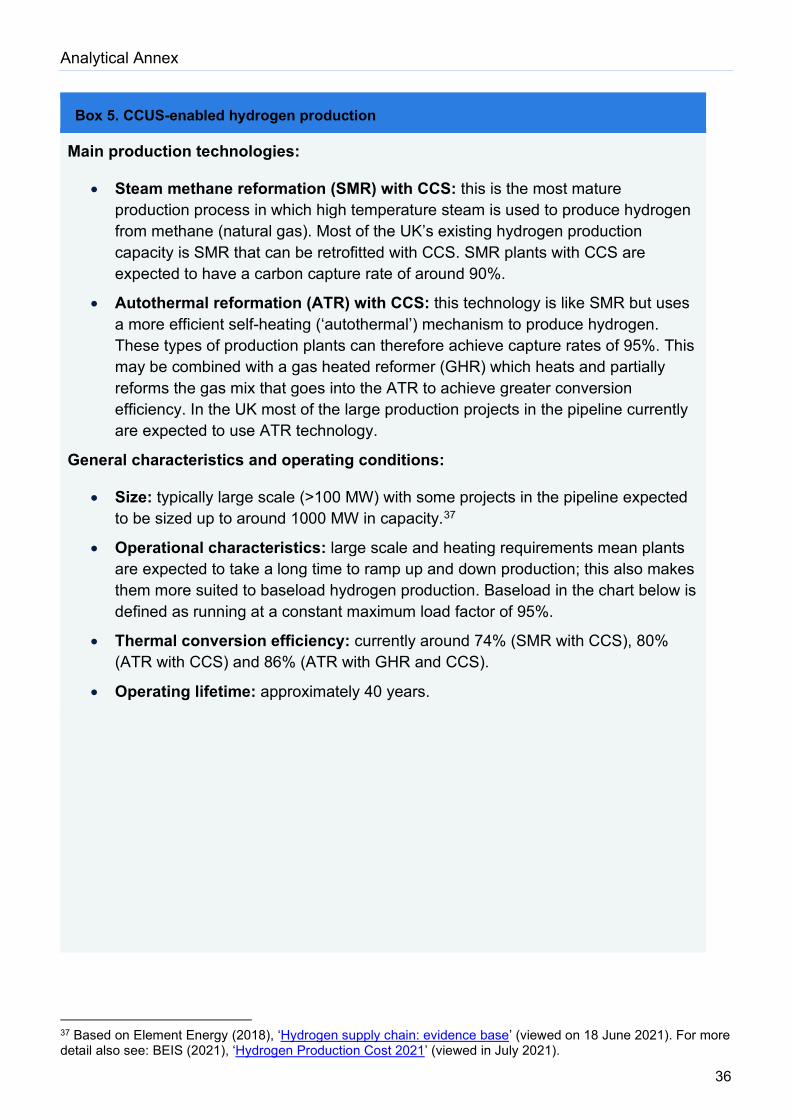
Box 5. CCUS-enabled hydrogen production
Main production technologies:
• Steam methane reformation (SMR) with CCS: this is the most mature production process in which high temperature steam is used to produce hydrogen from methane (natural gas). Most of the UK’s existing hydrogen production capacity is SMR that can be retrofitted with CCS. SMR plants with CCS are expected to have a carbon capture rate of around 90%.
• Autothermal reformation (ATR) with CCS: this technology is like SMR but uses a more efficient self-heating (‘autothermal’) mechanism to produce hydrogen. These types of production plants can therefore achieve capture rates of 95%. This may be combined with a gas heated reformer (GHR) which heats and partially reforms the gas mix that goes into the ATR to achieve greater conversion efficiency. In the UK most of the large production projects in the pipeline currently are expected to use ATR technology.
General characteristics and operating conditions:
• Size: typically large scale (>100 MW) with some projects in the pipeline expected to be sized up to around 1000 MW in capacity.37
• Operational characteristics: large scale and heating requirements mean plants are expected to take a long time to ramp up and down production; this also makes them more suited to baseload hydrogen production. Baseload in the chart below is defined as running at a constant maximum load factor of 95%.
• Thermal conversion efficiency: currently around 74% (SMR with CCS), 80% (ATR with CCS) and 86% (ATR with GHR and CCS).
• Operating lifetime: approximately 40 years.
37 Based on Element Energy (2018), ‘Hydrogen supply chain: evidence base’ (viewed on 18 June 2021). For more detail also see: BEIS (2021), ‘Hydrogen Production Cost 2021’ (viewed in July 2021).

Analytical Annex
37
Figure 11. Levelised cost estimates for illustrative configurations38
• Main driver(s) of cost: fuel costs, making overall production costs very sensitive to changing fuel prices (as illustrated).
• Cost reduction potential: scope for economies of scale and modest CAPEX and OPEX reductions over time through technological learning, however overall potential limited given fuel costs and carbon costs (expected to rise over time).
38 For more detail see: BEIS (2021), ‘Hydrogen Production Cost 2021’ (viewed in July 2021). All levelised cost estimates reported in this section are generic/illustrative rather than project specific.
0
20
40
60
80
100
120
140
160
180
2025 2050 2025 2050 2025 2050
Low Central High
2020
£/M
Wh
H2
(HH
V)
Fuel Industrial Retail Price
LCOH for an illustrative 1000MW ATR plant with CCUS
CAPEX Fixed OPEX Electricity cost Fuel cost CO2 T&S cost Carbon cost

Analytical Annex
38
Box 6. Electrolytic hydrogen production
Main production technologies:
• Alkaline electrolysis: this is the most mature form of electrolysis and has been in use for over 90 years. This method separates water into hydrogen and oxygen between two electrodes in a solution composed of water and liquid electrolyte.
• Proton Exchange Membrane (PEM): this method splits water by using an ionically conductive solid polymer. Its costs are currently higher than for Alkaline but they are projected to fall more rapidly. Many projects in development globally focus on this technology.
• Solid Oxide Electrolysis (SOE): this method is a relatively novel form of electrolysis that uses high temperature to increase the efficiency of electrolysis (~500 degrees centigrade) this results in much higher electrical conversion efficiency. SOE has not yet been deployed at a commercial scale.
General characteristics and operating conditions:
• Size: typically small scale. However, the future pipeline is likely to see electrolyser plants in the 10s or 100s of MWs, made up of individual smaller sized stacks.
• Operational characteristics: as electrolysers are small and, in the case of Alkaline and PEM, do not require any heating, they can be turned on and off at short notice. This is seen particularly in the case of PEM electrolysers, which have rapid dispatchability and turn down to follow the energy output from renewables and are therefore ideal for pairing with, for example, dedicated wind farms for low carbon hydrogen production. In addition, oxygen is a by-product on electrolysis, which can have value in some circumstances.
• Electrical conversion efficiency: PEM increases from 76% in 2025 to 82% by 2050, Alkaline increases from 79% in 2025 to 82% over the same time period.
• Operating lifetime: approximately 30 years for plants, with individual stack replacement every 7-11 years depending on the type of electrolyser.

Analytical Annex
39
Figure 12. Levelised cost estimates for illustrative configurations39
• Main driver(s) of cost: electricity costs are the main driver of the cost of electrolytic hydrogen. The illustrative scenarios in the chart above show that accessing grid electricity and paying the industrial retail price for it is the most expensive option, whilst using dedicated renewables (excluding private wire costs) and curtailed electricity are less costly, although limited by available supply. If plants can access lower grid electricity prices it would become a more cost-effective option.
• Cost reduction potential: CAPEX and OPEX make up a larger proportion of the levelised costs in the 2020s; this proportion is lower in 2050 reflecting efficiency improvements through technological learning.
39 For more detail see: BEIS (2021), ‘Hydrogen Production Cost 2021’ (viewed in July 2021). All levelised cost estimates reported in this section are generic/illustrative rather than project specific.
020406080
100120140160180
2025 2050 2025 2050 2025 2050
Industrial Retail (Grid) Dedicated Offshore Curtailed (25% LF)
2020
£/M
Wh
H2
(HH
V)
Electricity Supply
LCOH for an illustrative 10MW PEM Electrolyser
CAPEX Fixed OPEX Variable OPEX Electricity cost

Analytical Annex
40
Box 7. Electrolytic hydrogen production
The below chart brings together our evidence on CCUS-enabled hydrogen production and electrolysis and for comparison purposes also includes estimates for biomass gasification with CCUS, all at central fuel prices. It shows that CCUS-enabled hydrogen production is currently the cheapest technology, but electrolysers could become cost-competitive as early as from 2025 onwards. Sensitivity analysis, which is included in the Hydrogen Production Cost 2021 report, gives further insights.
Comparing LCOH estimates to other external sources is difficult as LCOH rely on a variety of assumptions, including fuel and electricity prices, capital and operating costs, efficiencies and load factors. Differing assumptions on these underlying elements means it difficult to compare results.
The Hydrogen Production Cost 2021 report includes a comparison of £/kW capital costs and finds that our CCUS-enabled hydrogen production technology CAPEX is generally lower than other institutions’ modelling assumptions, however more in line with detail received through the Hydrogen Supply Competition. For electrolyser technologies, we have found that our central assumptions are in line with other institutions’ modelling assumptions and that our upper end cost data envelopes the upper end of literature estimates. However, our lower bound estimates are more conservative than some other sources, such as Bloomberg New Energy Finance. This is likely to reflect more bullish global demand and deployment scenarios driving down technology costs, but also switches to larger stack sizes (not considered in our data) providing economies of scale. Improving our assumptions around technological learning represents an area of future work.
Figure 13. Comparison of LCOH estimates across different technology types at central fuel prices commissioning from 2020 to 2050, £/MWh H2 (HHV)
-25
0
25
50
75
100
125
150
175
200
225
2020 2025 2030 2035 2040 2045 2050
2020
£/M
Wh
H2
(HH
V)
Comparison of LCOH estimatesPEM Grid electricity:Industrial Retail Price(Baseload)PEM DedicatedOffshore(at Offshore LF)PEM CurtailedElectricty(25% LF)ATR +GHR 300MWwith CCUS IndustrialRetail PriceBiomass gasificationwith CCUS 59MW
Biomass gasificationwith CCUS 59MW (NetLCOH)

Analytical Annex
41
Rationale for production support
As set out in chapter 2 there are a number of barriers across the hydrogen value chain, which will require a range of government interventions to overcome to bring about development of the UK hydrogen market. Without government support it is unlikely many of these barriers will be overcome.
The following section sets out the rationale for why we believe there is a case for targeting government support towards hydrogen producers, considering the key barriers to production and impact of addressing these on the rest of the value chain. However, we acknowledge that complementary policies will also be required to ultimately achieve our strategic objectives for hydrogen in the UK (as set out in the Hydrogen Strategy).
Addressing the production cost barrier
As set out in earlier chapters, hydrogen can be used in a range of applications across multiple sectors of the economy as a low carbon alternative to a range of fossil fuels.
Producers need to be able to command a high enough market price for their hydrogen, to allow them to recover their costs of production and earn a sufficient return on investment. However, the market price must be low enough to incentivise end users to switch, and for the most part the cost of producing hydrogen is currently more expensive compared to these fossil fuel alternatives. Given the price of competing fuels, there is a risk that the price at which hydrogen producers can competitively sell their hydrogen on the market is not sufficient and may deter investment or result in market exit (‘market price risk’).
Figure 14. Central retail price projections for counterfactual fuels compared to hydrogen production cost range, 2025 and 2030
0
20
40
60
80
100
120
140
160
180
2025 2030 2025 2030 2025 2030 2025 2030 2025 2030
MethaneNatural gas
Coal DERV/Diesel Electrolytic H2(Curtailed vs Retail
Electricity)
CCUS-enabled H2
2020
£/M
Wh
H2
(HH
V)
Fuel costCarbon Cost

Analytical Annex
42
As shown in Figure 14 hydrogen production is still expected to be significantly more expensive than most competing fossil fuels, with the exception of diesel (used in some industrial and mobility applications). Higher carbon prices and extension of the UK ETS to other sectors of the economy could help address this. However, in the near term this remains a significant barrier to production, and also to the adoption of hydrogen across end use sectors.
Government could help overcome this barrier by providing revenue support to hydrogen producers. Revenue support may be designed in numerous ways, but all are characterised as enabling producers to earn enough revenue from the sale of produced volumes to recover their production costs and earn a sufficient return on investment. Alternatively, government could help overcome this barrier by providing ongoing cost support to hydrogen users, which would allow them to switch to using hydrogen at no additional cost compared to continuing to use fossil fuels. Further detail on the advantages and disadvantages of production and end use support are discussed below.
In addition, capital expenditure (CAPEX) 40 co-funding support can play a role in reducing the upfront cost burden and risks faced by producers. For projects, where this support is provided alongside revenue support, it could help to drive down lifetime project costs and provide overall better value for money to society. For projects, where revenue support may not be needed if the cost of low carbon hydrogen is already competitive e.g., with diesel applications, it could allow projects to take their final investment decision (FID).
Addressing demand uncertainty and lack of market structure
A key barrier to investment in low carbon hydrogen production is ‘demand uncertainty’ – the lack of certainty over where demand for produced hydrogen volumes may come from, given currently limited applications in the UK and, consequently, potential reliance on a single or very small number of offtakers. This can deter investment if investors perceive there to be no reliable route to market or consider abuse of market power likely (monopsony / oligopsony), and therefore question the economic viability of the project.
This risk is to some extent mirrored on the demand side of the value chain. The uncertainty effects end users who cannot be sure of a secure and reliable supply. Any disruption in supply of hydrogen would have major business impacts and mean that industrial processes would not be able to run. Lack of market structure is also a concern for users who would be reliant on a small number of suppliers (oligopoly) which could lead to abuse of market power, high prices and could discourage switching to hydrogen.
Government could help overcome this barrier through ongoing revenue support. However, the effectiveness of this solution will depend on how it is designed (considered further in chapter 5). While we would expect the reliance on this scheme to reduce in the longer term as the market matures, providing some form of support for volumes sold, in combination with support for market price earned on those volumes, can in the shorter term provide confidence to producers that they can earn sufficient revenue if market demand is uncertain.
40 CAPEX covers costs incurred during the main build of a project.

Analytical Annex
43
Addressing other key production side barriers
Technological and commercial risk There are considerable technological and commercial risks and uncertainties associated with developing low carbon hydrogen production projects, particularly as the technologies have not yet been proven at a commercial scale in the UK. The existence of these risks may make it difficult to attract investment in production projects and/or result in prohibitively high financing costs.
Government could help overcome this barrier by supporting development expenditure (DEVEX) 41 and CAPEX. Both help to address upfront cost and risk hurdles, with the former stimulating new proposals but also avoiding hiatus on existing projects and the latter helping to drive down lifetime project costs and providing overall better value for money for projects that also require a hydrogen business model and, if no hydrogen business model is required, allowing developers to take FID. Both types of support would generate learnings to drive down the cost of future project DEVEX and CAPEX (more detailed discussion of costs and benefits is included in chapter 4). Such policies could also be applied to end users to help them finance hydrogen adoption projects, and similarly overcome technology and commercial risks associated with switching to low carbon hydrogen (as described in chapter 2).
Distribution and storage barriers Sufficiently developed transmission, distribution and storage infrastructure is a necessary condition for the widespread adoption of hydrogen as an alternative to high carbon fuels. As outlined in chapter 2, the lack of coordination of investment decisions across the supply chain, coupled with high development costs and risks related to regulation and safety, might impede investment.
In the early stages of the hydrogen market, we expect distribution to be localised, using private infrastructure and storage limited to managing supply around intermittent production. Revenue support could help producers manage the costs associated with operating these assets or using existing infrastructure (see the Business Models consultation for further consideration).
However, as the market grows to meet the 5GW ambition and beyond, new distribution and storage infrastructure will need to be developed at scale to prevent a significant market barrier for new producers and offtakers across a wider area. As the Hydrogen Strategy outlines, working with Ofgem and other regulators, government will review what new operating, regulatory and funding arrangements are needed to deliver the expansion of regional and national hydrogen infrastructure and a flexible and responsible regulatory regime.
41 DEVEX covers costs incurred before project build begins, including concept and feasibility studies and preliminary and full Front-End Engineering and Design (FEED). Our DEVEX definition also includes post-FEED/pre-FID costs, including work normally undertaken after reaching FID such as planning applications, site preparation works or any other costs that are able to be capitalised within the capitalisation policy of the recipient.

Analytical Annex
44
Policy and regulatory uncertainty As set out in chapter 2, the current lack of a clear and consistent long-term policy and regulatory framework for low carbon hydrogen may deter private investment in the sector. Investors may perceive the risk of stranded assets as high and, as a result, allocate capital to other projects instead.
The publication of the Hydrogen Strategy aims to provide investors with greater long-term policy certainty. The strategy presents a roadmap which sets our high-level vision for how we will develop the UK hydrogen economy over the course of the decade. Crucially, it identifies what is needed now to grow the hydrogen economy in the short term and prepares the UK for its longer-term evolution. Thus, it gives investors the coordinates on which to base their investment decisions. Providing capital and revenue support through contractual mechanisms (as set out in the Business Models and Net Zero Hydrogen Fund consultations) also helps with this.
Similarly, the Government is already working on laying out the regulatory framework that will govern production, distribution and use of hydrogen.
Consideration of where to target support
As set out earlier, there are several production barriers that may not be overcome without government support. Some of these are also directly related to other barriers across the value chain. The targeting of support impacts how effective the intervention will be at overcoming certain barriers. Therefore, government has some choice in how we might intervene to help address these barriers (illustrated in Figure 15).
Figure 15. Key barriers and types of government support
Upfront DEVEX and CAPEX support To address production barriers, upfront DEVEX and CAPEX support can be targeted at production itself and/or at other barriers across the value chain that contribute to impeding production capacity being built. These include barriers faced by end users or storage and distribution and barriers linked to policy and regulatory uncertainty.
Producer focused DEVEX and CAPEX support is able to directly address the specific barriers faced by producers, including the quantum of upfront costs and the associated risks and
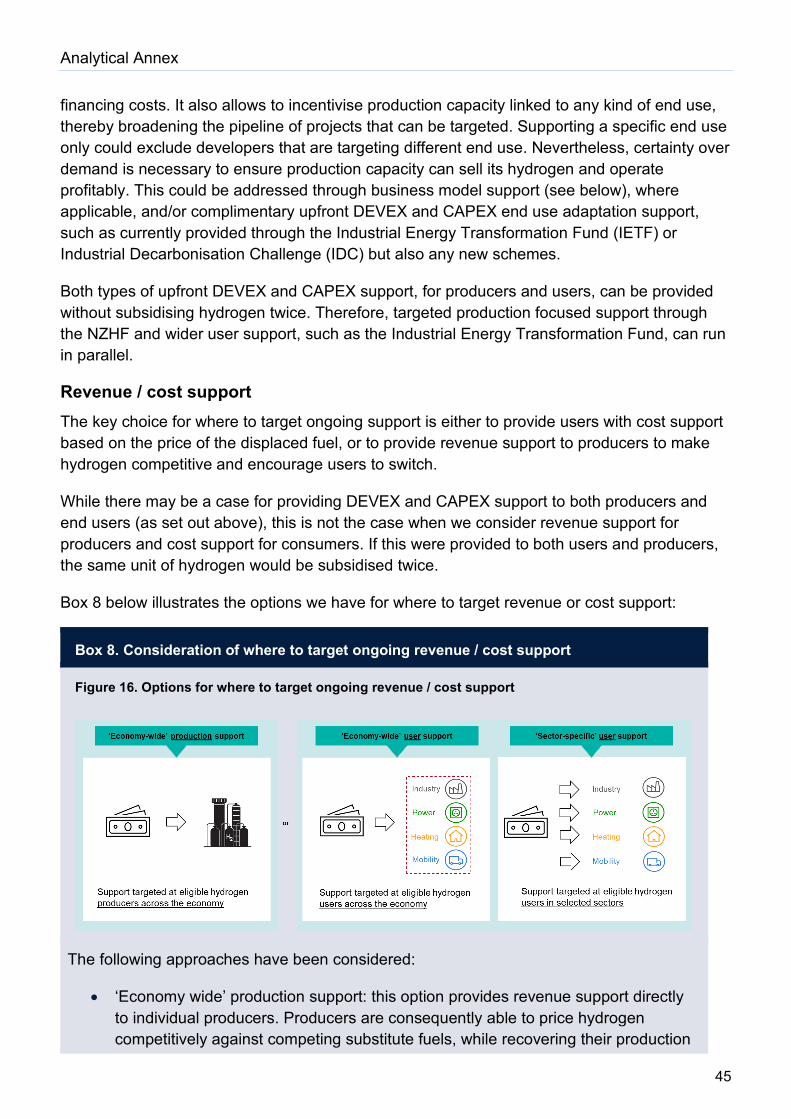
Analytical Annex
45
financing costs. It also allows to incentivise production capacity linked to any kind of end use, thereby broadening the pipeline of projects that can be targeted. Supporting a specific end use only could exclude developers that are targeting different end use. Nevertheless, certainty over demand is necessary to ensure production capacity can sell its hydrogen and operate profitably. This could be addressed through business model support (see below), where applicable, and/or complimentary upfront DEVEX and CAPEX end use adaptation support, such as currently provided through the Industrial Energy Transformation Fund (IETF) or Industrial Decarbonisation Challenge (IDC) but also any new schemes.
Both types of upfront DEVEX and CAPEX support, for producers and users, can be provided without subsidising hydrogen twice. Therefore, targeted production focused support through the NZHF and wider user support, such as the Industrial Energy Transformation Fund, can run in parallel.
Revenue / cost support The key choice for where to target ongoing support is either to provide users with cost support based on the price of the displaced fuel, or to provide revenue support to producers to make hydrogen competitive and encourage users to switch.
While there may be a case for providing DEVEX and CAPEX support to both producers and end users (as set out above), this is not the case when we consider revenue support for producers and cost support for consumers. If this were provided to both users and producers, the same unit of hydrogen would be subsidised twice.
Box 8 below illustrates the options we have for where to target revenue or cost support:
Box 8. Consideration of where to target ongoing revenue / cost support
Figure 16. Options for where to target ongoing revenue / cost support
The following approaches have been considered:
• ‘Economy wide’ production support: this option provides revenue support directly to individual producers. Producers are consequently able to price hydrogen competitively against competing substitute fuels, while recovering their production

Analytical Annex
46
costs. Hydrogen can then be sold at lower prices to a range of end use sectors (dependent on the policy design – considered further in chapter 5).
• ‘Economy-wide’ user support: this option provides cost support via a single policy mechanism to all end users.
• ‘Sector-specific’ user support: this option provides cost support directly to individual users, however is bespoke to the conditions and characteristics of the individual end use sectors. Users switching to hydrogen face the same unit price as the fuel they are switching from.
In theory, either of these approaches could lead to broadly the same outcome. However, in practice there are several considerations that make them distinct (summarised in Table 2 below). To achieve the strategic objectives set out in the Hydrogen Strategy, we consider producer revenue support (alongside upfront producer DEVEX and CAPEX support where appropriate) to be the more effective approach.
Table 3. Advantages and disadvantages of producer vs user support
Advantages Disadvantages
Producer model
- Single policy can be applicable to all eligible producers
- Producer support can be applicable to the supply of hydrogen into all eligible end user sectors
- Fewer interfaces between government and private sector, facilitating quicker implementation, and easier compliance monitoring
- Can be designed to directly address barriers to hydrogen supply including investor risk aversion
- Does not guarantee demand, although helps address significant barriers to adoption

Analytical Annex
47
End user model
- Can be designed to target the needs / specific characteristics of individual sectors
- Can directly incentivise the use of hydrogen
- Sector specific support can be designed to be compatible with existing policies more easily
- Higher number of interfaces/counterparties and multiple subsidy models likely required given heterogeneity of end use sectors and users, resulting in more complexity and slower implementation
- May not stimulate hydrogen specifically where policies are technology-neutral. May create demand in sectors where hydrogen cannot be used or supplied.
- User revenue support does not fully address demand risk faced by producers and investor risk aversion. Unlikely to give sufficient certainty over demand to unlock investment in larger-scale production projects, and could create policy dependencies between end user models
Expected impacts of production support
In the section above we identified the different ways government can support low carbon hydrogen producers – through upfront DEVEX and CAPEX and ongoing revenue support. This section uses the Theory of Change method described earlier to explain how these production side policies are expected to achieve the outcomes and impacts set out in chapter 2.
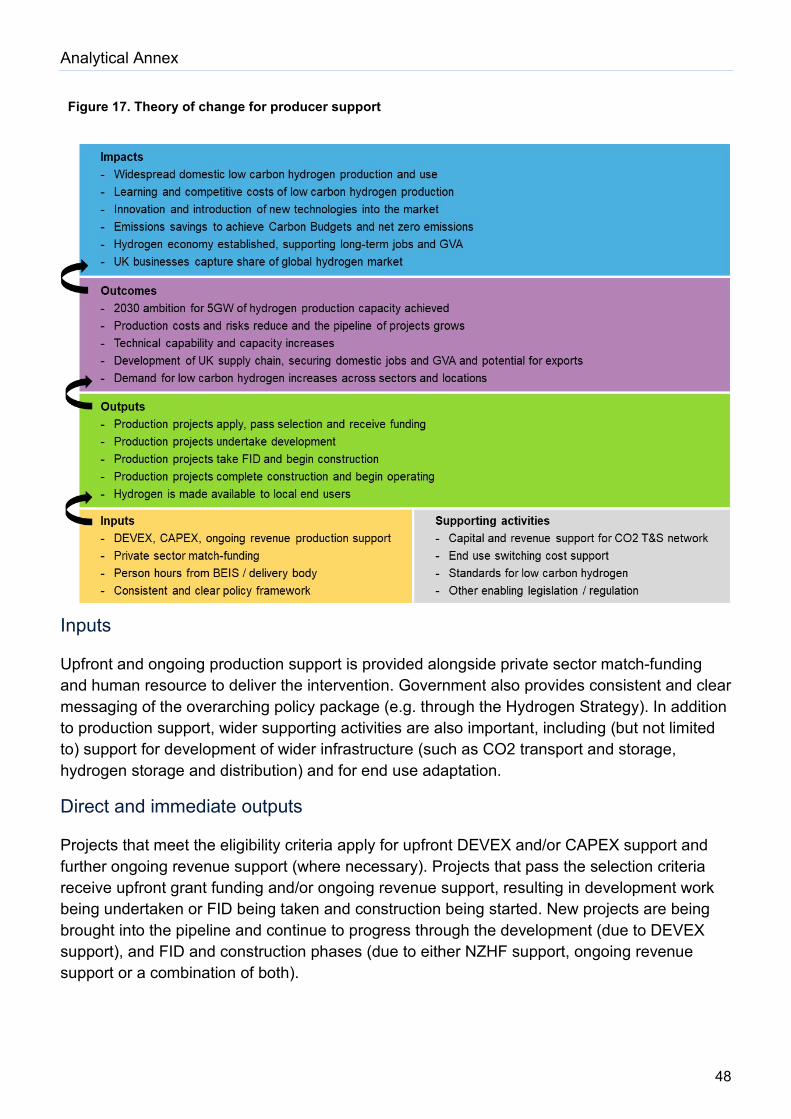
Analytical Annex
48
Figure 17. Theory of change for producer support
Inputs
Upfront and ongoing production support is provided alongside private sector match-funding and human resource to deliver the intervention. Government also provides consistent and clear messaging of the overarching policy package (e.g. through the Hydrogen Strategy). In addition to production support, wider supporting activities are also important, including (but not limited to) support for development of wider infrastructure (such as CO2 transport and storage, hydrogen storage and distribution) and for end use adaptation.
Direct and immediate outputs
Projects that meet the eligibility criteria apply for upfront DEVEX and/or CAPEX support and further ongoing revenue support (where necessary). Projects that pass the selection criteria receive upfront grant funding and/or ongoing revenue support, resulting in development work being undertaken or FID being taken and construction being started. New projects are being brought into the pipeline and continue to progress through the development (due to DEVEX support), and FID and construction phases (due to either NZHF support, ongoing revenue support or a combination of both).

Analytical Annex
49
Expected short to medium term outcomes (to 2030)
The development and deployment of the First-Of-A-Kind (FOAK) plants creates learnings, drives down costs and reduces risks. Also, developers’ technical capability and capacity increases, and the pipeline of projects grows. A foundation for UK-based manufacturing of hydrogen technologies is laid, helping to secure domestic manufacturing jobs and potential or future technology exports. The UK is starting to attract inward investment. This results in jobs and GVA being created for specific projects and along the necessary supply chain, including induced jobs across the UK contributing to levelling up the country. High-carbon fuels are being displaced as end use sectors switch to using low carbon hydrogen, resulting in carbon savings that contribute to meeting carbon budgets. The UK low carbon hydrogen economy has been kickstarted and we are on track to meeting both our interim 1GW ambition in 2025 and our 5GW ambition in 2030.
Expected longer term impacts (to 2050)
The UK sees widespread domestic low carbon hydrogen production. Costs of production have been driven down through learning and healthy competition in a strong pipeline of projects. There is continued innovation and increased uptake of new technologies. A well-functioning and competitive hydrogen market has been established, resulting in long-term emission savings to meet Net Zero in 2050, jobs and GVA across the whole hydrogen economy and avoided carbon leakage (e.g. industry moving abroad) due to a competitive hydrogen price. The UK has become an international leader in low carbon hydrogen production and technology development and is attracting significant foreign investment.
Analytical Annex
50
4. Net Zero Hydrogen Fund
Introduction
Government published its Ten Point Plan for a Green Industrial Revolution in November 202042. The plan highlighted our aim for the UK to develop 5GW of low carbon hydrogen production capacity by 2030 across our industrial heartlands and beyond, which would be supported by a range of measures, including a £240 million Net Zero Hydrogen Fund (NZHF) and our hydrogen business models and a revenue mechanism to bring through private sector investment.
The announced £240 million NZHF support is spread over 4 years from 2021 to 2025 and aimed at providing upfront support to low carbon hydrogen production projects.
We are now consulting on our proposed scope and design of the NZHF43 and this section should be read alongside the consultation. In this analytical annex we provide further detail on the specific market barriers that the NZHF can address, how we arrived at our preferred option and what its main identified costs and benefits are.
Specific market barriers that NZHF can address
Section 3 has set out the overarching production barriers and market failures faced by low carbon hydrogen producers. Below we explore which of these the upfront support under the NZHF can address:
• Production costs: The majority of the relatively higher production costs faced by low carbon hydrogen producers is due to higher ongoing costs (predominantly fuel costs) and the presence of a negative externality linked to carbon. Therefore, it is mainly down to revenue support through a hydrogen business model to address this barrier. However, the NZHF can play a role in reducing the upfront cost burden and risks and therefore addressing market failures linked to nascent markets and imperfect information. For projects, where NZHF support is provided alongside revenue support, it could help to lower overall project costs and provide overall better value for money. For projects where revenue support may not be needed, if the marginal cost of low carbon hydrogen is already competitive, for example with diesel applications, it could allow projects to take FID. Lastly, the NZHF can also play a role in driving learning and cost reductions over the longer term.
• Technological and commercial risk: The NZHF can play an important role in addressing this barrier, which is more acute for the earliest projects in a nascent market. The NZHF could provide upfront support to compensate projects with higher upfront
42 BEIS (2020), ‘The ten point plan for a green industrial revolution’ (viewed on 18 June 2021). 43 BEIS (2021), ‘Designing the Net Zero Hydrogen Fund’ (viewed in July 2021).

Analytical Annex
51
DEVEX and/or CAPEX for their higher “first mover” technology costs and risks. This may allow investors and developers to access better financing conditions for their project and as such may lower the support requirements through hydrogen business models due to lower CAPEX and financing costs. Revenue support through business models needs to address the “first mover” disadvantage with regards to higher running costs due to un-optimised plant conversion efficiency, higher maintenance and oversight costs, suboptimal supplier arrangements etc. throughout a plant’s lifetime.
• Demand uncertainty: The NZHF cannot address the demand uncertainty present in nascent markets with coordination failures. Instead, either producer-focused revenue support, closing the cost gap to high-carbon counterfactual fuels, or demand-focused support will be required.
• Lack of market structure: The NZHF cannot address this barrier linked to the early stage of a market. However, the NZHF alongside other support mechanisms can help to kickstart the market. Design of the mechanisms needs to acknowledge this barrier.
• Distribution and storage barriers: The NZHF focuses on upfront support for hydrogen producers and therefore does not address potential coordination failures.
• Policy and regulatory uncertainty: A key role for the NZHF is to address imperfect information with regards to the emerging more long-term policy package and therefore avoid project hiatus following for example innovation funding or DEVEX support through other funds and ahead of clear line of sight on business models. With regards to DEVEX funding, negative consequences from imperfect information are addressed by allowing projects to move along the development cycle to ensure a future pipeline of projects is maintained. CAPEX support addresses uncertainty over the funding landscape in the short term, resulting, for example, in projects not requiring business model support taking FID and starting construction/operation.
Derivation of the proposed NZHF scope and design
The NZHF Consultation44 sets out our proposed NZHF scope and design. To derive our proposed policy framework, we considered a range of possible options around scope, type of service solution, delivery and implementation and scored these against critical success factors (CSFs) in line with Green Book guidance. CSFs include strategic fit, potential value for money, achievability, supply side capacity/capability and affordability. The below sets out the proposed option and the rationales for choosing it and discounting other options.
Table 4. Proposed policy options and rationales
Proposed NZHF scope & design Rationale
Support the development of CCUS-enabled methane
We have discounted options that focus funding on either only CCUS-enabled or only electrolysis technologies as the former
44 BEIS (2021), ‘Designing the Net Zero Hydrogen Fund’ (viewed in July 2021).
Analytical Annex
52
reformation and electrolysis projects, with a ‘Twin-Track’ approach to low carbon hydrogen production.
can deliver at-scale deployment in the short to medium term while the latter can gain significant cost reductions through scaling up and deliver lower/zero carbon production methods. Also, it is in line with the UK’s overall approach to hydrogen deployment in the 2020s as set out in the Hydrogen Strategy.
We have discounted options that include other technologies such as biomass gasification with CCS as they have not been demonstrated at scale and are unlikely to be available for commercial deployment over the 2020s. They have technology readiness levels (TRLs) below 7 and are likely to benefit more from further innovation funding.
Low carbon hydrogen projects will be targeted past innovation at a more advanced stage, at technology readiness levels (TRL) 7 and beyond, with the focus of support being on deployment.
A focus on TRL 7 and beyond ensures a variety of technologies can be considered and therefore driven down the cost curve providing value for money in the future. Also, a strong pipeline of both CCUS-enabled methane reformation and electrolysis projects can be established.
We have discounted options that consider projects at TRL below 7 due to lack of strategic fit (focus on innovation stage rather than commercial scale deployment) and therefore low value for money. Options that only consider projects at TRL 9 will leave certain technologies, that might be able to offer greater carbon reduction potential, behind and therefore risks building a strong future pipeline.
To address the identified market barriers, we look to co-fund capital costs for new low carbon hydrogen production facilities. We also propose to provide development support for projects that will make up the future pipeline.
The focus on both DEVEX and CAPEX support is largely based on informal stakeholder feedback on what type of support would be most valuable. CAPEX support can address costs and risks of “first deployment movers”, whilst DEVEX support can address the support gap between innovation and deployment and for NOAK projects.
We have discounted funding for project stages other than DEVEX or CAPEX. Funding that provides an acceptable internal rate of return (IRR) to projects by also covering OPEX (including financing costs) is considered out of scope for the NZHF and is addressed through hydrogen business models (Section 5).
For low carbon hydrogen projects that require CAPEX support, we will look to support on-cluster CCUS-enabled methane reformation projects taking part in the CCUS allocation; off-cluster
A focus on both on-cluster and off-cluster UK wide projects ensures a strong future pipeline of projects, stronger competition and therefore ultimately better value for money. It will also encourage learning across different production set-ups. However, we note there could be a potential loss of synergy benefits.
Analytical Annex
53
CCUS-enabled methane reformation projects; and electrolysis projects. We anticipate that all nations will participate in the Fund and so, it will be funded and delivered on a UK-wide basis.
We have discounted options that focus only on either on-cluster or off-cluster locations due to unnecessary restrictions to the pipeline.
We are considering whether the NZHF awards capital grant funding through a competitive process.
Capital grants are considered to provide flexibility in approach for both developers and government in terms of addressing barriers as and when they occur. However, it will be important to avoid over-reliance on funds and support the development of a sustainable market.
A competitive process (coupled with effective eligibility and selection criteria), unlike direct allocation of funds, helps to provide best value for money and additionality. At this stage we have discounted direct allocation as government has imperfect information and benefits of competitive pressures would be lost.
We have also discounted other support options, such as a joint venture or regulation-, tax-, information-based solutions, as standalone these are unlikely be targeted enough (time & cost dimension) or sufficient to address the identified barriers. This reduces value for money and additionality. Based on initial informal stakeholder feedback and our learnings from other similar funds, we have also currently discounted loans as these may not go far enough in removing the risks and barriers identified. Capital guarantees are not something that are routinely offered by government due to the complexity of management of these schemes. However, we are interested to hear further from stakeholders as part of the consultation.
Expected costs and benefits
Our preferred NZHF scope and design that we are consulting on is expected to bring the following key benefits:
• Through CAPEX support for pre-FID projects that also require a hydrogen specific business model the NZHF could lower overall project costs and risks;
• Through CAPEX support for pre-FID projects that do not require a hydrogen specific business model the NZHF will enable projects to take FID and start construction and operation;

Analytical Annex
54
• Through DEVEX support for new/currently unsupported projects, the NZHF creates option value by building up the future pipeline and levelling the playing field for those projects that have not yet benefitted from DEVEX support through other funds. It could also help to avoid project hiatus and keep projects moving before a clear line of sight on business models.
Table 5. Expected costs and benefits
Cost Benefit
Project developers
Co-funding of DEVEX
Admin costs
- Overcome upfront cost and risk hurdle and stimulate new proposals
- Fill support gap for new projects
- Avoid hiatus of existing projects
- Indirect: Learning to drive down future DEVEX
Co-funding of CAPEX
Funding for operating plant
Admin costs
- Reduced quantum of upfront costs and risks, and better financing conditions
- Ability to take FID, construct, operate & earn revenues (for projects that do not require a hydrogen business model)
- Indirect: Learning to drive down future CAPEX
Wider society
Familiarisation costs
End use adaptation costs
- Option value, strong future pipeline, avoided delay, learning and competition (DEVEX support)
- Delivery of smaller end-to-end projects and supply chain development, potential for lower lifetime costs and better value for money (CAPEX support)
- Strong Union through UK wide locations
- Direct/Indirect: Displacement of high carbon fuels, carbon savings, Jobs/GVA
Project developers
From late 2020 to Spring 2021 we have held various informal bilateral discussions with prospective low carbon hydrogen production developers. Through this light touch engagement, we gathered, mainly qualitative, stakeholder feedback und used this to identify the costs and benefits set out in Table 5 above.
The identified benefits address several of the identified barriers and market failures, including production costs, technological and commercial risk and policy uncertainty.

Analytical Annex
55
Benefits from upfront DEVEX support Early stakeholder feedback and evidence from other funds (for example the HySupply Competition or Industrial Decarbonisation Challenge) has highlighted that DEVEX support for current projects has helped projects to reduce their expenditure to acceptable levels to move this part of the project development cycle forward. Therefore, we consider that new project proposals – either those not yet in receipt of DEVEX support through other schemes or future projects of developers that already have a first of a kind project at pre-FID stage – would benefit by being able to move their projects forward. DEVEX support can also contribute to avoiding delay of post-FEED decisions and activities (such as planning applications, legal fees, deposits on long lead times, site preparation, enabling and facilities) of pre-FID projects that might be held up due to the sequencing of an announcement on business models. We also expect DEVEX support to fill a funding gap and together with business models it will create a coherent, end-to-end support package for producers. We expect that evidence for this will become available once a first cut of business models has been announced.
Benefits from upfront CAPEX support Based on early stakeholder feedback we expect most larger CCUS-enabled and electrolytic projects will see a business model as the main factor driving decisions towards FID and might not want to make use of upfront CAPEX support. However, some of these projects may benefit from upfront CAPEX support from the NZHF to help lower the quantum of upfront costs and risks and contribute to lowering its financing costs. This could result in a project overall requiring less support through a hydrogen business model.
For smaller projects with specific end uses, early stakeholder feedback suggests upfront CAPEX support might be sufficient to reduce project costs and risks to acceptable levels and therefore allow these projects to take FID, start construction, operation and eventually earning revenues without ongoing business model support. Lastly, evidence on the indirect learning benefits for future projects is based on what we have seen in other sectors (such as the power sector).
Costs In order to realise benefits from DEVEX and upfront CAPEX support, project developers will have to contribute private sector match-funding. They will also have to participate in the NZHF process, which will incur administrative costs. Projects, that only require NZHF support to come online, will also have to be able to cover all of their operational costs.
Wider society
Most of our qualitative evidence on the benefits for wider society are based on the Theory of Change thinking set out in chapter 3, which explores the expected impacts on society as a whole of the production support package and the NZHF within that.
Benefits from upfront DEVEX support The main benefit to wider society of providing DEVEX support is the option value it creates by incentivising progress on (new) projects and avoiding delays by continuing to move projects
Analytical Annex
56
forward until they can take FID once a business model is available. The strong future pipeline this creates helps to put the UK on track to meeting its 5GW 2030 ambition and its legally binding carbon budgets and Net Zero target by 2050. A strong pipeline and the associated learning also create competitive pressures, which will contribute to achieving cost-effective pathways to 2050. Lastly, avoided delays and a strong future pipeline could also accelerate benefits such as jobs, GVA, carbon savings and improved air quality. However, it is important to note that projects might fail to secure business model support, introducing some sunk cost risk to society.
Benefits from upfront CAPEX support CAPEX support for projects that can take FID due to NZHF alone could kickstart end-to-end projects creating direct benefits for society, including supply chain development, jobs and GVA and eventual carbon savings and improved air quality. CAPEX support for projects that do require business model support and are able to secure it could help to drive down lifetime project costs and provide overall better value for money.
Given the proposed broad coverage of the fund (UK wide cluster and off-cluster locations), society will also benefit from a joined-up approach across devolved administrations that will contribute to strengthening our Union.
Costs The main costs faced by wider society are familiarisation and end use adaptation costs. These need to be incurred in order for high-carbon fuels to be displaced across end use sectors and carbon savings and improved air quality to materialise. In addition, there is some potential for sunk cost linked to DEVEX support as projects might fail to secure business model support later on and therefore might not be able to take FID.
NZHF consultation
As part of the NZHF consultation we are seeking stakeholder views to further improve our evidence base and ensure value for money and additionality of our proposed option. This should include further detail on differences in requirements for CCUS-enabled methane reformation and electrolysis projects. We are also aiming to strengthen our qualitative analysis through quantitative modelling.

Analytical Annex
57
5. Low Carbon Hydrogen Business Model
Introduction
In this chapter we explore the design of a business model for low carbon hydrogen which will provide ongoing revenue support to eligible low carbon hydrogen producers. This support would be provided once these projects enter the operational phase of their lifecycle, however not for the entire duration of this phase.
This chapter should be read alongside the Low Carbon Hydrogen Business Model consultation document.
Approach to developing the business model
Figure 18. High-level approach to building the business model
As set out in chapter 3, the key production barriers a business model can help address are high production cost relative to competing alternative fuels (‘price risk’), demand uncertainty and lack of market structure (‘volume risk’). Design of the business model is essentially about allocating these risks between producers and government (further risks are outlined in the consultation document, however not explored in detail at this stage here).
Our approach to developing the business model for low carbon hydrogen has therefore been to start from consideration of these two key risks and identify what levers we have under a contractual revenue support model to address these.
The two main levers / model design features that influence the allocation of these two key risks are (i) the extent to which government supports the per unit price of the producer’s hydrogen (‘price support’) and (ii) the type and number of units government supports (‘volume support’). We consider these to be the foundations of any business model and carry out an assessment of the policy options identified in the following section, against the design principles set out below.
Once the preferred price and volume support options are identified, further work will be necessary to design these in detail. There are also other necessary design features that do not necessarily stem from our choice of price or volume support, though may be related e.g., contract duration. These further design features are considered in the consultation document.

Analytical Annex
58
Design principles
As outlined in previous sections, ongoing revenue support (a business model) for low carbon hydrogen producers will be essential for helping unlock early investment in low carbon hydrogen and, consequently, stimulating the development of a competitive and liquid UK hydrogen market.
A good business model should provide a stable contractual framework of government support for hydrogen production, which over time can be reduced or removed as it ceases to be necessary and avoids unnecessary complexity.
If designed appropriately, this framework should incentivise the private sector to allocate capital to the development of production capacity and enable projects to be sanctioned. Once projects are operational the framework should incentivise producers to efficiently produce hydrogen for the purpose of being used; to seek out users and build demand over time; and to sell hydrogen at a price that fairly reflects its intrinsic value in various applications.
As with any government intervention, it is important to strike an appropriate balance between providing these incentives and achieving value for money to society. Allowing level of government support to reduce as the need for it reduces over time, both within the duration of any given contract and across successive rounds of allocation, is a desirable feature of a good business model.
These principles are reflected in Box 9 below, which we will consider when determining the final business model design.
Box 9. Key design principles for assessment of business model design options
1. Investable: the business model should provide sufficient predictability over revenue and return to investors and mitigate risks which investors are not best able to bear.
2. Promotes market development: the business model should incentivise producers to seek and develop sources of demand for hydrogen and promote its use.
3. Promotes market competition: the business model should not create barriers to market entry, enable abuse of market power, or provide an enduring competitive advantage of first movers compared to later market entrants.
4. Compatible: the business model should be compatible with other policies across the value chain and should not result in double subsidisation of the same units.
5. Avoids unnecessary complexity: the business model should avoid unnecessary complexity for government to design, implement, and administrate over time, and for producers to understand and comply with over time.
Analytical Annex
59
6. Reduces support over time: the business model should allow for revenue support to producers to reduce over time (within and between contracts) by being responsive to evolving market conditions and incentivising learning, innovation, and cost reductions over time.
7. Suitable for future pipeline: the business model should be fit for purpose for first of a kind (FOAK) projects as well as next of a kind (NOAK) projects with minor or reasonable adjustments.
8. Value for money: the business model should be effective in achieving its intended purpose at the lowest possible cost to government and prevent excessive returns to developers.
9. Size agnostic: the business model should be applicable to a range of project sizes and should not incentivise inefficient sizing of production plants.
10. Technology agnostic: the business model should be applicable to a range of production technologies (provided they meet low carbon standards) and not create an enduring competitive advantage for one technology over another.
Price support
Options for price support
There are broadly three options for the type of payment the business model can provide, and therefore the extent of price support:
1. Fixed price: the business model sets the price the producer would receive for every unit of hydrogen available or produced (see later section on ‘volume support’ for consideration of this). This price could be set based on the expected levelised cost of production.
2. Fixed premium: the business model allows the producer to sell into the market at whatever price it can receive for every unit of hydrogen sold. Regardless of the price received the producer is provided a fixed payment (‘premium’). This fixed premium could be set based on some proportion of a reference value (e.g. production cost, counterfactual fuel price, expected market price) and expressed either as a monetary value or percentage uplift.
3. Variable premium: the business model allows the producer to earn the difference between a reference price and strike price for each unit of hydrogen sold. The reference price typically reflects the price received from the market, and the strike price typically reflects the expected levelised cost of production in addition to other relevant costs.
Each of these options is explored in more detail below.
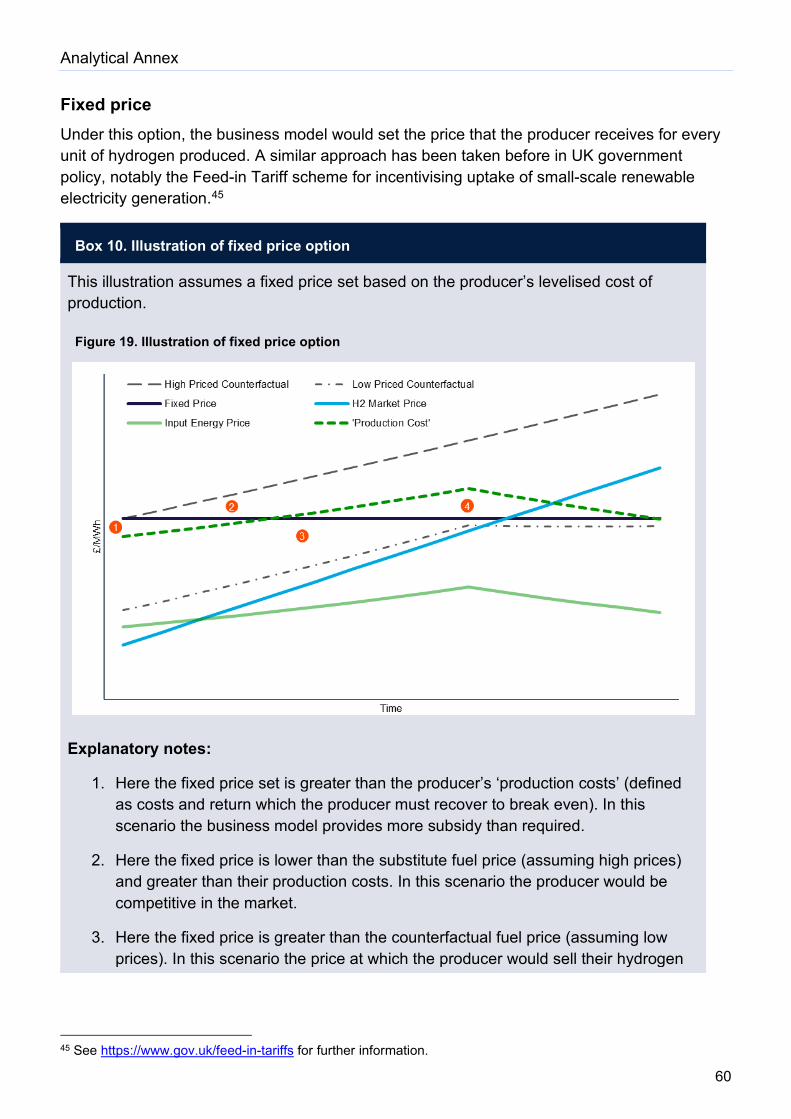
Analytical Annex
60
Fixed price Under this option, the business model would set the price that the producer receives for every unit of hydrogen produced. A similar approach has been taken before in UK government policy, notably the Feed-in Tariff scheme for incentivising uptake of small-scale renewable electricity generation.45
Box 10. Illustration of fixed price option
This illustration assumes a fixed price set based on the producer’s levelised cost of production.
Figure 19. Illustration of fixed price option
Explanatory notes:
1. Here the fixed price set is greater than the producer’s ‘production costs’ (defined as costs and return which the producer must recover to break even). In this scenario the business model provides more subsidy than required.
2. Here the fixed price is lower than the substitute fuel price (assuming high prices) and greater than their production costs. In this scenario the producer would be competitive in the market.
3. Here the fixed price is greater than the counterfactual fuel price (assuming low prices). In this scenario the price at which the producer would sell their hydrogen
45 See https://www.gov.uk/feed-in-tariffs for further information.

Analytical Annex
61
would not be low enough to incentivise end users to switch from using the counterfactual fuel.
4. Here the fixed price is also lower than the producer’s production costs e.g. due to an increase in input fuel costs. This may be tolerable for very short periods but ultimately if the producer is unable to break even this will lead to market exit.
Table 6. Assessment of fixed price option
Considerations Assessment against key design principles
Advantages Investable: provides predictability over revenue to producers (for a given volume of hydrogen) and can address market price risk, assuming production costs do not change significantly compared to the fixed price set. If input prices rise significantly and unexpectedly (and there is no other mechanism in the contract to mitigate this risk) it may not be investable.
Avoids complexity: the price does not need to be adjusted over time and can be set based on the producer’s expected levelised cost of production, which is relatively straightforward.
Disadvantages Does not reduce support over time: as the price is fixed the level of support per unit of hydrogen does not fall over time unless periodic price reopeners are implemented.
Limited compatibility with other policies: as the price is fixed it will not adjust to account for changes in other policies (e.g. rising carbon prices) as they occur unless these changes trigger price reopeners.
Poor value for money: may result in excessive subsidy if production costs fall significantly relative to the fixed price set.
Further considerations The disadvantages identified above cannot fundamentally be mitigated under a fixed price approach – addressing input price risk (e.g. through indexation) means the price is no longer fixed. Frequent reopeners undermine the simplicity of the option and potentially also investability (if revenues cannot be predicted as easily).
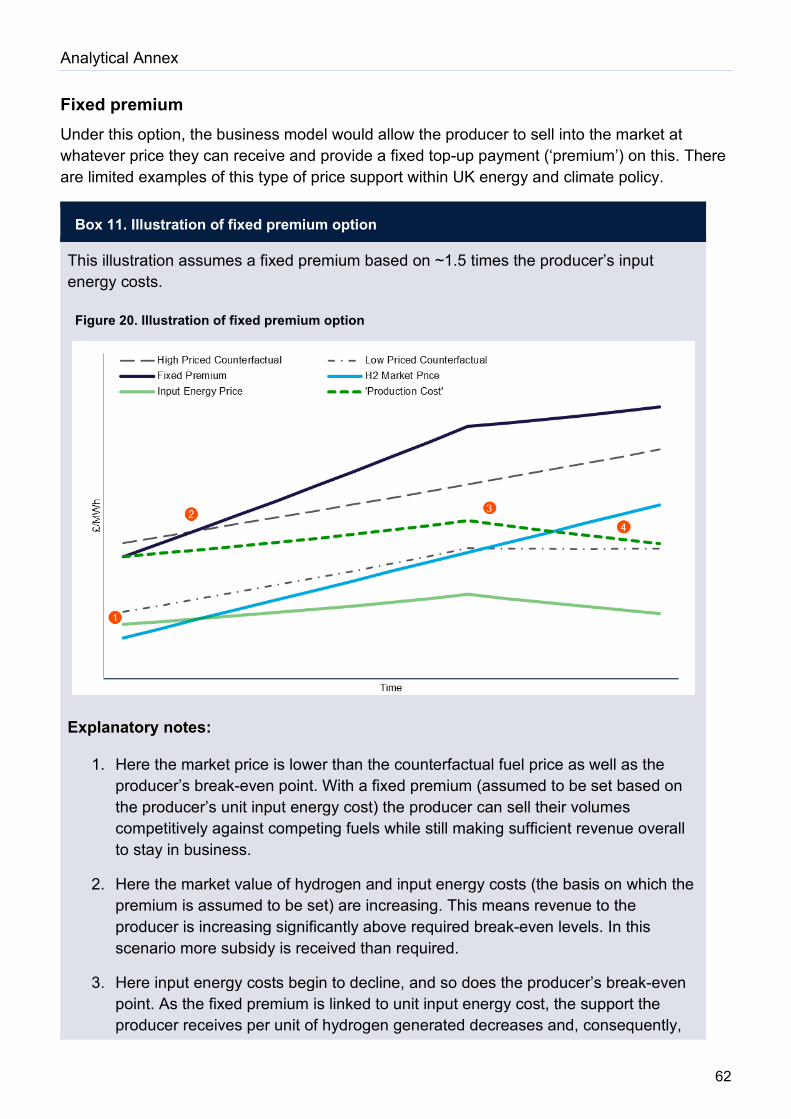
Analytical Annex
62
Fixed premium Under this option, the business model would allow the producer to sell into the market at whatever price they can receive and provide a fixed top-up payment (‘premium’) on this. There are limited examples of this type of price support within UK energy and climate policy.
Box 11. Illustration of fixed premium option
This illustration assumes a fixed premium based on ~1.5 times the producer’s input energy costs.
Figure 20. Illustration of fixed premium option
Explanatory notes:
1. Here the market price is lower than the counterfactual fuel price as well as the producer’s break-even point. With a fixed premium (assumed to be set based on the producer’s unit input energy cost) the producer can sell their volumes competitively against competing fuels while still making sufficient revenue overall to stay in business.
2. Here the market value of hydrogen and input energy costs (the basis on which the premium is assumed to be set) are increasing. This means revenue to the producer is increasing significantly above required break-even levels. In this scenario more subsidy is received than required.
3. Here input energy costs begin to decline, and so does the producer’s break-even point. As the fixed premium is linked to unit input energy cost, the support the producer receives per unit of hydrogen generated decreases and, consequently,
Analytical Annex
63
the gap between the producer’s total revenues and market value of hydrogen begins to narrow. However, the gap between producer’s total revenues and break-even point continues to widen.
4. Here the market price of hydrogen is sufficiently high to allow producer to breakeven without support. However, the fixed premium means that support payments continue at a high level, and as with the fixed price option there is no automatic mechanism for adjusting this.
Table 7. Assessment of fixed premium option
Considerations Assessment against key design principles
Advantages Investable: compared to the fixed price option this would likely be considered more investable as it provides better protection against input costs fluctuating.
Relatively simple: though setting the premium at the outset of the contract is likely to be complex, once this is fixed, the mechanics of how this option works are very simple.
Disadvantages Does not reduce support over time: as the premium is fixed the level of support per unit of hydrogen does not fall over time unless periodic price reopeners are implemented.
Limited compatibility with other policies: as the premium is fixed it will not adjust to account for changes in other policies (e.g. rising carbon prices) as they occur unless these changes trigger price reopeners.
Poor value for money: may result in excessive subsidy if the market price if hydrogen rises over time as the premium is fixed regardless.
Further considerations While this option addresses some of the key issues with the fixed price approach, there are still significant risks to value for money. These risks could be addressed by allowing the premium to vary in response to market conditions (considered below).
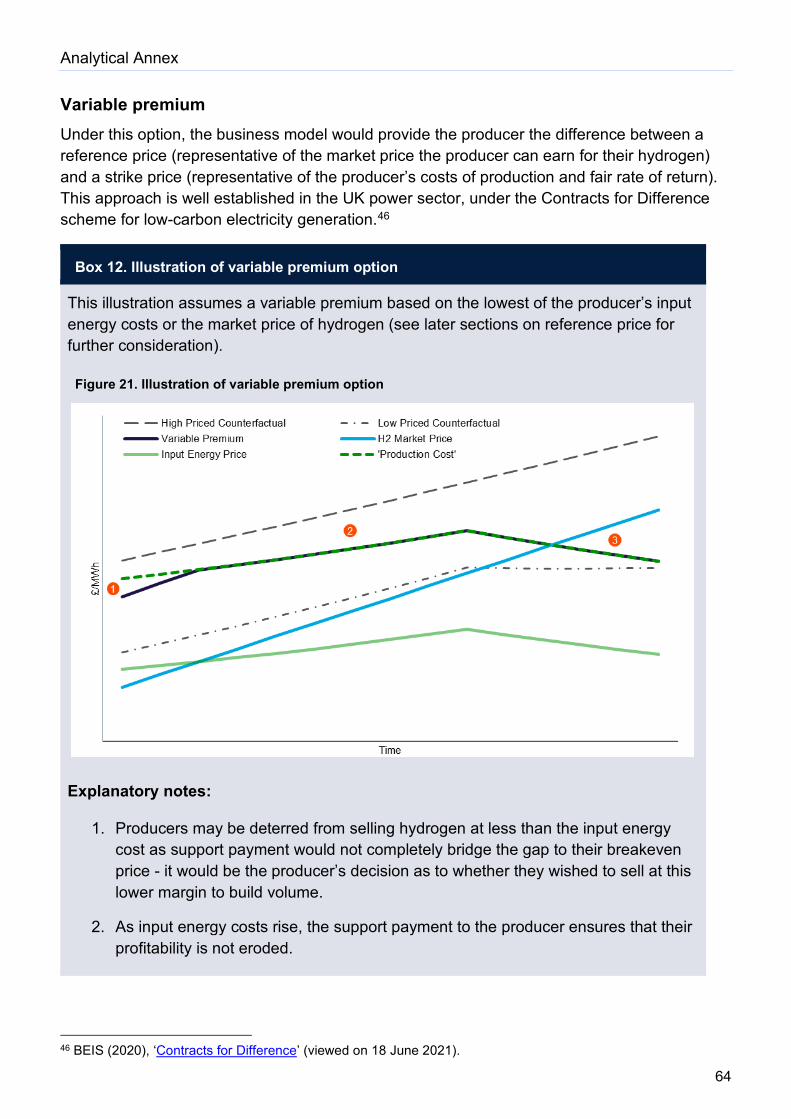
Analytical Annex
64
Variable premium Under this option, the business model would provide the producer the difference between a reference price (representative of the market price the producer can earn for their hydrogen) and a strike price (representative of the producer’s costs of production and fair rate of return). This approach is well established in the UK power sector, under the Contracts for Difference scheme for low-carbon electricity generation.46
Box 12. Illustration of variable premium option
This illustration assumes a variable premium based on the lowest of the producer’s input energy costs or the market price of hydrogen (see later sections on reference price for further consideration).
Figure 21. Illustration of variable premium option
Explanatory notes:
1. Producers may be deterred from selling hydrogen at less than the input energy cost as support payment would not completely bridge the gap to their breakeven price - it would be the producer’s decision as to whether they wished to sell at this lower margin to build volume.
2. As input energy costs rise, the support payment to the producer ensures that their profitability is not eroded.
46 BEIS (2020), ‘Contracts for Difference’ (viewed on 18 June 2021).

Analytical Annex
65
3. As H2 market price now exceeds the variable premium inverts – the producer is still able to breakeven, but the positive difference between the H2 market price and the producer breakeven now accrues to HMG.
Table 8. Assessment of variable premium option
Considerations Assessment against key design principles
Advantages Investable: this option overcomes some of the key challenges from the producer’s perspective of the previous options and provides predictability of required revenue on volumes sold.
Compatible: the reference price can be set to take into account interactions with other policies (e.g. carbon pricing) and be responsive to changes in these over time.
Reduces support over time: this is dependent on how the reference price is set, but the expectation is that under this option as the market price for hydrogen rises over time the level of price support should reduce.
Value for money: as the variable premium dynamically responds to market conditions it ensures risk of excessive subsidy to producers is minimised.
Disadvantages Complex: relatively complex compared to the fixed price option, as like the fixed premium option the methodology for determining the variable premium needs to be defined. As the premium under this option varies over time (and depending on how a reference price is set) it may be mechanistically more complex than the fixed premium.
Further considerations For the advantages of this option to be realised, setting an appropriate reference price is key; in particular considering the markets into which producers can sell hydrogen volumes and the sales price the producer can achieve to avoid negative market distortions and excessive returns.
Consideration of price support options against key design principles In determining how the business model should provide price support to producers, we have considered the options against the most relevant design principles i.e. those that allow us to materially distinguish between the options.
The table below provides a summary of the assessment above, using RAG ratings to indicate how well we believe each option performs against each design principle (green indicating the option performs well vs red indicating it performs poorly).

Analytical Annex
66
Table 9. Summary of assessment of price support options
Design principle Fixed price Fixed premium Variable premium
Investable Amber Green Green
Compatible Red Amber Green
Avoids complexity Green Amber Amber
Reduces support over time Red Red Amber
Value for money Amber Red Green
Considering the most relevant / distinguishing design principles, we believe the variable premium is the best option for providing price support under the low carbon hydrogen business model design. While relatively more complex than a fixed price or fixed premium approach, the variable premium is the most responsive to market dynamics (while ensuring the producer recovers their costs and fair rate of return) and is therefore expected to be investable from the perspective of producers but also value for money to government.
Key to realising the benefits of this option over the others considered however is setting an appropriate reference price. We consider options for this element of the business model further in the following section.
Reference price options
As established above, the reference price is a key component of our preferred price support option for the business model (the variable premium).
Within this context, the reference price is intended to represent the market price for hydrogen. In a liquid and competitive hydrogen market with established regional and national distribution infrastructure in place, this would be the ideal reference price (e.g., akin to the UK National Balancing Point price for natural gas or the UK wholesale electricity market price).
However, it is unlikely that FOAK or even early NOAK hydrogen production projects will be making investment decisions or operating in these market conditions. Due to immaturity of the market and in the absence of regional and national distribution infrastructure, we expect instead that the hydrogen market will be characterised by few buyers and sellers and largely localised; rather than a prevailing market price, multiple localised prices are likely to emerge linked to the value of the counterfactual fuel of individual offtakers.
How the reference price is set is likely to influence price formation in the market, and the basis upon which long term contracts with offtakers are made. If a producer sells their hydrogen below the reference price, their revenue (support payment plus revenue from market sales) will not be sufficient to cover their strike price (illustrated below), impacting their return on investment and in the long-term potentially resulting in market exit. We expect a profit

Analytical Annex
67
maximising producer to therefore be incentivised to sell their hydrogen above the reference price. However, their ability to do so will depend on the degree of market power they have in their segment of the market, and ultimately on what basis the reference price is set.
Box 13. Interaction between reference price and producer sales price incentives
If sales price exceeds the reference price, revenue from the business model (A) plus revenue from the market (B) will be greater than the strike price (C), as shown in Figure 22 below. The producer therefore has an incentive to sell above the reference price (though if this possibility is not reflected in the strike price over subsidy may result).
Figure 22. Illustration of implication of sales price greater than the reference price
In contrast if the sales price is lower than reference price, revenue from the business model (D) plus revenue from the market (E) will be less than the strike price (C), as shown in Figure 23 below. The producer has no incentive to sell their volumes at a price below the reference price as they would consequently fail to achieve their required revenue to cover costs and earn a return on their investment. If the reference price is too high relative to the expected market value of hydrogen this could also deter investment in production (or take up by end users – see box 14) in the first place.
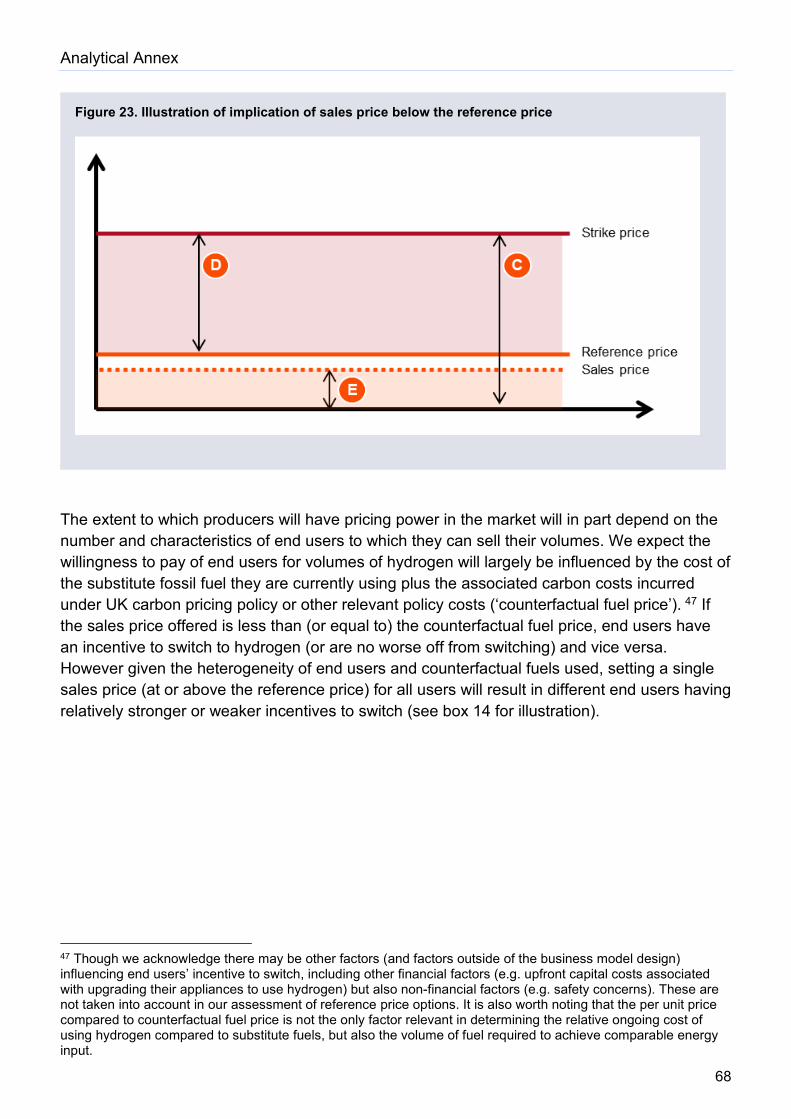
Analytical Annex
68
Figure 23. Illustration of implication of sales price below the reference price
The extent to which producers will have pricing power in the market will in part depend on the number and characteristics of end users to which they can sell their volumes. We expect the willingness to pay of end users for volumes of hydrogen will largely be influenced by the cost of the substitute fossil fuel they are currently using plus the associated carbon costs incurred under UK carbon pricing policy or other relevant policy costs (‘counterfactual fuel price’). 47 If the sales price offered is less than (or equal to) the counterfactual fuel price, end users have an incentive to switch to hydrogen (or are no worse off from switching) and vice versa. However given the heterogeneity of end users and counterfactual fuels used, setting a single sales price (at or above the reference price) for all users will result in different end users having relatively stronger or weaker incentives to switch (see box 14 for illustration).
47 Though we acknowledge there may be other factors (and factors outside of the business model design) influencing end users’ incentive to switch, including other financial factors (e.g. upfront capital costs associated with upgrading their appliances to use hydrogen) but also non-financial factors (e.g. safety concerns). These are not taken into account in our assessment of reference price options. It is also worth noting that the per unit price compared to counterfactual fuel price is not the only factor relevant in determining the relative ongoing cost of using hydrogen compared to substitute fuels, but also the volume of fuel required to achieve comparable energy input.
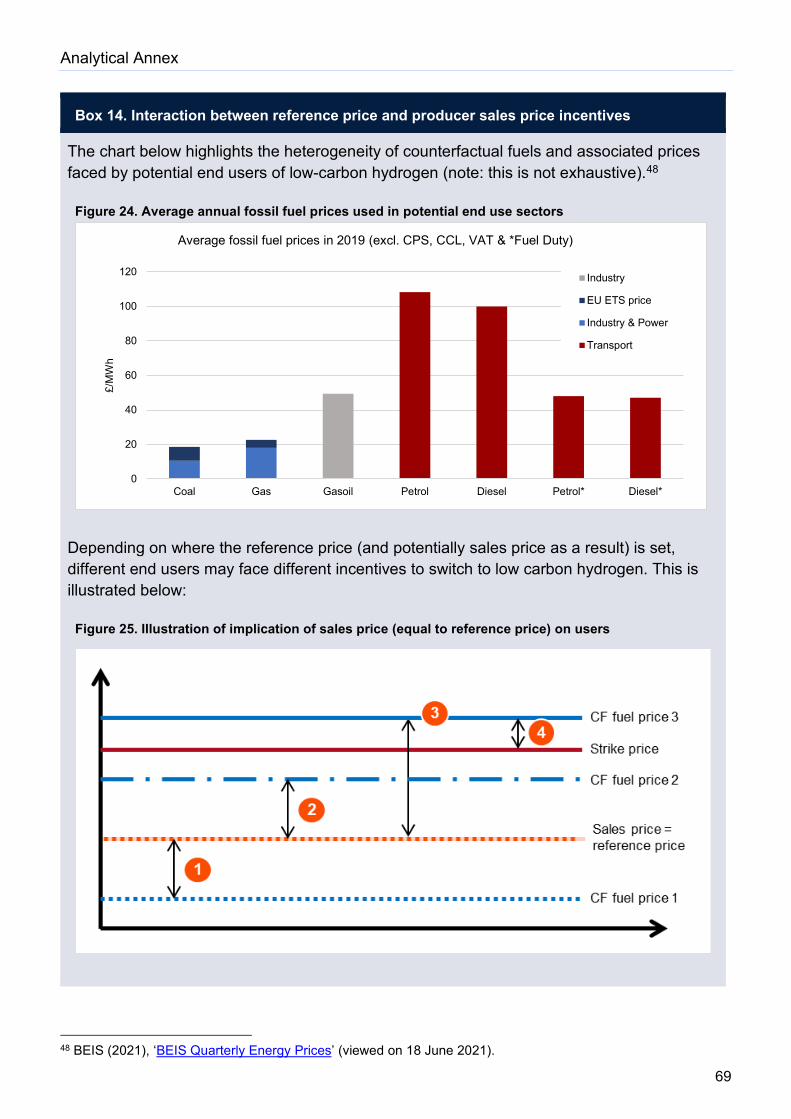
Analytical Annex
69
Box 14. Interaction between reference price and producer sales price incentives
The chart below highlights the heterogeneity of counterfactual fuels and associated prices faced by potential end users of low-carbon hydrogen (note: this is not exhaustive).48
Figure 24. Average annual fossil fuel prices used in potential end use sectors
Depending on where the reference price (and potentially sales price as a result) is set, different end users may face different incentives to switch to low carbon hydrogen. This is illustrated below:
Figure 25. Illustration of implication of sales price (equal to reference price) on users
48 BEIS (2021), ‘BEIS Quarterly Energy Prices’ (viewed on 18 June 2021).
0
20
40
60
80
100
120
Coal Gas Gasoil Petrol Diesel Petrol* Diesel*
£/M
Wh
Average fossil fuel prices in 2019 (excl. CPS, CCL, VAT & *Fuel Duty)
Industry
EU ETS price
Industry & Power
Transport

Analytical Annex
70
If the counterfactual fuel price is less than the hydrogen price (1), the potential end user does not have an incentive to switch, as switching to hydrogen would (all else constant) result in higher ongoing costs compared to the counterfactual. In contrast, if the counterfactual fuel price is higher than the sales price (2) the potential end user could achieve cost savings by switching to hydrogen and therefore has an incentive to switch.
The user with the relatively more expensive counterfactual fuel (3 vs 2) has a greater incentive to switch to hydrogen as they can achieve a greater cost saving (excluding consideration of any other relevant switching considerations). In some cases, the counterfactual fuel could potentially be higher than the producer’s strike price (4). If this occurs, the market revenue may be sufficient to cover the producer’s costs revenue support from the business model may not be needed.
There are therefore numerous considerations / complexities to consider when setting the reference price. These are explored further in the following section when considering the following longlist of options for setting the reference price:
1. Input energy price(s): the reference price could be set based on either the natural gas price (the primary input fuel for reformation-based production technologies) or electricity price (for electrolytic production technologies).
2. Natural gas price: the reference price could be set as the natural gas price generally – rather than linked specifically to producers’ input fuel.
3. Substitute fuel price(s): the reference price could be set at the price of the (high carbon) fuel being substituted for hydrogen across different end use applications.
4. Achieved sales price(s): the reference price could be set as (an average of) the producer’s actual achieved sales price for volumes sold onto the market.
5. Market benchmark price(s): the reference price could be set based on a market benchmark price for hydrogen akin to benchmark prices produced by independent parties for other commodity markets (and used as reference points for contracts in these markets).
6. Carbon price: the reference price could be set as the UK ETS carbon market price, analogous to business models in other countries such as the SDE++ scheme in the Netherlands.
7. Natural gas plus carbon price: the reference price could be set as a combination of the natural gas price (likely to be the most common fuel from which end users will be switching) and the carbon price (representing the value in terms of carbon cost saving to users associated with switching from natural gas to hydrogen).
Each of these is considered against the key relevant design principles in turn below.
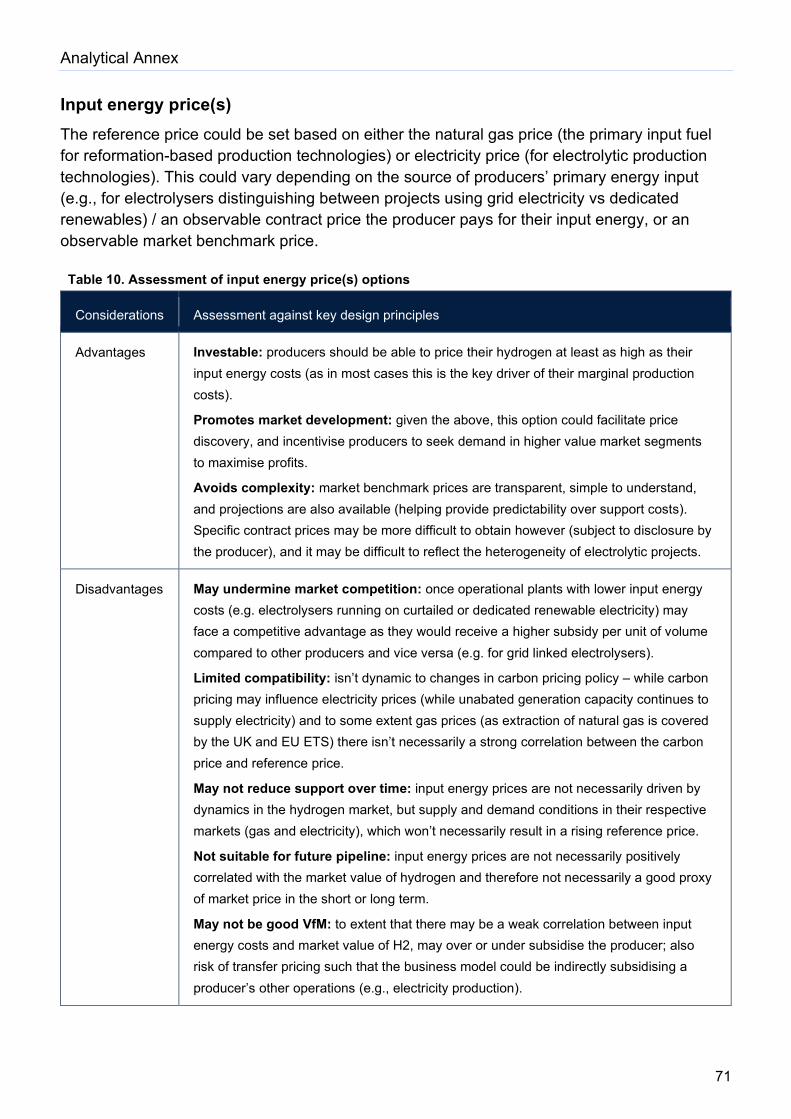
Analytical Annex
71
Input energy price(s) The reference price could be set based on either the natural gas price (the primary input fuel for reformation-based production technologies) or electricity price (for electrolytic production technologies). This could vary depending on the source of producers’ primary energy input (e.g., for electrolysers distinguishing between projects using grid electricity vs dedicated renewables) / an observable contract price the producer pays for their input energy, or an observable market benchmark price.
Table 10. Assessment of input energy price(s) options
Considerations Assessment against key design principles
Advantages Investable: producers should be able to price their hydrogen at least as high as their input energy costs (as in most cases this is the key driver of their marginal production costs).
Promotes market development: given the above, this option could facilitate price discovery, and incentivise producers to seek demand in higher value market segments to maximise profits.
Avoids complexity: market benchmark prices are transparent, simple to understand, and projections are also available (helping provide predictability over support costs). Specific contract prices may be more difficult to obtain however (subject to disclosure by the producer), and it may be difficult to reflect the heterogeneity of electrolytic projects.
Disadvantages May undermine market competition: once operational plants with lower input energy costs (e.g. electrolysers running on curtailed or dedicated renewable electricity) may face a competitive advantage as they would receive a higher subsidy per unit of volume compared to other producers and vice versa (e.g. for grid linked electrolysers).
Limited compatibility: isn’t dynamic to changes in carbon pricing policy – while carbon pricing may influence electricity prices (while unabated generation capacity continues to supply electricity) and to some extent gas prices (as extraction of natural gas is covered by the UK and EU ETS) there isn’t necessarily a strong correlation between the carbon price and reference price.
May not reduce support over time: input energy prices are not necessarily driven by dynamics in the hydrogen market, but supply and demand conditions in their respective markets (gas and electricity), which won’t necessarily result in a rising reference price.
Not suitable for future pipeline: input energy prices are not necessarily positively correlated with the market value of hydrogen and therefore not necessarily a good proxy of market price in the short or long term.
May not be good VfM: to extent that there may be a weak correlation between input energy costs and market value of H2, may over or under subsidise the producer; also risk of transfer pricing such that the business model could be indirectly subsidising a producer’s other operations (e.g., electricity production).

Analytical Annex
72
Further considerations
May need to consider indexation of input energy prices in strike prices to avoid perverse outcomes that could arise under this option e.g., if input energy prices are rising, support payments would fall at the same time as the cost of hydrogen production increases.
Natural gas price As a simplification of the previous option, under this option the reference price could be set as the natural gas price – irrespective of the producer’s primary input fuel. To some extent there is a positive correlation between the natural gas price and electricity price (as gas generation still plays a significant role in the electricity supply mix). However, there is also a link to the market value of hydrogen insofar as natural gas is the main high-carbon fuel that low carbon hydrogen is likely to displace.
Table 11. Assessment of natural gas price option
Considerations Assessment against key design principles
Advantages Investable: producers should be able to price their hydrogen at least as high as the natural gas price, which is likely to be the most common fuel from which users are switching. As natural gas is a liquid market (therefore has transparent and fairly predictable prices) producers should be able to manage any basis risk.
Promotes market development: akin to the option above, this option could facilitate price discovery, though potentially to a lesser extent for producers who are looking to sell their volumes at or below the natural gas price.
Avoids complexity: this option is simpler than the previous option as complexity around electricity prices is removed.
Disadvantages May undermine market competition: As per the previous option, this option could create a competitive advantage for some producers over others; and potentially introduce a basis risk for electrolytic technologies.
Limited compatibility: similar to the option above, as an internationally traded commodity, the natural gas price is not necessarily strongly correlated with the UK carbon price.
Reduces support over time: similar to the option above, it is not necessarily the case that natural gas prices will reduce over time and therefore neither the reference price.
Limited suitability for future pipeline: to some extent natural gas is a good proxy for the market price of hydrogen (in respect of volumes sold to end users switching from natural gas) however may not be representative of the market price in the long term.
May not be good VfM: this option faces similar risks to VfM as the previous option.
Further considerations
As with the preceding option, indexation may also be an important consideration. The carbon price could be included in this option (see option 7 in the consultation document) to better represent the willingness to pay for hydrogen of existing natural gas consumers and ensure compatibility with carbon pricing policy. However, the benefits of this may be

Analytical Annex
73
outweighed by the additional risks and complexity it introduces (see consideration of substitute fuel prices and carbon price reference price options below).
Substitute fuel price(s) Rather than being linked to one substitute fuel price, the reference price could instead be constructed around the substitute fuel price for every sale that the producer makes e.g., for volumes sold to an industrial facility the reference price could be the natural gas price, but for volumes sold to a local bus operator, diesel could be the reference price. If a different reference price is used for each transaction depending on the relevant substitute fuel, and the sales price was set on this basis, this would be akin to perfect price discrimination.
Alternatively, the reference price for any individual producer could be set as a weighted average of substitute fuel prices in the market segments into which the producer is selling their volumes e.g., if 50% of volumes are sold to an industrial customer and 50% to a local bus operator, the reference price could be set at 50:50 blend of natural gas and diesel prices.
Compared to previous options considered, this option is a closer reflection of the potential market value of hydrogen. However, the degree of correlation between this reference price option and the market price for hydrogen may weaken or reverse over time (for certain substitute fuels) as carbon prices increase.
Table 12. Assessment of substitute fuel price(s) option
Considerations Assessment against key design principles
Advantages Investable: if consumers’ willingness to pay for hydrogen is largely driven by their substitute fuel prices, this reference price option could be a good proxy for the market price producers might expect to receive, and therefore minimise basis risk compared to other options.
Suitable for future pipeline: this option is more suitable for the future pipeline than the previous options insofar as there is a clearer link to the expected market value of hydrogen.
Value for money: better VfM compared to previous options insofar as the reference price is likely to be closer to market value of hydrogen.
Disadvantages May undermine market development: if the reference price is set equal to the likely sales price to each segment of the market the producer may have limited incentive to build demand in higher value market segments as their overall revenue (market sales plus support payments) won’t be higher compared to selling in lower value markets. If it were instead set as a weighted average of substitute fuels producers could have incentive to ‘beat’ the reference price.

Analytical Annex
74
Limited compatibility: where some end users are within scope of the UK ETS, setting the reference price based on substitute fuel alone does not capture the additional carbon cost savings they could make.
Complexity: hydrogen producers are likely to serve a range of offtakers, each with a potentially different substitute fuel - many of which also do not have easily observable prices. The administrative burden of delivering the contract as a result, as well as the monitoring requirement (as the reference price would vary from offtaker to offtaker) make this option relatively complex. There is also a question of what an appropriate reference price would be for new energy consumers under such a model.
Doesn’t necessarily reduce support over time: ultimately depends on the extent to which substitute fuel prices rise, which in many cases depend on dynamics beyond our influence.
Further considerations
To improve compatibility and VfM it may be worth incorporating the carbon price into this option. A weighted average of substitute fuels, or using certain fuels as a proxy for others, may overcome some of the complexity and challenges with setting a different reference price for each substitute fuel for each user. However, this may also negatively affect some users’ incentives to switch.
Achieved sales price(s) Under this option, the reference price would simply be the average sales price the producer achieved for their volumes sold onto the market. This option represents a simplification of the preceding option. Rather than implementing a different reference price for every offtaker the producer supplies and every substitute fuel, this complexity is left with producers themselves. The value of the substitute fuel is therefore implicit rather than explicit; and ultimately the extent to which this option is positively correlated with the market value of hydrogen depends on the extent of pricing power the producer has – the producer could potentially set their sales price below users’ willingness to pay as the business model would still ensure they achieved their strike price.
Table 13. Assessment of achieved sales price(s) option
Considerations Assessment against key design principles
Advantages Investable: this option provides a perfect hedge to producers, ensuring predictability that their revenues would be sufficient to cover their costs and fair rate of return (as in the renewable electricity CfD).
Promotes market development: this option provides producers with more flexibility over pricing compared to previous options to attract sales; we therefore expect this to lead to quicker market penetration (notwithstanding any distribution constraints).
Promotes market competition: as the level of support will vary for each plant based on their own sales this reference price option is not expected to distort competition between different producers.
Analytical Annex
75
Compatible: implicitly this option is compatible with other policies insofar as the achieved sales price reflects end users’ willingness to pay - which is a function of other policy costs (e.g. carbon costs).
Avoids complexity: relatively simple compared to other options and has an added benefit of requiring disclosure of sales prices which could facilitate developing a market benchmark.
Disadvantages Not suitable for future pipeline: in the long term the price achieved for individual transactions may not be representative of the market price once a market benchmark has emerged.
Does not reduce support over time: this option by itself does not provide any reward / incentive for price discovery, therefore the level of support is not likely to reduce over time.
Risk to VfM: there is a high degree of moral hazard risk, i.e. that producers will be incentivised to under-price volumes sold as the business model will always cover the difference. There is therefore risk of excessive subsidy.
Further considerations
This option is the closest representation to the market price in the absence of a market benchmark. However, it may be desirable to combine this option with a floor on the reference price to mitigate the risks described above; and similarly, introduce an additional incentive mechanism to encourage price discovery.
Market benchmark price(s) Under this option, the reference price could be set based on a market benchmark price for hydrogen akin to benchmark prices produced by independent parties for other commodity markets (and used as reference points for contracts in these markets). It may be the case that while the market is still developing, benchmarks are produced at regional level, before eventually reflecting a national (‘the’) market price for hydrogen.
While the reference price under this option would reflect the actual value of hydrogen sales in the market, the extent to which any individual producer will influence its value is more limited compared to the previous option.
Table 14. Assessment of market benchmark price(s) option
Considerations Assessment against key design principles
Advantages Investable: a liquid market benchmark would provide the clearest indication of the market value of hydrogen. There is likely to be some basis risk for producers in the earlier years of market development, however as the market develops producers should be able to manage this.
Promotes market development: producers are incentivised to beat the benchmark by seeking more and higher value sales in the market.

Analytical Annex
76
Promotes market competition: as producers are incentivised to beat the benchmark, this introduces more competition in the market.
Compatible: as with the previous option, this option is compatible with other policies (e.g. carbon pricing) to the extent that end users’ willingness to pay will be implicit in the market benchmark.
Reduces support over time: compared to other options, producers have more incentive to seek higher value sales. The market benchmark over time should therefore rise and facilitate reduction of subsidy over time.
Suitable for future pipeline: this is the best proxy for the market benchmark price akin to the wholesale electricity price or National Balancing Point gas price, and so would be appropriate for future contracts (notwithstanding the point on complexity below).
VfM: as the best reflection of the market value of hydrogen, using this reference price should provide a fair level of subsidy to producers, but minimise the level of support payments under the contract.
Disadvantages Complexity: this option is unlikely to be deliverable for early rounds of contract award as a reliable market benchmark will take time to emerge. Even if it emerges after a few years, it would be difficult to integrate into existing contracts. Otherwise, as a longer-term reference price option, this approach would be relatively simple.
Further considerations
This option would be the ideal reference price however as the market is at an early stage of development any benchmark currently is unlikely to be viable. The market benchmark could be incorporated into an additional incentive mechanism within the contract instead, which could help transition to the market benchmark as reference price for future contracts.
Carbon price Under this option, the reference price could be set as the UK ETS carbon market price, analogous to business models in other countries such as the SDE++ scheme in the Netherlands. Rather than providing payments on a £/MWh basis (i.e., on produced volumes), the business model would provide payments on a £/tCO2 basis. The strike price would then reflect the required revenue to make low carbon hydrogen production competitive against the substitute fossil fuels in the producer’s target market.
Table 15. Assessment of carbon price option
Considerations Assessment against key design principles
Advantages Compatibility: setting the reference price as the carbon price ensures that carbon pricing policy is explicitly considered in the business model design, and support payments are responsive to evolving carbon prices.

Analytical Annex
77
Reduces support over time: as we expect carbon prices to rise over time, and therefore low carbon hydrogen to become more competitive with substitute fossil fuels, the level of support under this option should reduce over time.
Disadvantages Not investable: immaturity of the UK ETS and uncertainty over how it will evolve over the next decade may undermine the investability of the business model if investors perceive the risks to be too high; basis risk is likely to be a key concern for producers as the carbon price is only one of the drivers of market value and production costs.
May not promote market development: as the reference price is linked to the carbon price, this may discourage producers from selling into end use markets currently not subject to carbon pricing policy.
May undermine market competition: as the level of subsidy is not explicitly linked to the costs of producing hydrogen, carbon prices rise and hydrogen production costs fall, early market entrants may be unfairly disadvantaged compared to later entrants.
Complexity: it may be difficult to determine appropriate (and sufficiently transparent) strike prices for producers. Uncertainty over future carbon prices may also make estimating future cashflows and funding requirements more challenging.
Not suitable for future pipeline: once carbon prices have risen and/or hydrogen production costs have fallen to the point where hydrogen is competitive with substitute fossil fuels, the carbon price is unlikely to drive the value of hydrogen – and therefore not represent a good proxy for the market price in the longer term.
Risks to value for money: there is the potential for gaming and distortions between the carbon market and hydrogen market, and risk of excessive subsidy if producers seek higher strike prices to mitigate against carbon price uncertainty.
Further considerations
This sort of business model may be more appropriate if targeted towards end users (including production projects developed for onsite end use) who fall within scope of UK ETS policy. This similarly applies to existing (grey) hydrogen producers within scope of the UK ETS (and eligible instead for the ICC business model).49
Natural gas plus carbon price This option represents the combination of option 2 (natural gas price) and option 6 (carbon price). It is intended to represent the willingness to pay for hydrogen of the most common end users, as a proxy for the average market price. The advantages and disadvantages of this option are therefore a combination of options 2 and 6.
Consideration of reference price options against key design principles The table below summarises our assessment of the reference price options considered to date:
49 BEIS (2020), ‘Carbon capture, usage and storage (CCUS): business models’ (viewed on 18 June 2021).

Analytical Annex
78
Table 16. Overview of assessment of reference price options
Principle Input fuel
Natural gas
Subs. Fuel
Sales price
Market b’mark
CO2 price
Natural gas + CO2
Investable Amber Amber Amber Green Amber Red Amber
Promotes market development
Green Green Amber Green Amber Red Amber
Promotes market competition
Red Red Amber Green Amber Amber Amber
Compatible Red Red Amber Amber Amber Amber Green
Avoids complexity
Amber Green Red Amber Red Amber Amber
Reduces support over time
Red Amber Amber Red Green Green Green
Suitable for future pipeline
Amber Amber Amber Red Green Red Amber
Value for money
Red Amber Amber Amber Green Amber Amber
All of the above options individually have drawbacks which could undermine their effectiveness as a reference price for a contract that is negotiated or signed in the 2020s, given how nascent the hydrogen market is. The best proxy of the market price, in the absence of a liquid market benchmark over the next few years, is the actual achieved sales price of the producer. However as set out above there are risks associated with adopting this option as the reference price.
These risks could be addressed by introducing a floor to the reference price. Based on the considerations in the preceding section, we believe the natural gas price may be a suitable floor, given it is the most common fuel from which end users to switch – who should therefore be willing to pay at least as much for hydrogen.
It is also worth considering additional levers within the business models contract which could help incentivise producers to increase the sales price achieved and avoid sales remaining at the natural gas price floor for the duration of the contract. Additional contractual measures,

Analytical Annex
79
such as a gainshare mechanism (see the Business Models consultation for further consideration) or a periodic payment linked to achieving (or exceeding) a defined price threshold / benchmark, could be options for this.
In the longer term, when a sufficiently liquid and robust market benchmark becomes available we consider this to be the best reference price option. Depending on when this occurs, it may be that future projects beyond the initial FOAK projects transition to this reference price.
Volume support
Options for volume support
Price support can be provided to help ensure that price received for unit of hydrogen sold covers its production cost, but producers need to be producing and selling enough hydrogen to gain revenue to sufficiently cover total costs (including fixed costs, debt and equity returns). To do this they need to find offtakers i.e. businesses that will actually purchase volumes from the producer. We expect producers to be largely responsible for finding their own offtakers (and that they wouldn’t see to enter the market in the first place if they expected no demand). However, we acknowledge that given the nascent state of the market and barriers described in earlier sections, there may be a role for government in providing support and helping producers manage volume risk. This could be provided outside of the business model (e.g. by providing support for fuel switching to end users directly) and/or within the design of the business model (through volume support). This section only considers the latter.
We have considered the following options for providing volume support to producers within the business model design:
1. Availability-based payments50: the producer’s strike price is split into its fixed costs and variable costs, for which the government will provide two separate support payments. For the fixed cost component, the government would provide a payment to the producer which allows them to make a minimum economic return irrespective of whether they have sold any volumes of hydrogen onto the market (an availability payment). For variable costs, incurred when the producer is actually producing hydrogen, a variable premium will be paid on volumes sold onto the market.
2. Partial government offtake: the government agrees to purchase a specific quantity of produced volumes for a specific duration under the contract at a price which allows the producer to make a minimum economic return (in this case, where the producer is actually producing volumes, we would expect this to be their strike price including variable costs as well as fixed costs). A variable premium will be paid on further volumes produced and sold onto the market. Government could opt to settle volumes physically (i.e. take the volumes produced and use or remarket them) or financially (i.e.
50 This option is akin to the split revenue stabilisation model shortlisted by Frontier Economics in a report commissioned by BEIS last year. Frontier Economics (2020), ‘Business Models for low carbon hydrogen production’ (viewed on 18 June 2021).
Analytical Annex
80
not take volumes but recompense the producer for their value). The latter would be akin to an availability payment, however under this option the government would be able to choose whether to invoke it, rather than it being inherent to the model design.
3. Backstop government offtake: the government agrees to purchase any volumes produced for which commercial offtakers have not been found (below the producer’s target level of sales). The price government would pay for these volumes would need to be carefully considered, however is likely to be lower than the strike price. As above, a variable premium will be paid on volumes sold onto the market; and government could similarly opt to ‘take’ the residual volumes or instead ‘pay’ for them. The key difference between this option and the option above is uncertainty around the volume of hydrogen government for which government would be liable; this could be 0% of produced volumes or potentially 100%.
4. Frontstop government offtake: the government places an order upfront for a specific quantity of produced volumes that it will purchase at a price which allows them to make a minimum economic return. If a commercial offtaker (or offtakers) is (are) found, the producer will first sell the volumes government has ordered before then selling additional volumes. Once the government ordered volumes are sold onto the market, no further volume support will be provided. If no commercial offtakers are found, the government will redeem its order – however as with the options above can choose to ‘take’ or ‘pay’. The key difference between this option and the backstop is certainty over the maximum volume of hydrogen for which government would be liable; however, unlike the partial government offtake option this liability is still contingent.
5. Sliding scale payment: the government does not purchase any hydrogen under this option, and therefore does not guarantee volumes or a minimum economic return to the producer. However, this option does reduce the volumes the producer would need to sell to recover its minimum economic return: the business model would allow the producer to earn higher unit prices on its initial volumes (to help recover fixed and marginal costs of production) which declines as their volumes increase. The business model would therefore provide lower unit prices on later volumes (to recover only marginal costs and remainder equity returns).
Each of these is options is explored in more detail below. Note: where relevant in the following sections, we assume price support (a variable premium) is provided on any volumes produced and sold onto the market.
Availability-based payment Under this option, the business model would provide an availability payment irrespective of whether the producer produced any volumes of hydrogen. However, for volumes produced and sold onto the market, the producer would also receive price support (variable premium).

Analytical Annex
81
Box 15. Illustration of availability-based payment option
The illustration assumes an availability payment per MW of productive capacity, which covers the producer’s fixed costs, debt repayment, and 50% equity return. A variable premium (based on the same assumptions as in box 12) is assumed for volumes produced and sold to commercial offtakers.
Figure 26. Illustration of availability-based option
Explanatory notes:
1. Here, the producer is ramping up volumes, and the primary driver of its profitability is the combination of market revenue and price support.
2. Here, demand for volumes declines (e.g. due to loss of its main offtaker). The producer continues to receive a fixed level of support payments through the availability payment, however this becomes a larger driver of their profitability.
3. In this ‘trough’ period, the plant is either dormant or running intermittently due to low offtake. The capacity payment is the primary driver of profitability; and provides breathing space to find new offtakers.
4. As commercial offtake ramps up, and overall market conditions become more supportive of hydrogen without support, the primary driver of profitability is market revenue, which far exceeds breakeven. However, the plant continues to receive capacity payments until the end of the contract.
Analytical Annex
82
Table 17. Assessment of availability-based payment option
Considerations Assessment against key design principles
Advantages Investable: the producer is guaranteed a minimum economic return irrespective of whether offtakers are found.
Disadvantages Does not promote market development: if producers can make a sufficient return on the availability portion of the support payment they may not be incentivised to seek and build demand for produced volumes.
May not promote market competition: as the market price of hydrogen rises over time the capacity payment would likely lead to over subsidy (as the rising market price should be sufficient to support a minimum economic return). This could confer an enduring competitive advantage to recipients.
Does not reduce support over time: the availability payment is an enduring model feature; the value of payments could be adjusted over time however it would be difficult to reduce or remove it entirely.
Not suitable for future pipeline: typically availability/capacity payments exist in markets where there is high variability in demand, full fungibility of the product being traded, and limited ability to store the product. These characteristics mean capacity payments have been useful in the electricity market (for example). However we do not expect these to be enduring characteristics of a low carbon hydrogen market – and therefore not necessarily needed for future NOAK projects, but more difficult to remove.
Risk to value for money: if producers are only incentivised to build and not also run their plants this option does not help achieve our strategic objectives and may therefore not be value for money. Could also lead to excessive returns if producers refinance their plant once de-risked to open up an equity return that may not have been included in setting the capacity payment.
Further considerations To some extent some of these disadvantages could be mitigated by setting a lower price for the availability portion of the payment such that producers would still need to run their plant and find offtakers to earn a minimum economic return. A gainshare mechanism above a certain return threshold could also be introduced to help mitigate the risks of over subsidy.
Partial government offtake Under this option, the government would agree to purchase a specific volume of hydrogen from the producer at a price that covers their minimum economic return on that volume produced. For volumes then produced and sold onto the market, the producer would also receive price support (variable premium).

Analytical Annex
83
Box 16. Illustration of partial government offtake option
The illustration assumes that 25% of productive capacity is subject to government offtake, for which government pays a price covering the marginal cost of production plus 67% of fixed costs but no contribution to equity return on this volume. A variable premium (based on the same assumptions as in box 12) is assumed for volumes produced and sold to commercial offtakers.
Figure 27. Illustration of partial government offtake option
Explanatory notes:
1. Here, producer’s capacity is fully contracted, however some of these volumes purchased by government may have otherwise been purchased by commercial offtakers.
2. Here, as in the illustration of the previous option, the producer loses its main commercial offtaker, and therefore government offtake becomes a proportionately greater driver of the plant’s profitability.
3. Here, government is the only source of revenue for the producer. However, given the price paid for government purchased volumes is not assumed to cover total production costs, without commercial offtakers the producer may lose profitability.
4. Over time, if new commercial offtakers are found and the market price increases, market revenues will become the primary driver of profitability. The government is still contracted to purchase 25% of volumes in this example, however could benefit from

Analytical Annex
84
selling its volumes on the market (at a higher price than purchased) if offtakers can be found.
Table 18. Assessment of partial government offtake option
Considerations Assessment against key design principles
Advantages Investable: this option reduces volume risk for the producer and provides confidence that a minimum economic return will be achieved.
Can reduce support over time: can be structured such that government purchases a decreasing proportion of a producer’s volumes over time. Government could also remarket the volumes purchased at a higher value as the market develops, offsetting its support costs.
Can be suitable for future pipeline: as above, the offer of government offtake can be reduced / removed from subsequent contracts if no longer needed to support NOAK projects.
Disadvantages May undermine market development: risk that government crowds out commercial sources of demand. Government unlikely to be as effective as private producers at remarketing any physical volumes purchased, however if purchasing a fixed and certain volume it may be easier to secure back-to-back contracts with offtakers.
May undermine market competition: may confer competitive advantage to first contracts or distort competition in the market depending on where volumes are sold on. On the other hand, government could also increase competition in the market through its own participation.
Complex: significant considerations must be made around how government would develop the institutional capability to purchase, manage, and sell physical volumes of hydrogen (potentially to numerous counterparties). This function could be contracted out, however would still involve significant administrative burden. This option does however provide relative certainty over the budget needed for support payments.
Risk to value for money: significant consideration is what government does with the volumes purchased – they can be sold on and used, stored, flared or vented. If volumes are not used no benefit is realised on these units and government offtake may represent poor value for money.
Further considerations Government could seek to mitigate some of the disadvantages described above by significantly limiting the volumes it would agree to purchase from any individual producer (and in total), though this may trade off with having to offer higher unit prices for volumes purchased to still allow producers to make a minimum economic return. Government could also seek to limit ex ante the number of years within the contract in which we would agree to purchase
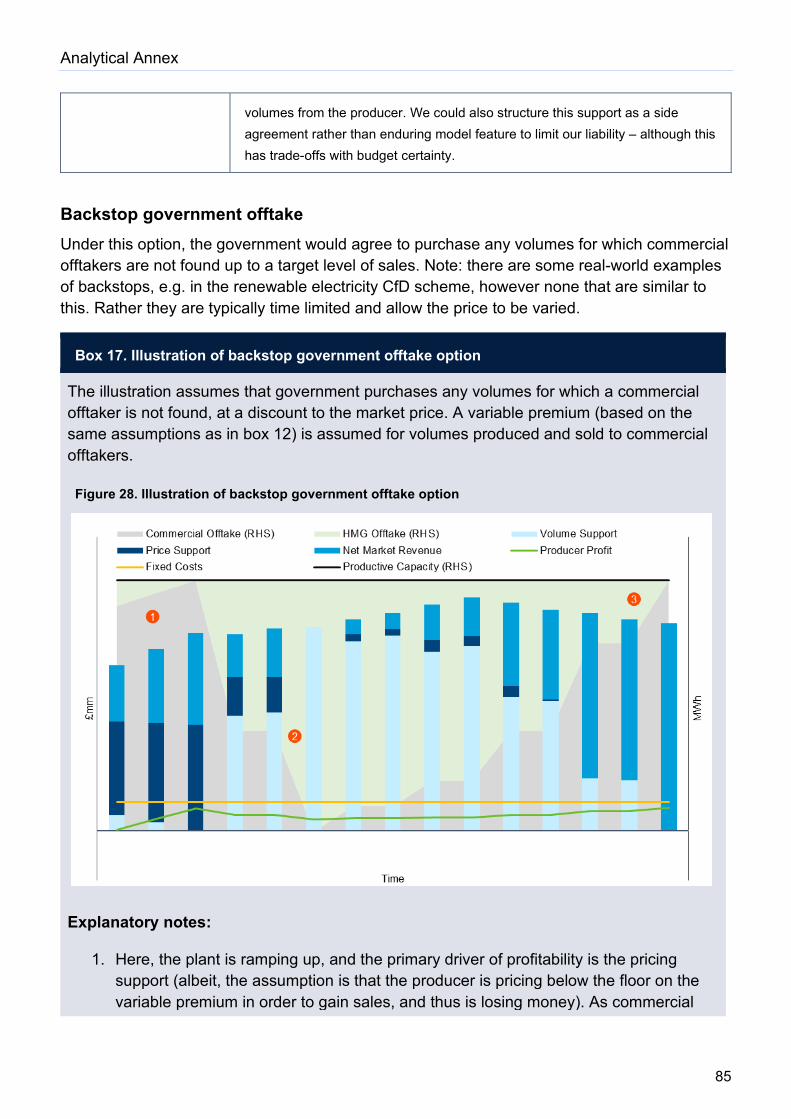
Analytical Annex
85
volumes from the producer. We could also structure this support as a side agreement rather than enduring model feature to limit our liability – although this has trade-offs with budget certainty.
Backstop government offtake Under this option, the government would agree to purchase any volumes for which commercial offtakers are not found up to a target level of sales. Note: there are some real-world examples of backstops, e.g. in the renewable electricity CfD scheme, however none that are similar to this. Rather they are typically time limited and allow the price to be varied.
Box 17. Illustration of backstop government offtake option
The illustration assumes that government purchases any volumes for which a commercial offtaker is not found, at a discount to the market price. A variable premium (based on the same assumptions as in box 12) is assumed for volumes produced and sold to commercial offtakers.
Figure 28. Illustration of backstop government offtake option
Explanatory notes:
1. Here, the plant is ramping up, and the primary driver of profitability is the pricing support (albeit, the assumption is that the producer is pricing below the floor on the variable premium in order to gain sales, and thus is losing money). As commercial
Analytical Annex
86
offtake does not account for 100% of capacity, the government (as offtaker of last resort) takes a small volume.
2. Government offtake fills the ‘gap’ as volumes purchased by commercial offtakers decline. Here the majority of the producer’s revenues therefore come from the government under the business model.
3. Improved market conditions and new commercial offtakers mean that the call on the offtaker of last resort diminishes, and eventually the sole driver of profitability becomes market revenue.
Table 19. Assessment of backstop government offtake option
Considerations Assessment against key design principles
Advantages Investable: by agreeing to purchase any volumes produced for which a commercial offtaker has not been found, government eliminates the producer’s volume risk.
Reduces subsidy over time: as the market develops it is likely the backstop will be called on less frequently (or in decreasing volumes), however this is not certain (see VfM consideration below).
Disadvantages Does not promote market development: provides little incentive for producers to seek market demand for their hydrogen as government will purchase any volumes remaining required for the producer to earn a minimum economic return; or otherwise incentivises producers to pursue lower quality offtakers as government will ultimately bear the risk of these offtakers defaulting.
May undermine market competition: similar to under partial offtake; however greater risk that government undermines market competition given purchase of potentially much higher volumes. There are risks that government gives a competitive advantage to the poorest projects which ‘fail’ first; distorts competition in the market and results in offtakers waiting for backstop volumes rather than contracting directly with producers if they believe they might pay a lower price.
Not suitable for future pipeline: may be difficult to remove from successive contracts (even if no longer required as the market developed) if recipients of earlier contracts still benefit from the support. This may occur if producers have more pricing power with the ‘failsafe’ of a backstop.
Complex: similar to the partial offtake option; however unlike that option the significant contingent liability of the backstop makes it more challenging to manage (or contract a third party to manage) any volumes purchased and have certainty over the support budget.

Analytical Annex
87
Poor value for money: the model may incentivise surplus production, or lead to moral hazard – higher likelihood of the backstop being invoked as producers can contract with risker offtakers without paying for this. If volumes are produced for which there are no offtakers benefits of H2 use at risk of not being realised (likely if reason government is stepping in is because of lack of commercial offtake); also risk of government failure if government is not better than producers at finding quality offtakers…
Further considerations To mitigate some of the disadvantages considered above, government can set a lower price beyond what would be required to fully compensate the producer so that they have an incentive to find good commercial offtakers first (though this also creates risks). The business model could also be structured to limit the backstop (in volume and/or duration).
Frontstop government offtake Under this option, the government would agree to purchase a specific quantity of produced volumes that a price which allows the producer to make a minimum economic return. If a commercial offtaker (or offtakers) is (are) found, the producer will first sell the volumes government has ordered before then selling additional volumes. For volumes then produced and sold onto the market, the producer would also receive price support (variable premium).

Analytical Annex
88
Box 18. Illustration of frontstop government offtake option
Here is it assumed that the front stop price is equivalent to the producers’ breakeven cost of production including an equity return premium, constrained by a cap of a 66.6% premium or 5% discount to the prevailing market price. A variable premium (based on the same assumptions as in box 12) is assumed for volumes produced and sold to commercial offtakers.
Figure 29. Illustration of frontstop government offtake option
Explanatory notes:
1. In the early phase where commercial offtake is strong, physical utilisation of the front stop is not required. However, as market prices are still below the front stop price, HMG makes a mark to market payment on those volumes that are resold. This gives a boost to profitability that isn’t necessarily needed by the producer.
2. Demise of the major offtaker leads to the producer falling to loss, but this is partially offset by the full contribution of the front stop, which accounts for the majority of volumes whilst replacement offtakers are found.
3. Increased commercial offtake means that the call on the front stop diminishes, though the discounted nature of volumes compared to market prices at this point mean that profitability recovers more slowly.
4. Front stop no longer delivering any financial benefit to the producer, as all volumes are now sold under commercial offtake, and all revenues are now market derived. However, the discounted volumes under the front stop mean that the producer is

Analytical Annex
89
unable to extract maximum profit from the market as some accrues to HMG via the front stop volumes.
Table 20. Assessment of frontstop government offtake option
Considerations Assessment against key design principles
Advantages Investable: this option reduces volume risk for the producer and provides confidence that a minimum economic return will be achieved. However, as the frontstop is limited to a specific quantity defined upfront, volume risk is not eliminated as in the backstop option.
Promotes market development: producers are incentivised to find commercial offtakers as once the frontstop is used the support ends.
Reduces subsidy over time: the contract could be structured to reduce the volume support over time (as with the partial offtake option), and as the market develops the likelihood of the frontstop being triggered reduces.
Suitable for future pipeline: as with the partial offtake option, the frontstop offtake volume can be reduced over subsequent contracts without resulting in an enduring advantage to recipients of earlier contracts.
Disadvantages May undermine market competition: in a similar way to the partial offtake option, however this is dependent on how the frontstop volumes that government may purchase are priced.
Complex: like the partial offtake option, however reduced likelihood of government having to deal with any volumes of hydrogen. While there is a contingent liability under this option, government has certainty over the maximum liability it would face.
Risk to value for money: as with the partial offtake option, a significant consideration is what government does with the volumes purchased – if volumes are not used no benefit is realised on these units and government offtake may represent poor value for money. However the likelihood of government having to offtake in this option is very low in comparison.
Further considerations This option has the advantages of the preceding options but mitigates some of the disadvantages. Putting limits on the volume and/or duration of the front stop may mitigate some of the disadvantages of this option (though government may have to offer producers a higher price on these units as a result to make this investable).
Sliding scale Under this option, the business model would allow the producer to earn a declining level of unit cost support as volumes increase – first volumes recover fixed costs and marginal costs, last
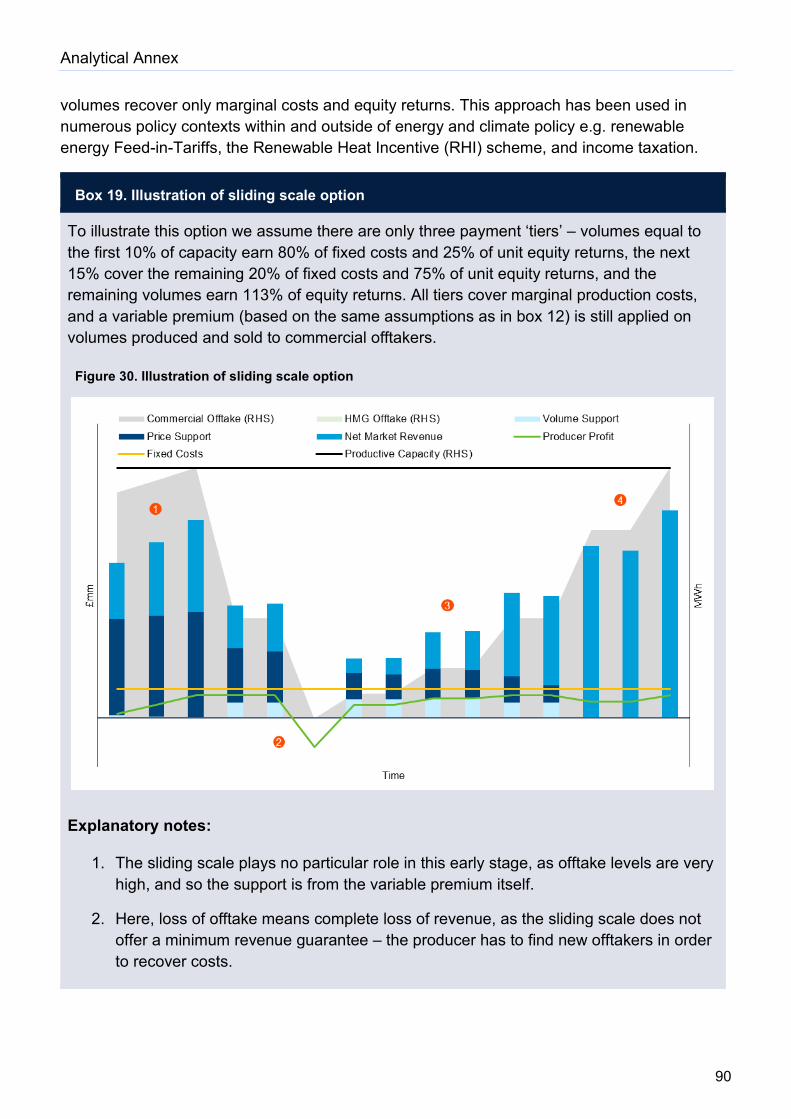
Analytical Annex
90
volumes recover only marginal costs and equity returns. This approach has been used in numerous policy contexts within and outside of energy and climate policy e.g. renewable energy Feed-in-Tariffs, the Renewable Heat Incentive (RHI) scheme, and income taxation.
Box 19. Illustration of sliding scale option
To illustrate this option we assume there are only three payment ‘tiers’ – volumes equal to the first 10% of capacity earn 80% of fixed costs and 25% of unit equity returns, the next 15% cover the remaining 20% of fixed costs and 75% of unit equity returns, and the remaining volumes earn 113% of equity returns. All tiers cover marginal production costs, and a variable premium (based on the same assumptions as in box 12) is still applied on volumes produced and sold to commercial offtakers.
Figure 30. Illustration of sliding scale option
Explanatory notes:
1. The sliding scale plays no particular role in this early stage, as offtake levels are very high, and so the support is from the variable premium itself.
2. Here, loss of offtake means complete loss of revenue, as the sliding scale does not offer a minimum revenue guarantee – the producer has to find new offtakers in order to recover costs.

Analytical Annex
91
3. Although offtake volumes are at a very low level, the sliding scale means that plant achieves profitability with only 20% capacity utilisation – compared to ~60% in the absence of a sliding scale.
4. As offtake continues to build, the impact of the sliding scale once again disappears, and 100% of revenue is derived from the market itself due to improved market price conditions.
Table 21. Assessment of sliding scale option
Considerations Assessment against key design principles
Advantages Investable: this option does not fully protect the producer from the volume risk, however reduces it by reducing the volumes they would need to sell to recover a minimum economic return.
Promotes market development: as the producer needs to be producing hydrogen to benefit from the volume support, they have an incentive to find and build demand.
Promotes market competition: this option avoids potential negative distortions that may result from government participating in the market (as it would under the offtake options considered above).
Reduces support over time: by design as produced volumes increase the level of support from the sliding scale falls. Therefore as the market develops the level of volume support provided by the business model is expected to reduce over time.
Suitable for future pipeline: this option can be relatively easily adapted to future projects between contracts by amending the scale that applies to each unit of volumes.
Value for money: as volume support is only provided if the producer is producing it is more likely to ensure volumes are used and the benefits of this are realised. There is a risk of over (or under subsidy) however if the sliding scale payments are not set at the right level.
Disadvantages Complex: relatively simpler to administer compared to options where government must manage physical volumes, however complexity in setting appropriate payment structure and interaction with the variable premium applied to the same volumes of hydrogen.
Further considerations This option addresses many of the disadvantages of the other volume support options considered as it does not require physical delivery or payment for non-production of hydrogen. However setting an appropriate sliding scale is a significant consideration to ensure the option is investable while also achieving value for money.

Analytical Annex
92
Consideration of volume support options against key design principles As with the price support options, the table below summarises our assessment of the volume options considered above.
Table 22. Overview of assessment of volume support options
Design principle Availability-based
Partial offtake
Back-stop
Front-stop
Sliding scale
Investable Green Amber Green Amber Amber
Promotes market development Amber Amber Red Green Green
Promotes market competition Red Amber Red Amber Green
Avoids complexity Green Red Red Red Amber
Reduces support over time Red Green Amber Green Green
Suitable for future pipeline Red Green Amber Green Green
Value for money Red Amber Red Amber Amber
Based on the assessment above, we consider the sliding scale to be the best option for volume support to producers. This option best balances investability from the perspective of producers and value for money from the perspective of government. This option is also expected to minimise the negative distortions and/or unintended consequences as a result of government intervention in the market of which most of the other options considered are at risk.
However, it is important that the sliding scale itself is designed appropriately for these benefits to be realised. In particular, there is a risk that the way the scale itself is defined leads to perverse incentives / undermines our principle for the model to be size agnostic. If the sliding scale is set based on tiers which are fixed (i.e., based on a certain £/MWh up to a certain absolute volume), it is likely to over incentivise small production plants over large as producers may get more subsidy overall by keeping their volumes low and staying in the highest payment tier. Setting the sliding scale on a ‘continuous’ basis rather than discrete / tiered may be a better approach.
Analytical Annex
93
6. Low Carbon Hydrogen Standard The NZHF and the hydrogen business model will help support the deployment of new low carbon hydrogen production. However, there is currently no agreed definition of ‘low carbon’ hydrogen in the UK. We are therefore consulting on options for a low carbon hydrogen standard, which would set out the methodology for calculating greenhouse gas emissions of hydrogen production and define a greenhouse gas emissions threshold for hydrogen to be considered low carbon. The standard is likely to form part of the eligibility criteria for projects seeking BEIS support through the NZHF and the hydrogen business model and could also be developed into a certification scheme. This chapter focusses on the rationale for low carbon hydrogen standards in the context of the wider hydrogen economy, using the market barriers framework set out in chapter 2.
Alongside the consultation, we have published a report by E4tech and the Ludwig-Bölkow-Systemtechnik (LBST)51. This report provides the detailed evidence underpinning the specific proposals in the consultation, including:
• Case studies of existing low carbon hydrogen standards
• Lifecycle assessments (LCAs) estimating greenhouse gas emissions from a selection of hydrogen production pathways and downstream hydrogen distribution chains
• Options for methodological choices used within a standard
• Assessment of options against criteria for a successful standard
Evidence from the E4Tech report and low carbon hydrogen standard consultation will be used alongside further internal analysis to develop the standard. Detail on our findings will be set out in the Government Response to the consultation
Rationale for a low carbon hydrogen standard
Barriers to the establishment of a hydrogen economy are set out in Chapter 2. By addressing these barriers, the standard contributes to delivering some of the outputs, outcomes and impacts shown in the hydrogen economy Theory of Change in Figure 10, and ultimately to delivering net zero, one of the government’s strategic objectives.
A low carbon hydrogen standard can help to address the policy and regulatory uncertainty market barrier for hydrogen producers. The government sees low carbon hydrogen as a crucial part of delivering our net zero target, but, due to the immaturity of the hydrogen market, has not defined what ‘low carbon’ means. This can be seen as a form of imperfect information for investors as they cannot be sure that the projects they are developing are consistent with the government’s view of low carbon hydrogen. In turn, this uncertainty translates into a risk of
51 E4tech and LBST (2021), ‘Report on a Low Carbon Hydrogen Standard’ (viewed in July 2021).

Analytical Annex
94
stranded assets if future policy decisions on the definition of low carbon hydrogen markedly changed the operating environment for their projects.
The standard will give investors clarity on this definition, so they can develop projects with confidence that they are compatible with government’s strategic direction. As the standard will likely be used as eligibility criteria for government support, it will also help improve policy certainty regarding short-term decisions by developers on projects that could apply for support. Finally, the standard could facilitate international trade in hydrogen if it is designed to be compatible with other certification schemes.
The standard could also help build confidence in the hydrogen market as a whole and, as a result, help tackle the interrelated barriers of demand and supply uncertainty for producers and end users respectively. Users currently have no way to know whether the hydrogen they are using is low carbon or not. Having a standard and a certification mechanism could give users confidence that the hydrogen they use is truly low carbon. That, in turn, could give producers greater certainty they will find a market for their product, contributing to greater supply stability for users.
Addressing these barriers will help enable more hydrogen production facilities to be built, contributing to delivering our 5 GW ambition in 2030; this will result in lower greenhouse gas emissions. It will also encourage low carbon hydrogen use across end use sectors, contributing to developing a mature low carbon hydrogen market.

This publication is available from: www.gov.uk/government/publications/uk-hydrogen-strategy
If you need a version of this document in a more accessible format, please email [email protected]. Please tell us what format you need. It will help us if you say what assistive technology you use.