hydrogen and palladium foil. two classroom demonstrations
TRANSCRIPT

Web version from author
1
Hydrogen and palladium foil. Two classroom demonstrations.
Elsbeth Klotz and Bruce Mattson*, Department of Chemistry, Creighton University, Omaha,
Nebraska 68178 *e-mail address: [email protected]
Background information. Upon passing hydrogen over palladium, an interstitial hydride is
formed in which hydrogen atoms occupy octahedral holes in the cubic close-packed palladium
lattice. It is believed that hydrogen molecules dissociate into atoms at the palladium surface and
the atoms readily migrate from hole to hole throughout the palladium. There are a number of
remarkable facts about this process:
1. Molecular hydrogen, despite its extraordinarily large bond dissociation energy of 436
kJ/mol, readily dissociates in the presence of palladium at temperatures as low as 37 K
with little activation energy (1, 2).
2. At temperatures above 50 K, hydrogen atoms migrate from hole-to-hole throughout the
palladium (1).
3. Palladium hydrides are non-stoichiometric, forming PdHn, where n = 0 – 0.7 (2, 3).
Because there are four Pd atoms and four octahedral holes per unit cell, the theoretical
maximum stoichiometry is Pd1H1 so that the experimentally observed maximum
stoichiometry, PdH0.7, represents 70% of the octahedral holes filled.
4. At its maximum stoichiometry, palladium has absorbed 935 times its volume at STP in
hydrogen gas.
5. The absorption of hydrogen is so efficient, that E. W. Morley used palladium as a
“vessel” to weigh hydrogen in his 1890 paper on the composition of water (4).
6. For lower H:Pd ratios, PdH0 - 0.02, the nature of palladium remains very much like that of
pure Pd and is referred to as the α-phase. The most notable difference between pure Pd
and the α-phase is that the latter has a slightly lower conductivity and its unit cell
dimensions are slightly larger. A β-phase occurs along with the α-phase for PdH0.02 - 0.58
and the β-phase exists exclusively for PdH0.58 - 0.7 (3). The β-phase differs from the α-
phase in that the material becomes increasingly brittle as the H:Pd ratio increases and for
PdH>0.5 the material is a semi-conductor (3).
7. The hydrogen atom density in PdH0.7 is greater than that of pure liquid hydrogen. (5)
Web version from author
2
8. Palladium hydride readily releases H2 by the reverse process of hydrogen absorption.
There is an important commercial application of this process: hundreds of thousands of
cubic meters of highly pure hydrogen are produced daily by passing H2 through
palladium metal (3). Aside from D2, no other substance can pass through Pd metal, not
even helium.
Description
In the first classroom demonstration, students will observe the rapid reaction between H2
gas and Pd metal. There is a color change for Pd and a noticeable increase in brittleness. Within
one minute, the Pd has absorbed close to the literature maximum of PdH0.7. In the second
classroom demonstration, the kinetics of H2 uptake is determined, and yields a zero-order rate
law. Along with the results of the two demonstrations, several other experimental results can be
added to a classroom discussion that should guide the students to conclude that the experimental
conditions for Demonstration 2 result in H2 mass transport-limited kinetics. Both classroom
demonstrations use the same apparatus, but are otherwise mutually independent.
Possible modifications
These demonstrations can be simplified by not undertaking such a rigorous data analysis.
Simply noting that H2 uptake is constant is enough to conclude the process is zero order; 2.
These activities could be developed into a 3-hour laboratory experiment.
Learning Outcomes
By observing either of these classroom demonstrations, students will (a) see a remarkable
chemical phenomenon, (b) learn important descriptive inorganic chemistry related to palladium
and hydrogen storage, (c) learn about non-stoichiometric, interstitial hydrides, and (d) collect
data and perform calculations based on general chemistry concepts such as the ideal gas law.
Additionally, observers of Demonstration 2 will (e) be able to collect data that can be used to
determine the order of the chemical reaction Pd(s) + n/2 H2(g) PdHn(s), and (f) use the data
and the rate law to determine the rate constant for the reaction.

Web version from author
3
Procedure
Equipment and chemicals
Aquarium bubbler tubing, 1/4–inch (6.36 mm) O.D., 4 mm I.D., 1.5 m (5 ft); small diameter
Tygon tubing can also be used
Food coloring
Source of inert gas such as Ar or N2.
Source of hydrogen, H2
Bunsen burner
4-way stopcocks with Luer-Lok1
piece of palladium foil2
60-mL plastic syringes with Luer-Lok
Luer-Lok syringe caps3
tweezers
Apparatus
The apparatus for these two demonstrations is shown in Figure 1 and uses two 60-mL
plastic syringes. A “4-way” valve1 is used to connect a hydrogen-filled syringe to a syringe
containing a piece of Pd foil2 as well as to a 1.5 m length of clear aquarium bubbler tubing (or
small diameter Tygon tubing or equivalent.)

Web version from author
4
Figure 1. The experimental apparatus. The piece of palladium foil is shown in the syringe.
Purge Gas
We use argon as our purge gas in the following descriptions. If argon is not available,
nitrogen may be used.
Hydrogen-Filled Syringe(s)
Syringes are filled from a tank of compressed H2 gas. Connect the H2 source to the Luer-
Lok fitting on the syringe with an appropriate piece of tubing. Use the low-pressure control
valve in order to prevent shooting the plunger out of the syringe barrel. Generally, it is best to
purge the regulator and tubing with H2 for a few seconds before filling syringes. A full syringe
holds 60 mL gas. Immediately cap the syringe with a Luer-Lok syringe cap,3 henceforth referred
to as a “syringe cap.”
Preparing the Palladium Foil.
We used a piece of Pd foil2 of approximately 0.2 g for our experiments. Each 0.1 g Pd
will absorb approximately 8 mL H2(g). Prior to either classroom demonstration, the Pd foil must
be heat-treated over a burner flame to drive off hydrogen from a previous experiment or
molecules such as water adhering to the surface. Tweezers are used to hold the Pd foil in the
flame. After about 30 s in the flame, drop the red-hot Pd foil into a beaker filled with Ar while a
gentle flow of Ar into the beaker assures contact between Pd and air is minimal. Remove the
plunger from a 60-mL syringe and connect the Luer opening to the Ar supply tubing. Purge the
air from the syringe barrel with a positive flow of gas. While Ar is flowing, drop the Pd foil
from the beaker into the syringe barrel. Turn the Ar off and insert the plunger. Remove the Ar
supply tubing and cap the syringe with a syringe cap. There should be approximately 30 mL of
Ar present. The Pd foil is now ready.
Mass of the Palladium Foil.
Web version from author
5
This procedure needs to be done only occasionally. Heat-treat the Pd foil as described
above. After it has cooled under a blanket of Ar, determine its mass in air. Record this mass on
the box that is used to store the Pd; it will not change.
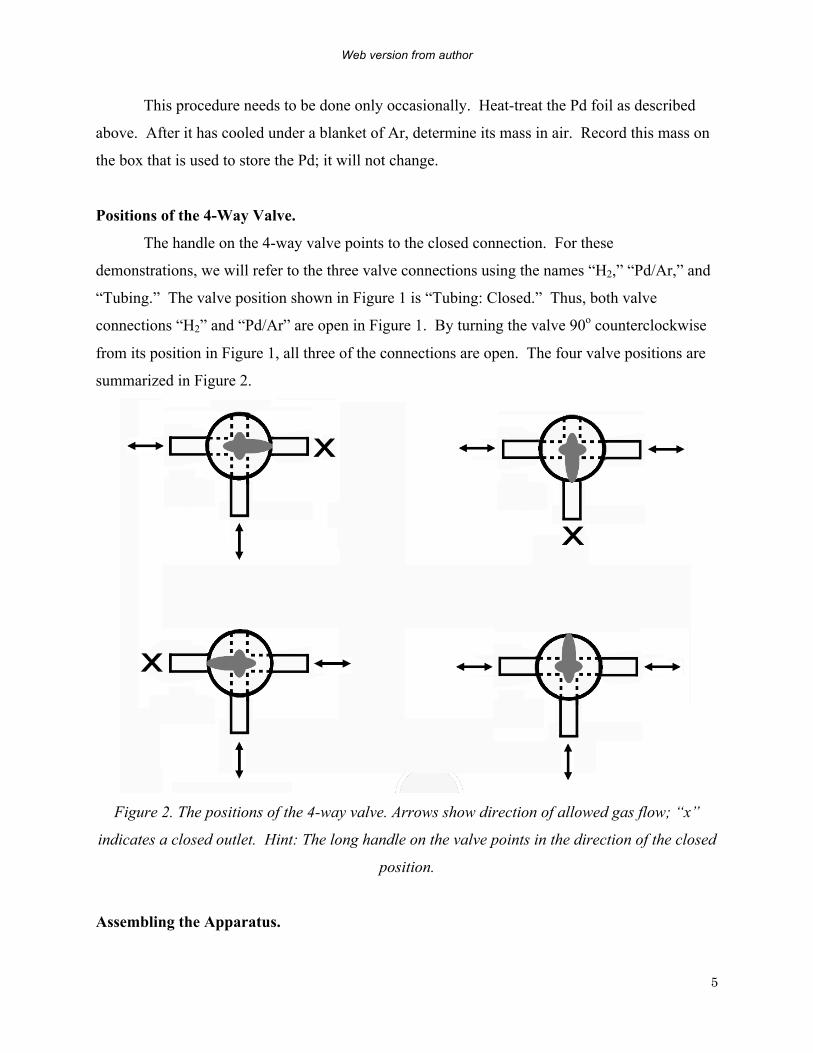
Positions of the 4-Way Valve.
The handle on the 4-way valve points to the closed connection. For these
demonstrations, we will refer to the three valve connections using the names “H2,” “Pd/Ar,” and
“Tubing.” The valve position shown in Figure 1 is “Tubing: Closed.” Thus, both valve
connections “H2” and “Pd/Ar” are open in Figure 1. By turning the valve 90o counterclockwise
from its position in Figure 1, all three of the connections are open. The four valve positions are
summarized in Figure 2.
Figure 2. The positions of the 4-way valve. Arrows show direction of allowed gas flow; “x”
indicates a closed outlet. Hint: The long handle on the valve points in the direction of the closed
position.
Assembling the Apparatus.

Web version from author
6
The apparatus is identical for both demonstrations. Connect the aquarium tubing to the
tapered fitting of the 4-way valve. Displace the air in the tubing with an Ar purge. As soon as
possible after the Ar purge, position the valve to “Tubing: Closed.” Next, add a 2 – 3 cm plug of
water using a thin-stem pipet to the open end of the aquarium tubing. This works best if one
completely fills the pipet and then slowly discharges the desired amount in one continuous action
without moving the position of the pipet. The water plug should be positioned a few cm in from
the open end. The visibility of the water plug is enhanced with food coloring. At this point, the
valve is only connected to the tubing and the two syringes (one with H2 and one with Pd/Ar)
should both be capped and ready, but not connected. All of this can be done prior to the lecture.
Demonstration 1. Reaction between H2 and Pd.
In this demonstration, we observe the rapid reaction between H2 and Pd:
Pd(s) + n/2 H2(g) PdHn(s)
When we refer to hydrogen (H2) being “absorbed,” bear in mind that in the product, PdHn, the
hydrogen exists as interstitial atoms of hydrogen in the octahedral holes of Pd(s) as per the
Background information. This distinction is important because when reading “hydrogen is
absorbed,” one is naturally inclined to think that the integrity of the H2 molecule is unchanged.
The Pd foil will darken to gray from its normal dull silver color and may curl or fold. It will
become noticeably brittle. Quantitative measurement of the amount of H2 absorbed is one goal
of the demonstration so that the stoichiometry of PdHn can be determined. This demonstration is
small scale and the use of a projection camera is necessary for all but the smallest classrooms.
Allow about five minutes for this demonstration, not including calculations.
Conducting Demonstration 1.
Connect the Pd/Ar syringe to the 4-way valve as per Figure 1 and turn the stopcock to
“H2: Closed.” Connect the H2 syringe to the valve. Gently withdraw the plunger to the Pd/Ar
syringe while watching the water plug. When the water plug is near the middle of the tubing,
carefully mark the front-edge position (edge closest to valve) of the water plug. Record the
initial volumes of H2 and Ar, both of which are under pressures equal to Pexternal. Hint: Establish

Web version from author
7
a spot along the plunger for consistent syringe volume readings, such as the front edge of the
black rubber diaphragm. Turn the valve to “Tubing: Closed” and transfer H2 to the Pd/Ar syringe
until the latter contains close to 60 mL. Over the course of the next minute or so, push/pull the
contents of the H2 and Pd/Ar syringes back and forth at least once. The net total volume will
decrease, but may be hard to notice. Without opening the valve to the tubing, try to establish an
internal pressure approximately equal to Pexternal. If at least one of the plungers moves easily in
its syringe barrel, this will occur automatically. If both plungers move with difficulty, anticipate
the results using the guide that approximately 8 mL H2 will be absorbed per 0.1 g Pd; position
the plungers so that their combined volume of H2 and Ar is less that the original combined
volume by this anticipated amount. The goal is to attain Pinternal approximately equal to Pexternal.
Carefully open the stopcock to all three positions open. The water plug in the tubing will move
one way or the other. If the movement seems that it might be too great, close the valve to the
tubing and adjust one of the syringe plungers and try again. Once all three positions are open,
adjust either syringe plunger so that the water plug returns to its position prior to the experiment,
whereupon Pinternal = Pexternal. Determine
€
Vabs, H2by measuring the difference in the total
volume in the two syringes before (
€
t = 0) and after mixing (
€
t f ):
€
Vabs, H2=Vtot (t = 0) −Vtot (t f )
This volume, typically 8 mL per 0.1 g Pd, can be rendered into moles of H2 using the ideal gas
law and then into moles of H atoms. The temperature and barometric pressure are necessary.
Typically, the mole ratio of H:Pd is close to the literature maximum of 0.7:1.
One of two short follow-up demonstrations is performed at this time. Both demonstrate
the reaction
4 H(Pd) + O2(g) 2 H2O(g, l)
As a first option, remove the Pd/Ar syringe from the valve. Discharge some gas if necessary so
that there is no more than 30 mL gas present. Draw 30 mL air into the syringe. A cloud of
Web version from author
8
condensed water vapor will form on the walls of the syringe and the syringe will become warm
to the touch. Remove the plunger and direct a stream of Ar over the condensation to show that it
easily evaporates. The Pd foil will remain brittle because it still contains hydrogen until it is
heat-treated again.
As a second option, transfer gas from the H2 syringe so that the Pd/Ar syringe contains 60
mL of gas. Disconnect the Pd/Ar syringe, remove the plunger and immediately drop the Pd foil
onto the thermal paper.4 Notice the color of the Pd changes from dark gray back to dull silver
within a split second and the thermal paper turns black under the Pd. Condensation of water is
not noticed with Option 2, however the heat generated is from the formation of water from the
reaction given above.
Demonstration 2. Kinetic rate law for H2 uptake in Pd.
In this demonstration, we will observe the rate of H2 uptake in Pd foil. The rate law
follows zero order kinetics and is believed to be limited by H2 mass transport as we will discuss
below. As with the previous demonstration, it will be difficult to see important details in most
classroom settings without a projection camera. Data should be collected for at least 10 minutes,
however, after just a few minutes, the instructor may return to lecture while one individual
continues to mark the progress for 10 – 30 minutes. The data set can be distributed to students
later.
Conducting Demonstration 2.
Details for assembling the apparatus, including Ar-purging the aquarium tubing and
flame-treating the Pd foil are described above. Assemble the apparatus as shown in the Figure 1.
Position the 4-way valve to “H2: Closed” and connect the H2 and Pd/Ar syringes. Tape the
aquarium tubing to a large piece of card-stock white poster board so that the tubing is horizontal
during the experiment. Make a mark on the front edge (valve side) of the water plug. Start the
timer at the same time as the valve is repositioned to “3-way open.” Make marks every 30
seconds. In our experience, the water plug moves inward at a rate of approximately 4 cm/min. It
is also necessary to measure the temperature and the barometric pressure.

Web version from author
9
Optional Control.
In order to establish that hydrogen loss is not accounting for the experimental
observations, the experiment may be continued without the palladium present by repositioning
the valve to “Pd/Ar: Closed.” Hydrogen loss, usually insignificant compared to the H2 uptake of
the demonstration, does occur due to effusion through invisibly small leaks, e.g. at the
connections to the valve or in syringes with plungers that are not gas-tight.
Data Analysis
Prior to the demonstration, the relationship between length of tubing and volume should
be determined. This is accomplished by filling a short segment of tubing (e.g. 10 cm) with a
large plug of water. The volume of water can be determined by measuring the mass of the
tubing with and without the water and using the density of water. The length of the water plug is
measured with a ruler. For the tubing we used, the relationship was:
€
Vtubing = 0.127cm2 × ltubing
The volume of the tubing is the volume of the hydrogen gas absorbed,
€
VH2 ,abs in this
demonstration.
Based on the amount of palladium used (described above), the maximum limit on
how much hydrogen can be absorbed is determined (the calculated total amount that will
be consumed at t =
€
∞.) This value will be used in the kinetics calculation as the number
of moles of hydrogen reagent present at t = 0, nH2(t = 0). In our case, we used a piece of
palladium with a mass of 0.2048 g or 1.924 mmol. Considering that the maximum
formula for the palladium hydride is PdH0.7, the value for nH2(t = 0) initial is:
€
nH2(t = 0) =1.924mmolPd × (0.7mmolH
1mmolPd) × (1mmolH2
2mmolH)
= 0.6734mmolH2

Web version from author
10
We created a spreadsheet with graphs to determine the reaction order using Microsoft
Excel. Data in the columns included Column A: time (min), Column B: distance the water plug
traveled (cm), Column C: Volume of H2 absorbed, Column D: mmol H2 reagent remaining,5
Column E: ln(mmol of H2 remaining), Column F: 1/mmol H2 remaining, and Column G: mol H
atoms/mol Pd atoms.6
The experimental data testing for first order (plot of ln(mmol H2) vs time) and second
order (plot of 1/mmol H2 vs time) are given in Figure 3. These plots establish that the reaction is
not first or second order because they do not give linear results.
Plot of ln(mmol H2) vs time (Test for 1st order: failed)
-2.000
-1.800
-1.600
-1.400
-1.200
-1.000
-0.800
-0.600
-0.400
-0.200
0.0000.00 5.00 10.00 15.00 20.00 25.00 30.00
time (min)
ln (
mm
ol
H2
)
Plot of 1/(mmol H2) vs time (Test for 2nd order: failed)
0.000
1.000
2.000
3.000
4.000
5.000
6.000
7.000
0.00 5.00 10.00 15.00 20.00 25.00 30.00
time (min)
1/
mm
ol
H2
(1
/m
mo
l)
Web version from author
11
Figure 3. Plots of the experimental results used to establish the order of the reaction. Top figure
is the test for first order: the plot of ln(mmol H2 remaining) vs. time; bottom figure is the test for
second order: the plot of 1/(mmol H2 remaining) vs. time.
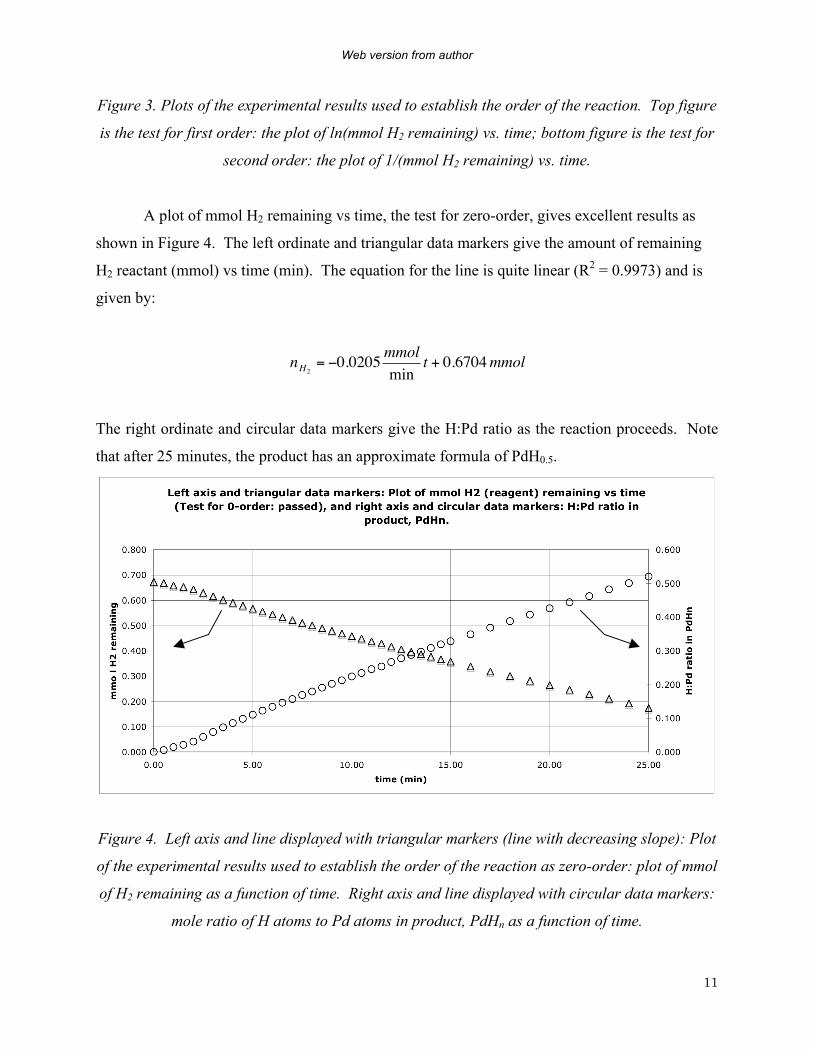
A plot of mmol H2 remaining vs time, the test for zero-order, gives excellent results as
shown in Figure 4. The left ordinate and triangular data markers give the amount of remaining
H2 reactant (mmol) vs time (min). The equation for the line is quite linear (R2 = 0.9973) and is
given by:
€
nH2= −0.0205mmol
mint + 0.6704mmol
The right ordinate and circular data markers give the H:Pd ratio as the reaction proceeds. Note
that after 25 minutes, the product has an approximate formula of PdH0.5.
Figure 4. Left axis and line displayed with triangular markers (line with decreasing slope): Plot
of the experimental results used to establish the order of the reaction as zero-order: plot of mmol
of H2 remaining as a function of time. Right axis and line displayed with circular data markers:
mole ratio of H atoms to Pd atoms in product, PdHn as a function of time.

Web version from author
12
Results Comparison between the Demonstration
With the reaction established as a zero-order reaction, the rate constant equals the slope
in Figure 4 and the rate law is:
€
rateH2 uptake= −
dnH2
dt= k = 0.0205 mmol H2
min
Results from Demonstration 1 indicate that H2 uptake is much faster than the kinetic results from
Demonstration 2. The design of the apparatus suggests an explanation: H2 must migrate from the
H2 syringe, through the 4-way stopcock valve and into the Pd/Ar syringe, whereupon it is
quickly absorbed by Pd producing PdHn. The rate of the H2 uptake is limited by the rate of mass
transport. To test this hypothesis, three other experiments were performed. These can be
repeated or simply described to the class for contemplation. The instructor may wish to withhold
the mass transport hypothesis and let the students think about the observations. This makes an
excellent overnight group inquiry activity.
Additional Observation 1.
When deuterium gas, D2, is used instead of H2(g), the rate slows down. Data are
provided in the Supplemental Materials. Experimentally, we found that the ratio of rates of
H2:D2 uptake to be:
€
rateH2 uptake
rateD2 uptake=1.46
Additional Observation 2.
When various sizes of Pd were used in the Pd/Ar syringe, the rate of H2 uptake did not
change. See Supplemental Materials.
Additional Observation 3.

Web version from author
13
When NO2, a red-brown gas with molar mass similar to that of Ar and H2 are connected
to the 4-way valve and allowed to diffuse into one another, it took over an hour before the colors
of the two syringes appeared equal.6
Hazards.
Manipulating gases in syringes is generally safe and unintentional discharges are not
common. Nevertheless, such discharges are possible and it is important to remember that
hydrogen is highly flammable and forms explosive mixtures with air. Read the MSDS sheet for
Pd foil. Never use palladium powder due to the risk of inhalation.
Acknowledgements.
We express our gratitude to colleagues Robert Snipp, Brad Parsons, and Ed Vitz for
useful discussions.
Notes
1. 4-way stopcocks with Luer-Loks are available from Cole-Parmer, Part Number 30600-03.
Two of the connectors have Luer-Lok fittings and the third is a tapered connector.
2. Small squares of palladium foil can be purchased from numerous vendors. For example,
Aldrich sells a 25 x 25 mm piece for about $50 (Aldrich 267120-190MG)
3. Luer-Lok syringe caps can be purchased from a variety of sources including Flinn Scientific
(AP8958); or Educational Innovations (GAS-160).
4. Thermal paper often obtained as credit card receipts, for example, from pay-at-the-pump
petroleum stations or fast food receipts such as from McDonalds or Burger King. Some
older instruments use thermal paper as well. Note that only one side of most thermal paper is
active.
5. The amount of H2 reacted can be calculated by subtracting the amount (mmol) of H2 reacted,
nH2, abs(t), from the initial amount of H2, nH2(t = 0):
€
nH2(t) = nH2
(t = 0) − nH2 ,abs(t)
Web version from author
14
The second term can be calculated using the ideal gas law:
€
nH2 ,abs(t) =
PVH2 ,abs(t)
R ×T
6. Our piece of palladium had a mass of 0.2048 g, corresponding to 1.924 mmol Pd. The
formula used in this column:
€
nHnPd
=2 × nH2 ,abs
1.924 mmol Pd
7. If desired, dry nitrogen dioxide can be prepared (6). CAUTION: Hydrogen and nitrogen
dioxide must never be mixed in the presence of Pd, which is a catalyst for an explosion.
Literature Cited
1. Mitsui, T.; Rose, M. K.; Fomin, E.; Ogletree, D. F.; and Salmeron, M.; Nature 2003, 422,
705 – 707.
2. Bartczak, W. M.; Stawowska, J.; Structural Chemistry 2004, 15(5) 447 – 459.
3. Greenwood, N. N.; and Earnshaw, A.; Chemistry of the Elements, Pergamon Press, 1984.
4. Morley, E. W.; Amer. Chem. Journ., 1890, 12, p. 460.
5. McMurry, J. E.; Faye, R. C.; Chemistry, 5th Edition, Pearson Prentice Hall, 2008.
6. Website http://mattson.creighton.edu/Microscale_Gas_Chemistry.html, then click on “All
17 gases.” (Successfully accessed 1 September 2008)
Web version from author
15
Supplemental Materials.
Hydrogen and palladium foil. Two classroom demonstrations.
Elsbeth Klotz and Bruce Mattson*, Department of Chemistry, Creighton University, Omaha,
Nebraska 68178 *e-mail address: [email protected]
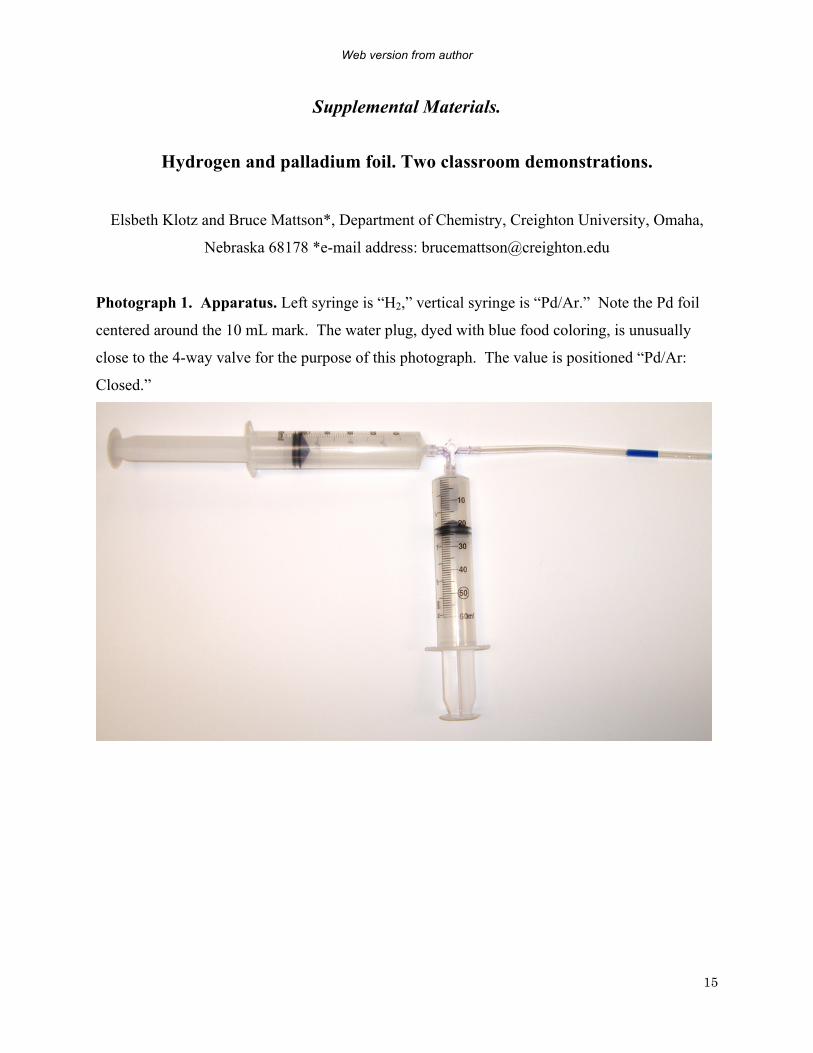
Photograph 1. Apparatus. Left syringe is “H2,” vertical syringe is “Pd/Ar.” Note the Pd foil
centered around the 10 mL mark. The water plug, dyed with blue food coloring, is unusually
close to the 4-way valve for the purpose of this photograph. The value is positioned “Pd/Ar:
Closed.”

Web version from author
16
Photographs 2a and 2b. Physical appearance of palladium before and after exposure to
hydrogen. These results are from performing Demonstration 1. Palladium is a dull silver color
as shown in the left photograph where it is under Ar. The right photograph is after one minute of
exposure to hydrogen. Often, the Pd foil curls upon H2 uptake.
Photograph 3. Use of thermal paper to detect heat released when Pd/H is exposed to air.
Demonstration 1, continued. The black spot at left in the following picture resulted when Pd
exposed to H2 for 1 min was dropped from the H2 syringe onto the thermal paper. The reaction
with air is nearly instantaneous and the dark gray color of Pd/H turns to a dull silver color as
shown at right in the figure. (The dull silver square shown at right is the Pd metal square resting
on the thermal paper shortly after it caused the black thermal spot at left.)
Table Supplemental-1. Data collected in Demonstration 2. The data presented here were
obtained using the instructions for Demonstration 2 and were used to create Figures 2 – 4 in the

Web version from author
17
article. Data in Columns A and B were collected at part of the demonstration. Values in
Columns C, D, and G were determined by:
Column Equation: Comments:
Column C
€
Vtubing = 0.127cm2 × ltubing
For our aquarium tubing, the relationship between length and volume was 0.127 mL/cm tubing.
Column D
€
nH2(t) = nH2
(t = 0) − nH2 ,abs(t)
Moles of H2 remaining,
€
nH2(t) , is obtained by
subtracting moles of H2 absorbed,
€
nH2 ,abs(t) , from the
initial amount,
€
nH2(t = 0) .
Column G
€
nHnPd
=2 × nH2
(mmol H)1.924 mmol Pd
The Pd foil used had mass of 0.2048 g corresponding to 1.924 mmol Pd.
A B C D E F G
time distance volume mmol H2 ln(mol H2) 1/(mol H2) mol H/
(min) (cm) (mL) Zero order? First order? Second order? mol Pd
0.00 0.00 0.00 0.673 -0.395 1.485 0.000
0.50 0.97 0.12 0.668 -0.403 1.496 0.005
1.00 2.78 0.35 0.659 -0.417 1.517 0.015
1.50 3.94 0.50 0.653 -0.426 1.531 0.021
2.00 5.81 0.74 0.644 -0.440 1.553 0.031
2.50 8.42 1.07 0.630 -0.461 1.586 0.045
3.00 11.16 1.42 0.617 -0.484 1.622 0.059
3.50 13.78 1.75 0.603 -0.506 1.658 0.073
4.00 16.14 2.05 0.591 -0.526 1.692 0.086
4.50 18.48 2.35 0.579 -0.546 1.726 0.098
5.00 20.80 2.64 0.567 -0.567 1.762 0.110
5.50 23.04 2.93 0.556 -0.587 1.799 0.122
6.00 25.29 3.21 0.545 -0.608 1.837 0.134
6.50 27.46 3.49 0.533 -0.628 1.875 0.146
7.00 29.62 3.76 0.522 -0.649 1.914 0.157
7.50 31.80 4.04 0.511 -0.671 1.956 0.169

Web version from author
18
8.00 33.81 4.29 0.501 -0.691 1.996 0.179
8.50 35.92 4.56 0.490 -0.713 2.039 0.191
9.00 38.06 4.83 0.479 -0.735 2.086 0.202
9.50 40.07 5.09 0.469 -0.757 2.131 0.213
10.00 42.14 5.35 0.459 -0.779 2.180 0.224
10.50 44.09 5.60 0.449 -0.801 2.229 0.234
11.00 46.23 5.87 0.438 -0.826 2.284 0.245
11.50 47.77 6.07 0.430 -0.844 2.326 0.254
12.00 50.25 6.38 0.417 -0.874 2.396 0.267
12.50 52.35 6.65 0.407 -0.900 2.459 0.278
13.00 54.23 6.89 0.397 -0.924 2.519 0.288
13.50 56.10 7.12 0.387 -0.948 2.581 0.298
14.00 58.11 7.38 0.377 -0.975 2.651 0.308
14.50 60.11 7.63 0.367 -1.002 2.724 0.319
15.00 61.86 7.86 0.358 -1.027 2.792 0.328
16.00 65.70 8.34 0.339 -1.083 2.954 0.349
17.00 69.52 8.83 0.319 -1.142 3.134 0.369
18.00 73.14 9.29 0.301 -1.202 3.326 0.388
19.00 76.70 9.74 0.283 -1.264 3.540 0.407
20.00 80.25 10.19 0.264 -1.330 3.782 0.426
21.00 83.67 10.63 0.247 -1.398 4.049 0.444
22.00 87.15 11.07 0.229 -1.473 4.362 0.463
23.00 90.82 11.53 0.211 -1.558 4.749 0.482
24.00 94.39 11.99 0.192 -1.648 5.199 0.501
25.00 97.98 12.44 0.174 -1.748 5.745 0.520

Web version from author
19
Supplemental Experiment 1. Hydrogen (H2) vs. Deuterium (D2) Uptake vs. time.
The experimental procedure follows the instructions provided for Demonstration 2.
Deuterium gas was prepared by the reaction of calcium metal with deuterium oxide, D2O(l)
using the general methods for gas preparation in syringes we have described in “Microscale Gas
Chemistry: Generating Gases in Large Syringes” Mattson, B. M., Chem13 News, 251, October,
1996 and at our website: http://mattson.creighton.edu/Microscale_Gas_Chemistry.html (accessed
May, 2008.) Deuterium gas was dried by passing it through a 5 cm length of Latex tubing*
packed with anhydrous sodium sulfate and pre-purged with Ar.
* Tubing: 6.35 mm (1/4-inch) OD, 3.175 mm (1/8-inch) ID, possible vendors: Flinn #AP2076;
10-ft, and Educational Innovations #GAS-220 for 5 ft)
Table Supplemental-2. Raw data for H2 and D2 uptake.
H2 D2
Time (min) Distance (cm)
Volume
(mL) Time (min) Distance (cm)
Volume
(mL)
0.0 0.0 0.00 0.0 0.0 0.00
0.5 0.0 0.00 0.5 0.0 0.00
1.0 1.8 0.23 1.0 0.9 0.11
1.5 3.3 0.42 1.5 1.6 0.20
2.0 7.2 0.91 2.0 2.2 0.28
2.5 9.2 1.17 2.5 2.7 0.34
3.0 10.4 1.32 3.0 3.1 0.39
3.5 11.5 1.46 3.5 3.5 0.44
4.0 13.4 1.70 4.0 3.9 0.50
4.5 15.6 1.98 4.5 4.2 0.53
5.0 17.8 2.26 5.0 4.5 0.57
5.5 19.9 2.53 5.5 5.0 0.64
6.0 22.0 2.79 6.0 5.4 0.69
6.5 24.1 3.06 6.5 5.8 0.74

Web version from author
20
7.0 25.7 3.26 7.0 6.4 0.81
7.5 27.6 3.51 7.5 7.5 0.95
8.0 29.7 3.77 8.0 9.1 1.16
8.5 31.6 4.01 8.5 10.7 1.36
9.0 33.4 4.24 9.0 12.4 1.57
9.5 35.4 4.50 9.5 14.1 1.79
10.0 37.4 4.75 10.0 15.6 1.98
11.0 41.0 5.21 11.0 18.5 2.35
12.0 45.0 5.72 12.0 21.4 2.72
13.0 48.6 6.17 13.0 24.0 3.05
14.0 51.8 6.58 14.0 26.5 3.37
15.0 55.3 7.02 15.0 29.0 3.68
16.0 58.7 7.45 16.0 31.4 3.99
17.0 62.2 7.90 17.0 33.9 4.31
18.0 65.8 8.36 18.0 36.3 4.61
19.0 69.3 8.80 19.0 38.7 4.91
20.0 72.7 9.23 20.0 40.9 5.19
21.0 76.2 9.68 21.0 43.4 5.51
22.0 79.8 10.13 22.0 45.7 5.80
23.0 83.3 10.58 23.0 48.0 6.10
24.0 86.7 11.01 24.0 50.2 6.38
25.0 90.2 11.46 25.0 52.5 6.67
26.0 93.8 11.91 26.0 54.7 6.95
27.0 97.3 12.36 27.0 56.9 7.23
28.0 100.7 12.79 28.0 59.1 7.51

Web version from author
21
Figure Supplemental-1. H2 and D2 uptake vs. time.
H2 and D2 absorption in Pd vs time
y = 0.463x - 0.0229
R2 = 0.9992
y = 0.2887x - 0.6735
R2 = 0.9854
-2.00
0.00
2.00
4.00
6.00
8.00
10.00
12.00
14.00
0.0 5.0 10.0 15.0 20.0 25.0 30.0
time (min)
vo
l g
as
ab
sorb
ed
D2
H2
Figure Supplemental-2. H2 and D2 uptake vs. time. When only data for t > 10 minutes is
plotted, better results are obtained:

Web version from author
22
H2 and D2 Uptake on Pd vs time
y = 0.4447x + 0.3454
R2 = 0.9999
y = 0.3039x - 0.916
R2 = 0.9989
0.00
2.00
4.00
6.00
8.00
10.00
12.00
14.00
10.0 15.0 20.0 25.0 30.0
time (min)
vo
l g
as
ad
sorb
ed
/ab
sorb
ed
H2
D2

Web version from author
23
Supplemental Experiment 2. Hydrogen (H2) Uptake for various sizes of Pd foil.
Three pieces of Pd foil were tested separately using the experimental procedure and instructions
provided for Demonstration 2. The foil pieces had masses of 0.057 g (Cat A), 0.147 g (Cat B)
and 0.204 g (Cat C). The results for H2 uptake are independent of the size of the foil used as
shown in the following table and figure:
Table Supplemental-3. Locations of water plug during H2 uptake experiments with various
sizes of Pd. Distances reported in mm refer to movement of the water plug inwards as H2 uptake
proceeds.
time (min) Cat A (mm) Cat B (mm) Cat C (mm)
0 0 0 0
1 29 35 21
2 56 68 63
3 103 116 112
4 153 163 163
5 198 205 211
6 246 249
Figure Supplemental-3. Graph of results from Table Supplemental-3.

Web version from author
24
H2 uptake with various sizes of Pd catalysts
0
50
100
150
200
250
300
0 1 2 3 4 5 6 7
time (min)
Am
ou
nt
of
H2
up
take (
in m
m t
ub
ing
)
Cat ACat BCat C
Supplemental Experiment 3. Mutual mass transport of hydrogen (H2) and nitrogen dioxide
(NO2).
Two syringes, one filled with H2 and the other with NO2 were connected via a 4-way valve. The
valve was set to allow the gases to mutually diffuse into one another. The purpose of this study
was to observe the relative rate of mass transport of H2 in a gas with a MM similar to that of Ar.
Even after almost 2 hours, there is noticeably more NO2 in the syringe that originally contained
the NO2.
Photographs 4a – 4d. Photograph 4a (upper left, t = 0 min), 4b (upper right, t =19 min), 4c
(lower left, t = 40 min) and 4d (lower right, t = 113 min.)

Web version from author
25