hydrogen exchange identifies protein interfaces and
TRANSCRIPT

University of Massachusetts Amherst University of Massachusetts Amherst
ScholarWorks@UMass Amherst ScholarWorks@UMass Amherst
Doctoral Dissertations Dissertations and Theses
July 2018
HYDROGEN EXCHANGE IDENTIFIES PROTEIN INTERFACES AND HYDROGEN EXCHANGE IDENTIFIES PROTEIN INTERFACES AND
SIGNALING-RELATED CHANGES IN FUNCTIONAL SIGNALING-RELATED CHANGES IN FUNCTIONAL
CHEMORECEPTOR ARRAYS CHEMORECEPTOR ARRAYS
Xuni Li University of Massachusetts Amherst
Follow this and additional works at: https://scholarworks.umass.edu/dissertations_2
Part of the Biochemistry Commons
Recommended Citation Recommended Citation Li, Xuni, "HYDROGEN EXCHANGE IDENTIFIES PROTEIN INTERFACES AND SIGNALING-RELATED CHANGES IN FUNCTIONAL CHEMORECEPTOR ARRAYS" (2018). Doctoral Dissertations. 1256. https://doi.org/10.7275/11501027.0 https://scholarworks.umass.edu/dissertations_2/1256
This Open Access Dissertation is brought to you for free and open access by the Dissertations and Theses at ScholarWorks@UMass Amherst. It has been accepted for inclusion in Doctoral Dissertations by an authorized administrator of ScholarWorks@UMass Amherst. For more information, please contact [email protected].
HYDROGEN EXCHANGE IDENTIFIES PROTEIN INTERFACES AND
SIGNALING-RELATED CHANGES IN FUNCTIONAL CHEMORECEPTOR
ARRAYS
A Dissertation Presented
by
XUNI LI
Submitted to the Graduate School of the
University of Massachusetts Amherst in partial fulfillment
of the requirements for the degree of
DOCTOR OF PHILOSOPHY
May 2018
Chemistry

© Copyright by Xuni Li 2018
All Rights Reserved

HYDROGEN EXCHANGE IDENTIFIES PROTEIN INTERFACES AND
SIGNALING-RELATED CHANGES IN FUNCTIONAL CHEMORECEPTOR
ARRAYS
A Dissertation Presented
by
XUNI LI
Approved as to style and content by:
____________________________________
Lynmarie K. Thompson, Chair
____________________________________
Craig Martin, Member
____________________________________
Igor Kaltashov, Member
____________________________________
Peter Chien, Member
__________________________________
Richard Vachet, Department Head
Department of Chemistry

DEDICATION
To my beloved parents, Xiaoling and Bailin – for their unselfish support and
encouragement, and being my first teachers in my life.
To my husband, Yaohui – for his patience, friendship, sacrifice and endless love.
To my son, Sheldon – for letting me experience the kind of love that people freely die for.
To my golden retriever, Noodle – for his loyalty and loving me unconditionally.

v
ACKNOWLEDGMENTS
First and foremost, I would like to express my deepest appreciation to my advisor and
mentor Dr. Lynmarie Thompson for her incredible patience and support. I am fortunate to
be in her lab and be trained to a better scientist. Professor Thompson provides me
continuous support and encouragement when I face obstacle. I am grateful for her guidance
and support to show me how to think critically and be confidence in myself. Without her
help, I will not be able to complete this project. She is the female role model in science that
I can look up to.
I would like to thank my committee members: Dr. Craig Martin for his invaluable
suggestions and recommendation of the project. Dr. Igor Kaltashov for providing useful
information and aspects on the correlated and uncorrelated exchange in hydrogen exchange
mass spectrometry. Dr. Peter Chien for providing insightful advices and suggestions of the
project to complete this work. Previous committee, Dr. Robert Weis for developing the
vesicle template assembly and characterizing the system enough to make this project
possible, and you will be forever missed. Dr. Stephen Eyles for his mentoring, data
interpretation and insightful discussion on the project. And special thank him for teaching
me how to use different mass spectrometers and all the troubleshooting.
I would like to thank the past and present lab members in the Thompson lab, Dr. Daniel
Fowler, Dr. Fe Sferdean, Shiela Jones, Dr. Michael Harris, Dr. Seena Koshy, Dr. Libbie
Haglin, Maryam Kashefi and Aruni Karunanayake for all the discussions and useful

vi
suggestions on the projects and troubleshooting in experiments. I am very thankful for the
close friendship that I have with Seena Koshy and her continuous encouragement.
In addition, I would like to thank the past and present lab members on the 8th floor for
helpful discussions and suggestions on projects, allowing me to use their instruments.
Especially, Dr. Luis Ramirez-Tapia for teaching me how to do radioactive experiments,
troubleshooting and resolve technical challenges in research. I would like to thank J.M.
Stowe, Kay Fenlason, Carrie Penland for guiding me a long line of paperwork for
completion of my Ph.D. A special thanks to the professional handyman, Bob Sabola, for
repairing our broken instruments and modifying my icebox for the mass spectrometry
experiments.
Furthermore, I would like to thank my amazing friends that I made during my graduate
school. Especially, my close friend Hanwei Zhao for providing me useful suggestions and
discussions on the hydrogen exchange mass spectrometry; Yuzhou Tang and Yichen Zhang
for emotional support and encouragement.
Last but the least, my biggest thanks to my beloved family for their sacrifices that made
my dream come true. My parents, Xiaoling and Bailin, have always supported me in
everything. I need to thank my mom for her constant endless love to me and all the sacrifice
she made for me. And last, I need to thank my husband, Yaohui, for his understanding,
sacrifice, emotional support, faithful love and motivation.

vii
I need to thank you from the bottom of my heart. This would not have been possible without
each and every one of you.
“Many of life’s failures are people who did not realize how close they were
to success when they gave up.”
-Thomas Edison

viii
ABSTRACT
HYDROGEN EXCHANGE IDENTIFIES PROTEIN INTERFACES AND
SIGNALING-RELATED CHANGES IN FUNCTIONAL CHEMORECEPTOR
ARRAYS
MAY 2018
XUNI LI, B.A., UNIVERSITY OF MASSACHUSETTS AMHERST
B.S., UNIVERSITY OF MASSACHUSETTS AMHERST
Ph.D., UNIVERSITY OF MASSACHUSETTS AMHERST
Directed by: Professor Lynmarie K. Thompson
Chemotaxis is an ideal system for studying membrane protein signal transduction.
Chemoreceptors are transmembrane proteins that sense chemicals in the environment and
use this information to control a phosphorylation cascade that enables the cell to swim
towards favorable environments. The receptors form a ternary complex with a histidine
kinase, CheA, and an adaptor protein, CheW. These complexes assemble into membrane-
bound hexagonal arrays that transmit the signal that controls CheA. It is widely accepted
that ligand binding to the receptor causes a 2Å piston motion of a helix that extends through
the periplasmic and transmembrane domains. But it is unclear how the signal then
propagates through the cytoplasmic domain to inhibit CheA that is bound to the membrane-
distal tip of the receptor, ~200Å away. Previous studies have suggested that signal
propagation through the cytoplasmic domain involves inverse changes in the dynamics of
the receptor.
In this study, we employ hydrogen deuterium exchange mass spectrometry (HDX-
MS) to measure differences in structure and dynamics between defined states of the
receptor. Functional complexes of a His-tagged cytoplasmic fragment (CF) are assembled
on vesicles with CheA and CheW in three states for HDX-MS. Widespread correlated

ix
exchange is observed, which indicates that the CF in functional complexes populates a
long-lived unfolded state. Exchange is rapid throughout the CF except in the protein
interaction region where CF binds CheA and CheW. These observations lead us to propose
that signaling involves modulation of a folding equilibrium: binding of CheA (and possibly
CheW) stabilizes the receptor, and CheA is bound in a kinase-on conformation. Thus,
destabilization of the receptor will release this contact with CheA, which then adopts a
kinase-off conformation. Both the kinase-off and demethylated samples of CF complexes
exhibit faster HDX and less protection from exchange at long times at the binding
interfaces with CheA. Thus we proposed that both the ligand-induced piston and
demethylation destabilize the receptor, which releases its contact with CheA to turn off the
kinase. Preliminary HDX results for CheA also set a stage for future analysis of the domain
interactions of CheA in the functional complexes, and the differences that correlate with
kinase activity. Ultimately, HDX-MS results will provide important information for
deducing the signaling mechanism.

x
TABLE OF CONTENTS
Page
ACKNOWLEDGMENTS ...................................................................................................v
ABSTRACT ..................................................................................................................... viii
LIST OF TABLES ............................................................................................................ xii
LIST OF FIGURES ......................................................................................................... xiii
CHAPTER
1. INTRODUCTION ...................................................................................................1
1.1. Overview of Bacterial Chemotaxis Receptor Function ....................................1 1.2. Structure of Receptors and Functional Arrays ..................................................2 1.3. Mechanism of Receptor Signaling and Proposed Role of Dynamics ...............4 1.4. Hydrogen Deuterium Exchange Mass Spectrometry Studies of
Structure and Dynamics ...............................................................................7 1.5. Objective of this study ......................................................................................8
2. MATERIALS AND METHODS ...........................................................................10
2.1. Protein Expression and Purification................................................................10
2.1.1. His-tag Tar cytoplasmic fragment (CF) ...........................................10 2.1.2. TEV-cleavable His-tagged CheA and CheY ...................................11 2.1.3. TEV-cleavable His-tagged CheW....................................................12 2.1.4. TEV-protease ...................................................................................13 2.1.5. His-tag cleavage ...............................................................................13
2.2. Lipid Vesicles .................................................................................................14 2.3. Vesicle and PEG Complex Assembly.............................................................15 2.4. Biochemical Assays ........................................................................................15
2.4.1. Spectrophotometric kinase activity ..................................................15 2.4.2. Protein binding assay .......................................................................16
2.5. HDX Mass Spectrometry Measurements........................................................17
2.5.1. HDX sample preparation .................................................................17 2.5.2. HPLC column preparation and maintenance ...................................18 2.5.3. HDX-MS data acquisition................................................................19

xi
2.5.3.1. HPLC method ...................................................................19 2.5.3.2. MS method ........................................................................19 2.5.3.3. MS protocol for minimizing back exchange and
eliminating carryover .........................................................19
2.5.4. HDX data analysis ...........................................................................22
2.5.4.1. Peptides identification by ProteinLynx Global
Service................................................................................22 2.5.4.2. Peptide analysis by DynamX ............................................22 2.5.4.3. EX1 Analysis using HX-Express2 ....................................23
3. HDX-MS RESULTS ON FUNCTIONAL SIGNALING COMPLEXES:
PROPERTIES AND SIGNALING-RELATED CHANGES OF THE RECEPTOR
CYTOPLASMIC FRAGMENT ........................................................................................24
3.1. HDX-MS approach for investigating properties of receptor
cytoplasmic domain within functional complexes .....................................24 3.2. Widely varying HDX rates of CF are indicative of unstructured
regions and protein interactions .................................................................31 3.3. CF in the kinase-on state exhibits decreased dynamics in both the
methylation and protein interaction regions ..............................................38 3.4. Methylation decreases dynamics throughout the CF ......................................43 3.5. Widespread correlated exchange suggests CF populates a long-lived
unfolded state within functional complexes ..............................................49
4. HDX-MS RESULTS ON FUNCTIONAL SIGNALING COMPLEXES:
PRELIMINARY OVERVIEW OF DYNAMICS OF THE KINASE CHEA ...................58
4.1. Introduction .....................................................................................................58 4.2. Developing a protocol to prepare a fully exchanged CheA control
sample ........................................................................................................61 4.3. Preliminary comparison of HDX of free CheA vs CheA incorporated
into kinase-on and kinase-off complexes ...................................................63
5. INSIGHTS INTO THE SIGNALING MECHANISM ..........................................67
5.1. Implications of HDX behavior regarding the properties of CF ......................67 5.2. How do these results compare with previous studies of CF dynamics? .........68 5.3. Insights into protein interactions between CF, CheA, and CheW ..................70 5.4. HDX results lead to a new model for the signaling mechanism .....................75
APPENDIX: VESICLE SURFACE AREA FOR ASSEMBLY OF SIGNALING
ARRAYS ...........................................................................................................................78
BIBLIOGRAPHY ..............................................................................................................82

xii
LIST OF TABLES
Table Page
3.1. Kinase activity and protein incorporation into functional complexes of
CF4Q, CF4Q.A411V, and CF4E, assembled on vesicles with
CheA and CheW. .................................................................................... 26
5.1. Receptor residues interacting with CheA and CheW ................................... 71
5.2. Number of protons remaining after 16 hr of HDX in functional
complexes of CF4Q, CF4E and CF4Q.A411V. ...................................... 73
5.3. Protected sites deduced from overlapping peptides with incomplete
HDX. ....................................................................................................... 74

xiii
LIST OF FIGURES
Figure Page
1.1. Schematic diagram of E. coli chemotaxis pathway and two receptor
signaling states .......................................................................................... 2
1.2. Vesicle template assembly of His-tagged CF with CheA and CheW. ............ 4
1.3. Overview of chemoreceptor with CheA and CheW and proposed
dynamic model for signal propagation. .................................................... 6
1.4. Overview of hydrogen deuterium exchange in proteins ................................. 8
2.1. Icebox used to maintain minimum temperature during peptide
separation step ......................................................................................... 21
3.1. Kinase activity and protein binding within complexes of CF remain
constant over the timecourse of deuterium labeling ............................... 26
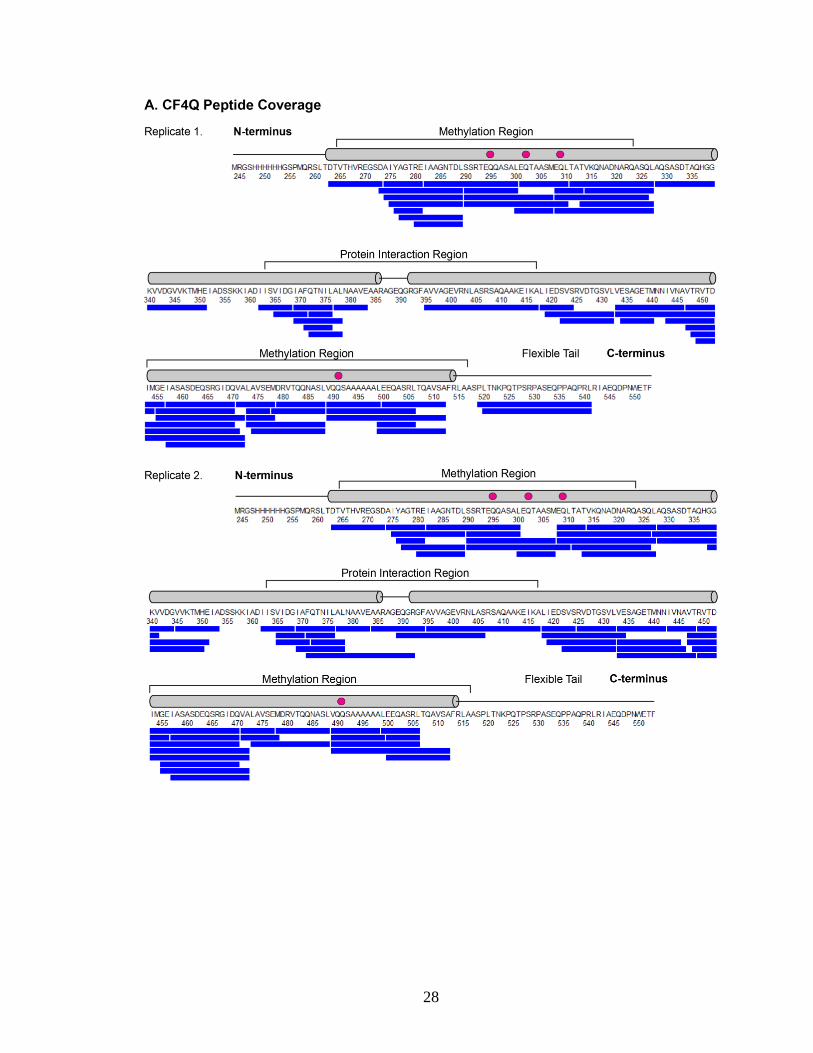
3.2. Peptide coverage maps for CF in functional complexes with CheA and
CheW. ..................................................................................................... 30
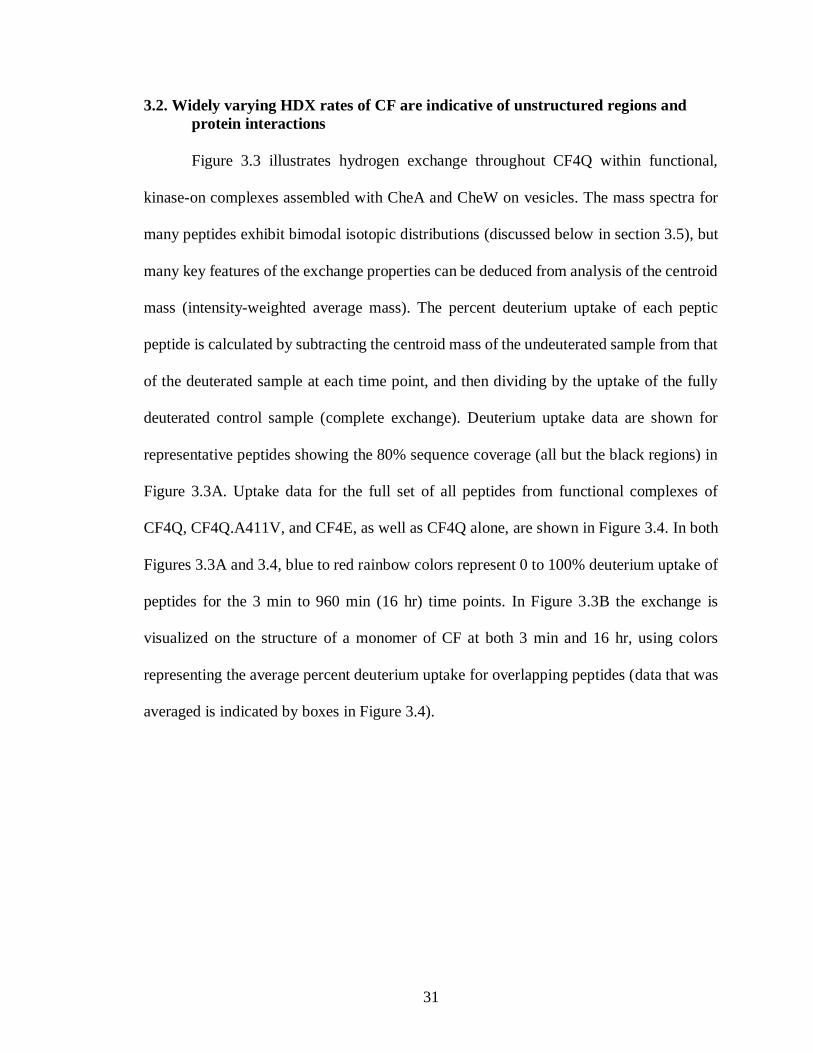
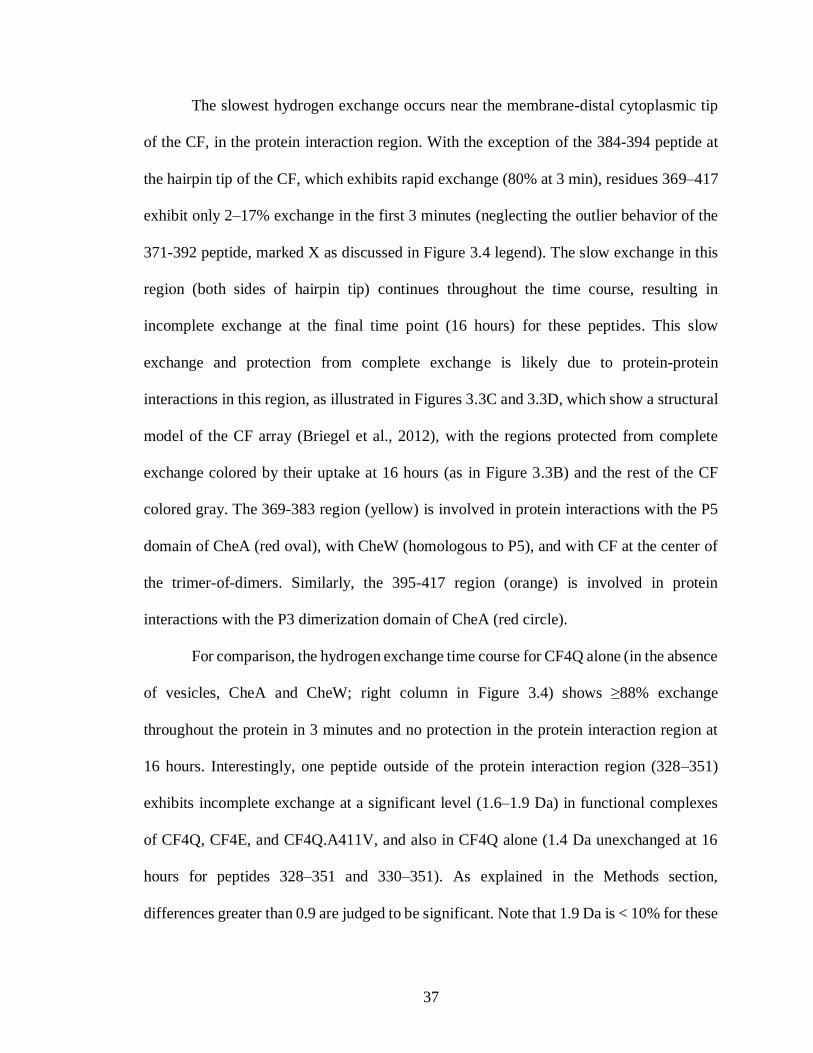
3.3. Overview of hydrogen exchange properties of CF4Q in functional
complexes assembled with CheA and CheW on vesicles. ...................... 33
3.4. Hydrogen exchange for the complete set of CF peptides from CF4Q,
CF4E, and CF4Q.A411V in functional complexes with CheA and
CheW, and from CF4Q alone ................................................................. 36
3.5. Difference in deuterium uptake between kinase-on and kinase-off
signaling states ........................................................................................ 41
3.6. Difference in deuterium uptake between unmethylated and
methylated-mimic states ......................................................................... 46
3.7. Comparison of HDX differences due to signaling state and
methylation ............................................................................................. 49
3.8. Comparison of visualization vs HX-Express methods for estimation of
t1/2 of an EX1 process .............................................................................. 52
3.9. Estimated t1/2 of correlated exchange (EX1) of peptides throughout CF
in functional complexes with CheA and CheW ...................................... 54
3.10. Regions with differences in t1/2 of correlated HDX between CF4Q and
CF4E ....................................................................................................... 56

xiv
3.11. Overlaid spectra show changes in rates of both correlated (EX1) and
uncorrelated (EX2) exchange ................................................................. 57
4.1. HDX-MS identifies peptides from all domains and linkers of CheA. .......... 60
4.2. Effect of lyophilization on kinase activity of CheA. .................................... 62
4.3. Peptides observed in HDX-MS of all three states of CheA .......................... 63
4.4. CheA heat map comparing HDX time course for kinase-on and kinase-
off complexes with free CheA ................................................................ 65
5.1. Proposed folding-mediated signaling mechanism ........................................ 77
A.1. Hexagon geometry in array ........................................................................... 79

1
CHAPTER 1
INTRODUCTION
1.1. Overview of Bacterial Chemotaxis Receptor Function
Membrane proteins are involved in many the life processes, including cell division,
antibiotic resistance and transmitting signals that allow bacteria to respond to the
environment. Bacterial chemoreceptor complexes are an ideal system for understanding
the mechanism of transmembrane signaling. Chemoreceptors are involved in sensing the
chemical gradient in the environment and directing swimming towards favorable
environments for survival.
Bacteria build remarkably large (~200 nm) multi-protein hexagonal arrays in their
membranes to transmit signals that control their swimming direction (Briegel et al., 2009).
These arrays enable this signaling system to respond with very high sensitivity and
dynamic range (responds to concentrations ranging from nanomolar to millimolar) (Sourjik
and Berg, 2002). These arrays are formed by chemotaxis receptors that are helical coiled-
coil homodimers and cluster in patches at the cell poles. These chemoreceptors arrange
themselves in the arrays to form trimer-of-dimers with a histidine kinase (CheA) and a
coupling protein (CheW) (Briegel et al., 2008). The function of the ternary complex is to
activate CheA. In the absence of ligand, the receptor will stimulate CheA to phosphorylate
itself with ATP and then transfer the phosphate group to a regulator protein, CheY, or
methylesterase, CheB. Phosphorylated CheY binds to the flagellar motor and causes the
cell to tumble. Upon ligand binding, the receptor inhibits CheA which causes the cell to
stop tumbling. Ligand binding also causes an increase in the rate of methylation of the
receptor at specific Glu methylation sites in the cytoplasmic region, by a methyltransferase,

2
CheR. This increase of methyl groups on the receptor shifts it back to kinase-activating
state (adaptation), which restores the basal tumbling level. Thus, the ligand-bound receptor
is a kinase-off/ methylation-on state, and the ligand-free receptor is a kinase-on/
methylation-off state (Figure 1.1).
Figure 1.1. Schematic diagram of E. coli chemotaxis pathway and two receptor signaling
states. The receptors are homodimers (green and cyan rods) that form ternary complexes
with CheA (blue circle) and CheW (cyan circle). The methylation-on/ kinase-off state on
the left occurs when ligand binds to the receptors which inhibits CheA phosphorylation.
The methylation-off/ kinase-on state (right) promotes CheA phosphorylation and
phosphotransfer to CheY (gray circle), which causes the cell to tumble. CheR (black circle)
is the methyltransferase that methylates the receptors and shifts the equilibrium back to the
kinase-on state.
1.2. Structure of Receptors and Functional Arrays
Bacterial chemoreceptors are 60 kDa α–helical homodimers that are 380Å long
from the periplasmic tip to the cytoplasmic tip (Wadhams and Armitage, 2004). They
contain a periplasmic domain, a transmembrane domain, and a cytoplasmic domain that
couples with CheA and CheW. The cytoplasmic domain consists of a HAMP (histidine

3
kinases, adenylyl cyclases, methyl-accepting chemotaxis proteins, and phosphatases)
(Aravind and Ponting, 1999) domain, methylation region, and protein interaction region
that interacts with CheA and CheW (Kim et al., 1999) (Figure 1.1). Electron
cryotomography (ETC) and fluorescence microscopy have shown these receptors organize
themselves with CheA and CheW to form hexagonal arrays at the cell poles (Maddock and
Shapiro, 1993; Zhang et al., 2007; Briegel et al., 2012; Cassidy et al., 2015). It is a
challenge to investigate the mechanism within these functional complexes with native
structure. Because transmembrane regions of membrane proteins are highly hydrophobic,
which requires a detergent or lipid environment, it can be difficult to stabilize the structure
and function. Detergent-solubilized receptors retain native ligand-binding affinity but are
not methylated by CheR and do not activate CheA (Shrout et al., 2003). Intact receptors in
vesicles and nanodisc preparations (Li and Weis, 2000; Falke and Hazelbauer, 2001; Amin
and Hazelbauer, 2012) do exhibit methylation and kinase activity. However, samples in
these preparations are heterogeneous due to impurities and lack of control of the orientation
of the receptor. A recent electron cryotomography study shows that vesicle preparations
produce heterogeneous orientations and structures of receptors, including formation of
aggregates and zippers that are 9 nm center-to-center spacing (native hexagonal arrays are
12 nm) and both inward and outward oriented vesicles (Briegel et al., 2014). So far, there
is no homogeneous preparation for functional complexes of intact receptors assembled with
CheA and CheW. Weis and his coworkers (Shrout et al., 2003) have developed a method
to assemble functional complexes of a cytoplasmic fragment (CF) onto the surface of large
unilamellar vesicles (LUVs). The His-tagged CF binds the Ni2+ chelating headgroups of
the vesicles as illustrated in Figure 1.2. Functional complexes assembled using this method
4
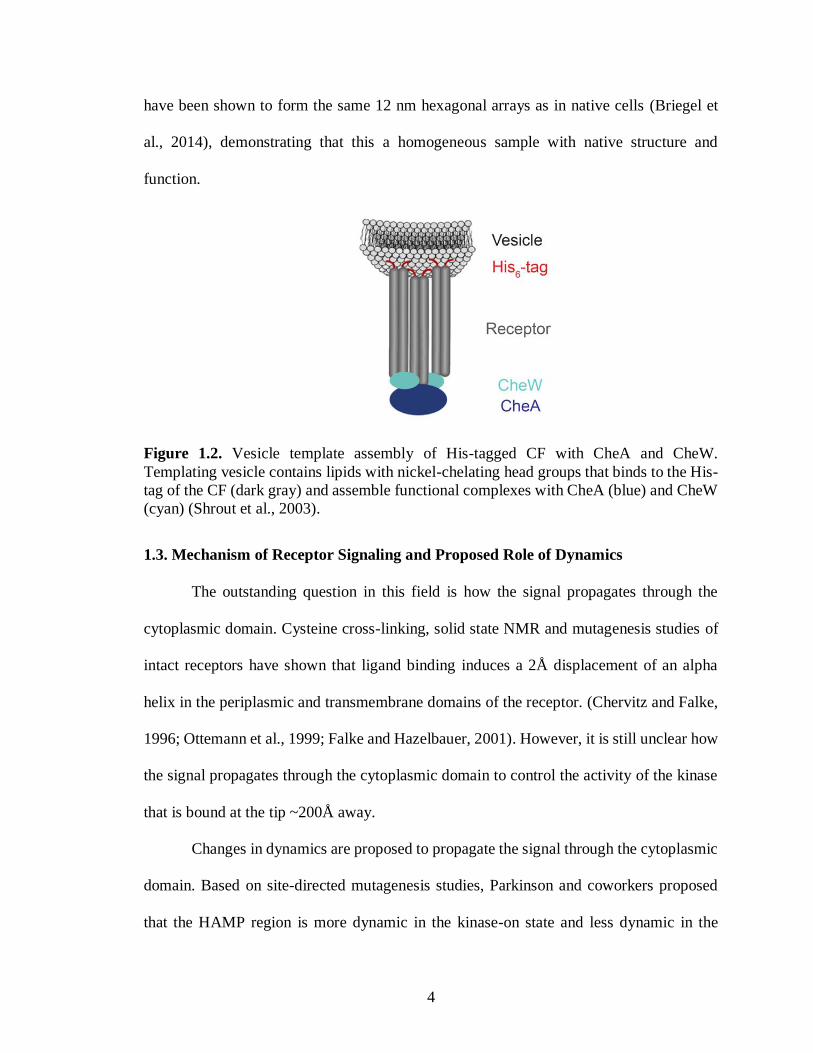
have been shown to form the same 12 nm hexagonal arrays as in native cells (Briegel et
al., 2014), demonstrating that this a homogeneous sample with native structure and
function.
Figure 1.2. Vesicle template assembly of His-tagged CF with CheA and CheW.
Templating vesicle contains lipids with nickel-chelating head groups that binds to the His-
tag of the CF (dark gray) and assemble functional complexes with CheA (blue) and CheW
(cyan) (Shrout et al., 2003).
1.3. Mechanism of Receptor Signaling and Proposed Role of Dynamics
The outstanding question in this field is how the signal propagates through the
cytoplasmic domain. Cysteine cross-linking, solid state NMR and mutagenesis studies of
intact receptors have shown that ligand binding induces a 2Å displacement of an alpha
helix in the periplasmic and transmembrane domains of the receptor. (Chervitz and Falke,
1996; Ottemann et al., 1999; Falke and Hazelbauer, 2001). However, it is still unclear how
the signal propagates through the cytoplasmic domain to control the activity of the kinase
that is bound at the tip ~200Å away.
Changes in dynamics are proposed to propagate the signal through the cytoplasmic
domain. Based on site-directed mutagenesis studies, Parkinson and coworkers proposed
that the HAMP region is more dynamic in the kinase-on state and less dynamic in the

5
kinase-off state, and that the methylation region has the inverse dynamics (Zhou et al.,
2009). Falke and coworkers used cysteine cross-linking to show that disulfide bonds
formed in the methylation region lock receptors in the kinase-on state. Furthermore,
mutations to Ala in the methylation region are locked in the kinase-off state but mutations
to alanine in the protein interaction region are locked in the kinase-on state (Swain et al.,
2009). Figure 1.3 illustrates the dynamic model that Parkinson, Falke and coworkers
proposed based on these data: the HAMP and protein interaction regions are stabilized and
the methylation region is destabilized in the kinase-off state relative to the kinase-on state.
Studies thus far support proposed the decreased dynamics in the methylation region in the
kinase-on or methylated state, but have also reported decreased dynamics in the protein
interaction region. Electron paramagnetic resonance (EPR) and site-specific spin labels to
measure the mobility of backbone of cytoplasmic domain of Tar in nanodiscs indicate that
the methylation region is less dynamic in the kinase-on state, but ligand binding causes no
changes in dynamics (Bartelli and Hazelbauer, 2016). Pulsed dipolar ESR spectroscopy
was applied to kinase-on and kinase-off fusions of Tar with Aer HAMP domains. HAMP
shows increased dynamics and the protein interaction region shows decreased dynamics in
the kinase-on state (Samanta et al., 2015). A hydrogen exchange (HDX) study in functional
complexes of CF, CheA, and CheW bound to vesicles shows both the methylation and
protein interaction regions are less dynamic in the kinase-on state (Koshy et al., 2014).
Finally, a recent INEPT (insensitive nuclei enhanced by polarization transfer) NMR study
on similar functional CF complexes demonstrates that the N-terminal methylation helix
shows more dynamics in the kinase-off state (Kashefi and Thompson, 2017).
6
A follow-up HDX study on the functional complexes is needed with more
homogeneous samples. Greater vesicle surface area is needed to incorporate all CF to form
hexagonal arrays with CheA and CheW. The prior study used different vesicle densities to
control signaling state, but density could alter HDX via changes in solvent exposure. A
locked-off mutant is used in this study to better control the signaling states. In addition,
high resolution mass spectrometry with ion mobility separation (Waters Synapt G2Si) is
used to obtain more overlapping peptides, contributing to both reproducibility and
resolution.
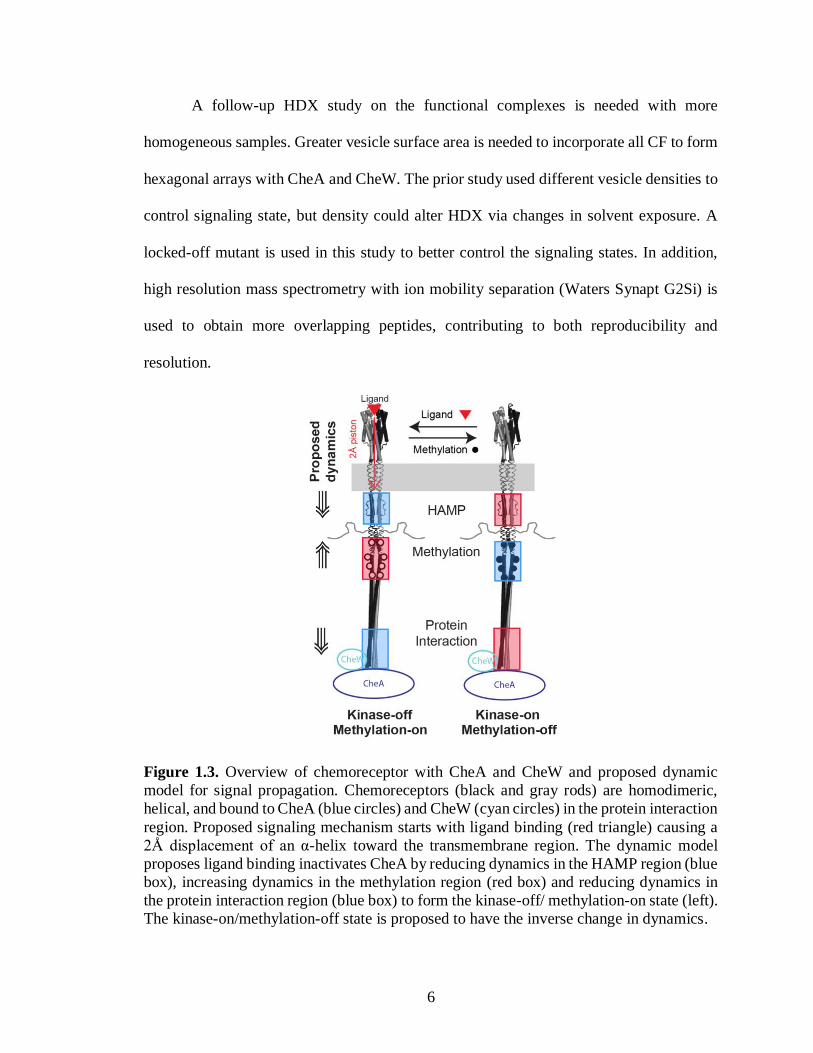
Figure 1.3. Overview of chemoreceptor with CheA and CheW and proposed dynamic
model for signal propagation. Chemoreceptors (black and gray rods) are homodimeric,
helical, and bound to CheA (blue circles) and CheW (cyan circles) in the protein interaction
region. Proposed signaling mechanism starts with ligand binding (red triangle) causing a
2Å displacement of an α-helix toward the transmembrane region. The dynamic model
proposes ligand binding inactivates CheA by reducing dynamics in the HAMP region (blue
box), increasing dynamics in the methylation region (red box) and reducing dynamics in
the protein interaction region (blue box) to form the kinase-off/ methylation-on state (left).
The kinase-on/methylation-off state is proposed to have the inverse change in dynamics.

7
1.4. Hydrogen Deuterium Exchange Mass Spectrometry Studies of Structure and
Dynamics
HDXMS is one of the methods that can monitor structure and dynamics of proteins
in different states and conditions at both the global and local level. It can be used to
understand the mechanism of protein folding pathways and binding interactions of protein.
HDXMS has been used to monitor dynamics of membrane proteins in detergent micelles
and nanodisc membranes (Chung et al., 2011; Morgan et al., 2011; Kacprzyk-Stokowiec
et al., 2014; Duc et al., 2015).
HDX-MS can be conducted on native proteins using physiological conditions
during labeling which will not disturb the structure of the proteins. Hydrogen deuterium
exchange (HDX) is initiated by transferring proteins or complexes from protonated buffer
to deuterated buffer. Hydrogens in proteins exchange continuously with deuterium in the
solvent. Exposed or highly dynamic regions will exchange in a short time while the buried
core of the protein and less dynamic regions will exchange much slower (Marcsisin and
Engen, 2010), as illustrated in Figure 1.4.

8
Figure 1.4. Overview of hydrogen deuterium exchange in proteins. (A) Amino acid
sequence with backbone amide hydrogen (blue) and side chains (R1, R2, R3). After protein
is placed in deuterated buffer, amide hydrogens exchange with deuterium (red) from
solvent. (B) Amide hydrogens in solvent exposed regions (surface loops) and dynamic
regions will undergo exchange in short time; amide hydrogens in protected and rigid region
undergo exchange in long time (Marcsisin and Engen, 2010).
1.5. Objective of this study
Here, we report hydrogen deuterium exchange mass spectrometry studies of
functional, native-like complexes in defined signaling states to gain insight into the
signaling mechanism of chemoreceptors. We look at the effect of the methylation and
signaling state on the CF in the functional complexes using vesicle template assembly with
CheA and CheW. To investigate effects of methylation, HDX-MS is performed on vesicle-
assembled native-like arrays prepared with CF4Q or CF4E, both assembled at the same
density on vesicles. To prepare CF4Q in the kinase-off state, we introduce the A411V
mutation, which has been shown to lock the receptor into the kinase-off state (Ames and
Parkinson, 2006) and is also methylation-on (Kashefi and Thompson, 2017), so it faithfully
mimics the signaling state and is not just a disruption of kinase activation. As discussed in
the methods in Chapter 2, samples are optimized with sufficient vesicle surface area to
incorporate all CF to form native-like hexagonal arrays with maximum CheA and CheW
binding (Haglin, 2018).
Chapter 3 in this dissertation reports the HDX measurements on CF and provides
insights into its properties and changes with methylation and signaling states. Within the
functional complexes, all of CF shows evidence of populating a long-lived unfolded state
(correlated HDX) and most undergoes rapid exchange, except the protein interaction region
that is stabilized by interactions with CheA and CheW. The methylation and protein
9
interaction regions of the receptor CF are destabilized in the kinase-off state. Methylation
stabilizes the entire CF, with similar but less dramatic changes between signaling states.
Chapter 4 describes preliminary HDX results on CheA. No significant differences
between the kinase-on and kinase-off state are observed, perhaps because only 1/3 of CheA
is in complexes. Some differences between free CheA and CheA in complexes suggest
HDX will be informative when performed on samples with homogeneous CheA. This sets
the stage for future studies to gain insights into the control of CheA kinase.
Finally, based on insights from HDX behavior of CF, Chapter 5 presents a new
proposal that signal propagation involves an order/disorder transition of the cytoplasmic
domain: protein binding at the tip stabilizes an ordered structure; piston and demethylation
destabilize the structure and thus the interactions with CheA, leading to the kinase-off state.
In summary, the work presented in this dissertation uses hydrogen deuterium exchange
mass spectrometry to gain insight into the signaling mechanism in bacterial chemotaxis
receptors, and the preliminary results on CheA demonstrate a promising approach for
future studies to understand how the kinase activity is controlled.

10
CHAPTER 2
MATERIALS AND METHODS
2.1. Protein Expression and Purification
2.1.1. His-tag Tar cytoplasmic fragment (CF)
BL21(DE3) E. coli cells bearing plasmids for expression of His-tagged CF
(pHTCF4Q, ampR (Shrout et al., 2003) or pCF4Q.A411V, ampR (Haglin et al., 2017)), and
also co-transformed with pCF430 (tetR), were streaked on Luria-Bertani (LB) agar platea
with ampicillin (150 µg/mL) and tetracycline (10 µg/mL) and incubated at 37°C overnight.
The following day, mutliple single colonies from the plate were each transferred to 2 mL
LB broth containing the same concentration of antibiotics and grown until the optical
density at 600nm (OD600) reached 0.6 at 37°C with 200 rpm shaking. The 2 mL LB cultures
were split into 3 culture tubes; one containing 100 µL culture was stored at 4°C for
overnight growth later. The other two each contained 700 µL culture, and 1 mM IPTG was
added to one of these to check protein expression; both were grown at 37°C with 200 rpm
shaking for 1 hour. Gel samples of both cultures were prepared and run on 15% SDS-
PAGE to check protein expression. Cells from the uninduced culture with the best
expression were then inoculated into a 2 L culture containing the same concentrations of
the antibiotics. This large scale culture was incubated in a 37°C shaker until OD600 reached
~0.6, followed by induction with 1mM IPTG overnight at 10°C. The cells was harvested
by centrifugation at 3500 rpm (Beckman Coulter Allegra 6R Tabletop centrifuge, G38
swinging bucket rotor) at 4°C for 30 min, and then resuspended in lysis buffer (75 mM
KxHxPO4, 500 mM NaCl, 5 mM imidazole, and 1mM EDTA at pH 7.5) and lysed using
microfluidizer (Microfluidics, Inc) at 16K psi on ice. 1mM PMSF was added every hour

11
to prevent proteolysis. Cell debris was separated using centrifugation at 10,000 rpm at 4°C
for 90 min in a Sorvall RC-5B centrifuge, SS-34 rotor. Supernatant was then passed
through a HisTrap FF Ni2+-NTA affinity column (GE Healthcare) that had been
equilibrated with 10 column volumes of equilibration buffer (75 mM KxHxPO4, 500 mM
NaCl, 5 mM imidazole at pH 7.5). The column was washed with 10 column volumes of
wash buffer (75 mM KxHxPO4, 500 mM NaCl, 50 mM imidazole at pH 7.5) to remove
loosely bound proteins. CF was eluted with elution buffer (75 mM KxHxPO4, 500 mM
NaCl, 500 mM imidazole at pH 7.5) and located in the fractions by SDS-PAGE. Fractions
containing CF were combined and treated with 5 mM EDTA to chelate any Ni2+ that came
from the column. The CF solution was then placed in a dialysis bag with 7 kDa molecular
weight cutoff, and dialyzed against dialysis buffer (75 mM KxHxPO4, 75 mM KCl at pH
7.5) overnight at 4°C to remove EDTA and imidazole. Typically the dialysis was against
2L of dialysis buffer overnight, and then an additional 4 hour dialysis against 2L of fresh
dialysis buffer, so that the calculated remaining EDTA and imidazole concentrations would
be less than 0.01mM. The concentration of CF is determined using BCA assay (Thermo
Scientific).
2.1.2. TEV-cleavable His-tagged CheA and CheY
His-tagged CheA (pTEV-cheA, kanR) and CheY (pTEV-cheY, kanR) (Kashefi and
Thompson, 2017)were expressed in BL21(DE3) with 50 µg/mL kanamycin. Protein
expression and growth protocols were the same as His-tagged CF except CheA was
induced at 37°C for 3 hours, but CheY was induced overnight at 4°C. The same purification
protocol was used to purify CheA and CheY, except using different buffers: lysis buffer
(75 mM Tris-HCl, 100 mM KCl, and 1 mM EDTA at pH 7.4), equilibration buffer (75 mM

12
Tris-HCl, 100 mM KCl at pH 7.4), wash buffer (75 mM Tris-HCl, 100 mM KCl, 10 mM
imidazole at pH 7.4), elution buffer (75 mM Tris-HCl, 100 mM KCl, 250 mM imidazole
at pH 7.4), and dialysis buffer (75 mM Tris-HCl, 100 mM KCl at pH 7.4). Proteins were
concentrated using 10 kDa cutoff Amicon filters centrifuged in a Beckman Coulter Allegra
6R Tabletop centrifuge, G38 swinging bucket rotor at 4°C at 3000 rpm until the volume
was around 3 mL. A280 was used to estimate the concentrations of CheA and CheY
(extinction coefficients of 25000 M-1cm-1 for CheA and 6970 M-1cm-1 for CheY (Lukat et
al., 1991)) to choose conditions for TEV cleavage.
2.1.3. TEV-cleavable His-tagged CheW
DH5α bearing a plasmid for TEV-cleavable His-tagged CheW (pSJCW) was
streaked on LB/Agar plate with 50 µg/mL ampR and incubated at 37°C overnight. Note
that pSJCW grew very slow and … The following day, a single colony from the plate was
transferred to 2 mL LB broth which contained the same concentration of antibiotic and
grown at 37°C with 200 rpm shaking until the optical density at 600nm (OD600) reached
0.6. Expression check, large scale growth and protein purification were the same as
described in previous section except that cell debris was spun down in a pre-chilled
centrifuge (Sorvall, SS-34 rotor) at 10,000 rpm at 4°C for 1 hours followed by 1 hour of
ultracentrifugation (Beckman OptimaTM LE, 80K, SW28 rotor) at 28,000 rpm (104000 x
g) at 4°C. Different buffers were also used: lysis buffer (50 mM KxHxPO4, 300 mM KCl,
10 mM imidazole at pH 8.0); wash buffer (50 mM KxHxPO4, 300 mM KCl, 50 mM
imidazole at pH 8.0); elution buffer (50 mM KxHxPO4, 300 mM KCl, 250 mM imidazole
at pH 8.0) and verified by SDS-PAGE gel. Fractions contained proteins were combined
and treated with 5 mM EDTA to chelate any Ni2+ came off from the column. Protein were

13
then placed in dialysis bag with 7 kDa molecular weight cutoff dialyzed in 2 L of dialysis
buffer (75 mM KxHxPO4 at pH 7.5) overnight at 4°C to remove EDTA and imidazole until
EDTA and imidazole concentration is less than 0.01mM. Proteins were then placed in 10
kDa cutoff Amicon to centrifuge (Beckman Coulter Allegra 6R Tabletop centrifuge, G38
swinging bucket rotor) at 4°C at 3000 rpm until volume was around 3 mL. A280 was used
to estimated concentration of CheW with coefficient 5120 M-1cm-1 before TEV cleavage
(Gegner and Dahlquist, 1991).
2.1.4. TEV-protease
TEV-protease with an N-terminal His tag was expressed from the plasmid pRK793
(ampR) given from D. Waugh, Addgene plasmid (Kapust et al., 2001) BL21(DE3)-RIL
(camR) cells containing this plasmid were streaked on an LB/Agar plate containing 150
µg/mL ampicillin and 50 µg/mL chloramphenicol, and incubated at 37°C overnight. Liquid
cultures were grown in LB containing the same antibiotic concentrations at 37°C until
OD600 reached 0.6–0.8. Expression was then induced with 1 mM IPTG for 4 hours and
TEV protease was purified as described in section 2.1.1. for purification of CF.
2.1.5. His-tag cleavage
After concentrating each protein to around 3mL, CheA, CheW and CheY were
incubated with TEV-protease at 50:1 His-tagged protein: TEV-protease ratio. The mixture
was stirred at 4°C for overnight and an additional 2 hours at 25°C. Cleavage by TEV was
assessed by SDS-PAGE gel shift; if incomplete cleavage was observed, the sample was
again incubated overnight at 4°C and assessed by SDS-PAGE. Cleaved proteins were then
purified using the HisTrap column as described in section 2.1.1, except the TEV protease
14
was bound to the column and the flow-through contained the TEV-cleaved proteins.
Proteins were then concentrated in 10 kDa molecular cutoff Amicon at centrifuge
(Beckman Coulter Allegra 6R Tabletop centrifuge, G38 swinging bucket rotor) at 4°C at
3000 rpm until desired volume reached. BCA assay (Thermo Scientific) was used to
determine the final concentrations of all CF, CheA, CheW and CheY solutions. Proteins
were aliquoted into 1.5 mL Eppendorf tube, flash frozen with liquid nitrogen, and store at
-80°C.
2.2. Lipid Vesicles
Vesicles were prepare using DOPC (1,2-dioleoyl-sn-glycero-3-phosphocholine)
and the nickel-chelating lipid DOGS-NTA-Ni2+ (1,2-dioleoyl-sn-glycero-3-{[N-(5-amino-
1-carboxypentyl)-iminodiacetic acid]succinyl}) (Avanti Polar Lipids) mixed in a 1.5:1
ratio. The mixture was dried under N2 and kept under vacuum for at least 1 hour before
resuspension in 1x kinase buffer (50 mM KxHxPO4, 50 mM KCl, and 5 mM MgCl2 at pH
7.5). The mixture was then subjected to five freeze thaw cycles: freeze with liquid nitrogen
for 20-30 s, leave on the bench for 3 min, thaw in 37°C water bath for 3 min. Lipid vesicles
were then extruded using an extrusion apparatus (Avanti Polar Lipids), for 15 passes
through a 100 nm diameter pore size membrane. A total stock concentration of 3 mM lipid
(DOPC and DOGS-NTA-Ni2+) was used to assemble functional complexes; a final
concentration of 725 µM lipid was used in the assembly. This lipid concentration was
chosen to accommodate all of the 30µM CF in hexagonal arrays: (Appendix for detail).
Concentrations of 12 µM CheA and 24 µM CheW were previously demonstrated to yield
maximal kinase activity and native stoichiometries of ~ 6 CF:1 CheA: 2 CheW (Haglin,
2018). Note that another optimization study measured activity of CF4Q samples assembled

15
with lipid concentrations ranging from 1000-2500µM lipid: activity at 1300 µM lipid was
~ 20% higher than with 1000 µM lipid (25 µM CheA, 20µM CheW).
2.3. Vesicle and PEG Complex Assembly
Vesicle complexes were assembled with autoclaved water, phosphate kinase buffer,
1 mM PMSF in ethanol, 12 µM CheA, 24 µM CheW, 30 µM CF (CF4Q, CF4Q.A411V or
CF4E), 725 µM vesicles (Shrout et al., 2003). PEG complexes were assembled with
autoclaved water, phosphate kinase buffer, 1 mM PMSF in ethanol, 12 µM CheA, 20 µM
CheW, 50 µM CF4Q, 7.5% w/v PEG 8000 (from 40% w/v stock), 4% w/v D-trehalose
(from 40% w/v stock) (Fowler et al., 2010). Order of addition is the same as the order
described. Complexes were incubated 4 hours or overnight at 37°C water bath before
testing the activity.
2.4. Biochemical Assays
2.4.1. Spectrophotometric kinase activity
CheA kinase activity was monitor by a UV spectrophotometric assay of the
decrease of NADH over time in the absorbance at 340 nm for 90 seconds (Shrout et al.,
2003). 2 µL of vesicles or PEG complex was mixed with 178 µL of CheY mixture which
contained 55 µM CheY, 20 units of enzyme (lactate dehydrogenase (LDH) and pyruvate
kinase (PK)) (Sigma-Aldrich) and phosphate kinase buffer; and 20 µL of fuel which
contains 4 mM ATP, 2.2 mM phosphoenolpyruvate (PEP), and 250 µM NADH in
phosphate kinase buffer at pH 7.4. The background of CheY was checked every time before
checking any kinase activity of complexes. Adjusted kinase activity was calculated by
subtracting the slope of the CheY-only background control from the slope of the

16
absorbance change at 340 nm of the complex. Specific kinase activity per CheA (s-1) was
calculated using (the adjusted slope as abs/min) x (1 min/60 sec) x (200 µL/2 µL) / (6220
abs/M (the molar absorptivity of NADH)) x (CheA concentration in M in the assembly).
CheA concentration is either the amount of CheA bound to CF (determined by gel
quantification in the protein binding assay, as described in 2.4.2.) for the specific activity,
or the full 12 µM CheA for the total activity.
2.4.2. Protein binding assay
Sedimentation assay was used to determine amount of protein bound to vesicles to
form functional complexes. 40 µL of functional complexes was spun in tabletop
ultracentrifuge (Beckman TLX, TLA 120.2 rotor, 60,000 rpm, at 25°C for 30 min. Prior to
sedimentation, a gel sample was prepared corresponding to the total amount of CF, CheA,
and CheW in the sample. After sedimentation, the supernatant which contained unbound
CF, CheA and CheW was removed and placed in a clean Eppendorf tube and used to
prepare a supernatant gel sample. The pellet was resuspended to the original volume using
1x kinase buffer, vortexed, and used to prepare a pellet gel sample. Total, supernatant and
pellet gel samples were run on 12.5 or 15 % acrylamide SDS-PAGE along with gel samples
that contained known concentrations of CF, CheA and CheW for calibration purposes. Gels
were then imaged by densitometry with a Gel Doc EZ Imager (Bio-Rad) and were analyzed
with ImageJ software (Schneider et al., 2012). The amount of proteins bound were
determined by (ITotal-ISupernatant) x [Protein]Total. The stoichiometry of the proteins in the
arrays was calculated based on (1) the ratios of the concentrations calculated from the total
minus super, and (2) the ratios of band intensities in the pellet fraction. The resulting
stoichiometries from both methods were similar and were averaged to determine the

17
reported stoichiometry. Intensity of proteins in the known concentration gel samples
(dilution series) were used to make a calibration curve to correct the background intensity
and calculate the protein concentrations and ratios.
2.5. HDX Mass Spectrometry Measurements
2.5.1. HDX sample preparation
Vesicle-mediated complexes (CF4Q, CF4Q.A411V or CF4E with CheA and
CheW) were assembled and incubated overnight as described in 2.3. Kinase activity and
protein binding were checked (as described in 2.4) to be sure complexes were active and
to monitor the amount of CheA and CheW bound to CF throughout the time-course of
exchange. A desalting column was used for exchange (rather than dilution with a
deuterated buffer) to avoid initiating dissociation of the complexes. Before initiating
exchange, a 2 mL G10 Sephadex Zeba desalting column (Pierce Biotechnology) was pre-
equilibrated with deuterated 1x kinase buffer (50 mM KxHxPO4, 50 mM KCl, and 5 mM
MgCl2 at pD 7.5, pH reading 7.1 in D2O) at 25°C as follows: spin at 2000 rpm for 2 min
in a tabletop centrifuge (Beckman Coulter Allegra R Tabletop Centrifuge), discard the
flow-through, add 1 mL deuterated buffer to the top of the column, spin again and repeat
until the column has been exchanged with a total of 4 ml of deuterated buffer. Exchange
was initiated by adding 1 mL of complexes to the pre-equilibrated column followed by
centrifugation at 2000 rpm for 2 min at 25°C. The eluted solution of exchanged complexes
was incubated in a 25°C water bath. For each time point of exchange, 22.5 µL was
transferred into a pre-chilled Eppendorf tube containing 22.5 µL quench buffer (1% formic
acid, 20% w/v glycerol, 1M GuHCl at pH 1.6) in a 0°C ice-water bath. Each sample was

18
immediately vortexed, flash-frozen in liquid nitrogen, and stored at -80°C. Undeuterated
samples were prepared in the same manner, without the buffer exchange step on the column
(22.5 µL of the initial assembly added to 22.5 µL of pre-chilled quench buffer and then
flash-frozen).
The reversible heat denaturation of CF was used for preparation of a fully-
exchanged sample (Murphy et al., 2001; Koshy et al., 2014), which was subjected to the
mass spectrometry protocol to measure the back exchange for each peptide of our protocol.
The fully-exchanged sample was prepared by applying 1 mL of a 30 µM CF4Q solution to
a desalting column for buffer exchange into D2O (as described above). The exchanged
CF4Q was then placed in an 80°C water bath for denaturation for 1 hour, followed by 30
min in 0°C ice-water bath. The sample was prepared as described above (22.5 µL added to
22.5 µL of pre-chilled quench buffer and then flash-frozen).
2.5.2. HPLC column preparation and maintenance
For the MS analysis, a high performance liquid chromatography (HPLC) column
was used for desalting and peptide separation. Before each set of mass spectrometry
experiments, the HPLC column (2.1 mm x 5 cm C18 reverse phase column from Higgins
Analytical) was connected to an LC pump (Agilent 1100G1312A) and cleaned by flowing
200 µL/min of Buffer B (0.1% formic acid in acetonitrile) overnight. At the end of each
mass spectrometry experiment, the column was stored with 100% Buffer B. Every two
months, the column was subject to deep cleaning by flushing with 20 column volumes of
water, 20 column volumes of acetonitrile, 5 column volumes of isopropanol, 20 column
volumes of heptane, 5 column volumes of isopropanol, and then 20 column volumes of
acetonitrile at 200 µL/min.
19
2.5.3. HDX-MS data acquisition
2.5.3.1. HPLC method
The HPLC column (in a cold box, as described below) was equilibrated with 95 %
Buffer A (0.1% formic acid in water). Peptides were eluted at 2 µL/min directly into the
Waters Synapt G2Si with the following gradient programmed into the nanoACQUITY
UPLC console system: 5% Buffer B for 3 min for removing salt in the sample, gradient
from 5-50% Buffer B for 12 min to separate peptides, hold at 50% Buffer B for 3 min to
elute all remaining peptides, 95% Buffer B for 7 min to clean the column, 5% Buffer B for
15 min to equilibrate the column for the next injection. Only the 3-18 min portion of this
protocol was injected into the mass spectrometer. The initial 3 min (containing salts) and
the 18-40 min cleaning (containing lipids) and equilibration were sent to waste.
2.5.3.2. MS method
At least one undeuterated sample was run on each day of MS experiments with
collision ion-induced dissociation MSE mode. The mass spectrometer was calibrated in
positive ion mode using sodium formate. All samples were acquired in positive ion mode
with ion mobility separation in mass range from 100-2000 Da. Lockspray of 556.2771 Da/e
with single charge was continuously infused at 2 µL/min; the lockspray signal was acquired
every 30 s for correcting mass.
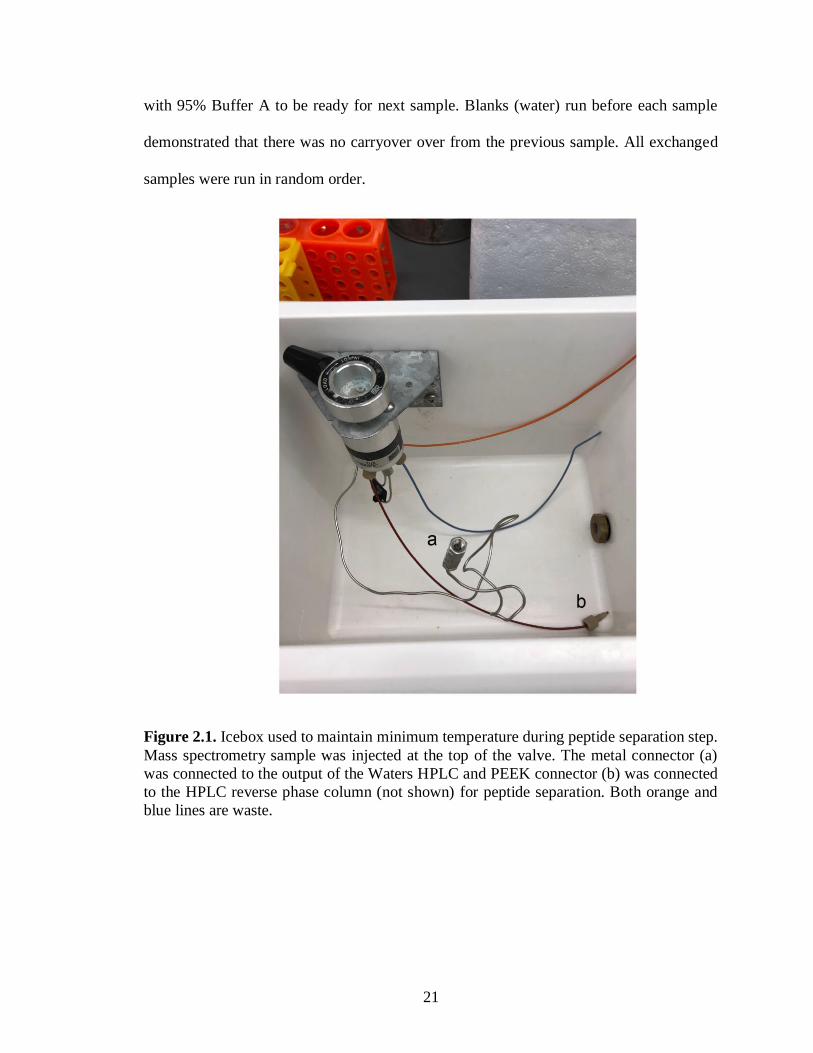
2.5.3.3. MS protocol for minimizing back exchange and eliminating carryover
The HPLC separation was performed in an ice box filled with ice water to maintain
the sample temperature near 0 °C, as shown in Figure 2.1. The metal connector (a) is
connected to the HPLC output, and the orange and blue lines are waste. The PEEK

20
connector (b) is connected to the column, and the other end of the column is connected to
the mass spectrometer sample injection port. During the experiment, the box is kept filled
with ice to just above the metal clamp holding the injection valve (but below the top of the
valve). This protocol was chosen to minimize back-exchange: the solvent is pre-chilled and
sample travels through minimal length of tubing (59 cm before column and 69 cm after
column) kept in ice water). Nano ACQUITY UPLC was connected to ice box bypassing
the cold box from the Waters system and connect to HPLC reverse phase column and then
directly connect to ion source on the Water Synapt. Valves and lines in ice box were
cleaned using methanol, water, 50% isopropanol, 100% acetonitrile, each injected 5x with
a 250 µL syringe in both load and inject positions. After connecting to the HPLC, the lines
were further cleaned by loading 95% Buffer B for 15 min at flow rate 100 µL/min, with
the valve first in the load position and then again with the valve in the inject position. The
column was then connected to the PEEK connector (avoiding air bubbles) and then
equilibrated with 95% buffer B for 15min at flow rate of 100µlL/min, then equilibrated
with 95% buffer A for 15min at flow rate of 100µL/min. The ice is then added to the ice
box.
Just before the MS experiment, samples were thawed for 1 min in a 0°C ice water
bath, pepsin (Sigma Aldrich) was added in a 1:1 protein: enzyme molar ratio, digestion
proceeded for 1 min at 0°C, and then x µL was immediately injected into the injection
valve to flow through the column in icebox and into to mass spectrometer. One fully-
exchanged control sample was run each day of experiments to measure back exchange.
After each sample acquisition finished, the end of the HPLC protocol (7 min 95%
buffer B) removed lipid from the column, and the column was then equilibrated for 15 min
21
with 95% Buffer A to be ready for next sample. Blanks (water) run before each sample
demonstrated that there was no carryover over from the previous sample. All exchanged
samples were run in random order.
Figure 2.1. Icebox used to maintain minimum temperature during peptide separation step.
Mass spectrometry sample was injected at the top of the valve. The metal connector (a)
was connected to the output of the Waters HPLC and PEEK connector (b) was connected
to the HPLC reverse phase column (not shown) for peptide separation. Both orange and
blue lines are waste.

22
2.5.4. HDX data analysis
2.5.4.1. Peptides identification by ProteinLynx Global Service
Accurate mass and protein sequences were loaded on ProteinLynx Global Service
(PLGS) version 3.0 software from Waters, to determine the peptides in the undeuterated
samples. Process parameters were set to using 556.2771 Da/e as lock mass for charge 1,
lock mass window as 0.25 Da with non-specific primary digest reagent. Peptide results
generated by PLGS were then imported to DynamX version 3.0 software for further
analysis.
2.5.4.2. Peptide analysis by DynamX
Peptide results were imported into DynamX version 3.0 with the minimum intensity
set to 5000, minimum products per amino acid to 0.3, maximum sequence length of 25
amino acids, retention time RSD to 2%. Peptides were manually checked to be sure they
each contained a minimum of 3 consecutive product ions. Mass spectra of different
exchanged time point files were imported to DynamX for fetching ions and spectra. Each
isotope peak in the isotopic distribution for a peptide was checked to be sure that all had
the same retention time and ion mobility. Different charge states of the same peptide were
checked to be sure they had the same retention time (but different mobilities). These were
also compared across samples to be sure that the same peptide exhibited very similar
retention times and mobilities in the different samples. The deuterium incorporation of
each peptide was determined by subtracting the centroid mass of the undeuterated sample
from that of the deuterated sample at each time point. The significant difference between
two states is calculated using the standard error mean of all peptides that derive from the

23
standard deviation of the all peptides and multiply by the degree of freedom of 95%
confidence interval. Note that standard error mean is calculated by the standard deviation
of all peptides divided by the square root of number of data sets (Houde et al., 2011).
2.5.4.3. EX1 Analysis using HX-Express2
HX-Express2 (Guttman et al., 2013) was used to deconvolute bimodal patterns into
two distributions. Analyzed mass spectra in ion mobility mode was copied and pasted into
excel file in the format with m/z in the first column and intensity in the second column;
time points were indicated in the first row. Note that this file format of m/z and intensity is
needed in order for the program to run correctly. HX-express was installed as an Add-in
for Excel (only works on a PC). Analysis was initiated with “Analyze Spectra” (HX-
Express menu) followed by specifying the charge state (z), distribution width of 20% of
BPI (base peak intensity), and using isotopic peak detection with peak tolerances of 5% of
BPI (intensity) and 3 data points (m/z). The Output tab selections were Relative deuterium
level, Plot width of isotopic distribution, and apply smoothing (4 channel Savitsky-Golay).
Savitsky-Golay is only needed if smoothing has not been previously applied to spectra.
Spectra were then analyzed using binomial fitting by providing the number of amides of
the peptide and specifying a fitting asymmetry of 1. Note that number of amides of the
peptide was calculated as the number of residues – 1– number of prolines. Each time point
that exhibits a bimodal distribution was deconvoluted with “Double Binomial”. Finally,
“Summarize Double” provided a work sheet with the deconvolution plots and the
probability and relative intensity of both low and high mass distributions.

24
CHAPTER 3
HDX-MS RESULTS ON FUNCTIONAL SIGNALING COMPLEXES:
PROPERTIES AND SIGNALING-RELATED CHANGES OF THE RECEPTOR
CYTOPLASMIC FRAGMENT
3.1. HDX-MS approach for investigating properties of receptor cytoplasmic domain
within functional complexes
The use of hydrogen deuterium exchange mass spectrometry to investigate the
structure and dynamics of the chemoreceptor cytoplasmic domain first requires preparation
of homogeneous, functional complexes of the receptor with its cytoplasmic partners, CheA
and CheW. Such homogeneity has not yet been achieved for the intact receptor, due to the
challenge of controlling the orientation of insertion of the intact receptor into membrane
vesicles or nanodiscs. Thus, we chose to assemble the receptor CF into native-like,
functional complexes with CheA and CheW, using a vesicle templating method developed
by Weis and coworkers (Shrout et al., 2003). CF in solution is not functional: it does not
activate CheA and is not efficiently methylated. Binding of the His-tagged CF to the
surface of large unilamellar vesicles containing a mixture of DOPC and DGS-Ni, in the
presence of CheA and CheW, restores function (CF becomes a good substrate for
methylation and also activates the CheA kinase) (Shrout et al., 2003) and also yields native-
like hexagonal arrays (Briegel et al., 2014). Homogeneity is maximized by (1) using excess
CheA and CheW to drive all of the CF into functional complexes, and (2) using a high
enough lipid concentration to accommodate all of the CF in functional complexes, based
on the known geometry of the hexagonal array observed in cells.

25
For HDX-MS experiments, these native-like complexes are assembled on vesicles
and then tested for kinase activity and incorporation of proteins into the array
(sedimentation assay). Measurements of kinase activity and protein binding, before
hydrogen exchange and after exchange for 16 hours, demonstrate that complexes have high
kinase activity, protein stoichiometries comparable to native arrays, and no significant loss
of activity or proteins throughout the HDX time course (Figure 3.1 and Table 3.1). Table
3.1 shows that 47-68% activity and native-like protein stoichiometries are retained even at
48 hours. Thus, the properties observed by HDX-MS are those of the cytoplasmic domain
of the receptor within functional signaling complexes. Complexes of the methylated-mimic
CF4Q and the unmethylated CF4E (both kinase-on) are compared to reveal effects of
methylation; complexes of the kinase-on CF4Q and the kinase-off CF4Q.A411V are
compared to reveal effects of signaling state.
The HDX experiment is initiated by a rapid transfer of the complex from H2O to
D2O. This is typically achieved in HDX studies by a 15-20-fold dilution into D2O, but such
dilution of a protein complex would cause dissociation during the exchange time course.
Therefore, exchange is initiated using a spin column, pre-equilibrated with deuterated
kinase buffer at 25 ˚C. For each exchange time point, an aliquot is removed, added to pre-
chilled quench buffer, and immediately flash-frozen. For MS analysis, each sample of the
hydrogen exchange series is thawed and digested with pepsin at 0˚C, followed by LC-ESI-
MS analysis on a Waters Synapt G2Si Q-TOF mass spectrometer. At least one
undeuterated sample and one fully deuterated sample (prepared by reversible heat
denaturation of CF in deuterated buffer) are included as controls on each day of mass

26
spectrometry; the fully deuterated sample (which undergoes back exchange equivalent to
that of all of the samples) provides a measure of complete exchange.
Figure 3.1. Kinase activity and protein binding within complexes of CF remain constant
over the timecourse of deuterium labeling. (A) Specific activity of CheA kinase assembled
into native-like complexes with CheW and His-tagged CF4Q (black) or CF4E (gray) bound
to vesicles. For each complex, kinase activity is high and does not change significantly
between 0 and 960 min (=16 hr). Activities are averages of four replicates measured on
two different days; error bars indicate ± one standard deviation. (B) Protein
stoichiometries, determined as the ratio of proteins in the sedimented complexes (SDS-
PAGE band intensities), within complexes of CF4Q and CF4E (both kinase-on) and
CF4Q.A411V (kinase-off). Sedimented CF (24-29 µM) was set to 6 for calculations of the
ratio of CF to CheA (blue) and CheW (cyan). Horizontal lines correspond to the levels of
CheA (solid line) and CheW (dashed line) observed in native arrays.
Table 3.1. Kinase activity and protein incorporation into functional complexes of CF4Q,
CF4Q.A411V, and CF4E, assembled on vesicles with CheA and CheW.
Time Specific Activitya
(s-1)
CFb (µM)
CheAb (µM)
CheWb (µM)
CF:CheA:CheWc
CF4Q
0min 23.3 ±5 24.3 ±2 3.7 ±0.1 10.8 ±0.1 6: 1: 2.7
960min (16 hr)
26 ±3 27 ±1.3 4.75 ±0.4 13.2 ±3.7 6: 1.2: 2.8
2880 min
(48 hr)
15.8 ±3.2 25 ±0.6 4.6 ±0.1 12 ±1.3 6: 1.2: 2.8
CF4Q.A411V 0min 0.04 ±0.14 24.4 ±0.5 3.75 ±0.2 11.6 ± 1.8 6:1:2.7
960min (16 hr)
0.01 ±0.11 28.4 ±5.2 4.85 ±1.2 13.5 ±0.7 6:1.3:2.9
27
2880 min
(48 hr)
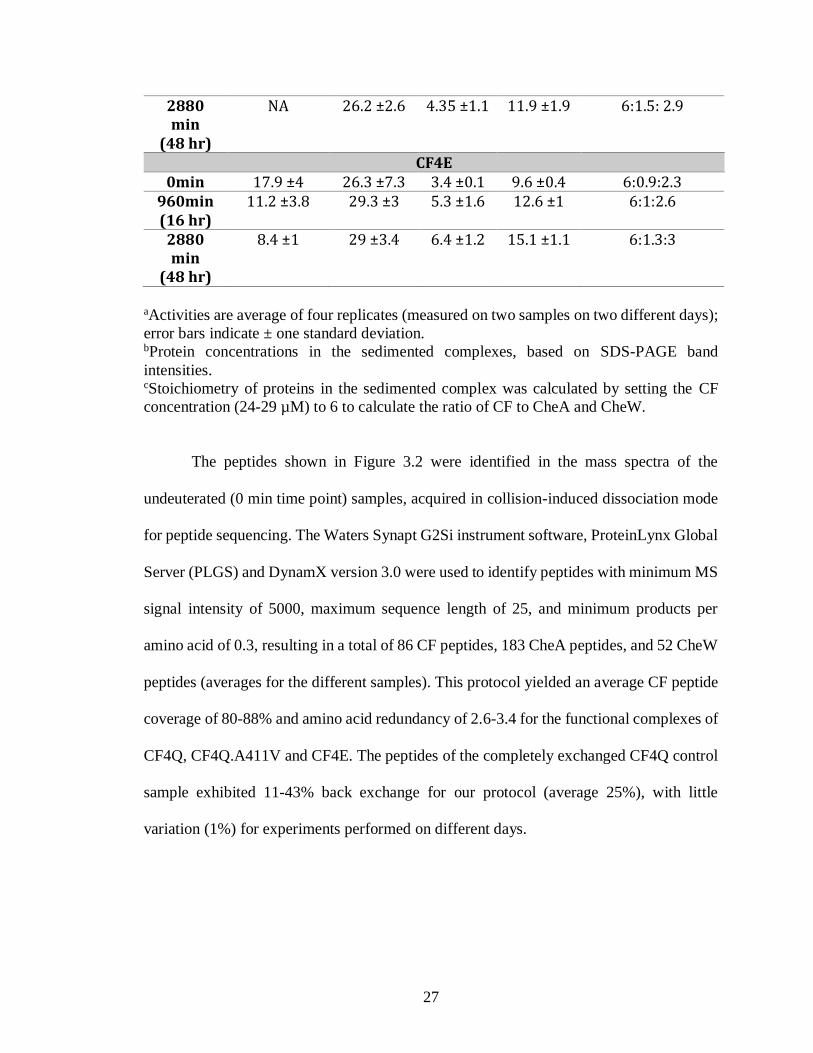
NA 26.2 ±2.6 4.35 ±1.1 11.9 ±1.9 6:1.5: 2.9
CF4E 0min 17.9 ±4 26.3 ±7.3 3.4 ±0.1 9.6 ±0.4 6:0.9:2.3
960min (16 hr)
11.2 ±3.8 29.3 ±3 5.3 ±1.6 12.6 ±1 6:1:2.6
2880 min
(48 hr)
8.4 ±1 29 ±3.4 6.4 ±1.2 15.1 ±1.1 6:1.3:3
aActivities are average of four replicates (measured on two samples on two different days);
error bars indicate ± one standard deviation. bProtein concentrations in the sedimented complexes, based on SDS-PAGE band
intensities. cStoichiometry of proteins in the sedimented complex was calculated by setting the CF
concentration (24-29 µM) to 6 to calculate the ratio of CF to CheA and CheW.
The peptides shown in Figure 3.2 were identified in the mass spectra of the
undeuterated (0 min time point) samples, acquired in collision-induced dissociation mode
for peptide sequencing. The Waters Synapt G2Si instrument software, ProteinLynx Global
Server (PLGS) and DynamX version 3.0 were used to identify peptides with minimum MS
signal intensity of 5000, maximum sequence length of 25, and minimum products per
amino acid of 0.3, resulting in a total of 86 CF peptides, 183 CheA peptides, and 52 CheW
peptides (averages for the different samples). This protocol yielded an average CF peptide
coverage of 80-88% and amino acid redundancy of 2.6-3.4 for the functional complexes of
CF4Q, CF4Q.A411V and CF4E. The peptides of the completely exchanged CF4Q control
sample exhibited 11-43% back exchange for our protocol (average 25%), with little
variation (1%) for experiments performed on different days.
28

29

30
Figure 3.2. Peptide coverage maps for CF in functional complexes with CheA and CheW.
Peptide numbering corresponds to the sequence of the intact E. coli Asp receptor. Blue bars
below the sequence are CF peptides from each of two replicates for (A) CF4Q, (B)
CF4Q.A411V and (C) CF4E. CF secondary structure elements and regions are labelled
above the sequence, and methylation sites are shown as magenta circles. Average peptide
coverage and amino acid redundancy are 80% and 3.4 for CF4Q, 83% and 3.1 for
CF4Q.A411V, and 88% and 2.6 for CF4E.
31
3.2. Widely varying HDX rates of CF are indicative of unstructured regions and
protein interactions
Figure 3.3 illustrates hydrogen exchange throughout CF4Q within functional,
kinase-on complexes assembled with CheA and CheW on vesicles. The mass spectra for
many peptides exhibit bimodal isotopic distributions (discussed below in section 3.5), but
many key features of the exchange properties can be deduced from analysis of the centroid
mass (intensity-weighted average mass). The percent deuterium uptake of each peptic
peptide is calculated by subtracting the centroid mass of the undeuterated sample from that
of the deuterated sample at each time point, and then dividing by the uptake of the fully
deuterated control sample (complete exchange). Deuterium uptake data are shown for
representative peptides showing the 80% sequence coverage (all but the black regions) in
Figure 3.3A. Uptake data for the full set of all peptides from functional complexes of
CF4Q, CF4Q.A411V, and CF4E, as well as CF4Q alone, are shown in Figure 3.4. In both
Figures 3.3A and 3.4, blue to red rainbow colors represent 0 to 100% deuterium uptake of
peptides for the 3 min to 960 min (16 hr) time points. In Figure 3.3B the exchange is
visualized on the structure of a monomer of CF at both 3 min and 16 hr, using colors
representing the average percent deuterium uptake for overlapping peptides (data that was
averaged is indicated by boxes in Figure 3.4).
32

33
Figure 3.3. Overview of hydrogen exchange properties of CF4Q in functional complexes
assembled with CheA and CheW on vesicles. (A) Deuterium uptake vs time for
representative CF peptides covering the entire sequence, except segments shown in black
(see Figure 3.4 for complete set of peptides, with % uptake numbers). Percent deuterium
uptake of peptides at each time point is represented in rainbow colors from blue to red,
indicating low to high deuterium incorporation. Data are averages of 2 replicates, except
for *peptides that were not found in both data sets. Secondary structure elements of CF are
shown on the right, with methylation sites (magenta) and different regions indicated. (B)
CF structure is colored according to the percent deuterium uptake at the first and last time
points, providing an overview of initial exchange rates (3 min) and of protection from
complete exchange at long times (960 min = 16 hr). For clarity, only a monomer is shown
(using PDB file 1qu7 for the Ser receptor CF). Colors are chosen based on averaging the
data for overlapping peptides (see black boxes in Figure 3.4). Segments undergoing very
fast exchange (complete exchange in 3 min) are the N-terminal side of the methylation
region and the C-terminal tail. Segments with incomplete exchange at 16 hours correspond
to sites of interactions with the indicated proteins. (C) Side and (D) bottom-up views of a
structural model of functional complexes of CF, CheA, and CheW. CF is colored gray,
except peptides showing protection at 16 hr are colored as in (B). The orange peptide (395-
417) is at the interface with the P3 dimerization domain of CheA (red circle). The yellow
peptides (371-376, 377-383) are at the interface with the P5 domain of CheA (red oval), or
with CheW (cyan), or with another CF dimer in the center of the receptor trimer-of-dimers.
Peptide numbering corresponds to the sequence of the intact E. coli Asp receptor. Model
of complex shown in C and D is based on the array model of Briegel, Crane, and Jensen
(Briegel et al., 2012) with an additional CheW positioned via superposition of the
neighboring CF dimer tip with the array model 3AJ6 (Cassidy et al., 2015).

34

35

36
Figure 3.4. Hydrogen exchange for the complete set of CF peptides from CF4Q, CF4E,
and CF4Q.A411V in functional complexes with CheA and CheW, and from CF4Q alone.
A subset of the CF4Q data are shown in Figure 3.3. Percent deuterium uptake is calculated
based on a centroid analysis, as the uptake of the peptide at each time point divided by the
uptake of the fully exchanged sample, and is represented with both numbers and rainbow
colors from blue to red for low to high uptake. Regions where no peptides were observed
are shown in black. Peptides with asterisks were found in a single data set; others were
found in both replicates. Finally, X marks an outlier peptide (371-392) that we neglected
in the analysis because a single replicate for a single state was observed and its rapid
exchange was inconsistent with the slow exchange of six overlapping peptides. Uptake for
overlapping peptides outlined by black boxes was averaged to choose colors represented
on Figure 3.3 for 3 min and 16 hourHDX. Note that for the CF4Q alone sample, nearly all
peptides exhibit ≥ 90% exchange (red) within 3 min. The few time points that show 70-
90% exchange (orange) all have at least one overlapping peptide with ≥ 90% exchange (or
88% exchange for residues 365-368). Thus, we conclude that the entire CF alone sample
exhibits very rapid exchange (≥ 90% within 3 min). Vertical lines on the right side of the
figure represent regions of the CF: magenta lines indicate the methylation region, with
methylation sites shown as black circles; blue lines indicate the protein interaction region,
with the membrane-distal hairpin tip of the receptor shown as a dashed line.
The initial deuterium uptake for the first 3 min time point (Fig 3.3A & B) varies
widely from >90% (red) near the N and C termini to <10% (blue) near the membrane-distal
tip. Peptides near the N and C termini exhibit very fast exchange, with 90-100% deuterium
uptake in the first 3 minutes, suggesting these regions are highly flexible and solvent
exposed. These findings are consistent with previous hydrogen exchange mass
spectrometry (Koshy et al., 2014) and NMR INEPT studies (Kashefi and Thompson, 2017)
on similar samples of functional complexes, and with electron paramagnetic resonance
(EPR) on spin labelled intact receptors in nanodiscs (Bartelli and Hazelbauer, 2016). The
C-terminal tail is thought to be an unstructured, flexible tether for binding the methylation
and demethylation enzymes. The comparably rapid hydrogen exchange observed for
residues 263-307, near the membrane-anchored N-terminal His tag (residues 248-253),
suggests that this is also an unstructured, flexible segment.
37
The slowest hydrogen exchange occurs near the membrane-distal cytoplasmic tip
of the CF, in the protein interaction region. With the exception of the 384-394 peptide at
the hairpin tip of the CF, which exhibits rapid exchange (80% at 3 min), residues 369–417
exhibit only 2–17% exchange in the first 3 minutes (neglecting the outlier behavior of the
371-392 peptide, marked X as discussed in Figure 3.4 legend). The slow exchange in this
region (both sides of hairpin tip) continues throughout the time course, resulting in
incomplete exchange at the final time point (16 hours) for these peptides. This slow
exchange and protection from complete exchange is likely due to protein-protein
interactions in this region, as illustrated in Figures 3.3C and 3.3D, which show a structural
model of the CF array (Briegel et al., 2012), with the regions protected from complete
exchange colored by their uptake at 16 hours (as in Figure 3.3B) and the rest of the CF
colored gray. The 369-383 region (yellow) is involved in protein interactions with the P5
domain of CheA (red oval), with CheW (homologous to P5), and with CF at the center of
the trimer-of-dimers. Similarly, the 395-417 region (orange) is involved in protein
interactions with the P3 dimerization domain of CheA (red circle).
For comparison, the hydrogen exchange time course for CF4Q alone (in the absence
of vesicles, CheA and CheW; right column in Figure 3.4) shows ≥88% exchange
throughout the protein in 3 minutes and no protection in the protein interaction region at
16 hours. Interestingly, one peptide outside of the protein interaction region (328–351)
exhibits incomplete exchange at a significant level (1.6–1.9 Da) in functional complexes
of CF4Q, CF4E, and CF4Q.A411V, and also in CF4Q alone (1.4 Da unexchanged at 16
hours for peptides 328–351 and 330–351). As explained in the Methods section,
differences greater than 0.9 are judged to be significant. Note that 1.9 Da is < 10% for these

38
long peptides, so the final time points in Figure 3.4 show ≥ 90% exchange. Thus, we
conclude that incomplete exchange in the 328–351 region is an intrinsic property of the CF
protein itself, and all other sites of incomplete exchange in CF complexes localize to the
protein interaction region.
The overall properties observed for the kinase-on arrays of CF4Q, extremely rapid
exchange for peptides near the N and C termini and slow exchange for peptides in the
protein interaction region (with the exception of the hairpin tip itself), are also observed in
functional arrays of CF4Q.A411V (kinase-off mutant) and CF4E (other methylation
extreme). Furthermore, in all regions other than the protein interaction sites where
incomplete exchange at 16 hours is observed, HDX is rapid (≥50% by 15 min). Thus,
within all three types of functional complexes, the majority of the CF is dynamic. Although
these overall HDX properties are similar for all three types of complexes (see Figure 3.4),
there are subtle differences in hydrogen exchange with signaling state and methylation
state, which are described in the next two sections (3.3-3.4). Interestingly, all of the
functional complexes also exhibit widespread bimodal isotope distributions, which will be
reported in the final section of this chapter (3.5).
3.3. CF in the kinase-on state exhibits decreased dynamics in both the methylation
and protein interaction regions
The differences in the deuterium uptake time course of the kinase-on (CF4Q) and
kinase-off (CF4Q.A411V) functional complexes is illustrated in Figure 3.5. Differences in
uptake are indicated by colors for representative peptides in Figure 3.5A: blue colors
indicate peptides with slower HDX in the kinase-on state; red colors indicate peptides with

39
faster HDX in the kinase-on state. Light gray indicates no significant difference in uptake
(≤ ±0.9 Da (Houde et al., 2011)). Dark gray indicates very fast exchange (≥ 90% in 3 min),
so our HDX-MS experiment does not have the time resolution to detect the differences
between the two states for these peptides. Black indicates no peptides found for these
regions. Two replicates were averaged for each type of complex, except each * indicates a
missing replicate. Secondary structure elements of CF are shown on the right side of Fig
3.5A, with methylation sites (magenta) and different regions indicated. In Figure 3.5B the
difference in uptake is visualized on the structure of a monomer of CF at 3 min and 16 hr,
using colors representing the average difference in deuterium uptake for overlapping
peptides (see boxes in Figure 3.7 below, which includes the uptake difference data for the
full set of observed peptides).

40

41
Figure 3.5. Difference in deuterium uptake between kinase-on and kinase-off signaling
states. (A) Deuterium uptake of kinase-off CF4Q.A411V minus kinase-on CF4Q, for
representative CF peptides covering the entire sequence, except segments shown in black
(see Figure 3.7 for complete set of peptides). Segments in dark gray undergo very fast
exchange (≥ 90% in 3 min), so these HDX experiments do not have the time resolution to
detect differences between the two states in these regions. Segments in blue colors undergo
slower HDX in the kinase-on state; segments in red colors undergo faster HDX in the
kinase-on state; segments in light gray show no significant difference in uptake (difference
≤ ±0.9 Da). Uptake differences are computed from averages of 2 replicates for each state,
except for *peptides that were missing in one data set, and ** peptides that were missing
in 2 of the 4 data sets. (B) CF monomer structure (PDB file 1qu7 for Ser receptor CF, with
methylation sites shown as magenta spheres) is colored according to the difference in
deuterium uptake between the kinase-on and kinase-off states at the first (3 min) and last
(16 hr) time points. For overlapping peptides, colors were chosen based on averaging the
data for peptides showing significant uptake differences (see black boxes in Figure 3.7).
Light yellow loop on 3 min structure encloses a region that shows conflicting data, with
the 327-344 peptide showing slower HDX and the 328-344 peptide showing faster HDX
in the kinase-on state. (C) Plots of deuterium uptake vs time for representative peptides of
both CF4Q (black symbols and solid lines) and CF4Q.A411V (gray symbols and dashed
lines). Data points for all replicates are shown, along with lines connecting the averages of
the replicates for each sample type. Dashed horizontal lines near top of plots indicate the
deuterium level expected for complete exchange, based on control samples of CF subjected
to reversible heat denaturation in D2O buffer followed by the quench and mass
spectrometry protocol used for all HDX samples.
Several peptides on the N and C terminal sides of the methylation region exhibit
slower initial exchange in the kinase-on state, as shown by blue colors for early time points
in Figure 3.5A and blue color in the top half of the structure in Figure 3.5B. Figure 3.5C
includes the uptake plot for one of these peptides, 313-327, which shows an initial
difference in uptake that disappears at long times as the data approach complete exchange
(dashed line is uptake level of completely-exchanged control). This suggests that the
methylation region is less dynamic in the kinase-on state. Note that the N-terminal side of
the methylation region exchanges too quickly for detection of differences in HDX
(exchange complete in 3 min), but a recent INEPT NMR study (Kashefi and Thompson,
2017) of this segment within similar functional complexes indicates that the kinase-off
state is more dynamic. There is also one region of the C-terminal side of the methylation

42
region (473-488) exhibits no significant differences in HDX. With the exception of these
regions, the entire methylation region exhibits less uptake at early times in the kinase-on
state. This observation is consistent with a previous hydrogen exchange mass spectrometry
study (Koshy et al., 2014)on similar samples of functional complexes.
Interestingly, an opposite change in dynamics is observed in a single peptide in the
glycine hinge region on the N-terminal side of the CF: peptide 328-344 (red color in Figure
3.5A and light yellow loop in Figure 3.5B) exhibits faster deuterium uptake (plotted in
Figure 3.5C) in the kinase-on state. This change is only observed in the 328-344 peptide;
the overlapping 328-341 peptide shows the opposite change (slower uptake at 3 min). For
analysis of differences in HDX between states (Figures 3.5-3.7), we have averaged the data
for the overlapping peptides with significant differences. This results in this region having
no significant difference, as indicated by the light yellow color on the structure in Figure
3.5B. However, the data for the 328-344 peptide (see plot in Figure 3.5C) may be more
reliable than that of the 328-341 peptide, because the 328-344 peptide has one additional
replicate and the difference in initial HDX is observed for more time points. Thus, we have
included the light yellow on the structure in Figure 3.5B to indicate the possibility that this
segment experiences faster HDX in the kinase-on state.
At the 16 hr time point, a single peptide in the protein interaction region shows a
significant difference in exchange. Peptide 395–417, on the C-terminal side of the hairpin
tip, shows incomplete exchange in both CF4Q (4.4 Da) and CF4Q.A411V (2.8 Da). These
data indicate significantly less deuterium uptake (1.6 Da) in the CF4Q kinase-on state, as
represented by the blue color in Fig 3.5A-B and the difference in the uptake plot at long
times in Figure 3.5C. This peptide, at the protein interface between CF and CheA-P3 (see

43
Fig 3.3D), also contains the A411V mutation that creates the kinase-off state. We suggest
that that the kinase-off state has a decreased affinity for CheA-P3, which decreases the
protection from complete HDX at long times. Such a decrease in affinity does not result in
a greater loss of bound CheA from the complexes with time (Table 3.1), perhaps reflecting
the high stability of the overall CheA/CheW hexagonal network of the array. Interestingly,
the other peptides of the protein interaction region that show protection at long times (N-
terminal side of the hairpin tip: 369-376, see Figure 3.4) show no significant differences in
uptake between the kinase-on and kinase-off states.
Finally, although the HDX differences between the kinase-on CF4Q and kinase-off
CF4Q.A411V are subtle, they demonstrate long-range coupling: differences are observed
in both the methylation region at early times and in the protein interaction region near the
kinase-off mutation site at long times. This is consistent with the fact that the A411V
mutation causes both inactivation of the kinase (a local change in the CF-CheA interaction)
and activation of methylation (a long-range change in the CF), and suggests that both of
these activity changes are correlated with increased dynamics of the CF.
3.4. Methylation decreases dynamics throughout the CF
In contrast to the subtle differences in HDX between the kinase-on and kinase-off
states, methylation has a much greater effect on the CF dynamics. Figure 3.6 illustrates the
difference in deuterium uptake between unmethylated (CF4E) and methylated-mimic
(CF4Q) functional complexes assembled with CheA and CheW on vesicles. As in Figure
3.5, the uptake differences are computed between average of two replicates for each state
(except for peptides marked by * or **), with light gray indicating no significant difference
in uptake (≤ ±0.9 Da) and dark gray indicating very fast exchange (≥ 90% in 3 min), so

44
differences cannot be measured by our experiments. Difference uptake data for
representative peptides covering the sequence are shown in Figure 3.6A, with data for the
full set of observed peptides shown in Figure 3.7. Blue colors, indicating peptides with
slower HDX in the CF4Q methylated-mimic state, are observed throughout the CF at short
times and in the protein interaction region at long times. Again, the colors shown on the
structure (Figure 3.6B) represent the average difference in deuterium uptake for
overlapping peptides (boxes in Figure 3.7 indicate which data were averaged).

45

46
Figure 3.6. Difference in deuterium uptake between unmethylated and methylated-mimic
states. (A) Deuterium uptake of unmethylated CF4E minus methylated-mimic CF4Q for
representative CF peptides covering the entire sequence, except segments shown in black
(see Figure 3.7 for complete set of peptides). Segments in dark gray undergo very fast
exchange (≥90% in 3 min), so these HDX experiments do not have the time resolution to
detect differences between the two states in these regions. Segments in blue colors undergo
slower HDX in the methylated-mimic state; segments in light gray show no significant
difference in uptake (different ≤ ±0.9 Da). Uptake differences are computed from averages
of 2 replicates for each state, except each asterisk indicates one missing replicate (**
indicates peptide is observed in only 2 of the 4 data sets). (B) CF monomer structure (Ser
receptor CF PDB file 1qu7, with methylation sites shown as magenta spheres) is colored
according to the difference in deuterium uptake between the unmethylated and methylated-
mimic states at the first (3 min) and last (16 hr) time points. For overlapping peptides,
colors were chosen based on averaging the data for peptides showing significant uptake
differences (see black boxes in Figure 3.7). (C) Plots of deuterium uptake vs time for
representative peptides of both CF4Q (black symbols and solid lines) and CF4E (gray
symbols and dashed lines). Data points for all replicates are shown, along with lines
connecting the averages of the replicates for each sample type. Dashed horizontal lines
near top of plots indicate the deuterium level expected for complete exchange, based on
control samples of CF subjected to reversible heat denaturation in D2O buffer followed by
the quench and mass spectrometry protocol used for all HDX samples.
At early times, peptides throughout the methylation, glycine hinge and protein
interaction regions exhibit slower exchange in the CF4Q methylated-mimic state (Fig 3.6A,
B & C). In fact, of the regions with measurable HDX rates, nearly all contain at least one
peptide that shows significantly less deuterium uptake in CF4Q. The single exception is
the 379-394 region, which is likely dominated by the properties of the hairpin tip peptide,
384-394, that exhibits fairly rapid exchange in all complexes. Thus, we conclude that
methylation causes widespread stabilization (resulting in slower initial HDX) throughout
all of the CF except for the hairpin tip and the rapidly exchanging N and C-terminal regions.
At long times (16 hr), peptides involved in protein interactions (those that show
incomplete exchange) exhibit reduced uptake in the methylated-mimic state. This is
observed on the N-terminal side of the hairpin tip (369-378, which interacts with CheA-
P5/CheW/CF as shown in Figure 3.3). Unfortunately, the peptide involved in protein

47
interactions on the C-terminal side (395-417) is missing in the CF4E data set, so we cannot
determine whether it too would show decreased uptake at long times in CF4Q relative to
CF4E. Although it is not clear whether methylation alters CF interactions with CheA-P3,
it appears that methylation increases the affinity of CF interactions with CheA-P5 and/or
CheW and/or other CF dimers in the trimer of dimers. Overall, these HDX data suggest
that methylation causes widespread stabilization of CF and its interactions. It is not clear
why the uptake differences due to signaling state (Figure 3.7A) are much more limited than
the uptake differences due to methylation state (Figure 3.7B).

48

49
Figure 3.7. Comparison of HDX differences due to signaling state and methylation. For
complete set of CF peptides, colors indicate deuterium uptake differences between kinase-
on/methyl-mimic (CF4Q) and (A) kinase-off (CF4Q.A411V) or (B) unmethylated (CF4E)
states. A subset of the data shown in (A) are presented in Figure 3.5; a subset of the data
shown in (B) are presented in Figure 3.6. Segments in dark gray undergo very fast exchange
(≥ 90% in 3 min), so these HDX experiments do not have the time resolution to detect
differences between the two states in these regions. Segments in blue colors undergo slower
HDX in the CF4Q kinase-on state; segments in red colors undergo faster HDX in the CF4Q
kinase-on state; segments in light gray show no significant difference (difference ≤ ±0.9
Da). Single asterisks indicate the peptide is observed in only 3 of the 4 data sets (two
replicates for each sample type). Two asterisks indicate the peptide is observed in only 2
of the 4 data sets. In both (A) and (B), black boxes for the 3 min time points enclose
overlapping peptides that were averaged to determine the color represented on the
structures in Figures 3.5 and 3.6.
3.5. Widespread correlated exchange suggests CF populates a long-lived unfolded
state within functional complexes
In these HDX experiments, HDX data for many peptides exhibit bimodal isotopic
distributions, with one isotopic distribution at low m/z that moves gradually to higher mass
with time (uncorrelated exchange), and another isotopic distribution at the final exchange
m/z positon that increases in intensity with time (correlated exchange). Uncorrelated
exchange is often observed in proteins under native conditions, where the refolding rate of
the protein is faster than the exchange, so the protein must undergo multiple unfolding and
refolding events before HDX is complete. Correlated exchange is observed when the
protein refolding rate is slower than the exchange (known as the EX1 limit): there is a long-
lived unfolded state which undergoes complete exchange before refolding. Although the
HDX patterns observed for CF include bimodal patterns indicative of correlated exchange
(EX1), the deuterium uptake analysis of the HDX data described thus far was performed
with the instrument software, which calculates the centroid of each spectrum (intensity-
weighted mass average) and thus ignores the bimodal patterns and the underlying EX1

50
process. We pursued additional analysis of these bimodal patterns to gain insight into the
long-lived unfolded state and how it relates to methylation and signaling states.
Peptides with HDX mass spectra with bimodal distributions are observed
throughout the CF in all functional complexes with CheA and CheW. However, the HDX
spectra do not follow an idealized EX1 pattern, with mass envelopes only at zero exchange
and complete exchange. Instead a simultaneous uncorrelated exchange occurs, as expected
for “realistic” EX1 (Xiao et al., 2005): the lower m/z envelope shifts gradually to higher
m/z, merging with the envelope at the fully exchanged position. A detailed deconvolution
analysis of these data would be challenging due to the large number of peptides and the
incomplete resolution of the bimodal distributions for many cases. We implemented an
efficient method to estimate t1/2 of the correlated exchange process (EX1) for each peptide
that exhibited HDX with bimodal isotopic distributions. Since correlated exchange
populates the fully exchanged isotopic distribution (at high m/z), this process reaches 50%
completion when this high m/z mass envelope contains 50% of the intensity in the
spectrum. Thus, at t1/2 for the EX1 process the bimodal distribution should be symmetric,
with equal intensities in the mass envelopes at the low m/z position and at the fully
exchanged position. The symmetry of the pattern is an especially useful indicator when the
mass envelopes have merged, at which point it is difficult to estimate the intensity in the
high m/z mass envelope.
To validate our method, we compare the t1/2 values estimated visually with the
results of deconvolution analysis with HX-Express. Figure 3.8 shows the mass spectra for
the HDX time course of two peptides in each of the three types of functional CF complexes,
and compares the visual estimate of t1/2 (top) with the deconvolution method (bottom). For

51
each HDX time course (vertical series of spectra) the spectrum shown in red is the first one
with ≥50% intensity in the high m/z mass envelope and/or the most symmetric pattern,
indicating t1/2 has been reached. HX-Express deconvolutes bimodal patterns into two
binomial distributions, and the resulting intensity of the high m/z distribution should be
50% at the t1/2 for the EX1 process. The deconvolution results are listed below each series
of spectra, with red highlighting the first spectrum with ≥50% intensity in the high m/z
mass envelope. The results of the deconvolutions demonstrate that the estimated t1/2 using
our visualization method (Figure 3.8 top) is in good agreement with the HX-Express
deconvolution results (Figure 3.8 bottom).
Relative intensity of high m/z distribution, based on HX-Express deconvolutions.
Peptide 328-351 Peptide 471-478

52
Time (min)
CF4Q CF4E CF4Q.A411V CF4Q CF4E CF4Q.A411V
3 0.20 0.55 0.32 0.46 0.72 0.56 7 0.29 0.66 0.29 0.52 0.78 0.64
15 0.34 0.46 0.34 0.6 0.76 0.69 30 NA 0.81 0.42 NA 0.74 0.78 60 NA 0.84 0.54 0.69 0.84 0.84
120 NA 0.96 0.75 0.76 0.84 NA
Figure 3.8. Comparison of visualization vs HX-Express methods for estimation of t1/2 of
an EX1 process. Both methods are applied to two example peptides (A) 328-351 and (B)
471-478 that exhibit bimodal isotopic distributions during HDX. Visualization method
(top): stacked spectra are used to estimate t1/2 for the correlated exchange (EX1) process in
CF4Q, CF4E and CF4Q.A411V arrays. The first spectrum with at least 50% intensity in
the high m/z distribution or a symmetric pattern is highlighted in red and represents the
visually estimated t1/2 of the EX1 process. HX Express method (bottom): HX Express is
used to deconvolute the bimodal patterns into two binomial distributions. The fractional
intensity of the high m/z distribution at each time point is listed in the table; t1/2 is the time
at which this intensity reaches 0.5. N.A indicates either missing data or that the two
binomial distributions are merged and cannot be deconvoluted. The two methods yield
similar estimates; the visualization method has the advantages of being faster and
applicable to spectra that lack resolution of the two distributions.
Visual estimates of t1/2 were performed for all peptides that exhibit a significant
widening of the isotopic distribution during the HDX time course. It has been previously
demonstrated that a widening of 6 Da is indicative of an underlying EX1 process (Weis et
al., 2006). The resulting estimated values of t½ for correlated exchange are shown in Figure
3.9A for the three types of functional complexes of CF with CheA and CheW. The
estimated values of t1/2 for all CF peptides are represented in colors ranging from dark
maroon for short t1/2 (rapid correlated HDX) to pale purple for long t1/2 (slow correlated
HDX). Our experiments do not have the time resolution to distinguish correlated vs
uncorrelated exchange for peptides that undergo very fast exchange (>70% exchange
within 3 min); these peptides are shown in dark gray. Light gray indicates peptides that
display only uncorrelated exchange (< 6 Da widening of isotopic distribution); black
indicates regions with no peptide coverage. An average t1/2 estimate was calculated for

53
overlapping peptides (black boxes in Figure 3.9A) and represented with the corresponding
color on the CF monomer structures in Fig 3.9B. For the 369-378 region, we considered
the fact that correlated exchange is more difficult to resolve for short peptides (eg. HDX
for 2 peptides of 4-5 amino acids appears to be uncorrelated), and thus we used the t½
estimate of 120 min consistently observed for the three longer peptides (6-8 amino acids)
in this region. Figure 3.9B represents these colors on the CF structure to compare the
correlated exchange profile of CF4Q (left, which is very similar to that of CF4Q.A411V)
to the correlated exchange profile of CF4E (right).

54
Figure 3.9. Estimated t1/2 of correlated exchange (EX1) of peptides throughout CF in
functional complexes with CheA and CheW. (A) The t1/2 for correlated HDX of peptides
in each of the three states is represented by a color scale, from dark maroon to pale purple
for fast to slow correlated HDX (short to long t½), with light gray representing peptides
with uncorrelated exchange. When exchange is rapid (peptides represented in dark gray
with > 70% exchanged in 3 min), it is difficult to detect correlated HDX. (B) CF monomer
structure (from pdb file 1qu7) is colored according to the estimated EX1 t1/2 for CF4Q (left,
which is very similar to the profile for CF4Q.A411V) and CF4E (right). Methylation sites
are labelled in magenta in both A and B.

55
The emerging picture is that CF within functional complexes in all three states
exhibits widespread correlated exchange throughout its structure. EX1 HDX processes are
observed in all regions shown in maroon to pale purple, and may also occur in regions
shown in dark gray, where it cannot be detected due to the time resolution of the
experiments. This suggests the entire CF populates a long-lived unfolded state.
Furthermore, the top 2/3 of the CF in these complexes shows rapid exchange, either >70%
exchange within 3 min (correlated or uncorrelated, dark gray in Fig 3.9B), or correlated
exchange with a short t1/2 of 3-15 min (dark maroon to red in Fig 3.9B). In contrast, the
protein interaction region where CF binds to CheA and CheW shows significantly slower
exchange, with longer estimated t1/2 values of 120 min to >960 min. This is consistent with
the deuterium uptake analysis discussed above, suggesting that protein interactions
stabilize the CF in this region.
The changes in correlated exchange between CF4Q and CF4E are highlighted in
Figure 3.10. The stacked spectra in Figure 3.10A illustrate the changing values of t1/2 for
these two states, and these changes are represented by colors on the CF monomer structure
in Figure 3.10B. Peptides 371–376 and 377–383 exhibit a reduction in t1/2 from CF4Q to
CF4E (960 to 120 min, and >960 to 960 min, respectively). These peptides represent the
369-383 region that exhibits protection from complete exchange at long times due to
protein interactions (see Figure 3.3-3.4), suggesting a “loosening” of the stabilizing protein
interactions in CF4E. Peptides 365-370 and 433-448 exhibit a change from uncorrelated
exchange in CF4Q to correlated exchange with t1/2 of 3-15 min in CF4E. Looking back at
Figure 3.9B, this corresponds to an expansion of the region with rapid correlated exchange

56
(dark maroon to red) or >70% exchange in 3 min (dark gray) to the entire structure of
CF4E, other than the protein interaction sites.
Figure 3.10. Regions with differences in t1/2 of correlated HDX between CF4Q and CF4E.
(A) Stacked plots of mass spectra vs HDX time for representative peptides illustrate t1/2
differences (BE is back exchanged sample). Red arrow indicates t1/2 of peptides is more
than 960 min. (B) Differences in t1/2 of correlated exchange are represented by colors on
CF monomer structure. As in previous figures, black indicates no peptides observed, dark
gray indicates very fast exchange (>70% exchange within 3 min), and light gray indicates
uncorrelated HDX or no change in t1/2 of correlated HDX.
Finally, overlays of the mass spectra for CF4Q and CF4E illustrate that a number
of peptides show a change in rates of both correlated and uncorrelated exchange. This is
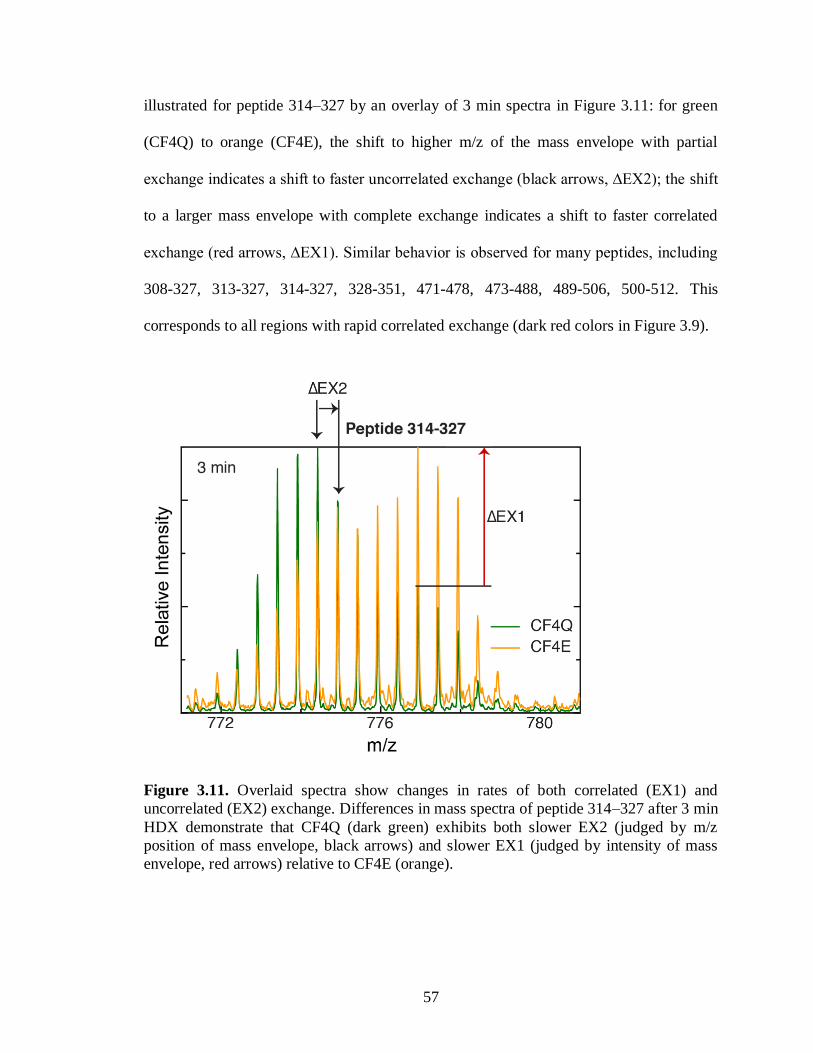
57
illustrated for peptide 314–327 by an overlay of 3 min spectra in Figure 3.11: for green
(CF4Q) to orange (CF4E), the shift to higher m/z of the mass envelope with partial
exchange indicates a shift to faster uncorrelated exchange (black arrows, ∆EX2); the shift
to a larger mass envelope with complete exchange indicates a shift to faster correlated
exchange (red arrows, ∆EX1). Similar behavior is observed for many peptides, including
308-327, 313-327, 314-327, 328-351, 471-478, 473-488, 489-506, 500-512. This
corresponds to all regions with rapid correlated exchange (dark red colors in Figure 3.9).
Figure 3.11. Overlaid spectra show changes in rates of both correlated (EX1) and
uncorrelated (EX2) exchange. Differences in mass spectra of peptide 314–327 after 3 min
HDX demonstrate that CF4Q (dark green) exhibits both slower EX2 (judged by m/z
position of mass envelope, black arrows) and slower EX1 (judged by intensity of mass
envelope, red arrows) relative to CF4E (orange).
58
CHAPTER 4
HDX-MS RESULTS ON FUNCTIONAL SIGNALING COMPLEXES:
PRELIMINARY OVERVIEW OF DYNAMICS OF THE KINASE CHEA
4.1. Introduction
Understanding signaling requires understanding how the receptor controls the
kinase activity of CheA. CheA consists of five domains: P1(residues 1-134) contains the
His residue that is phosphorylated; a flexible linker (135-158) connects P1 to P2; P2 (159-
229) is the docking site for CheY and CheB that facilitates phosphotransfer to these
proteins; another linker (230-260) connects P2 to P3; P3 (261-325) is the dimerization
domain; P4 (326-507) contains the ATP binding site; and P5 (508-654) binds to the
receptor and CheW (Mo et al., 2012) (Figure 4.1). To complement the results presented in
Chapter 3, HDX-MS can be used to investigate how CheA domains change their structure
and dynamics to control the kinase activity and build a more complete picture of the
mechanism of signaling transduction.
Recent electron cryotomography (ECT) and molecular dynamics studies suggest
that dynamics of CheA domains may play a role in the control of kinase activity. ECT of
intact receptor mutants revealed that the CheA P1-P2 domains show less density in the
kinase-on state, suggesting greater mobility of these domains. It was proposed that the
kinase is activated when P1 is released for productive interactions with the catalytic P4
domain (Briegel et al., 2013). In another study, molecular dynamics simulations revealed
a “dipping” motion of the CheA-P4 domain, which is proposed to be involved in control
of kinase activity (Cassidy et al., 2015). The HDX-MS approach we have implemented to
measure changes in receptor dynamics within functional complexes is ideally suited for
detection of changes in CheA dynamics to test these mechanistic proposals. Furthermore,

59
the results presented in Chapter 3 suggest a weakening of the interaction between the
receptor and the CheA-P3 domain, based on the kinase-off state exhibiting reduced
protection from exchange at long times at the P3 interaction site. This predicts
complementary changes in CheA-P3, which can also be tested with the HDX-MS
approach. Interestingly, the P4 ‘dipping’ observed by MD simulations is accompanied by
disruption of the receptor/P3 interaction (Cassidy et al., 2015), which is consistent with the
faster HDX we observed for the kinase-off state at the receptor/P3 interface .
Using HDX-MS to measure changes in structure and dynamics of CheA requires
samples that are homogeneous with respect to CheA, with all of the CheA incorporated
into functional arrays with CF and CheW. The HDX experiments reported in Chapter 3
were performed on samples optimized for the homogeneity of CF, with excess CheA and
CheW present to drive all of the CF into functional complexes. Although these samples are
not ideal for monitoring CheA dynamics, because they contain a mixture of bound and free
CheA, the experiments yielded data on HDX of CheA that can be analyzed to test the
feasibility of an HDX-MS study of CheA.
As reported in Chapter 3, 183 CheA peptides were identified in the HDX-MS
studies on native-like functional arrays of CF, CheA, and CheW bound to vesicles. As
shown in Figure 4.1, this corresponds to 69% sequence coverage of CheA, with peptides
identified from all the CheA domains and linkers. Table 3.1 indicates that about 4 µM
CheA was incorporated into the functional complexes, leaving 8 µM free CheA. Thus
HDX-MS of these samples will reflect the properties of both free CheA (2/3) and bound
CheA (1/3).

60
Figure 4.1. HDX-MS identifies peptides from all domains and linkers of CheA. (A)
Cartoon of CheA domains and interactions, and (B) CheA sequence and peptides identified
in the HDX-MS experiment (69% coverage), with each domain represented in different
colors, and the linkers represented in black and gray.
61
4.2. Developing a protocol to prepare a fully exchanged CheA control sample
Since CheA is a large multidomain protein, it is unlikely that heat denaturation of
CheA is reversible. Therefore, we sought to use cycles of lyophilization/resuspension in
D2O buffer to prepare a fully exchanged CheA sample. The first step was to determine
whether CheA could retain activity following such a procedure. For lyophilization, a 100
µL aliquot of 264 µM CheA in kinase buffer was placed in an Eppendorf tube. The cap
was removed and replaced with parafilm, with tiny holes in the parafilm for removal of
fluid during lyophilization. CheA was flash frozen with liquid nitrogen, the frozen
Eppendorf tube was placed in the 300 mL fast-freeze flask (Labconco), connected to the
lyophilizer (Labconco lyophilizer in Thai lab), and then left under vacuum overnight at
0.31mBar and -103°C. The CheA lyophilized powder was then resuspended to the original
volume in 1X D2O kinase buffer. Some of this sample was retained and some was subjected
to a second lyophilization and resuspension. Both 1x and 2x lyophilized CheA samples
were tested for kinase activity: PEG complexes containing 50 µM CF4Q, 12 µM CheA, 20
µM CheW, 4% (w/v) PEG 8000, 4% (w/v) D-(+)-trehalose, and 1mM PMSF in kinase
buffer were incubated overnight in a 25°C water bath, and kinase activity was measured
the next day. The results shown in Figure 4.2 indicate that CheA retains kinase activity
after two rounds of lyophilization/resuspension, and lyophilization can be used to prepare
a fully exchanged CheA control for HDX-MS experiments. The MS sample was made by
diluting the D2O exchanged CheA to 12 µM using 1x D2O kinase buffer, adding 22.5 µL
of this CheA to a prechilled Eppendorf tube that contained 22.5 µL cold quench buffer,
flash freezing immediately with liquid nitrogen, and storing at -80°C. HDX samples of free

62
CheA were prepared using a G10 sephadex zeba desalting column (Pierce Biotechnology)
as described in Chapter 2.
Figure 4.2. Effect of lyophilization on kinase activity of CheA. CF4Q PEG complexes are
assembled using 50 µM CF4Q, 12 µM CheA and 20 µM CheW, 4% (w/v) PEG 8000, 4%
(w/v) D-(+)-trehalose. These samples incorporated CheA that had been lyophilized 1x, or
2x. Total kinase activity is based on the full amount of CheA in the sample and is within
the range of activity levels typically observed for PEG-mediated complexes of CF4Q.
Activities are average of three replicates measured on the same day.
Unfortunately, the fully exchanged CheA control showed less deuterium uptake
than other time points. This indicates that the CheA was not fully exchanged, suggesting
there was too little time in the D2O kinase buffer for complete exchange before
lyophilization. In the future, leaving CheA at 25°C for 30 min after resuspending the
lyophilized CheA in 1x D2O kinase buffer should increase the level of exchange in this
control sample.
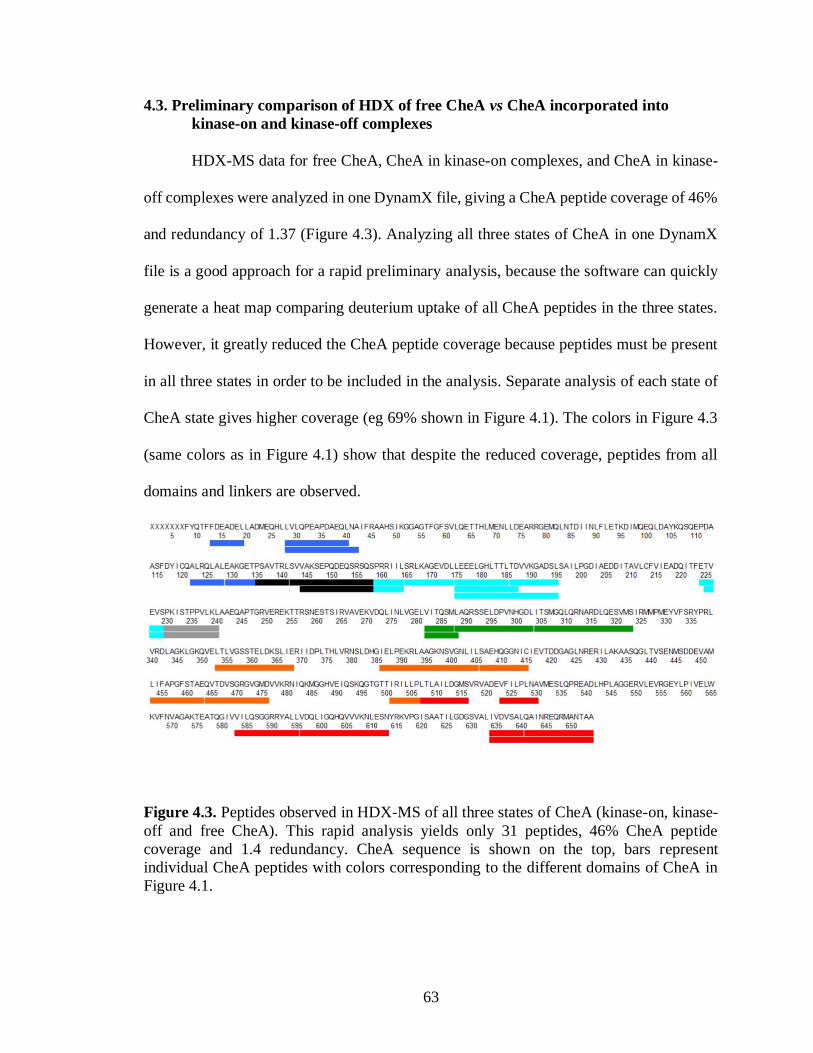
63
4.3. Preliminary comparison of HDX of free CheA vs CheA incorporated into
kinase-on and kinase-off complexes
HDX-MS data for free CheA, CheA in kinase-on complexes, and CheA in kinase-
off complexes were analyzed in one DynamX file, giving a CheA peptide coverage of 46%
and redundancy of 1.37 (Figure 4.3). Analyzing all three states of CheA in one DynamX
file is a good approach for a rapid preliminary analysis, because the software can quickly
generate a heat map comparing deuterium uptake of all CheA peptides in the three states.
However, it greatly reduced the CheA peptide coverage because peptides must be present
in all three states in order to be included in the analysis. Separate analysis of each state of
CheA state gives higher coverage (eg 69% shown in Figure 4.1). The colors in Figure 4.3
(same colors as in Figure 4.1) show that despite the reduced coverage, peptides from all
domains and linkers are observed.
Figure 4.3. Peptides observed in HDX-MS of all three states of CheA (kinase-on, kinase-
off and free CheA). This rapid analysis yields only 31 peptides, 46% CheA peptide
coverage and 1.4 redundancy. CheA sequence is shown on the top, bars represent
individual CheA peptides with colors corresponding to the different domains of CheA in
Figure 4.1.

64
Figure 4.4 compares the heat map of CheA peptide HDX in kinase-on complexes
(top row), kinase-off complexes (middle row) and free CheA (bottom row). Each row
shows colors representing the percent deuterium uptake at 3 min, 15 min and 16 hr time
points. For these data, uptake is expressed as a percentage of each peptide’s maximum
possible uptake (in contrast to the CF data in chapter 3 that was expressed as a percentage
of the fully exchanged control). Percent uptake is represented in rainbow colors from blue
to red indicating low to high deuterium incorporation.

65
Figure 4.4. CheA heat map comparing HDX time course for kinase-on and kinase-off
complexes with free CheA. Percent deuterium uptake (expressed as a percentage of each
peptide’s maximum possible uptake) at each time point is represented in rainbow colors
from blue to red indicating low to high deuterium incorporation. Uptake differences are
observed between free CheA (bottom rows) and CheA in complexes (top and middle rows).
Differences are highlighted with boxes: black boxes represent differences >10% and red
boxes represent differences ≥20%.
The heat maps for the kinase-on and kinase-off complexes are very similar, but
somewhat different from free CheA. Heat maps for peptides that show differences in
uptake between complexes and free CheA are enclosed by boxes: black boxes indicate
>10% difference; red boxes indicate >20% differences. Small differences (>10%) are
observed in the P1-P2 linker through the beginning of the P2 domain, as well as the P3, P4
and P5 domains. Larger differences (>20%) are observed only in the P4 domain. However,
with only a single replicate for the free CheA sample, we can’t tell whether or not the
difference has exceeded the significance level. The peptides from CheA in complexes show
less deuterium uptake than free CheA, which suggests that HDX is detecting increased
domain-domain and protein-protein interactions in the active complexes that reduce the
solvent exposure compared to free CheA. Comparisons of HDX of intact CheA, CheA
domains, and CheA in complexes may be useful to deduce the domain-domain and protein-
protein contacts of CheA that are present within functional complexes.
No significant difference in deuterium uptake of CheA was observed between
kinase-on and kinase-off complexes. This may be due to the fact that only 1/3 of CheA in
the sample is incorporated into functional complexes, and the HDX behavior is skewed
towards the properties of free CheA. Despite this limitation, observation of some
differences between CheA in complexes and free CheA suggests that an HDX-MS study
on samples optimized for full incorporation of CheA into complexes would yield

66
information on CheA domain interactions and mobilities to provide insights into the
mechanism of control of kinase activity.

67
CHAPTER 5
INSIGHTS INTO THE SIGNALING MECHANISM
5.1. Implications of HDX behavior regarding the properties of CF
Hydrogen exchange of the CF in functional complexes with CheA and CheW
ranges from very fast near the N and C termini, to fast throughout most of the CF, to very
slow at the protein interactions sites near the membrane-distal cytoplasmic tip (Figure 3.3
& 3.4). Very fast exchange (complete within 3 min) is observed from the N-terminus
through the N-terminal side of the methylation region. This segment includes part of the
HAMP domain, and its connection to the methylation region with a helix stutter that creates
an inverse stability relationship between the HAMP helices and the N-terminal methylation
helix (Zhou et al., 2009). Similarly, fast exchange is observed for the C-terminal tail that
is thought to function as a flexible tether to the CheR binding site at the C terminus of the
receptor, suggesting that both these N and C-terminal regions are unstructured. At the other
extreme, the protein interaction region shows very slow exchange, which is not complete
at 16 hr due to interactions with its binding partners CheA and CheW. This remarkable
range of HDX rates reflects the dual nature of the CF, from the disordered regions of the
HAMP-methylation segment and C-terminal tail to the highly ordered membrane-distal
region that packs with CheA and CheW into an extended hexagonal lattice.
The other notable aspect of the HDX results is that the CF exhibits widespread
correlated exchange (EX1) (Fig 3.9), and t½ values are short everywhere except the sites
of protein interactions with CheA and CheW. This suggests the entire CF populates a long-
lived unfolded state, and binding of CheA and CheW induces folding. Consistent with this

68
picture, all regions of CF other than these protein interaction sites exhibit fast exchange
(>50% in 15 min).
5.2. How do these results compare with previous studies of CF dynamics?
The current HDX study has made significant improvements over a previous HDX
study (Koshy et al., 2014) in both the samples and the MS data. The samples used
previously were similar, but CF4E complexes were assembled at low density (high vesicle
surface area, kinase-off state) and high density (low vesicle surface area, kinase-on state).
We have since realized that the high density conditions did not have sufficient vesicle
surface area to allow all of the CF to assemble into functional complexes with CheA and
CheW. We estimate that the limited vesicle surface area of the high density samples led to
47% of the CF4E being bound within close-packed CF-only regions rather than forming
the hexagonal array with CheA and CheW. As observed in the current study, Koshy et al
observed incomplete exchange at 16 hours, with a similar number of protected sites in the
low density homogeneous samples, but a ~two-fold larger number of protected sites in the
high density inhomogeneous samples. It seems likely that this larger protection is a
property of the close-packed CF of this heterogeneous sample, and could also be due to
decreased solvent exposure under the high density assembly conditions. Thus, the use of a
mutant to control signaling state for the current study is an improvement over the use of
packing density by Koshy et al, because the latter could change HDX by changing solvent
exposure. By assembling the complexes at the same density in this study (with sufficient
vesicle surface area for all of the CF to assemble into functional complexes with CheA and
CheW), any difference in HDX we observe is not due to an effect of their density of binding

69
to the vesicle surface, and can be more confidently assigned to the change in signaling
state.
The current study also makes improvements in the mass spectrometry. We used a
Water Synapt G2Si with ion mobility separation to identify peptides, leading to better
reproducibility and resolution. Shorter and more peptides allow us to better localize the
protection and see that it matches the CheA and CheW binding sites. Overall, the results
of both HDX studies are consistent. Both the current and previous study (Koshy et al.,
2014) observed (1) very rapid exchange near the N and C termini, (2) protection from
complete exchange near the membrane-distal tip, (3) a kinase-on state with slower
exchange in the methylation region and greater protection in the protein interaction region,
and (3) mass spectra with evidence of correlated exchange.
Our HDX results are also consistent with dynamics observed by other methods.
One EPR study examined site-specific spin labels to measure the mobility of helices of the
cytoplasmic domain of intact Tar inserted into nanodiscs, but lacking CheA and CheW
(Bartelli and Hazelbauer, 2016). Consistent with our results, they observed that the N-helix
is more dynamic than the C-helix, and the methylation region is more dynamic in the
unmethylated state. However, they saw no effect of ligand binding on the dynamics, which
may be due to the absence of CheA and CheW. It has been demonstrated that full coupling
between ligand binding and the cytoplasmic domain (eg methylation effects on ligand
affinity) is only observed in ternary complexes of the receptor, CheA, and CheW (Li and
Weis, 2000). Another EPR study examined site-specific spin labels incorporated into
kinase-on and kinase-off fusion constructs containing the Tar methylation and protein
interaction domains linked to variants of the Aer HAMP domain, but again in the absence

70
of CheA and CheW (Samanta et al., 2015). In these samples, the HAMP domain shows
increased dynamics in the kinase-on state and, consistent with our results, the protein
interaction region shows decreased dynamics in the kinase-on state. Finally, a recent solid-
state NMR study (Kashefi and Thompson, 2017) on functional CF complexes assembled
with CheA and CheW on vesicles (equivalent to samples used in this study) reports that
the N-terminal methylation helix is dynamic on the ns timescale, and these dynamics
increase in the kinase-off state. All of these results using different methods and samples
are consistent with our current HDX results on the following points: the N-terminal
methylation helix is highly dynamic, the methylation region dynamics are reduced in the
methylated state, and the protein interaction region dynamics are reduced in the kinase-on
state.
5.3. Insights into protein interactions between CF, CheA, and CheW
As shown in Figure 3.3, the incomplete exchange at 16 hr appears to be at the
binding interfaces in the functional complex. Looking more closely, it is clear that the
protected peptides are consistent with other published observations of these binding
interfaces, as illustrated in Table 5.1. These studies include solution NMR transverse
relaxation optimized spectroscopy (TROSY) studies on a truncated version of a soluble
chemoreceptor to identify receptor residues that undergo chemical shift changes upon
binding CheA or CheW (Wang et al., 2012b) (Vu et al., 2012). Most of the residues
identified in these studies are found within the peptides that show incomplete HDX; the
exceptions are shown in red in Table 5.1. Note that the NMR studies used a P4-P5 construct
of CheA, and thus did not detect the receptor/P3 interaction that we have detected with
HDX. Another study used in vivo cross-linking to detect the interaction between Tsr and

71
CheW proteins, and showed that Tsr V388C and R398C form crosslinks with CheW, but
the presence of CheA decreased the cross-linking efficiency for Tsr V398C and increased
the cross-linking efficiency for Tsr R388C (Pedetta et al., 2014). These two receptor
residues are listed in red in Table 5.1 because they are not found within the peptides that
show incomplete HDX; this may be because Cys disulfide formation probes longer-range
contacts. Finally, there are two current models for the receptor array: (1) the Crane model
based on an x-ray crystal structure of a CF/CheA/CheW complex (3ur1) and ECT studies
of intact receptors in cells (Briegel et al., 2012), and (2) the Cassidy model based on ECT
studies of CF complexes assembled on lipid monolayers and MD simulations (Cassidy et
al., 2015). Analysis of these models to identify receptor residues within 3 Å of CheA or
CheW yields the residues listed in Table 5.2. Again, most of these residues lie within the
peptides with incomplete HDX. Note that some of the experimental data listed in Table 5.1
was obtained from nonfunctional complexes. The experiments on functional complexes
(highlighted in green) are the ECT of arrays in cells (Briegel et al., 2012), ECT of CF arrays
bound to lipid monolayers (Cassidy et al., 2015), disulfide crosslinking of complexes in
cells (Pedetta et al., 2014), and HDX of CF arrays bound to lipid vesicles (this study).
Table 5.1. Receptor residues interacting with CheA and CheW.
Protein Interaction
(proteins present)a
Method
(reference)
Receptor Residues
Involved in Interactionb
Receptor/CheA
(TM001490-206c
CheA∆354d)
NMRh
(Wang et al., 2012a)
375, 376, 378, 382
Receptor/CheA
(Tm14se
CheA∆354d
CheW) for X-ray,
in vivo for EM
X-ray (3UR1)/ECT modeli
(Briegel et al., 2012)
371, 375, 378, 379, 382,
386, 400, 406, 410

72
Receptor/CheA
(Tar-CF, CheA,
CheW)f
ECT/MD (3JA6)i
(Cassidy et al., 2015)
369, 375, 378, 379, 392
Receptor/CheA
(Tar-CF, CheA,
CheW)g
HDX-MSj
(this study)
372-383, 395-417
Receptor/CheW
(TM001490-206c
CheW)
NMRh
(Wang et al., 2012a)
375, 376, 378, 382
Receptor/CheW
(TM001490-206c
CheW)
NMRk
(Vu et al., 2012)
372, 377, 379, 380–383,
385, 386, 396
Receptor/CheW
(Tsr, CheA,
CheW)
In vivo cross-linking of Cys
mutants (Pedetta et al., 2014)
386, 396
Receptor/CheW
(Tm14se
CheA∆354d
CheW), in vivo for
EM
X-ray crystallography
(3UR1)/ECT modell
(Briegel et al., 2012)
378, 379, 381, 383
Receptor/CheW
(Tar-CF, CheA,
CheW)
ECT/MD (3JA6)l
(Cassidy et al., 2015)
375, 378, 379, 382, 383,
385, 386, 392, 402
Receptor/CheW
(Tar-CF, CheA,
CheW)
HDX-MSj
(this study)
372-383
aOnly the protein complexes highlighted in green are functional bAsp receptor (E. coli Tar) residue numbers are obtained as follows: TM0014 number +
240 = Tar number; Tm14s number - 2002 = Tar number; Tsr number - 2 = Tar number.
Red indicates contacts reported in previous studies that are not within the regions with
incomplete HDX at 16 hr. cTM001490-206 is a truncated version of TM0014, a single chain soluble chemoreceptor
which lacks the transmembrane region and does not support trimer-of-dimer formation (Vu
et al., 2012). dCheAΔ354 is a monomeric construct containing only P4 and P5 eResidues 107-191 of the T maritima receptor Tm14s, corresponding to the protein
interaction domain. fFunctional complexes assembled on lipid monolayers. gFunctional complexes assembled on lipid vesicles. hChemical shift perturbation of receptor 13C-methyl ILV sidechains upon binding iResidues of Tar that are within 3Å of CheA in Crane model or 3JA6. jIncomplete HDX at 16 hr. kChemical shift perturbation of receptor 15N-amide backbone upon binding lResidues of Tar that are within 3Å of CheW in Crane model or 3JA6.

73
Table 5.2 lists numbers of remaining protons at 16 hr in the peptides of the protein
interaction region that exhibit incomplete exchange. Protection levels were determined by
subtracting the mass at 16 hr from the mass of the fully exchanged control (which corrects
for back exchange). The peptides of the membrane-distal cytoplasmic tip are listed in Table
5.2; these show a range of 0.9–4.4 Da unexchanged at 16 hours, except peptide 384-394
which exhibits complete HDX. Bold red text in this table highlights significant (≥ 0.9 Da)
changes in the residual protons: 4Q vs 4E exhibit a change in the 369-378 range and kinase-
on vs kinase-off exhibit a change in the 395-417 range.
Table 5.2. Number of protons remaining after 16 hr of HDX in functional complexes of
CF4Q, CF4E and CF4Q.A411V.a
Peptides CF4Q
(Da) CF4E (Da) CF4Q.A411V
(Da) 1 369-376 1.66±0.8 0.76±0.04 0.93±0.07
2 369-378 2.96±0.3 1.54* 2.22*
3 371-376 1.59±0.3 0.78±0 1.16*
4 372-376 1.29* 0.74* 1.01*
5 372-378 2.35±0.3 1.3±0.07 1.77±0.2
6 377-383 2.58±0.04 1.96±0.2 3.03±0.03
7 377-393 -- 2.69* 3.86*
8 379-393 -- 1.68* --
9 379-394 -- -- 3.14±0.4
10 381-393 -- -- 1.21*
11 384-394 Complete exchange
Complete exchange
Complete exchange
12 394-417 -- 2.11* --
13 395-414 -- 1.25* --
14 395-417 4.4±0.7 -- 2.78±0.4
15 401-417 -- 1.46±0.1 1.76±0.3 aNumbers of unexchanged protons are the average ± standard deviation of two replicates,
except where an asterisk indicates a single observation of that state. No data (--) indicates
the peptide was not observed in either replicate for that state. Significant differences (> 0.9
Da) between methylation states (CF4Q vs CF4E) or signaling states (CF4Q vs
CF4Q.A411V) are highlighted in bold red text.

74
As shown in Table 5.3, the overlapping peptides listed in Table 5.2 can be used to
further localize protected residues, which are likely to be at the protein-protein interaction
sites. Such an approach on functional complexes may provide new insights for these and
other important multi-protein complexes.
Table 5.3. Protected sites deduced from overlapping peptides with incomplete HDX.
Protected
sites (subtracted peptides)a
CF4Q sites
CF4E sites
A411 V sites
369-370 (1-3)
0.07 -0.02 -0.23
371 (3-4)
0.3 0.04 0.15
372-376 (peptide 4)
1.29 0.74 1.01
377-378 (5-4)
1.06 0.56 0.76
377-378 (7-8)
1.01
379-383 (6-(5-4))
1.52 1.4 2.27
381-383 (10-11)
1.21
394-400 (12-15)
0.65
394 or 415-417 (12-
13)
0.86
395-400 (14-15)
1.02
401-417 (15)
1.46 1.76
aNumbers result from subtraction of the indicated peptides listed in Table 5.2.

75
5.4. HDX results lead to a new model for the signaling mechanism
The goal of our study was to compare the dynamic of the receptor in different
signaling states and methylation states, both to test the proposed inverse dynamics model
and to gain further insights into the signaling mechanism. The HDX results indicate that
both the methylation region and protein interaction region of CF incorporated in functional
complexes are stabilized in the kinase-on state relative to the kinase-off state (Figure 3.5),
which is different from the proposed inverse dynamics model (Swain et al., 2009) in which
the methylation region is stabilized but the protein interaction domain is destabilized.
Based on our HDX results we propose a new model for the signaling mechanism,
illustrated in Figure 5.1, which involves modulation of an order/disorder transition of the
receptor cytoplasmic domain. The CF apparently populates a long-lived unfolded state,
based on the widespread correlated HDX. The correlated exchange is significantly slower
at the protein interaction sites, suggesting that binding of CheA and CheW stabilize the
CF. Free CF has been shown to be highly dynamic, with properties similar to a “molten
globule.” We propose that CF in arrays is less dynamic than free CF, but still populates a
disordered state, and that signaling proceeds by modulating an order/disorder or
folding/unfolding transition. Binding of CheA and CheW induces folding of CF, into a
complex that activates the kinase (for simplicity, the model shown in Figure 5.1 shows
only strong/weak binding of CheA, but similar changes may also apply to CheW).
Demethylation and the ligand-induced piston each induce unfolding of CF, which in turn
weakens the binding interactions with CheA and/or CheW, yielding a kinase-off state.
The observed slower HDX in both the methylation and protein interaction regions
of the kinase-on state support this model, and also suggest that it is the interaction with
76
CheA-P3 that is weakened in the kinase-off state. However, the fact that greater HDX
differences are observed with methylation state than with signaling state is not consistent
with the model: the stabilization (HDX difference) is not proportional to the difference in
kinase activity. There may be some explanation for this paradox: the A411V mutation may
not faithfully represent the kinase-off state, or the crowded vesicle assembly may distort
the properties of the demethylated state so that it does not faithfully represent a kinase-on
state. Experiments are needed to test the predictions of the proposed model: (1) Do
methylation and ligand-binding modulate the affinity of the receptor for CheA and CheW?
(2) Does HDX of CheA-P3 reflect a decrease in its interaction with CF in the kinase-off
state? (3) What HDX changes occur upon ligand binding to the intact receptor, the “true”
kinase-off state? Modulation of a folding transition of the entire CF is an exciting new idea
for explaining the integration of different inputs (ligand-induced piston and methylation)
and the long-distance propagation of the signal 200Å from the membrane to the membrane-
distal-tip of the receptor.

77
Figure 5.1. Proposed folding-mediated signaling mechanism. CF in arrays exhibits
widespread correlated exchange, suggesting that CF populates a long-lived unfolded state.
All regions except those interacting with CheA and CheW exhibit fast exchange,
suggesting that only these protein interactions stabilize the unfolded state. We propose that
CheA binds to CF in a kinase-on conformation and induces CF folding. Thus anything that
destabilizes CF folding, such as the ligand-induced piston or demethylation, would weaken
CheA binding and result in the kinase-off state. Note that CheA would not dissociate
completely from the arrays, due to interactions with CheW.

78
APPENDIX
VESICLE SURFACE AREA FOR ASSEMBLY OF SIGNALING ARRAYS
The vesicle template assembly method was developed to assemble CF onto vesicles
in functional complexes with CheA and CheW (Shrout et al., 2003). In this original study,
a mixture of DOPC and DOGS-NTA-Ni2+ lipids was used to bind the His-tagged CF onto
the vesicle surface, and substoichiometric amounts of CheA and CheW were included such
that all of the CheA was incorporated into functional complexes. Our study instead aimed
to use excess CheA and CheW to drive all of the CF into functional complexes. Thus it is
important to estimate the vesicle surface area and choose a high enough lipid concentration
for all of the His-tagged CF to bind to the vesicles and form hexagonal arrays with CheA
and CheW. The vesicle surface area calculation below aims (1) to check what fraction of
the His-tagged CF in the previous HDX study (Koshy et al., 2014) were in hexagonal arrays
with CheA and CheW and (2) to demonstrate that the 725 µM lipid has sufficient surface
area for assembly of all 30 µM His-tagged CF into functional hexagonal arrays.
In native cells, chemoreceptors form trimers-of-dimers that form hexagonal arrays
with CheA and CheW. Three hexagons meet at each trimer-of-dimers, so each hexagon
contains one dimer per vertex, for a total of 6 dimers per hexagon. The center-to-center
distance between hexagons is 12 nm (Briegel et al., 2012). Figure A.1. illustrates the
geometry of the hexagon and the fact that x is equal to 6 nm divided by cos 30°, so x =
6.93 nm.
To calculate the area of each hexagon:

79
Area of each CF in hexagon:
Figure A.1. Hexagon geometry in array. The center to edge distance is 6 nm, yielding a
12-nm center to center hexagonal spacing. Each internal angle is 120°, making x the
hypotenuse of a 30-60-90 triangle.
A1. Fraction of CF in Koshy study that were in hexagonal arrays
In Koshy’s study, CF functional complexes contained 30 µM CF and 580 µM total
lipid which has 290 µM DOGS-NTA-Ni2+ and 290 µM DOPC. Calculation below shows
the fraction of CF in Koshy’s study in hexagonal arrays:
where x is the concentration of CF in hexagonal arrays with CheA and CheW; y is the
concentration of CF bound close-packed to the vesicles; 0.725 nm2 is the average
membrane surface area of DOPC lipid per molecule (Nagle and Tristram-Nagle, 2000) and
3.2 nm is the area per non-array CF bound to vesicles (Besschetnova et al., 2008). Solving
both equations yields x=15.87 µM, and 15.87 µM/30 µM=53%. Therefore, only 53% of
the 30 µM CF was in hexagonal arrays and the remaining 47% in Koshy’s study were non-
array CF bound to the vesicles.
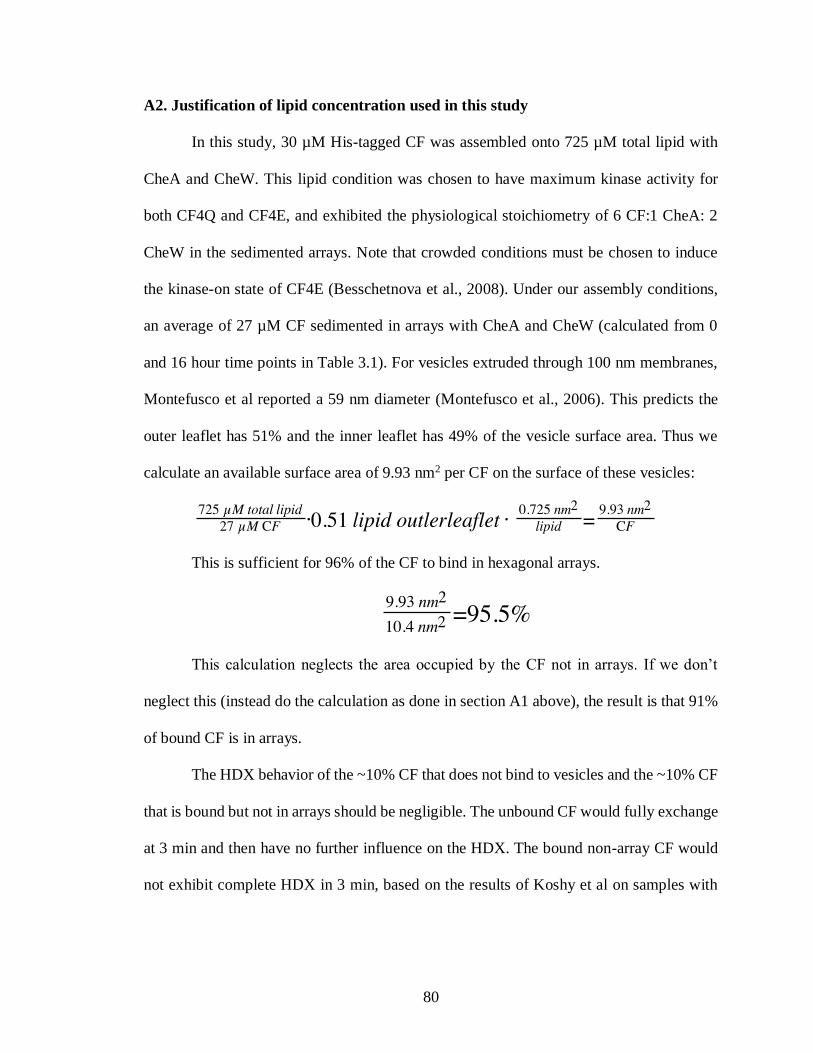
80
A2. Justification of lipid concentration used in this study
In this study, 30 µM His-tagged CF was assembled onto 725 µM total lipid with
CheA and CheW. This lipid condition was chosen to have maximum kinase activity for
both CF4Q and CF4E, and exhibited the physiological stoichiometry of 6 CF:1 CheA: 2
CheW in the sedimented arrays. Note that crowded conditions must be chosen to induce
the kinase-on state of CF4E (Besschetnova et al., 2008). Under our assembly conditions,
an average of 27 µM CF sedimented in arrays with CheA and CheW (calculated from 0
and 16 hour time points in Table 3.1). For vesicles extruded through 100 nm membranes,
Montefusco et al reported a 59 nm diameter (Montefusco et al., 2006). This predicts the
outer leaflet has 51% and the inner leaflet has 49% of the vesicle surface area. Thus we
calculate an available surface area of 9.93 nm2 per CF on the surface of these vesicles:
This is sufficient for 96% of the CF to bind in hexagonal arrays.
This calculation neglects the area occupied by the CF not in arrays. If we don’t
neglect this (instead do the calculation as done in section A1 above), the result is that 91%
of bound CF is in arrays.
The HDX behavior of the ~10% CF that does not bind to vesicles and the ~10% CF
that is bound but not in arrays should be negligible. The unbound CF would fully exchange
at 3 min and then have no further influence on the HDX. The bound non-array CF would
not exhibit complete HDX in 3 min, based on the results of Koshy et al on samples with

81
47% bound non-array CF. Thus these two 10% populations would exhibit different HDX,
and none of the conclusions of our HDX study are based on a 10% fraction.
A slightly higher lipid concentration [10.4 nm2/CF * 30 µM CF * (2 lipid/0.725
nm2 DOPC bilayer surface area) = 860 µM lipid] might have been better in order to
incorporate all of the CF into the arrays, but might also have made it difficult to
reproducibly crowd the CF4E into the kinase-on state.

82
BIBLIOGRAPHY
Amin, D. N.; Hazelbauer, G. L. Influence of Membrane Lipid Composition on a
Transmembrane Bacterial Chemoreceptor. J. Biol. Chem. 2012, 287 (50), 41697–41705.
Aravind, L.; Ponting, C. P. The Cytoplasmic Helical Linker Domain of Receptor Histidine
Kinase and Methyl-Accepting Proteins Is Common to Many Prokaryotic Signalling
Proteins. FEMS Microbiol. Lett. 1999, 176 (1), 111–116.
Bartelli, N. L.; Hazelbauer, G. L. Bacterial Chemoreceptor Dynamics: Helical Stability in
the Cytoplasmic Domain Varies with Functional Segment and Adaptational Modification.
J. Mol. Biol. 2016, 428 (19), 3789–3804.
Besschetnova, T. Y.; Montefusco, D. J.; Asinas, A. E.; Shrout, A. L.; Antommattei, F. M.;
Weis, R. M. Receptor Density Balances Signal Stimulation and Attenuation in Membrane-
Assembled Complexes of Bacterial Chemotaxis Signaling Proteins. Proc. Natl. Acad. Sci.
U. S. A. 2008, 105 (34), 12289–12294.
Briegel, A.; Ding, H. J.; Li, Z.; Werner, J.; Gitai, Z.; Dias, D. P.; Jensen, R. B.; Jensen, G.
J. Location and Architecture of the Caulobacter Crescentus Chemoreceptor Array. Mol.
Microbiol. 2008, 69 (1), 30–41.
Briegel, A.; Ortega, D. R.; Tocheva, E. I.; Wuichet, K.; Li, Z.; Chen, S.; Muller, A.; Iancu,
C. V; Murphy, G. E.; Dobro, M. J.; et al. Universal Architecture of Bacterial
Chemoreceptor Arrays. Proc Natl Acad Sci U S A 2009, 106 (40), 17181–17186.
Briegel, A.; Ames, P.; Gumbart, J. C.; Oikonomou, C. M.; Parkinson, J. S.; Jensen, G. J.
The Mobility of Two Kinase Domains in the Escherichia Coli Chemoreceptor Array Varies
with Signalling State. Mol. Microbiol. 2013, 89 (5), 831–841.
Briegel, A.; Wong, M. L.; Hodges, H. L.; Oikonomou, C. M.; Piasta, K. N.; Harris, M. J.;
Fowler, D. J.; Thompson, L. K.; Falke, J. J.; Kiessling, L. L.; et al. New Insights into
Bacterial Chemoreceptor Array Structure and Assembly from Electron Cryotomography.
Biochemistry 2014, 53 (10), 1575–1585.
Briegel, a.; Li, X.; Bilwes, a. M.; Hughes, K. T.; Jensen, G. J.; Crane, B. R. Bacterial
Chemoreceptor Arrays Are Hexagonally Packed Trimers of Receptor Dimers Networked
by Rings of Kinase and Coupling Proteins. Proc. Natl. Acad. Sci. 2012, 109 (10), 3766–
3771.
Cassidy, C. K.; Himes, B. A.; Alvarez, F. J.; Ma, J.; Zhao, G.; Perilla, J. R.; Schulten, K.;
Zhang, P. CryoEM and Computer Simulations Reveal a Novel Kinase Conformational
Switch in Bacterial Chemotaxis Signaling Department of Physics and Beckman Institute ,
University of Illinois at Urbana-Champaign , Urbana , IL 61801 , USA Department of
Structural Biolo. 2015, No. November.

83
Chervitz, S. a; Falke, J. J. Molecular Mechanism of Transmembrane Signaling by the
Aspartate Receptor: A Model. Proc. Natl. Acad. Sci. U. S. A. 1996, 93 (6), 2545–2550.
Chung, K. Y.; Rasmussen, S. G. F.; Liu, T.; Li, S.; Devree, B. T.; Chae, P. S.; Calinski, D.;
Kobilka, B. K.; Woods, V. L.; Sunahara, R. K. Conformational Changes in the G Protein
Gs Induced by the β 2 Adrenergic Receptor. Nature 2011, 477 (7366), 611–617.
Duc, N. M.; Du, Y.; Thorsen, T. S.; Lee, S. Y.; Zhang, C.; Kato, H.; Kobilka, B. K.; Chung,
K. Y. Effective Application of Bicelles for Conformational Analysis of G Protein-Coupled
Receptors by Hydrogen/deuterium Exchange Mass Spectrometry. J. Am. Soc. Mass
Spectrom. 2015, 26 (5), 808–817.
Falke, J. J.; Hazelbauer, G. L. Transmembrane Signaling in Bacterial Chemoreceptors.
Trends Biochem. Sci. 2001, 26 (4), 257–265.
Fowler, D. J.; Weis, R. M.; Thompson, L. K. Kinase-Active Signaling Complexes of
Bacterial Chemoreceptors Do Not Contain Proposed Receptor-Receptor Contacts
Observed in Crystal Structures. Biochemistry 2010, 49 (7), 1425–1434.
Gegner, J. A.; Dahlquist, F. W. Signal Transduction in Bacteria: CheW Forms a Reversible
Complex with the Protein Kinase CheA. Proc Natl Acad Sci U S A 1991, 88 (3), 750–754.
Guttman, M.; Weis, D. D.; Engen, J. R.; Lee, K. K. Analysis of Overlapped and Noisy
Hydrogen/Deuterium Exchange Mass Spectra. J. Am. Soc. Mass Spectrom 2013, 24, 1906–
1912.
Haglin, E. R. Assembly and Functional Architechture of Bacterial Chemoreceptor
Nanoarrays. ScholarWorks 2018, p 132.
Haglin, E. R.; Yang, W.; Briegel, A.; Thompson, L. K. His-Tag-Mediated Dimerization of
Chemoreceptors Leads to Assembly of Functional Nanoarrays. Biochemistry 2017, 56
(44), 5874–5885.
Houde, D.; Berkowitz, S. A.; Engen, J. R. The Utility of Hydrogen/deuterium Exchange
Mass Spectrometry in Biopharmaceutical Comparability Studies. J. Pharm. Sci. 2011, 100
(6), 2071–2086.
Kacprzyk-Stokowiec, A.; Kulma, M.; Traczyk, G.; Kwiatkowska, K.; Sobota, A.; Dadlez,
M. Crucial Role of PerfringolysinOD1 Domain in Orchestrating Structural Transitions
Leading to Membrane-Perforating Pores: A Hydrogen-Deuterium Exchange Study. J. Biol.
Chem. 2014, 289 (41), 28738–28752.
Kapust, R. B.; Tözsér, J.; Fox, J. D.; Anderson, D. E.; Cherry, S.; Copeland, T. D.; Waugh,
D. S. Tobacco Etch Virus Protease: Mechanism of Autolysis and Rational Design of Stable
Mutants with Wild-Type Catalytic Proficiency. Protein Eng. 2001, 14 (12), 993–1000.
84
Kashefi, M.; Thompson, L. K. Signaling-Related Mobility Changes in Bacterial
Chemotaxis Receptors Revealed by Solid-State NMR. J. Phys. Chem. B 2017, 121 (37),
8693–8705.
Kim, K. K.; Yokota, H.; Kim, S. H. Four-Helical-Bundle Structure of the Cytoplasmic
Domain of a Serine Chemotaxis Receptor. Nature 1999, 400 (6746), 787–792.
Koshy, S. S.; Li, X.; Eyles, S. J.; Weis, R. M.; Thompson, L. K. Hydrogen Exchange Di
Ff Erences between Chemoreceptor Signaling Complexes Localize to Functionally
Important Subdomains. Biochemistry 2014, 53 (49), 7755–7764.
Li, G.; Weis, R. M. Covalent Modification Regulates Ligand Binding to Receptor
Complexes in the Chemosensory System of Escherichia Coli. Cell 2000, 100 (3), 357–365.
Lukat, G. S.; Lee, B. H.; Mottonen, J. M.; Stock, A. M.; Stock, J. B. Roles of the Highly
Conserved Aspartate and Lysine Residues in the Response Regulator of Bacterial
Chemotaxis. J. Biol. Chem. 1991, 266 (13), 8348–8354.
Maddock, J. R.; Shapiro, L. Polar Location of the Chemoreceptor Complex in the
Escherichia Coli Cell. Science 1993, 259 (5102), 1717–1723.
Marcsisin, S. R.; Engen, J. R. Hydrogen Exchange Mass Spectrometry: What Is It and
What Can It Tell Us? Anal. Bioanal. Chem. 2010, 397 (3), 967–972.
Mo, G.; Zhou, H.; Kawamura, T.; Dahlquist, F. W. Solution Structure of a Complex of the
Histidine Auto Kinase CheA with Its Substrate CheY. Biochemistry 2012, 51 (18), 3786–
3798.
Montefusco, D. J.; Shrout, A. L.; Besschetnova, T. Y.; Weis, R. M. Formation and Activity
of Template-Assembled Receptor Signaling Complexes. Langmuir 2006, 23 (6), 3280–
3289.
Morgan, C. R.; Hebling, C. M.; Rand, K. D.; Stafford, D. W.; Jorgenson, J. W.; Engen, J.
R. Conformational Transitions in the Membrane Scaffold Protein of Phospholipid Bilayer
Nanodiscs. Mol. Cell. Proteomics 2011, 10 (9), M111.010876.
Murphy, O. J.; Yi, X.; Weis, R. M.; Thompson, L. K. Hydrogen Exchange Reveals a Stable
and Expandable Core within the Aspartate Receptor Cytoplasmic Domain. J. Biol. Chem.
2001, 276 (46), 43262–43269.
Nagle, J. F.; Tristram-Nagle, S. Structure of Lipid Bilayers. Biochim. Biophys. Acta - Rev.
Biomembr. 2000, 1469 (3), 159–195.
Ottemann, K. M.; Xiao, W.; Shin, Y.-K.; Koshland, D. E. A Piston Model for
Transmembrane Signalling of the Aspartate Receptor. Science (80-. ). 1999, 285 (5434),
1751–1754.

85
Pedetta, A.; Parkinson, J. S.; Studdert, C. A. Signalling-Dependent Interactions between
the Kinase-Coupling Protein CheW and Chemoreceptors in Living Cells. Mol. Microbiol.
2014, 93 (6), 1144–1155.
Samanta, D.; Borbat, P. P.; Dzikovski, B.; Freed, J. H.; Crane, B. R. Bacterial
Chemoreceptor Dynamics Correlate with Activity State and Are Coupled over Long
Distances. Proc. Natl. Acad. Sci. 2015, 2 (10), 2455–2460.
Schneider, C. A.; Rasband, W. S.; Eliceiri, K. W. NIH Image to ImageJ : 25 Years of Image
Analysis HISTORICAL Commentary NIH Image to ImageJ : 25 Years of Image Analysis.
Nat. Methods 2012, 9 (7), 671–675.
Shrout, A. L.; Montefusco, D. J.; Weis, R. M. Template-Directed Assembly of Receptor
Signaling Complexes. Biochemistry 2003, 42 (46), 13379–13385.
Sourjik, V.; Berg, H. C. Receptor Sensitivity in Bacterial Chemotaxis. Proc. Natl. Acad.
Sci. U. S. A. 2002, 99 (1), 123–127.
Swain, K. E.; Gonzalez, M. A.; Falke, J. J. Engineered Socket Study of Signaling through
a Four-Helix Bundle: Evidence for a Yin-Yang Mechanism in the Kinase Control Module
of the Aspartate Receptor. Biochemistry 2009, 48 (39), 9266–9277.
Vu, A.; Wang, X.; Zhou, H.; Dahlquist, F. W. The Receptor-CheW Binding Interface in
Bacterial Chemotaxis. J. Mol. Biol. 2012, 415 (4), 759–767.
Wadhams, G. H.; Armitage, J. P. Making Sense of It All: Bacterial Chemotaxis. Nat. Rev.
Mol. Cell Biol. 2004, 5 (12), 1024–1037.
Wang, X.; Vu, A.; Lee, K.; Dahlquist, F. W. CheA-Receptor Interaction Sites in Bacterial
Chemotaxis. J. Mol. Biol. 2012a, 422 (2), 282–290.
Wang, X.; Wu, C.; Vu, A.; Shea, J. E.; Dahlquist, F. W. Computational and Experimental
Analyses Reveal the Essential Roles of Interdomain Linkers in the Biological Function of
Chemotaxis Histidine Kinase CheA. J. Am. Chem. Soc. 2012b, 134 (39), 16107–16110.
Weis, D. D.; Wales, T. E.; Engen, J. R.; Hotchko, M.; Eyck, L. F. Ten. FOCUS:
HYDROGEN EXCHANGE AND COVALENT MODIFICATION Identification and
Characterization of EX1 Kinetics in H/D Exchange Mass Spectrometry by Peak Width
Analysis. J Am Soc Mass Spectrom 2006, 17, 1498–1509.
Xiao, H. U. I.; Hoerner, J. K.; Eyles, S. J.; Dobo, A.; Kaltashov, I. A.; Voigtman, E.; C, A.
I. M. E. L. Mapping Protein Energy Landscapes with Amide Hydrogen Exchange and Mass
Spectrometry : I . A Generalized Model for a Two-State Protein and Comparison with
Experiment. Protein Sci. 2005, 14, 543–557.

86
Zhang, P.; Khursigara, C. M.; Hartnell, L. M.; Subramaniam, S. Direct Visualization of
Escherichia Coli Chemotaxis Receptor Arrays Using Cryo-Electron Microscopy. Proc.
Natl. Acad. Sci. U. S. A. 2007, 104 (10), 3777–3781.
Zhou, Q.; Ames, P.; Parkinson, J. S. Mutational Analyses of HAMP Helices Suggest a
Dynamic Bundle Model of Input-Output Signalling M Chemoreceptors. Mol. Microbiol.
2009, 73 (5), 801–814.