hydrogen production by the catalytic auto-thermal
TRANSCRIPT

HYDROGEN PRODUCTION BY THE CATALYTIC AUTO-THERMAL REFORMING
OF SYNTHETIC CRUDE GLYCEROL IN A PACKED BED TUBULAR REACTOR
A Thesis
Submitted to the Faculty of Graduate Studies and Research
In Partial Fulfillment of the Requirements
For the Degree of
Master of Applied Science
In
Process Systems Engineering
University of Regina
By
Ahmad Mahmoud Abdul Ghani
Regina, Saskatchewan
July, 2014
Copyright 2014: A. M. Abdul Ghani

UNIVERSITY OF REGINA
FACULTY OF GRADUATE STUDIES AND RESEARCH
SUPERVISORY AND EXAMINING COMMITTEE
Ahmad Mahmoud Abdul Ghani, candidate for the degree of Master of Applied Science in Process Systems Engineering, has presented a thesis titled, Hydrogen Production by the Cataylitic Auto-Thermal Reforming of Synthetic Crude Glycerol in a Packed Bed Tubular Reactor, in an oral examination held on July 23, 2014. The following committee members have found the thesis acceptable in form and content, and that the candidate demonstrated satisfactory knowledge of the subject material. External Examiner: Dr. Shahid Azam, Environmental Systems Engineering
Co-Supervisor: Dr. Hussameldin Ibrahim, Process Systems Engingeering
Co-Supervisor: *Dr. Farshid Torabi, Petroleum Systems Engineering
Committee Member: Dr. Amr Henni, Industrial Systems Engineering
Committee Member: Dr. Raphael Idem, Process Systems Engineering
Chair of Defense: Dr. Christopher Street, Faculty of Business Administration *Not present at defense

i
ABSTRACT
The target of this work was to develop an efficient autothermal reforming (ATR)
process for the production of renewable hydrogen from synthetic crude glycerol (CG).
Hence, the work was divided into three phases: (1) development of a high performance
catalyst, (2) optimization of process variables, and (3) investigating the kinetics of the
involved reactions. A portfolio of ternary oxide catalysts with a nominal composition of
5Ni/CeZrM (where M= Ca, Gd, Mg) was prepared, characterized and tested in the
process. A series of experiments was conducted in a Packed Bed Tubular Reactor
(PBTR) using a factorial design technique to investigate the effects of the different
operating parameters. A rate model expression was then developed based on the
experimental kinetic data.
Synthetic CG was reformed over a modified cerium-zirconium support loaded
with nickel catalyst (5%Ni/CeZrM) by a combination of partial oxidation and steam
reforming reactions to generate hydrogen via an overall auto-thermal process. Amongst
the tested catalysts, calcium promoted one showed the highest catalytic activity due
mainly to its reducibility and nickel dispersion properties. The prepared catalysts were
characterized by N2 physisorption (BET), thermogravemetric analysis (TGA),
temperature programmed oxidation (TPO), temperature programmed reduction (TPR),
inductively coupled plasma-mass spectrometry (ICP-MS) and x-ray diffraction (XRD)
techniques.
Likewise, the composition of crude glycerol mixture generated at biodiesel plants,
free glycerol, methanol, soap, free fatty acids and ashes (NaCl and KCl), were contained

ii
in the synthetic crude glycerol. The catalytic performance was evaluated based on
conversion, hydrogen selectivity, hydrogen yield, turnover frequency and rate of coke
formation. A reforming temperature of 575°C, steam-to-carbon ratio (S/C) of 2.6,
oxygen-to-carbon ratio (O/C) of 0.125, reduction temperature of 600°C and calcination
temperature of 550°C were experimentally found to be the best operating conditions
based on hydrogen yield and process stability. Analysis of Variance (ANOVA) was
performed to study the main effects and interactions among the different parameters and
quantify the significance of each parameter on the overall performance. Reaction
temperature and S/C ratio were found to be the most influential variables on conversion
and H2 selectivity.
The kinetics of synthetic CG ATR reactions were studied in a temperature range
of 500-650°C, steam-to-carbon (S/C) range of 1.6-3.6, oxygen-to-carbon (O/C) range of
0.05-0.2, weight space velocity (WSV) range of 0-158.2 gcat.min/mol C and at
atmospheric pressure. In preparation for collecting intrinsic kinetic data, a region free of
heat and mass transfer limitations was established by varying catalyst particle size and
inlet flow rates in the ranges of 0.55-1.27 mm and 0.0019-0.0033 mol C/min,
respectively, and the stability of the catalyst was tested in an extended period run for 15
hours time on stream (TOS) experiment. The integral method of kinetic analysis was then
applied to estimate the parameters of the proposed power law model. The activation
energy was found to be 93.7 kJ/mol, alongside with reaction orders of 1, 0.5 and 2 with
respect to synthetic CG, steam and oxygen, respectively. Excellent agreement between
the experimental conversion results and those predicted by the model was observed with
an absolute average deviation (AAD) of 5.2%.

iii
ACKNOWLEDGMENTS
I would especially like to express my deep gratitude to my supervisor Dr.
Hussameldin Ibrahim for his guidance, support and encouragement throughout the course
of my research work that allowed me to complete this research work successfully. Also, I
would like to extend my gratitude to my co-supervisor Dr. Farshid Torabi for the
continuous support he has provided throughout my research work. I would also like to
thank Dr. Raphael Idem for his expert recommendations and helpful suggestions.
I would like to thank the Natural Sciences and Engineering Research Council of
Canada (NSERC) for their financial support through the NSERC Discovery Grant held
by Dr. Hussameldin Ibrahim. Thanks to Dr. Farshid Torabi, the Faculty of Graduate
Studies and Research (FGSR) and the Faculty of Engineering at the University of Regina
for providing additional financial support and the International Test Centre for CO2
Capture (ITC) for giving me the opportunity to perform the experimental phase of my
work in their laboratories.
I am very grateful to my family and friends for their motivation and support
throughout the course of this program. Special thanks go to my parents and to my brother
Mohammad for their assistance and suggestions. I also would like to thank my friends
Faezeh Sabri, Judith Oluku, Harry Inibehe, Naveed Qamar, Zeeshan Shahid, Anku Edet,
Bandar and Laila Jaafary for their encouragement and helpful discussions.

iv
TABLE OF CONTENTS
ABSTRACT i
ACKNOWLEDGMENTS iii
TABLE OF CONTENTS iv
LIST OF TABLES x
LIST OF FIGURES xi
NOMENCLATURE xvi
CHAPTER 1 INTRODUCTION 1
1.1 Hydrogen: The Global Perspective 2
1.2 Hydrogen Production Techniques 4
1.3 Justification 6
1.3.1 Biodiesel in Canada 6
1.3.2 Crude Glycerol: Biomass for Hydrogen 7
Production
1.4 Knowledge Gap and Problem Identification 10
1.5 Research Objectives and Scope 12
1.5.1 Phase 1: Catalyst Preparation and
Characterization 12
1.5.2 Phase 2: Experimental Investigation
of Process Performance in a PBTR 13
1.5.3 Phase 3: Kinetic Study 14
1.6 Original Contributions 15

v
CHAPTER 2 LITERATURE REVIEW 16
2.1 Precis 16
2.2 Hydrogen as a Fuel 16
2.3 Crude Glycerol 17
2.4 Hydrogen Production from Glycerol Biomass 19
2.4.1 Steam Reforming 20
2.4.2 Partial Oxidation 22
2.4.3 Auto-Thermal Reforming 23
2.4.4 Hydrogen Peroxide Reforming 30
2.4.5 Dry Reforming 30
2.4.6 Dry Auto-Thermal Reforming 31
2.4.7 Aqueous Reforming 31
2.5 Kinetics of Glycerol Reforming 32
2.6 Statistical Approaches 34
2.7 Catalysts for Glycerol Reforming 35

vi
CHAPTER 3 EXPERIMENTAL SECTION 37
3.1 Safety Precautions 37
3.2 Catalyst Preparation 38
3.2.1 Chemicals Used 38
3.2.2 Equipment Utilized 37
3.2.3 Support Preparation 39
3.2.4 Nickel Impregnation 41
3.3 Catalyst Characterization 42
3.3.1 Thermo-Gravimetric Analysis 42
3.3.2 N2 Physisorption 43
3.33 Temperature Programmed Oxidation 43
3.3.4 Temperature Programmed Reduction 44
3.3.5 Powder X-Ray Diffraction 45
3.3.6 Inductively Coupled Plasma Mass 45
Spectrometry
3.4 Reaction Feed Stock 46
3.4.1 Synthetic CG Feed 46

vii
3.4.2 Steam Feed 47
3.4.3 Oxygen Feed 47
3.5 Performance Evaluation 49
3.5.1 Experimental Setup 49
3.5.2 Catalytic Activity Evaluation 51
3.6 Performance Evaluation Criteria 54
3.7 Design of Experiments 59
CHAPTER 4 RESULTS AND DISCUSSION 61
4.1 Catalyst Characterization 61
4.1.1 Thermo-gravimetric Analysis 61
4.1.2 N2 Physisorption on Fresh Catalysts 64
4.1.3 N2 Physisorption on Spent Catalysts 67
4.1.4 Temperature Programmed Oxidation 70
4.1.5 Temperature Programmed Reduction 77
4.1.6 X-ray Diffraction 79
4.2 Catalytic Activity 81
4.2.1 Effects of Synthetic CG Components 81

viii
4.2.2 Catalysts Screening- Promoter Effect 87
4.2.3 Structure-Activity Relationship 91
4.3 Parametric Study 96
4.3.1 Effect of Reduction Temperature 96
4.3.2 Effect of Calcination Temperature 100
4.3.3 Effect of Steam-to-Carbon Ratio 103
4.3.4 Effect of Oxygen-to-Carbon Ratio 107
4.3.5 Effect of Reaction Temperature 110
4.4 Statistical Analysis 112
4.4.1 Main Effects and Interactions 112
4.4.2 Model Development 118
4.5 Kinetics 123
4.5.1 Heat and Mass Transport Limitations 123
4.5.1.1 Effect of Pellets Size 123
4.5.1.2 Effect of flow Rate 126
4.5.2 Extended TOS Stability 128
4.5.3 Mass Distribution 131

ix
4.5.4 Results of Kinetics Experiments 135
4.5.5 Rate Model 139
4.5.6 Estimation and Validation of Model 143
Parameters
Chapter 5 CONCLUSIONS AND RECOMMENDATIONS 145
5.1 Conclusions 148
5.2 Recommendations 151
REFERENCES 152
APPENDICES 161
Appendix A: Representative GC Data Sheets 164
Appendix B: Regression Results from NLREG for Conversion Model 184
Appendix C: Regression Results from PLKA software (Kinetics) 187
Appendix D: Carbon Analysis Results from Loring Laboratories LTD. 188
Appendix E: Synthetic CG Average Molecular formula Calculations 189

x
LIST OF TABLES
Table 1.0 Composition of crude glycerol from Milligan Biofuels Inc. 8
Table 2.1 Crude glycerol composition in wt% 19
Table 3.1 Compositions of catalysts prepared 41
Table 3.2 Physical properties and percentage composition of the synthetic CG 48
Table 3.3 Different reaction stoichiometries at different S/C and O/C ratios 56
Table 3.4 (a) Parametric experiments 59
Table 3.4 (b) Kinetic experiments (variables: reactant concentrations) 59
Table 3.4 (c) Kinetic experiments (variables: temperature and W/FA0) 59
Table 4.1 BET and ICP-MS results of fresh supports and catalysts 64
Table 4.2 BET results of spent catalysts at different reaction temperatures 67
Table 4.3 Pearson correlations coefficients for structure-activity relationship 92
Table 4.4a Experimental data for model development 119
Table 4.4b Experimental and predicted conversions 120
Table 4.5 Carbon distribution in the system (basis: 1 hour of operations) 131
Table 4.6 Reaction stoichiometries at different operating conditions 138
Table 4.7 Estimation results of model parameters 142
Table 4.8 Experimental kinetic data with the predicted conversion results 143

xi
LIST OF FIGURES
Figure 3.1 Schematic flow diagram of the experimental setup for synthetic CG 50
autothermal reforming in a PBTR
Figure 4.1 TGA profiles of CeZrCa support and the corresponding 5wt% catalyst 62
Figure 4.2 (a) N2 Isotherms of fresh CeZrM supports and corresponding 5Ni/CeZrM 65
catalysts
Figure 4.2 (b) N2 Isotherms of spent 5Ni/CeZrCa catalysts at different reaction 68
temperatures
Figure 4.3 Coke deposition rates at different O/C ratios 71
Figure 4.4 Coke deposition rates at different S/C ratios 71
Figure 4.5 Coke formation rates at different reaction temperatures 72
Figure 4.6 (a) TPO profiles of spent catalysts at different oxygen-to-carbon ratios 73
Figure 4.6 (b) TPO profiles of spent catalysts at different steam-to-carbon ratios 74
Figure 4.6 (c) TPO profiles of spent catalysts at different reaction temperatures 75
Figure 4.7 TPR profiles of the fresh supports and catalysts 77
Figure 4.8 XRD patterns of the fresh supports and catalysts 79
Figure 4.9 Evaluation of the individual effects of the different components of 83
CG on the ATR reactions of synthetic CG at 600°C, 1.0 atm, S/C= 3.6 and O/C= 0.125
using 5Ni/CeZrGd catalyst in a PBTR. (GM: Glycerol + Methanol)
xii
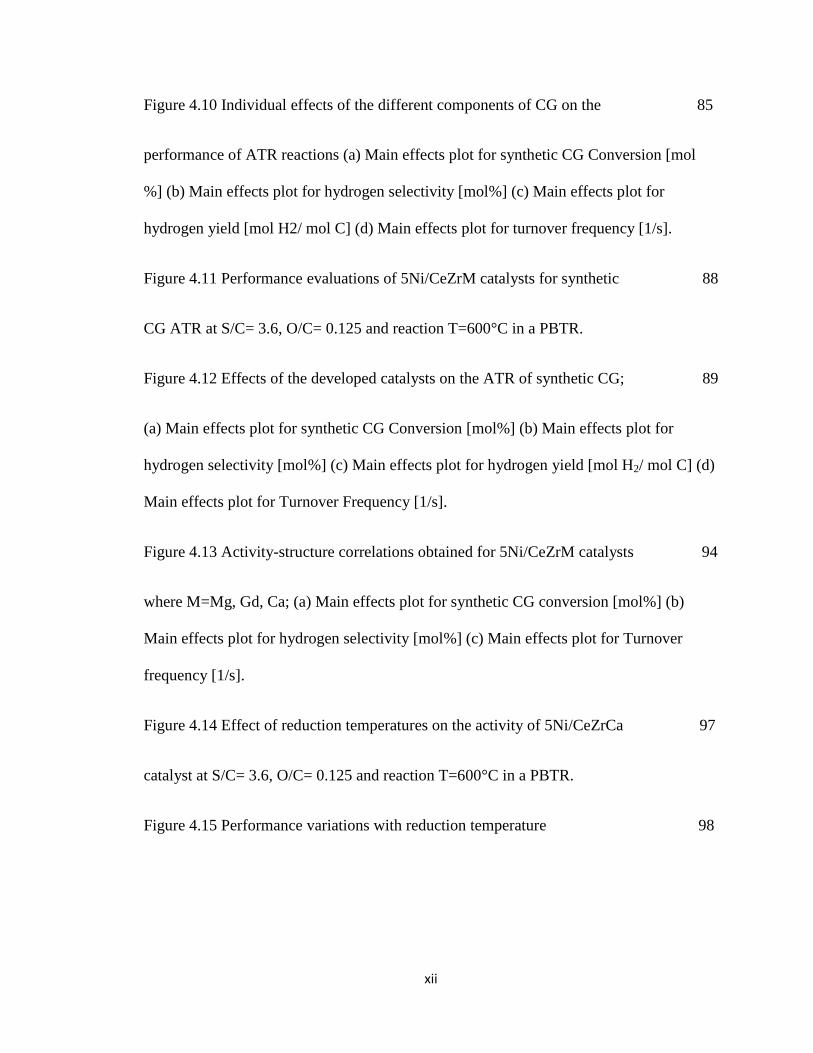
Figure 4.10 Individual effects of the different components of CG on the 85
performance of ATR reactions (a) Main effects plot for synthetic CG Conversion [mol
%] (b) Main effects plot for hydrogen selectivity [mol%] (c) Main effects plot for
hydrogen yield [mol H2/ mol C] (d) Main effects plot for turnover frequency [1/s].
Figure 4.11 Performance evaluations of 5Ni/CeZrM catalysts for synthetic 88
CG ATR at S/C= 3.6, O/C= 0.125 and reaction T=600°C in a PBTR.
Figure 4.12 Effects of the developed catalysts on the ATR of synthetic CG; 89
(a) Main effects plot for synthetic CG Conversion [mol%] (b) Main effects plot for
hydrogen selectivity [mol%] (c) Main effects plot for hydrogen yield [mol H2/ mol C] (d)
Main effects plot for Turnover Frequency [1/s].
Figure 4.13 Activity-structure correlations obtained for 5Ni/CeZrM catalysts 94
where M=Mg, Gd, Ca; (a) Main effects plot for synthetic CG conversion [mol%] (b)
Main effects plot for hydrogen selectivity [mol%] (c) Main effects plot for Turnover
frequency [1/s].
Figure 4.14 Effect of reduction temperatures on the activity of 5Ni/CeZrCa 97
catalyst at S/C= 3.6, O/C= 0.125 and reaction T=600°C in a PBTR.
Figure 4.15 Performance variations with reduction temperature 98

xiii
(a) Main effects plot for synthetic CG conversion [mol%] (b) Main effects plot for
hydrogen selectivity [mol%] (c) Main effects plot for hydrogen yield [mol H2/mol Cin)
(d) Main effects plot for turnover frequency [1/s].
Figure 4.16 Effect of calcination temperatures on the activity of 5Ni/CeZrCa 100
catalyst at S/C= 3.6, O/C= 0.125 and reaction T=600°C in a PBTR.
Figure 4.17 Performance variations with calcination temperatures 101
(a) Main effects plot for synthetic CG conversion [mol%] (b) Main effects plot for
hydrogen selectivity [mol%] (c) Main effects plot for hydrogen yield [mol H2/ mol Cin]
(d) Main effects plot for Turnover frequency [1/s].
Figure 4.18 Effect of S/C ratio on synthetic CG ATR reactions using 104
5Ni/CeZrCa catalyst at O/C= 0.05 and reaction T=600°C in a PBTR.
Figure 4.19 Performance variations with steam-to-carbon (S/C) ratio 105
at O/C= 0.05 and reaction T=600°C in a PBTR.
Figure 4.20 Effect of O/C ratio on synthetic CG ATR reactions using 107
5Ni/CeZrCa catalyst at S/C= 2.6 and reaction T=600°C in a PBTR.
Figure 4.21 Performance variations with oxygen-to-carbon (O/C) ratio 108
at 600°C and W/FA0=127.4 gccat.min/ mol C using 5Ni/CeZrCa catalyst.
Figure 4.22 Performance variations with reaction temperature at 110

xiv
S/C= 2.6, O/C= 0.125, W/FA0= 127.4 gcat.min/ mol C using 5Ni/CeZrCa catalyst.
Figure 4.23 Main effects plots 114
(a) Synthetic CG Conversion (b) Hydrogen Selectivity (c) Turnover Frequency.
Figure 4.24 Interactions plots 115
(a) Synthetic CG Conversion (b) Hydrogen Selectivity (c) Turnover Frequency.
Figure 4.25 Pareto Charts 116
(a) Synthetic CG Conversion (b) Hydrogen Selectivity (c) Turnover Frequency.
Figure 4.26 Parity plot of experimental versus predicted conversion 120
Figure 4.27 Effects of catalyst pellets size on the activity 123
(a) Synthetic CG Conversion (b) Hydrogen Selectivity (c) Hydrogen Yield
Figure 4.28 Effect of feed molar flow rate on the activity 125
(a) Synthetic CG Conversion (b) Hydrogen Selectivity (c) Hydrogen Yield
Figure 4.29 Long term stability run for synthetic CG ATR over 5Ni/CeZrCa 127
catalyst at S/C= 3.6; O/C= 0.125; reaction T= 600°C and W/FA0= 2.64 gcat. h/mol C
Figure 4.30 I-MR control charts of conversion and turnover frequency 128
Figure 4.31 Material flow diagram of the synthetic CG reformer 132
Figure 4.32 (a) Conversion variations with W/FA0 at different reaction 134

xv
temperatures (500 and 550°C)
Figure 4.32 (b) Conversion variations with W/FA0 at different reaction 135
temperatures (600 and 650°C)
Figure 4.32 (c) Conversion of synthetic CG versus W/FA0 136
Figure 4.33 Parity plot of predicted data versus experimental data 142
xvi
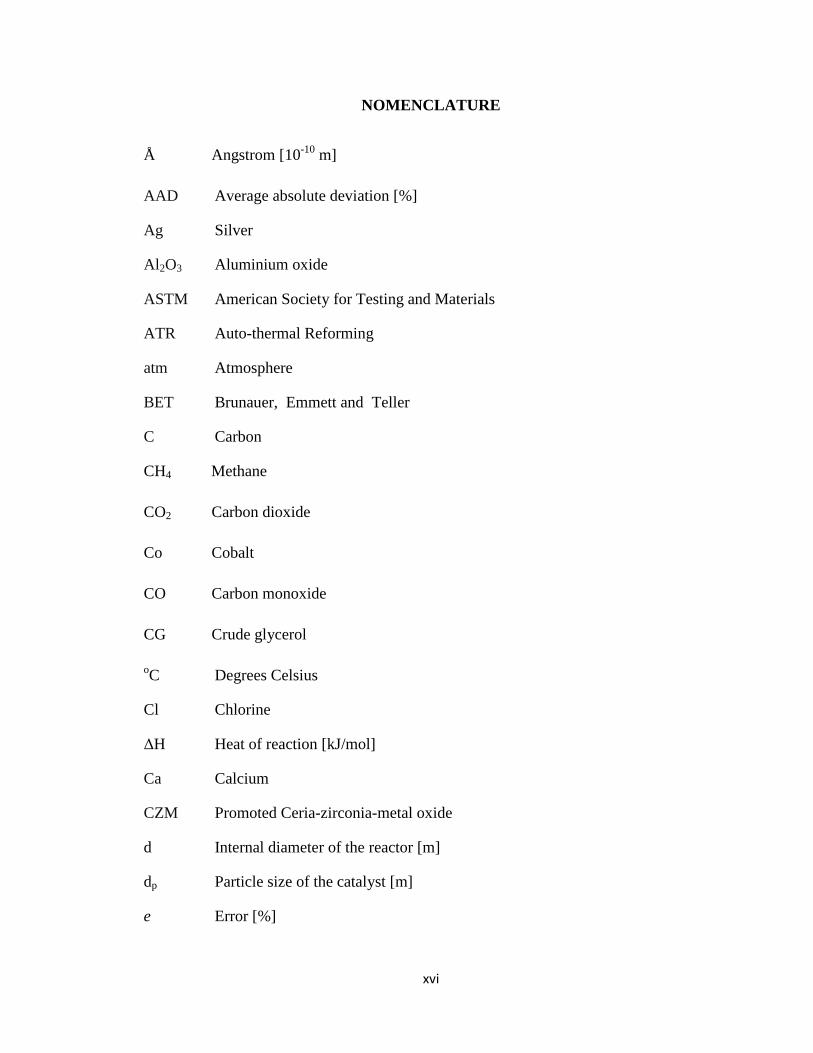
NOMENCLATURE
Å Angstrom [10-10
m]
AAD
Ag
Al2O3
ASTM
ATR
atm
BET
Average absolute deviation [%]
Silver
Aluminium oxide
American Society for Testing and Materials
Auto-thermal Reforming
Atmosphere
Brunauer, Emmett and Teller
C Carbon
CH4 Methane
CO2 Carbon dioxide
Co Cobalt
CO Carbon monoxide
CG Crude glycerol
oC
Cl
ΔH
Degrees Celsius
Chlorine
Heat of reaction [kJ/mol]
Ca
CZM
d
dp
e
Calcium
Promoted Ceria-zirconia-metal oxide
Internal diameter of the reactor [m]
Particle size of the catalyst [m]
Error [%]

xvii
EA
FA0
Activation energy [kJ/mol]
Inlet flow rate [mol C/min]
Fe Iron
GC
Gd
Gas chromatography
Gadolinium
H2
H2O
H2S
HP
ICP-MS
IUPAC
K
kJ
k0
kPa
L
Mg
mg
Na
Ni
N2
O
P
Hydrogen
Water
Hydrogen sulfide
High Pressure
Inductively Coupled Plasma-Mass Spectroscopy
International Union of Pure and Applied Chemistry
Potassium
Kilojoule
Frequency factor [mol C gcat-1
min-1
atm-3.46
]
Kilo Pascal
Catalyst bed height [m]
Magnesium
Milligram
Sodium
Nickel
Nitrogen
Oxygen
Pressure [Pa]
pH Negative logarithm of hydrogen ion concentration

xviii
PV
Pt
psi
Rh
S
SA
SAR
SSM
SiO2
S/M
S/C
Tmax
TCD
TGA
TOS
TPO
TPR
UHP
W/FA0
WGS
wt.
XRD
Specific Pore volume [cm3/g]
Platinum
Pound per square inch
Rhodium
Steam
Specific surface area [m2/g]
Structure activity relationship
Squared sum of residuals
Silica
Surfactant/metal ratio
Steam/Carbon
Temperature at maximum peak [°C]
Thermal conductivity detector
Thermo gravimetric analysis
Time on stream
Temperature programmed oxidation
Temperature programmed reduction
Ultra high purity
Weight time [gcat.min/mol C]
Water-gas-shift
Weight [g]
X-ray diffraction
Density of catalyst [g/cm3]

1
CHAPTER 1
INTRODUCTION
The growing science of climate change research is increasingly demonstrating the need to
produce more environmentally sustainable energy sources. The three confirmed facts
according to (Rand & Dell, 2008) are: (1) the climate on earth is changing to become
warmer; (2) the percentage of carbon dioxide in the atmosphere has seen a dramatic
increase since the beginning of the Industrial Revolution; (3) carbon dioxide released
from burning fossil fuels is a greenhouse gas that increases the heat capacity of air and,
thus, the energy reserved in the atmosphere. Not only carbon dioxide, but also methane,
nitrous oxides, hydrofluorocarbons (HFCs), perfluorocarbons (PFCs) and sulphur
hexafluoride have been classified as greenhouse gases that contribute to the global
warming. The Intergovernmental Panel on Climate Change (IPCC, 2014) reported net
GHG emissions of more than 49 billion tonnes of CO2 equivalents in 2010, which was
the maximum level in human history. For these reasons and more, it is now widely
agreed that hydrogen energy is a promising alternative capable to replace carbon-based
one. A comprehensive strategic plan is required to account for the associated
technological, economical, political and social considerations.

2
1.1 HYDROGEN:THE GLOBAL PERSPECTIVE
In 1997, the U.S. President’s Council of Advisors on Science and Technology
expected that hydrogen will become a significant energy carrier compared to electricity
not in the short term, but at least in the mid- to long term research work plans. In May
2009, Steven Chu, the Secretary of Energy said “We asked ourselves, is it likely in the
next 10, 15 or 20 years that we will convert to hydrogen car economy? The answer, we
felt, was no”. McKinsey’s study in 2010 showed that Fuel Cell Electric Vehicles
(FCEVs) are technologically ready and can be commercialised to the market in the next
five years; the only step left was to develop an inclusive market plan in order to build
hydrogen infrastructure in Europe.
Hydrogen has long been recognized to have the highest amount of energy released
per unit mass burned, with -141 kJ/g enthalpy of combustion. Due to this fact, significant
efforts have been spent towards increasing the efficiency of hydrogen fuel (Mills et al.,
2002). Based on fuel-to-wheel efficiency values reported by (Sørensen, 2012), the
efficiency of hydrogen operated fuel cell cars is about 36%, while it is 26% for the
electric vehicles, 27% for high efficiency diesel engines and 17% for the conventional
gasoline engines.
As a clean, abundant and renewable source of energy, hydrogen can be utilised in
different ways to become a significant source of energy in the near future. According to
Hoffman (2012), the international world standards are getting to be zero-emissions from
automobiles, industry, residential furnaces and general transportations. Technically,
taking the carbon out of fossil fuel emissions is hard especially when considering mobile

3
or small emitters. The fossil fuels upon combustion release CO2, CO, NOx and SOx to the
atmosphere. These resulting pollutants contribute directly to serious environmental
problems such as global warming and climate change. According to McMichael et al.
(2003), fossil fuel emissions degrade air quality and continually change world’s climate;
and this in turn will impose several negative effects on human health and ecosystem.
Unlike fossil fuels, the hydrogen has minimum environmental impacts due to its zero
harmful emissions upon combustion. Moreover, considering the availability and
limitations of other alternative renewable energy sources; hydrogen has been always
preferred as no one can guarantee the wind to blow or the sun to shine.

4
1.2 HYDROGEN PRODUCTION TECHNIQUES
Hydrogen can be produced via various processes either from conventional fossil fuel
sources such as natural gas and coal, or alternative sources such as biomass, wind,
nuclear, solar and others. Typical reforming techniques for hydrogen production from
glycerol are: steam reforming, partial oxidation, auto-thermal reforming, hydrogen
peroxide reforming, dry reforming, dry autothermal reforming and aqueous phase
reforming. These techniques are discussed in more details in the literature review section.
By combining the functions of both steam reforming (endothermic) and partial oxidation
(exothermic) in one reactor, an auto-thermal process for glycerol reforming can be
developed to enhance hydrogen production and the overall efficiency. The main
advantageous factors in this process can be summarized as:
I. Energy efficiency: energy required for steam reforming will be supplied by the
highly exothermic oxidation reactions.
II. Process stability: oxidation of carbon molecules hinder coke formation over the
surface of the catalyst and subsequently maintain its activity (Hardiman et al.,
2006).
III. Practicality: auto-thermal reforming is a more pragmatic technique in real
biomass reformers, plus it can yield higher hydrogen productivity than steam
reforming (Ahmed and Krumpelt, 2001).
It is now very promising that renewable hydrogen from biomass reforming will play
a major role in the near future to compensate the dramatic increase of energy demands,
concurrent with the tendency of establishing an environment friendly energy system. The

5
cost of producing these renewable energy carriers as feasible alternatives for the fossil
fuels is still the main drawback. Crude glycerol mixture, the main biodiesel by-product
from transesterification process, worsens the cost effectiveness of biodiesel production.
The current market is flooded with glycerol and any further refining/purification is not
economical. On the other hand, glycerol mixture can be a significant biomass to be
utilised for hydrogen production for three main reasons: (1) to reform a toxic waste; (2)
to produce renewable hydrogen; (3) and to enhance biodiesel production economy.

6
1.3 JUSTIFICATION
1.3.1 BIODIESEL IN CANADA
Biodiesel utilization for supplying energy demands is a potential way to reduce
GHG emissions. As compared to the fossil diesel, the biodiesel emits 41% less GHG
upon combustion (Hill et al., 2006). A study by Dyer et al. (2010) revealed a significant
decrease in GHG emissions after blending petro-diesel with 2% and 5% biodiesel. The
net reduction in GHG emissions was measured to be 2.6 MgCO2eha-1
and 0.94
MgCO2eha-1
in the eastern and western regions of Canada; respectively.
Biodiesel manufacturing process is strongly influenced by the applied operating
conditions, raw materials and catalyst used. Nowadays, the most common technique to
produce biodiesel is the tranesterification of vegetable and animal oils (Chisti, 2007).
Using different feedstocks in the production process, the properties of biodiesel will be
mainly affected by the content of FFA in the fatty material used. The efficiency of using
waste cooking oil to produce biodiesel in Canada was studied by [Kulkarni & Dalai
(2006); Chhetri et al. (2008)]. Based on their results, waste cooking oil is an economical
feedstock to be utilised, and it yields a high performance fuel for diesel engines compared
with biodiesel generated from other feedstocks. Additionally, biodiesel production from
waste cooking oil reduces environmental problems and helps to avoid ethical debates
over using agricultural crops for the purpose.
Canadian governments have always motivated the production of biofuels through
low-tax, tax-refund and non-taxable biofuel programs. Besides that, in Saskatchewan,
Manitoba and Ontario, petro-fuels must contain 5 wt% biofuels before selling to the

7
customer. A study by (Smith et al. 2007) showed that the overall energy balance in
Canada can also be enhanced by producing biodiesel from canola and soybean oils. The
energy obtained from biodiesel was reported to be 2.1 to 2.4 times more than the energy
required for producing vegetable oils.
1.3.2 CRUDE GLYCEROL: BIOMASS FOR HYDROGEN PRODUCTION
The by-product of the transesterification process is the glycerol. The process
yields 1 mole of glycerol for every three moles of biodiesel produced. At present, the
worldwide production of crude glycerol is constantly increasing due to the continuous
developments in biodiesel economy. According to 2007 market analysis by ABG Inc.,
the estimated production of crude glycerol from biodiesel industry is expected to exceed
five billion pounds by 2020, which is really a huge volume. At the same time, demand on
free glycerol is not growing due to the saturation of the market, and this affects the value
of crude glycerol and consequently the efficiency of biodiesel production. According to
Yazdani and Gonzalez (2007), a sharp diminution in crude glycerol value has been
observed between 2004 and 2006 when its price dropped from 25 cents/lb to less than 3
cents/lb. During the same period, the production of biodiesel increased from 25 million
gallons in 2004 to about 250 million gallons in 2006. Subsequently crude glycerol
became a waste product with the associated disposal cost. As recently reported by Ayoub
& Abdullah (2012), the existing market of crude glycerol is very unsteady. Zhang et al.
(2003) reported a production rate of 120,000 ton/year of yellow grease, cooking oil with
less than 15 wt% FFA, in Canada. Based on the future scenarios for crude glycerol
treatment, supply and demand relationship will automatically control the prices of this
product.
8
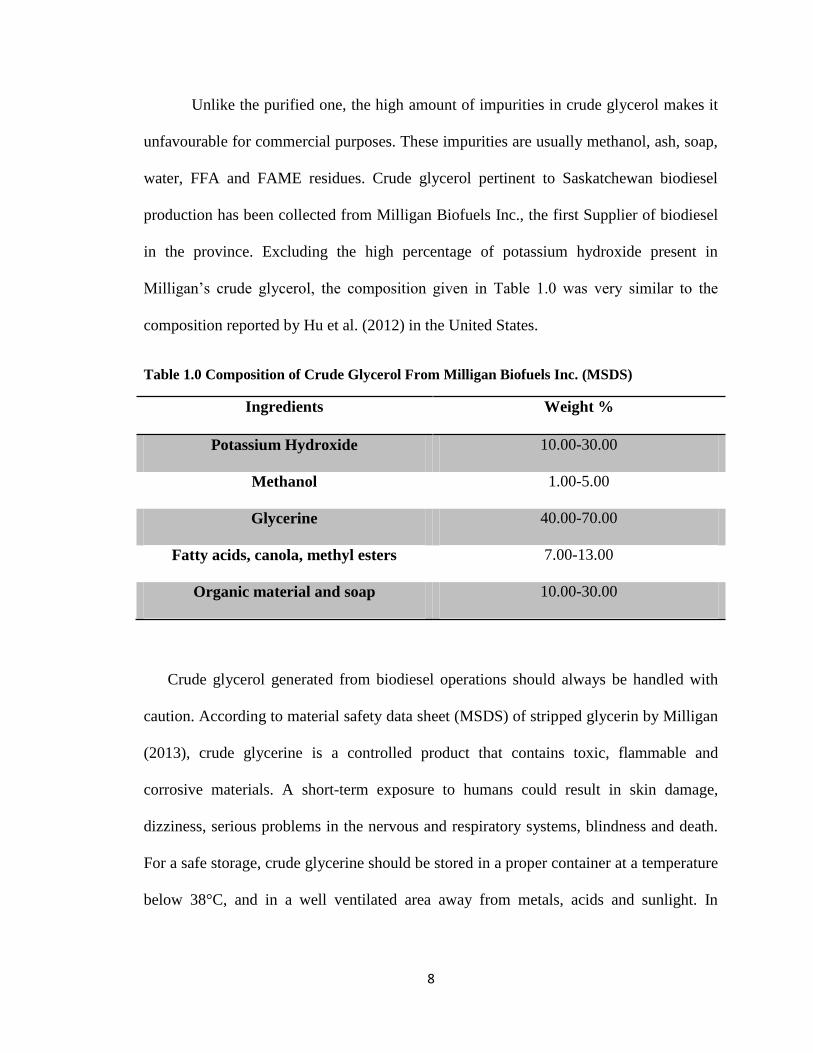
Unlike the purified one, the high amount of impurities in crude glycerol makes it
unfavourable for commercial purposes. These impurities are usually methanol, ash, soap,
water, FFA and FAME residues. Crude glycerol pertinent to Saskatchewan biodiesel
production has been collected from Milligan Biofuels Inc., the first Supplier of biodiesel
in the province. Excluding the high percentage of potassium hydroxide present in
Milligan’s crude glycerol, the composition given in Table 1.0 was very similar to the
composition reported by Hu et al. (2012) in the United States.
Table 1.0 Composition of Crude Glycerol From Milligan Biofuels Inc. (MSDS)
Ingredients Weight %
Potassium Hydroxide 10.00-30.00
Methanol 1.00-5.00
Glycerine 40.00-70.00
Fatty acids, canola, methyl esters 7.00-13.00
Organic material and soap 10.00-30.00
Crude glycerol generated from biodiesel operations should always be handled with
caution. According to material safety data sheet (MSDS) of stripped glycerin by Milligan
(2013), crude glycerine is a controlled product that contains toxic, flammable and
corrosive materials. A short-term exposure to humans could result in skin damage,
dizziness, serious problems in the nervous and respiratory systems, blindness and death.
For a safe storage, crude glycerine should be stored in a proper container at a temperature
below 38°C, and in a well ventilated area away from metals, acids and sunlight. In

9
addition, shipping of crude glycerol in Canada must be in accordance with the transport
of dangerous goods regulations TDGR.
Since the refining of crude glycerol to obtain pure products is very costly and cannot
be economically justified in the current market, CG generated at Canadian biodiesel
plants are mostly shipped to the United States for further processing (Milligan biofuels).
Many researchers these days are working hard to develop practical techniques for crude
glycerol reforming to improve the cost effectiveness of biodiesel production as an
efficient renewable energy for a sustainable future.

10
1.4 KNOWLEDGE GAP AND PROBLEM IDENTIFICATION
The major techniques for hydrogen production from glycerol reforming are: steam
reforming, partial oxidation and the combination of both reactions to have an auto-
thermal reforming process. Each technique has its own advantages and drawbacks related
to energy efficiency, hydrogen yield and process stability. The main reasons of interest in
autothermal reforming process are: (1) no external heat is required and consequently
simpler and lower capital cost technology (Rand & Dell, 2008); (2) stable operations with
the least coke formation (Hardiman et al., 2006); (3) practical technique that gives high
hydrogen production yields (Ahmed and Krumpelt, 2001). Thermodynamics of pure
glycerol autothermal reforming was investigated by [Wang et al. 2009; Yang et al. 2011].
Some thermodynamic studies addressed crude glycerol composed only of free glycerol
and methanol [Authayanun et al. 2010; Ortiz et al. 2011]. Thermodynamics of both pure
and crude glycerol feeds emphasized on the feasibility of autothermal reforming reactions
to produce hydrogen.
On the catalyst side, the failure of mechanical stability of Rhodium catalysts plus the
formation of several non-equilibrium components with Platinum catalysts were observed
by Rennard et al. (2009) upon testing the catalytic activity of these materials in the
process of autothermal reforming of glycerol. Unlike the results from yellow glycerol
autothermal reforming; nickel supported on promoted alumina carrier showed poor
performance and low hydrogen yield upon using crude glycerol from biodiesel plants due
to high coke formation and subsequently catalyst deactivation (Kamonsuangkasem et al.
2011). Most of the catalysts utilised for the purpose of glycerol reforming were Nobel
metals and very expensive [Pompeo et al., 2010; Dauenhauer et al., 2006; Rennard et al.,

11
2009; Slinn et al., 2008; Kunkes et al., 2008; Zhang et al., 2007; Hirai et al., 2005]. A
serious gap in the experimental work and reaction kinetics related to the process of
glycerol autothermal reforming has been discovered. Strong efforts were made in our
group by Sabri (2013) to experimentally optimise the different parameters in the process.
Pure glycerol was the feed reformed in this study. Nickel supported over cerium-
zirconium promoted carrier showed high catalytic performance in the process. At the end,
the kinetics of pure glycerol autothermal reforming was investigated and a rate model
equation was developed.

12
1.5 RESEARCH OBJECTIVES AND SCOPE
The aim of this study was to generate hydrogen via an efficient process capable of
reforming synthetic crude glycerol similar to the one generated at biodiesel plants. The
main objectives of the work were (1) to develop a proper catalyst capable of handling the
different impurities of crude glycerol, (2) to optimize different operating variables in the
autothermal reforming process in order to attain a stable hydrogen yield, (3) to investigate
the main effects and interactions between these parameters, and (4) to study the kinetics
of autothermal reforming reactions and develop an appropriate rate model expression.
The performance of different catalysts under similar operating conditions was
evaluated based on glycerol conversion, hydrogen selectivity, turnover frequency and
coke formation criteria. The stability of the process was studied based on an extended
term run for 16 hours time-on-stream. The screening experiments at different operating
conditions were conducted in a PBTR for 6 hours time-on-stream. Both the fresh and the
spent catalysts were characterized for their physical and chemical properties. A statistical
analysis was performed to investigate the effects and interactions among the different
operating parameters and to generate a general model for glycerol conversion. The
objectives of this work were mapped in into three phases.
1.5.1 Phase I: Catalyst Preparation and Characterization
i. Preparation of cerium-zirconium supports promoted with gadolinium, magnesium
and calcium according to surfactant-assisted technique.
ii. Impregnation of 5 wt% Nickel over the prepared supports according to the
standard wet impregnation technique.

13
iii. Characterizing the prepared supports and catalysts for their physical and chemical
properties using the following techniques:
a. Thermogravimetry Analysis (TGA)
b. Temperature Programmed Reduction (TPR)
c. Temprature Programmed Oxidtion (TPO)
d. N2 Physisorption (BET)
e. X-ray Diffraction (XRD)
f. Inductively Coupled Plasma Mass Spectrometry (ICP-MS)
1.5.2 Phase Π: Experimental Investigation of Process Performance in a PBTR
i. Conducting the performance screening experiments in a PBTR over Ni-based
catalysts to discover the effects of different operating variables on the reforming
process. The optimized operating parameters in this study were:
a. Promoter element (Ca, Mg & Gd)
b. Reduction temperature (500, 600 & 700°C)
c. Calcination temperature (550, 600 & 650°C)
d. Reaction temperature (500, 550,600 & 650°C)
e. Steam-to-carbon molar ratio (1.6, 2.6 & 3.6)
f. Oxygen-to-carbon molar ratio (0.05, 0.125 & 0.2)
ii. Statistically analyzing the collected experimental data to better correlate the
effects of the different operating parameters to the overall performance. These
effects were also quantified and regressed to generate a mathematical model for
crude glycerol conversion.

14
iii. Characterizing the spent catalysts to investigate the impacts of the major
parameters on the catalyst side. This was done by applying BET and TPO analysis
on the spent catalysts.
iv. Analyzing the carbon contained in the different streams of the process and
performing a material balance to validate the experimental runs. The carbon in the
liquid stream was quantified by a TOC analysis. The results are given in
Appendix D and interpreted in the results section.
1.5.3 Phase Ш: Kinetic Study
i. Establishing the kinetic regions to avoid any possible heat or mass transfer
limitations. This was achieved by varying catalyst particle size and inlet flow of
crude glycerol.
ii. Testing the stability of the process through an extended term run for 16 hours
time-on-stream experiment.
iii. Collecting the intrinsic kinetic data by varying reforming temperature, catalyst
weight time (W/FA0), steam-to-carbon and oxygen-to-carbon ratios as the main
four kinetically controlled parameters in the process.
iv. Development and validation of a rate expression (power law model) to
mathematically describe the kinetics of ATR of crude glycerol.
The next chapter in this study will present a thorough literature review about the
hydrogen production from glycerol reforming. The addressed topics include hydrogen
energy, crude glycerol from biodiesel plants, techniques of hydrogen production,
catalysts used, and kinetics and statistical approaches in the field.

15
1.6 ORIGINAL CONTRIBUTIONS
Crude glycerol generated at biodiesel plants has a great potential for hydrogen
production. The high concentration of free glycerol and methanol in the crude mixture
makes it a desirable source for renewable hydrogen. The overall efficiency of hydrogen
production from glycerol is directly related to the reforming process. This includes the
employed catalyst, operating conditions, reactants concentrations, etc. Most of the
previous studies were focused on producing hydrogen from pure glycerol via
conventional steam reforming or partial oxidation techniques. However, these techniques
have basic limitations related to energy requirement, process stability and hydrogen yield.
In addition, the studied feedstock was mostly pure glycerol. The several impurities
present in crude glycerol were neglected due to their negative effects on catalyst activity
and process stability. Refining crude glycerol to obtain pure products is very expensive.
The low prices of pure glycerol and methanol make it unfeasible to go for further
refining.
The current study deals with synthetic crude glycerol having impurities similar to
the ones contained in the industrial mixture. The autothermal reforming technique was
employed due the basic advantages mentioned before. A proper stable catalyst was then
developed. The effects of the different operating variables were investigated through an
inclusive experimental work. The main interactions among these variables and their
magnitudes were statistically analyzed. The kinetics of the involved reactions was also
studied and a representative rate model was developed. The employed realistic situations
of feedstock besides the comprehensive experimental and mathematical analyses in this
study are the key factors to implement this process at the industrial scale.

16
CHAPTER 2
LITERATURE REVIEW
2.1 PRECIS
The main contributions of the current research work to the pool of scientific
knowledge can be identified as: (1) developing an inexpensive catalyst for hydrogen
production via auto-thermal reforming of synthetic crude glycerol; (2) reforming crude
glycerol without pre-treatment and further expenses; (3) characterising and screening
catalyst performance under different operating conditions; (4) simplifying the employed
reactions and reactor design; (5) investigating the main effects and interactions in order to
attain a stable hydrogen yield; and (6) conducting a kinetic study for the ATR of
synthetic crude glycerol. This chapter includes the extensive literature survey that was
conducted to fully track the progress in the area of hydrogen production from glycerol
reforming.
2.2 HYDROGEN AS A FUEL
In 1766, British philosopher Henry Cavendish discovered the “inflammable air”
which produces water upon combustion. “Inflammable air” was the common name of
Hydrogen before 1783 until it was recognised and named by the French chemist Antoine
Lavoisier, Father of Modern Chemistry. After he burned hydrogen in the presence of
oxygen, Lavoisier proved that water is not a pure element as what had been known
before, but a combination of hydrogen and oxygen atoms. In 1787, Lavoisier with
Guyton de Morveau, Claude-Louis Berthollet, and Antoine François de Fourcroy
developed a new approach to nomenclature and submitted their reports to the Academy

17
of Sciences. Since that time, oxygen and hydrogen gases have been officially identified
and considered as two distinct compounds. Hydrogen gas is composed of the most
abundant element in the universe. It is a diatomic non-metal compound formed of two
hydrogen atoms. As a colourless, odourless, non-toxic, very light, carbon free and highly
combustible gas, hydrogen is a clean energy carrier that yields 2.75 times more energy
than hydrocarbon fuels (Kapdan and Kargi, 2006). Several techniques have been applied
to produce hydrogen from both fossil and renewable resources. According to Holladay et
al. (2009), hydrogen production technologies are divided into two major groups: fuel
processing and non-reforming techniques. Hydrogen from fuel processing includes
hydrocarbon reforming, pyrolysis, plasma reforming, aqueous reforming and ammonia
reforming. On the other side, non-reforming techniques go under two main branches:
Hydrogen from biomass such as; biomass gasification and biological hydrogen
Hydrogen from water such as; electrolysis, thermochemical water splitting and
photo-electrolysis.
2.3 CRUDE GLYCEROL
The increasing tendency toward replacing fossil fuels with cleaner energy carriers
keeps pushing the need of alternative energy sources to the top. Biodiesel is a promising
alternative produced mainly via transesterification of vegetables or animal fats with
alcohol in the presence of a basic catalyst, usually NaOH or KOH (Ma and Hanna, 1999).
The weight ratio of crude glycerol to fatty acid methyl esters ‘FAME’ produced from
transesterification reactions at biodiesel plants is about 9:1 (Johnson and Taconi, 2007). The
composition of crude glycerol strongly depends on the oil source, alcohol feed, catalyst

18
used, reactions utilised, process efficiency, operating conditions and any pre or post
treatments. In 2006, Thomson and He characterized several crude glycerol samples
generated from different vegetable oil feedstocks: canola, crambe, mustard, rapeseed,
soybean and waste cooking oils; the last showed a big difference with respect to crude
glycerol chemical and physical properties compared to the rest of samples that showed
little variations from each other. According to Wijesekara et al. (2008), the chemical
composition (w/w) of crude glycerol from sunflower oil looks like: 50% methanol, 30%
free glycerol, 13% soap, 2% moisture, 2-3% salts (mostly sodium and potassium) and
same 2-3% for other impurities. Furthermore, Hansen et al. (2009) studied the
characteristics of eleven crude glycerol samples generated at seven different biodiesel
plants in Australia. As a part of their results, the researchers gave information about pH,
density and composition of raw glycerol. After calculating the average of 11
measurements, raw glycerol was found to have a value of 5.9 for pH, 1.2 g/cm3 for
density, 72.4% (w/w) for glycerol content, 5.5% for moisture, 5.2% for ash, 4.12% for
methanol and 13.9% for the matter organic non-glycerol (MONG). In a follow up, the
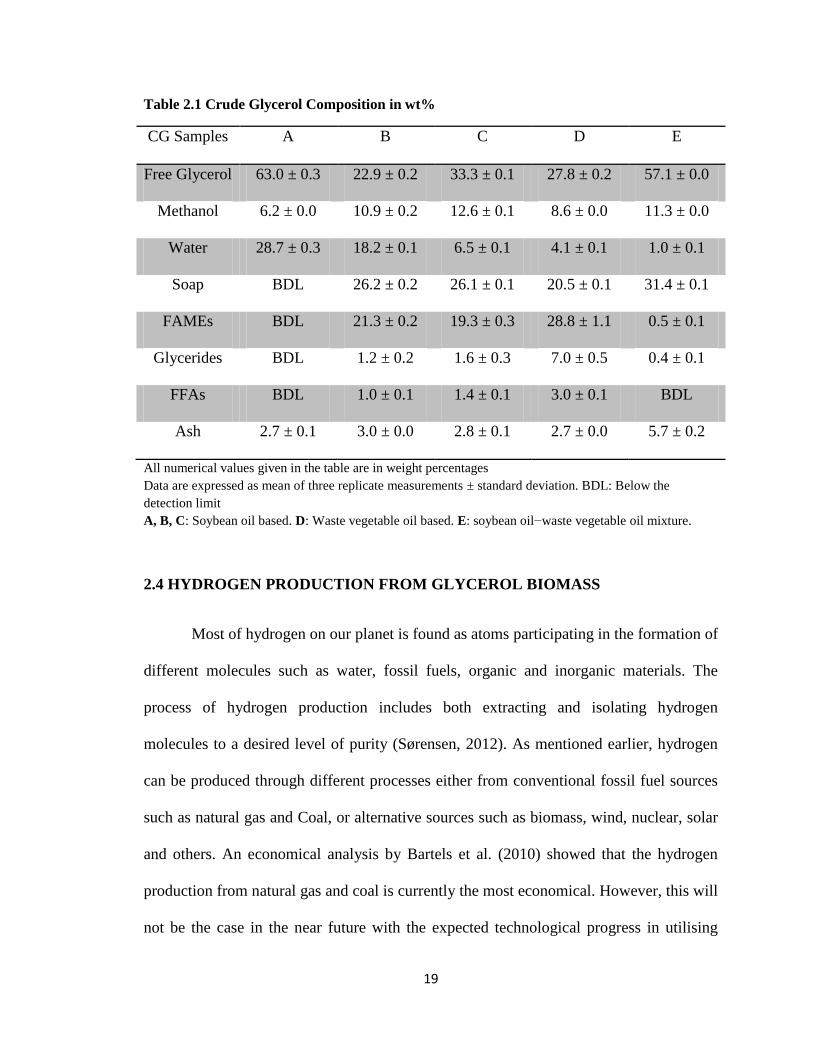
most recent and comprehensive work by Hu et al. (2012) presented a detailed study
corresponding to the physical and chemical characteristics of five raw glycerol samples
obtained from biodiesel manufacturing processes. The determined physical properties
were: density, pH and viscosity. Besides the results of physical properties and elemental
composition, Hu et al. (2012) reported the chemical composition of crude glycerol as
weight composition (Table 2.1) of free glycerol, methanol, free fatty acids (FFAs), fatty
acids methyl esters (FAMEs), soap, glycerides, water and ash.
19
Table 2.1 Crude Glycerol Composition in wt%
CG Samples A B C D E
Free Glycerol 63.0 ± 0.3 22.9 ± 0.2 33.3 ± 0.1 27.8 ± 0.2 57.1 ± 0.0
Methanol 6.2 ± 0.0 10.9 ± 0.2 12.6 ± 0.1 8.6 ± 0.0 11.3 ± 0.0
Water 28.7 ± 0.3 18.2 ± 0.1 6.5 ± 0.1 4.1 ± 0.1 1.0 ± 0.1
Soap BDL 26.2 ± 0.2 26.1 ± 0.1 20.5 ± 0.1 31.4 ± 0.1
FAMEs BDL 21.3 ± 0.2 19.3 ± 0.3 28.8 ± 1.1 0.5 ± 0.1
Glycerides BDL 1.2 ± 0.2 1.6 ± 0.3 7.0 ± 0.5 0.4 ± 0.1
FFAs BDL 1.0 ± 0.1 1.4 ± 0.1 3.0 ± 0.1 BDL
Ash 2.7 ± 0.1 3.0 ± 0.0 2.8 ± 0.1 2.7 ± 0.0 5.7 ± 0.2
All numerical values given in the table are in weight percentages
Data are expressed as mean of three replicate measurements ± standard deviation. BDL: Below the
detection limit
A, B, C: Soybean oil based. D: Waste vegetable oil based. E: soybean oil−waste vegetable oil mixture.
2.4 HYDROGEN PRODUCTION FROM GLYCEROL BIOMASS
Most of hydrogen on our planet is found as atoms participating in the formation of
different molecules such as water, fossil fuels, organic and inorganic materials. The
process of hydrogen production includes both extracting and isolating hydrogen
molecules to a desired level of purity (Sørensen, 2012). As mentioned earlier, hydrogen
can be produced through different processes either from conventional fossil fuel sources
such as natural gas and Coal, or alternative sources such as biomass, wind, nuclear, solar
and others. An economical analysis by Bartels et al. (2010) showed that the hydrogen
production from natural gas and coal is currently the most economical. However, this will
not be the case in the near future with the expected technological progress in utilising

20
new alternative sources. Due to this fact and the thorough contributions to the sustainable
world energy plan, renewable hydrogen from biomass is becoming a portentous fuel to
supply future energy demands. Considering the large agricultural countries, such as
United States and Germany, hydrogen generation from biomass comes in series with
agricultural activities in order to supply energy demands from one side, and to reform
organic wastes and undesired by-products from the other; and thus enhancing the
efficiency of clean renewable energy by completing the loop of sustainability from both
economical and environmental sides (Kotay and Das, 2007).
2.4.1 STEAM REFORMING
Steam reforming of glycerol is a highly endothermic reaction that produces 7
moles of H2 per 1 mole of glycerol decomposed according to the stiochiometric ratio.
Over certain catalysts, glycerol can react with steam to produce hydrogen and carbon
dioxide according to reaction 2.1.
C3H8O3 (g) + 3 H2O → 7H2 (g) + 3 CO2 (g) Δ = +123 KJ/mol (Adhikari et. al,
2007) (2.1)
Using a commercial Nickel-based catalyst, Czernik et al. (2002) was able to
reform crude glycerol and generate hydrogen via steam reforming technique. Even
though the process had not been optimized by that time, their results were very promising
with 77% hydrogen production yield.
Adhikari et al. (2006) conducted a thermodynamic analysis on steam reforming of
glycerol and found that operating conditions such as atmospheric pressure, temperature >
900 K and steam to glycerol ratio of 9:1 are the optimum in terms of hydrogen production

21
and coke and methane formation. In line with that, Chen et al. (2012) presented an
extensive work that included results of both thermodynamic analysis and pilot-scale
experiments. A fair agreement between thermodynamic results and experimental data
was found for different operating parameters such as: temperature, pressure, Steam-to-
glycerol, inert gas-to-glycerol and residence time. The study reported an optimum water-
to-glycerol ratio of 9.0 for hydrogen production at high temperature and low pressure.
Several catalysts such as; Ni, Co, Ir, Ru, Pt and Rh have been tested for their
capabilities of promoting the process of hydrogen production via glycerol steam
reforming. Slinn et al. (2008) studied the ability of using Pt-based catalyst supported on
Al2O3 for glycerol steam reforming. The optimum reforming temperature was found to be
880°C at 0.12 mol glycerol/ min per kg catalyst and with steam/carbon ratio of 2.5. In a
follow up, Pompeo et al. (2010) tested the performance of platinum catalyst impregnated
over ZrO2, SiO2, γ-Al2O3 and α-Al2O3 supports and proved that the acidity of support
increases the rate of coke formation and thus catalyst deactivation. A comparative study
by Zhang et al. (2007) showed a superior performance for the Ir/CeO2 catalyst compared
to Cobalt and Nickel ones. The study reported a complete glycerol conversion with
hydrogen selectivity of more than 85% at a relatively low temperature of 400°C. The
performance of Nickel catalyst supported on MgO, TiO2 and CeO2 was investigated by
Adhikari et al. (2007). Ni/CeO2 mixture was found to give the best results with a
hydrogen selectivity of 74.7% and glycerol conversion up to 99% at 600°C and steam to
glycerol ratio of 12:1.
According to Buffoni et al. (2009), Ni-based catalysts are very active and
selective in the process of glycerol steam reforming; the study suggested a minimum

22
reforming temperature of 550°C and a Ceα support based on hydrogen selectivity and
catalyst stability performance. In addition, the catalytic activity of Nickel supported on
CeO2, Al2O3 and CeO2-promoted Al2O3 was investigated by Iriondo et al. (2010). This
work reported a poor performance for pure ceria support compared to the conventional
and modified alumina ones that showed high conversion and stability results, possibly
due to the low amount of nickel deposits on pure ceria.
Using Ruthenium catalysts, steam reforming of crude glycerol was studied by
Hirai et al. (2005); based on their results, steam reforming of glycerol at 600°C is optimal
with 3 wt% of ruthenium impregnated over Y2O3. Again, magnesia showed poor glycerol
conversion and hydrogen selectivity results compared with yttria and zirconia supported
catalysts.
2.4.2 PARTIAL OXIDATION
Oxidation chemically means the reaction of any material with oxygen; the partial
term accounts for the smaller than stoichiometric amount of oxygen fed to the reformer
compared with the full oxidation. Partial oxidation and auto-thermal reforming are more
practical techniques for real reformers compared with steam reforming, due to energy
efficiency and processor simplicity considerations (Ahmed and Krumpelt, 2001). A
review on hydrogen production techniques from glycerol by Adhikari et al. (2009)
suggested further research work on crude glycerol partial oxidation and at supercritical
steam reforming conditions. Catalyst deactivation was pointed out to be the main
challenge in the process of crude glycerol reforming, because of the considerable amount
of impurities in the crude waste generated at biodiesel plants.

23
In order to identify partial oxidation as a practical technique for hydrogen
production from glycerol reforming, the first need was to investigate the effects of
different process parameters, establish reaction regions and then see how efficient the
process could be under different conditions. In line with that, a thermodynamic analysis
on glycerol partial oxidation was conducted by Wenju (2010) to determine the effects of
different operating variables on process performance and establish regions for coke
formation and optimum conditions. Based on Gibbs free energy minimization method,
the effects of temperature, pressure, oxygen to glycerol and nitrogen to glycerol ratios on
glycerol partial oxidation reactions were assessed. The optimum conditions for hydrogen
production were found to be: 727-827°C temperature, 1.0 atmosphere pressure, and 0.4-
0.6 O2/C3H8O3 molar ratio. Besides that, low temperatures and low O2/C3H8O3 ratios
were favourable for carbon formation and thus catalyst deactivation; and even though the
influence of inert gases on hydrogen yield was positive, the author recommended
avoiding it in practical applications. In addition, Wenju established the regions of
temperature, pressure and O2/C3H8O3 molar ratio where partial oxidation reactions of
glycerol can thermodynamically occur.
2.4.3 AUTO-THERMAL REFORMING
Swami and Abraham (2006) examined the performance of auto-thermal reforming of
glycerol over Nickel, Palladium, Copper and Potassium catalysts in temperature range of
550-850°C. The results obtained from ATR process revealed higher hydrogen production
rates and lower coke formation over the surface of catalyst than that of steam reforming.
In line with this work, auto-thermal reforming of glycerol over Rhodium catalysts was
studied by Dauenhauer et al. (2006); a high reforming temperature of 862°C; S/C ratio of

24
4.5 and C/O ratio of 0.9 were reported as the optimum operating conditions to completely
convert glycerol and reach 79% hydrogen selectivity. In addition, their study
demonstrated that undesirable products formation such as CO and CH4 has been
suppressed to a selectivity of less than 2% under optimum conditions.
In a different case, Luo et al. (2007) studied the thermodynamics of glycerol auto-
thermal reforming as a combination of oxidation and aqueous steam reforming in a
temperature range of 300-500 K. Methanation reactions were promoted in the tested
regions leading to a dramatic drop in the yield of hydrogen production. In addition, CO
formation was mostly controlled by reaction temperature, while H2 production was
mostly affected by oxygen to glycerol ratio with a gas product mainly composed of CO2
and CH4 under the tested conditions.
Vaidya and Rodrigues (2009) presented an extensive review on glycerol reforming
and the techniques employed for this purpose. A particular attention was given to CeO2
and MgO supports for their stability in practical reforming tasks compared with Al2O3
that showed quick deactivation due to dehydration. Further investigation on the effects of
promoter elements, particle size and metallic loadings was recommended, and a serious
gap in literature related to the kinetics of glycerol reforming has been reported.
In consonance with these recommendations, Kamonsuangkasem et al. (2011) tested
the performance of Ni/Al2O3 promoted with CeO2-ZrO2 catalyst in the oxidative steam
reforming process using yellow and crude glycerol feedstock at 923 K, water to glycerol
ratio of 9.0 and oxygen to glycerol ratio of 0.5. In spite of the promising results obtained
from yellow glycerol, crude glycerol from biodiesel plants was reported as a poor

25
feedstock for hydrogen production under these conditions due to catalyst deactivation;
applying a set of proper operating conditions or pre-treatment steps were recommended
for further investigation. The enhanced performance of AL2O3 promoted carrier
compared to pure one has been linked to both, the oxidative reforming reactions and
CeO2-ZrO2 promoter that probably reduced coke precipitation.
Rennard et al. (2009) studied the efficiency of glycerol reforming via autothermal
steam technique using Rh-cerium and Platinum catalysts. According to the results of Rh-
Ce catalyst, hydrogen yield can be increased by feeding more steam to the system up to
steam/carbon value of 2/3, the ratio that amends water gas shift reaction within the
reformer without suppressing the main reforming reaction. The study reported a
significant loss in mechanical stability for Rhodium catalysts due to obscure reasons. In
addition, the production of different non-equilibrium components such as acrolein,
hydroxyacetone and acetaldehyde was observed by using platinum catalysts.
According to [Authayanun et al. 2010; Wang et al. 2009; Vaidya & Rodrigues, 2009], the
main reactions expected to take place inside the autothermal reformer of crude glycerol
are:
Partial oxidation of glycerol
C3H8O3 + 2O2 ⇄ 3CO + 4H2O (2.2)
Partial oxidation of methanol
CH3OH + O2 ⇄ CO + 2H2O (2.3)
Steam reforming of glycerol

26
C3H8O3 + 3H2O ⇄ 3CO2 + 7H2 (2.4)
Steam reforming of methanol
CH3OH + H2O ⇄ CO2 + 3H2 (2.5)
Water gas shift reaction
CO + H2O ⇄ CO2 + H2 (2.6)
Dry reforming of methane
CH4 + CO2 ⇄ 2H2 + 2CO (2.7)
Steam reforming of methane
CH4 + H2O ⇄ 3H2 + CO (2.8)
Decomposition of methanol
CH3OH ⇄ CO + 2H2 (2.9)
Methanation Reactions
CO + 3H2 ⇄ CH4 + H2O (2.10)
CO2 + 3H2 ⇄ CH4 + 2H2O (2.11)
Based on Gibbs free energy minimization technique, Wang et al. (2009) studied the
thermodynamics of autothermal reforming of pure glycerol in a temperature range of
(700-1000 K), (1-12) for S/G molar ratio and (0-3) for O/G molar ratio. Glycerol overall
autothermal reforming reaction was expressed as: C3H8O3 + aO2 + bH2O → cCO + dCO2

27
+eH2 + fCH4. In order to maximize hydrogen yield and minimize the formation of
undesired products such as CO2, CO, CH4 and C species inside the reformer,
CHEMCAD-5 software was used to simulate the process and thermodynamically
establish the proper operating regions. Results for optimum temperature, steam/glycerol
and oxygen/glycerol molar ratios were reported as 627-727°C, 9-12, 0.0-0.4,
respectively. By investigating the thermodynamics of glycerol autothermal reforming for
hydrogen production, this study emphasized on the capability and feasibility of the
process and suggested more experimental work for further comprehension.
Directing research towards a more pragmatic route, Authayanun et al. (2010)
conducted a thermodynamic analysis on crude glycerol autothermal reforming using
HYSYS software. Free glycerol and methanol were considered to mainly compose crude
glycerol. Taking into account steam and oxidation reactions of both components beside
the possibility of methanation, methane dry reforming and water-gas shift reactions,
different profiles for process parameters were thermodynamically achieved at
atmospheric pressure. As expected, hydrogen yield increased with temperature and steam
to glycerol ratio, while an opposite trend was exhibited with oxygen to glycerol ratio, and
since the hydrogen capacity of methanol reforming is lower than that of glycerol, pure
glycerol showed a more favourable performance compared to the crude one, with a direct
dependency on the fraction of methanol in the crude glycerol.
Working in a pressure range of 200-300 atm this time, Ortiz et al. (2011) investigated
the thermodynamics of glycerol autothermal reforming at supercritical water conditions
for pure and “pre-treated” glycerol. Pre-treated glycerol was simply identified as 80% by
weight glycerol with the balance methanol. Using AspenPlusTM
software and again Gibbs
28
free energy minimization method, the optimum parameters for highest hydrogen yield
(88.4%) were obtained at: temperature of 900°C, pressure of 240 atm, water-to-glycerol
ratio of 99, oxygen-to-glycerol ratio of 0.41 and with a pure glycerol feed. Although the
increase in steam-to-glycerol ratio enhanced hydrogen yield, it also decreased hydrogen
molar flow rate due to the low concentration of glycerol in the feed and thus decreased
the overall production efficiency. To overcome this limitation and avoid the need of
external heat supply, thermoneutral conditions were established at different reforming
temperatures and water-to-glycerol ratios by finding out the amount of oxygen required
to internally produce this energy. Oxygen flow needed to achieve thermoneutral
conditions increased with water-to-glycerol ratio up to a maximum value of 0.407 at
800°C reaction temperature and 99 water-to-glycerol ratio.
In a follow up work by the same group and again with the aid of AspenPlusTM
, Ortiz
et al. (2012) conducted an energy integration and exergy analysis on the process of
autothermal reforming of glycerol using supercritical steam at 240 atm pressure. Initially,
the optimum conditions for hydrogen generation from a previous study (temperature of
900°C, pressure of 240 atm, water-to-glycerol ratio of 99, oxygen-to-glycerol ratio of
0.41) were implemented to simulate the process. Simulation results showed a significant
energy shortage and eventually a non-feasible process at these conditions; so adding the
heat generated from burning effluent gas in a separate combustor was the modification to
improve energy efficiency and take the process to a workable zone at lower reforming
temperatures. The counter trends of hydrogen yield and the combined efficiency (thermal
and exergy) at high reforming temperatures suggested a preheating temperature of less
than 500°C and a reforming temperature of not more than 800°C.

29
Yang et al. (2011) also carried out a thermodynamic analysis on pure glycerol
autothermal reforming using AspenPlusTM
for operating parameters varied within the
ranges of 0.5-8.0 for steam/carbon ratio, 0.5-3.0 for carbon/oxygen ratio and 400-850°C
for reforming temperature. Based on hydrogen yield and process feasibility, the optimum
ranges of carbon-to-oxygen ratio and reaction temperature were found out to go from 0.8
to 1.2 and 600 to 700°C, respectively. A steam-to carbon ratio of less than 3.0 was
recommended based on the fact that more energy consumption and less hydrogen
production will be caused by diluting glycerol feed, and consequently this might result in
a non-efficient process. The study suggested developing a new catalyst that can handle
ATR operations and avoid kinetic limitations in the presence of metal ions and bigger
biomass molecules within the crude glycerol feed.
2.4.4 HYDROGEN PEROXIDE REFORMING
This reforming technique is basically the reaction of biomass with hydrogen
peroxide to produce hydrogen and some other side products as reported by Luo et al.
(2007):
C3H8O3 + 1.5 H2O2 = 3CO2 + 5.5H2 (2.12)
In contrast with the upper mentioned techniques, hydrogen peroxide reforming has not
been an attractive method for research in the field of hydrogen generation from biomass,
and this is obvious from the very few publications in this regard. Based on the
thermodynamics of three reforming techniques, Luo et al. (2007) compared the
performance of water aqueous reforming, aqueous hydrogen peroxide reforming and

30
autothermal reforming. Hydrogen peroxide reforming showed the lowest capability for
hydrogen generation compared to the other two methods.
2.4.5 DRY REFORMING
Virtually, carbon dioxide reforming or dry reforming is the case when CO2 reacts
with glycerol to produce a mixture of carbon monoxide and hydrogen known as syngas.
Wang et al. (2009) utilised the power of Matlab software to perform a thermodynamic
study over ranges: temperature 327-727°C, pressure 1-5 atm, and CO2-to-glycerol ratio 0-
5. The results showed depletion in hydrogen yield with increasing the CO2 feed to the
reactor, while an opposite behaviour was reported for syngas. The maximum yield for
synthesis gas formation, 6.4 moles of syngas per mole of glycerol, was obtained at 1000
K with CGR of 1.
2.4.6 DRY AUTOTHERMAL REFORMING
As a combination of partial oxidation and dry CO2-reforming reactions, dry
autothermal reforming of glycerol has been studied by Kale and Kulkarni (2010) to
investigate the capability of employing this technique in the area of hydrogen and syngas
production. With the aid of HSE Chemistry software, a thermodynamic analysis was
conducted on the dry autothermal reforming of glycerol in a temperature range of 600-
100 K, oxygen-to-glycerol carbon “OCGR” of 0.1-0.5, CO2-to-glycerol “CGR” of 1-5
and at ambient pressure. T=926.31 K, P= 1bar, OCGR= 0.3 and CGR= 1 was determined
as the optimum thermoneutral operating conditions for DATR of glycerol. Maximum
capacity of hydrogen yield (2.88 mol of H2/mol of glycerol) was thermodynamically

31
obtained at T= 950 K, OCGR= 0.1 and CGR=1. The process was found to be more
feasible for syngas production with an ability to be utilised for hydrogen production.
2.4.7 AQUEOUS PHASE REFORMING
Many studies have been conducted on the aqueous phase reforming of glycerol
for hydrogen production [Shabaker et al. 2004; Wawrzetz et al. 2010; King et al. 2010;
Wen et al. 2008]. Davda et al. (2005) showed that aqueous phase reforming of biomass
such as glycerol or ethanol can play a promising role in hydrogen production in case of
developing proper catalysts and optimising the operating conditions. Lehnert & Claus
(2008) studied the aqueous reforming of glycerol over Platinum catalysts; after applying
different catalyst pre-treatments, the conversion glycerol was observed to stay around a
value of 20% with a significant increase in hydrogen selectivity to 95%. The premium
performance of MgO and ZrO2 supports in prompting Platinum catalyst activity for
hydrogen production via aqueous phase reforming of glycerol has been discovered by
Menezes et al. (2011). The fact of generating many side products in the liquid side by
aqueous phase reforming of glycerol makes the process more favourable for liquid target
products. Co-products such as methanol, ethanol, acetone, acetic acid, propanal 2-3
dihydroxyl, diglycerol and propylene glycol has been detected by Luo et al. (2008) and a
maximum of 42% carbon conversion was determined based on gas phase carbon; the fact
that confirms the formation of more liquid side by-products in the process.

32
2.5 KINETICS OF GLYCEROL REFORMING
In order to investigate the different effects of operating parameters on the rate of
glycerol reforming and hydrogen production, many scholars have studied the kinetics of
the corresponding reforming reactions. A kinetics analysis on glycerol aqueous
decomposition over bimetallic Pt-Re/C catalysts to produce synthesis gas has been
carried out by Kunkes et al. (2008). The study revealed the positive effect of integrating
Re catalyst into Pt supported on carbon carrier through increasing the value of turnover
frequency for synthesis gas production. Although the values of turnover frequencies for
H2, CO and CO2 production were reported based on the outlet gas composition and
number of active sites, the study did not generate a mathematical model to describe the
rate of glycerol reforming and its dependency on the major operating conditions.
On the other hand, the kinetics of crude glycerol pyrolysis was investigated by
Dou et al. (2009). According to results from thermogravimetric experiments, four distinct
phases in the thermal decomposition of crude glycerol were detected at 5 K/min heating
rate. During the first Phase of pyrolysis between 322 and 343 K, mass loss of about 10-
15% was observed due to the evaporation of water and methanol present in crude
glycerol. The main weight loss (67-69%) occurred during the second phase (322-440 K)
due to the removal of more than 95% of free glycerol, and liquid nitrate esters. The third
phase of crude glycerol pyrolysis (501-774 K) has been attributed to the decomposition
of fatty acids methyl esters and a small part of leftover free glycerol, and this contributed
to about 10.2-12.7 wt% loss. The fourth phase was found to go between 760 and 1123 K
in which less than 5.8% weight loss has been observed with less than 4.5 wt% residue at
the end. The activation energies and frequency factors of the four phases at four different
33
heating rates were reported by the study; as expected relatively low activation energies
were determined for phases 1&2 compared with phases 3&4.
The kinetics of glycerol steam reforming over Ni/CeO2 catalysts was studied by
Adhikari et al. (2009). A power law model of the form -ra=k0exp(-E/RT)[CA]n has been
fitted to illustrate the change of reaction rate with reforming temperature and glycerol
concentration. With the aid of SAS 9.1 software and the non-linear regression technique,
the activation energy and reaction order were determined as 103.4kJ/mol and 0.233,
respectively. The results showed a fair agreement between experimental and predicted
conversions with an average absolute deviation of about 6.7%. In line with this work,
Sutar et al. (2010) investigated the kinetics of glycerol steam reforming over Pt/C catalyst
in a temperature range between 623 and 673 K. The intrinsic kinetic data was again
collected in a fixed bed reactor by varying inlet flow (space velocity) and temperature
values. The reaction was found to have an order of one with respect to glycerol with a
good comparison between experimental and predicted conversions. In addition, Cheng et
al. (2010) studied the kinetics of glycerol steam reforming over a bimetallic Co-Ni
supported on alumina catalyst in a reaction temperature range between 773 and 823 K. A
power law model of the form –rGSR=Aexp(-EA/RT)[Pglycerol]β[Psteam]
γ was proposed to
describe the change in rate of glycerol steam reforming over the studied ranges. The
results of data regression demonstrated a reaction order of 0.36 with respect to steam and
0.25 with respect to glycerol with activation energy of 63.3 kJ/mol.

34
2.6 STATISTICAL APPROACHES
In many cases, statistics could be an effective tool to analyse, optimise and
interpret the behaviours of different variables in a chemical process. A statistical
approach to investigate the effects and interactions of different operating factors on
glycerol auto-thermal reforming process using nickel-based catalysts was conducted by
Douette et al. (2007). Using a fixed bed reactor, Douette et al. (2007) studied the effects
of different operating variables on process performance. Although a strong interaction
between reaction temperature and O/C ratio was revealed to significantly contribute to
the overall performance of ATR process, oxygen to carbon ratio was reported as the most
effective factor on conversion and H2 yield. Catalyst deactivation and coke formation was
observed after feeding crude glycerin obtained from biodiesel plants; this was again
interpreted by the high contaminants present in crude glycerin.
Recently, hydrogen and ethanol production from glycerol was investigated by
Varrone et al. (2012) in a biological reforming system. The authors utilised the power of
statistics and specifically design of experiments (DOE) section to optimize the process of
glycerol microbial fermentation. A stable fermentation conditions have been statistically
reached with an optimum ethanol capacity of 1 mol C2H5OH/ mol glycerol combined
with a hydrogen yield of 0.96 mol H2/ mol glycerol.
In a very recent study by Saha et al. (2014), the effects of introducing cobalt,
impregnating methods and promoting elements were statistically studied to better
understand the significance of these factors in enhancing the catalytic activity. According
to the results obtained from the analysis of variability (ANOVA), MgO and ZrO2

35
promoter elements, reverse impregnation and cobalt addition enhance the performance of
catalyst by modifying its textural properties to be more resistive to sulfur and more
suitable for heterogeneous catalysis. A comprehensive structure-activity analysis was
conducted to explain the impacts of these controlled variables on the activity of catalyst,
and a linear model to correlate catalysts’ textural properties to conversion has been
developed as follows: Conversion= 407.27 – 1.76 BET SA -13.76 PV/PS + 13.9 M SA –
16.46 M dispersion – 43.36 Ni Reducibility. In addition, a Pareto chart was constructed to
distinctly quantify the effects of these properties and as a result, nickel dispersion was
found to mostly contribute to catalyst performance.
2.7 CATALYSTS FOR GLYCEROL REFORMING
Catalyst is a substance that speeds up the rate of a chemical reaction without
being consumed itself. The accelerated rate of catalyzed reactions is due to the higher
contact frequency between reactants involved in the rate-limiting step (slowest step), and
this will consequently reduce the activation energy making the reaction easier to take
place (McNaught & Wilkinson, 1997). In general, catalysts can be classified into two
main categories; homogenous where the catalyst and reactants have the same phase and
heterogeneous where the phases are different.
Several metal-based catalysts have been used to promote glycerol reforming and
increase hydrogen productivity such as Ruthenium, Nickel, Rhodium, Cobalt, Platinum
and Iridium. The efficiency of Nobel-metal catalysts such as Ru, Rh, Ir and Pt in glycerol
reforming to produce hydrogen has been widely investigated [Pompeo et al., 2010;
Dauenhauer et al., 2006; Rennard et al., 2009; Slinn et al., 2008; Kunkes et al., 2008;

36
Zhang et al., 2007; Hirai et al., 2005]. On the other hand, base-metal catalysts such as
Nickel and Cobalt showed very promising results in glycerol reforming [Czernik et al.,
2002; Adhikari et al., 2007; Adhikari et al., 2008; Iriondo et al., 2010; Swami and
Abraham, 2006; Doette et al., 2007]. According to Iriondo et al. (2009), Nickel supported
on modified γ-Al2O3 revealed a superior catalytic activity compared to Platinum
supported on the same carrier in steam reforming of glycerol. In line with this
observation, Nickel supported on modified cerium was strongly recommended by
Buffoni et al. (2009) for glycerol steam reforming operations due to its activity, stability
and high selectivity. In addition, a study by Kamonsuangkasem et al. (2011) emphasized
on the stability of Ni/CeO2-ZrO2/Al2O3 catalyst in glycerol oxidative steam reforming
process. Moreover, Nickel catalyst and CeO2 based supports were recommended by
Vaidya and Rodrigues (2009) for hydrogen production from biodiesel by-product
glycerol.
Nickel catalyst over Ce-Zr mixed oxide support promoted with La, Ca, Mg, Gd
and Y elements was studied by Sengupta (2011) in order to investigate its efficiency in
hydrogen production from hydrocarbons. The results showed high thermal stability, low
coke formation and promising hydrogen yields. In a follow up study by same research
group, auto-thermal reforming of pure glycerol using nickel supported over CeZrM
catalysts was investigated by Sabri (2013) in a packed bed tubular reactor to
experimentally establish the optimum reforming regions. Based on her results, the
optimum conditions for nickel loading and surfactant-to-metal ratio were reported as 5
wt% and 0.5, respectively. Gadolinium was found to best perform as a promoter element
for pure glycerol reforming.

37
Chapter 3
EXPERIMENTAL SECTION
This chapter includes the procedures, chemicals, equipments and gases used to
carry out the experimental work and collect the required data for this research. Besides
experimental setup and design of experiments (DOE) parts, more details about the
methods of catalyst preparation, characterization and performance evaluation will also be
given.
3.1 SAFETY PRECAUTIONS
Adequate precautions have been taken to ensure a safe and healthy work
environment while conducting our experiments. As a strict perquisite to a vigorous
performance in the laboratories of the Process Engineering Department; all students,
researchers and employees must fully adhere to the following terms in the workplace;
otherwise penalty and/or dismissal steps will be taken.
1. Proper lab training, safety exams and safety orientation sessions such as WHIMS,
Chemical and Laboratory Safety Training, H2S Training and Radiation Safety
Training were completed prior to acquiring the access to the laboratories.
2. Personnel Protective Equipments (PPE) such as safety goggles, lab coats, gloves
and closed shoes were used inside the laboratories regardless if the person is
running an experiment or not.
3. Volatile toxic chemicals such as Ammonium Hydroxide utilized for catalyst
preparation were always handled in the fume hood.
4. All chemicals were labeled and stored properly.

38
5. Flammable chemicals in particular were stored in the designated cabinets of the
storage rooms.
6. Chemical Wastes generated during catalysts synthesis were stored, labeled and
disposed appropriately.
7. Carbon Monoxide (CO) and Hydrogen Sulfide (H2S) detectors were installed in
the labs where cylinders containing these gases were present.
8. Gas cylinders were transported and stored rightly. All cylinders were secured to a
wall or bench and capped well when not in use.
9. Neat and clean workplace was always ensured to keep a motivating healthy
working atmosphere.
3.2 CATALYST PREPARATION
3.2.1 Chemicals Used
1. Nickel (II) nitrate hexahydrate, Ni(NO3)2.6H2O, 99.99%; Sigma Aldrich
2. Zirconium (IV) oxynitrate hydrate, ZrO(NO3)2.xH2O, 99.99%; Sigma Aldrich
3. Cerium (III) nitrate hexahydrate, Ce(NO3)2.6H2O, 99%; Sigma Aldrich
4. Calcium (II) nitrate tetrahydrate, Ca(NO3)2.4H2O, 99%; Sigma Aldrich
5. Gadolinium (III) nitrate hydrate, Gd(NO3)3.xH2O, 99.99%; Alfa Aesar
6. Magnesium nitrate, Mg(NO3)2.6H2O, 98%; Sigma Aldrich
7. Ammonium hydroxide reagent ACS-Pure; (28-30% w/w); BDH Chemicals
8. Hexadecyltrimethylammonium bromide (CTAB), C19H42NBr; Sigma Aldrich
3.2.2 Equipment Utilized
1. Isotemp Muffle furnace, Model 550-126, Fisher Scientific Company

39
2. Hydraulic Press, model 3912, Carver
3. Weighing Balance, PB8001-S, MonoBloc
4. Magnetic Stirrer Hot Plate, Gyratherm II a, VWR Scientific Inc.
5. U.S.A standard test sieve, ASTM, E-11 standards, Fisher Scientific
3.2.3 Support Preparation
With the aid of Surfactant-Assisted method, the ternary oxide supports utilized in
this study were prepared under basic conditions to nominally have a composition of
Ce0.5Zr0.33M0.17, where M is the promoter element. Three different promoter elements
were tested in this study: calcium, gadolinium and magnesium (Ca, Mg and Gd). The
selection of the support was based on the experimental screening results obtained from a
pure glycerol study by our group (Sabri, 2013). In this study, cerium-zirconium based
supports promoted with gadolinium, calcium and magnesium elements showed promising
results in the process of pure glycerol autothermal reforming. The reasons behind the
enhanced performance of the promoted Ce-Zr supports have been discussed by Ibrahim
and Idem (2008).
As a rule, nitrates precursors (Ce, Zr and M) with prearranged loads were firstly
dissolved in separate beakers, each containing 500 ml of deionized (DI) water. Rigorous
stirring was applied to facilitate the diffusion of these salts into the aqueous face. In the
meantime, a predetermined amount of the surfactant (CTAB) was also dissolved in 1000
ml of deionized (DI) contained in a separate beaker heated to ~60°C and under a rigorous
stirring too. After that, the contents of the four beakers were mixed together to obtain a
2500 ml resultant solution. The measured weights of nitrate precursors and surfactant

40
were determined according to Ce0.5Zr0.33M0.17 nominal composition and 0.5 surfactant-to-
metal ratio [CTAB]/[Ce+Zr+M], respectively. Aqueous ammonium hydroxide (28-30%
w/w) was then added gradually to increase the pH of the mixture to ~11.8. The big beaker
containing the resultant solution was also maintained under continuous stirring while the
addition of 50 ml of NH4OH solution was taking place every 5 minutes. The pH of the
solution was measured repeatedly using standard pH papers. After reaching the desired
pH (~11.8), the mixture was left for about 20 min to clearly see yellowish gelatinous
slurry precipitated at the bottom. Then the mixture was transferred to Pyrex glass bottles
and aged in an oven at 90°C and atmospheric pressure for 5 days. After five days, the
bottles were taken out of the oven and left in a fume hood overnight to slowly cool down.
On the next day, the precipitated material was collected by filtering the mixture using 2
filter papers [125 mm diameter, #2, Whatman], and then rinsed with warm deionized
water to wash out any leftover surfactant and nitrates. After that, the retained solid was
dried out in the oven for 12 hours at 120°C. The collected dry material was then crushed
and collected in special ceramic crucible to be calcined at 650°C for another 3 hours. The
aim of calcination was to remove the remaining surfactant and nitrates; and thus to obtain
a support composed of free metal oxides. Indeed, similar preparation procedures were
followed by other studies in our group [Oluku, 2013; Sengupta, 2011; Sukonket et al.,
2011]. Next steps were to collect the prepared supports, impregnate the active metal
(Nickel), investigate their physical and chemical properties via several characterization
techniques and finally screen their performance in a PBTR for their catalytic efficiencies
in the autothermal reforming process.
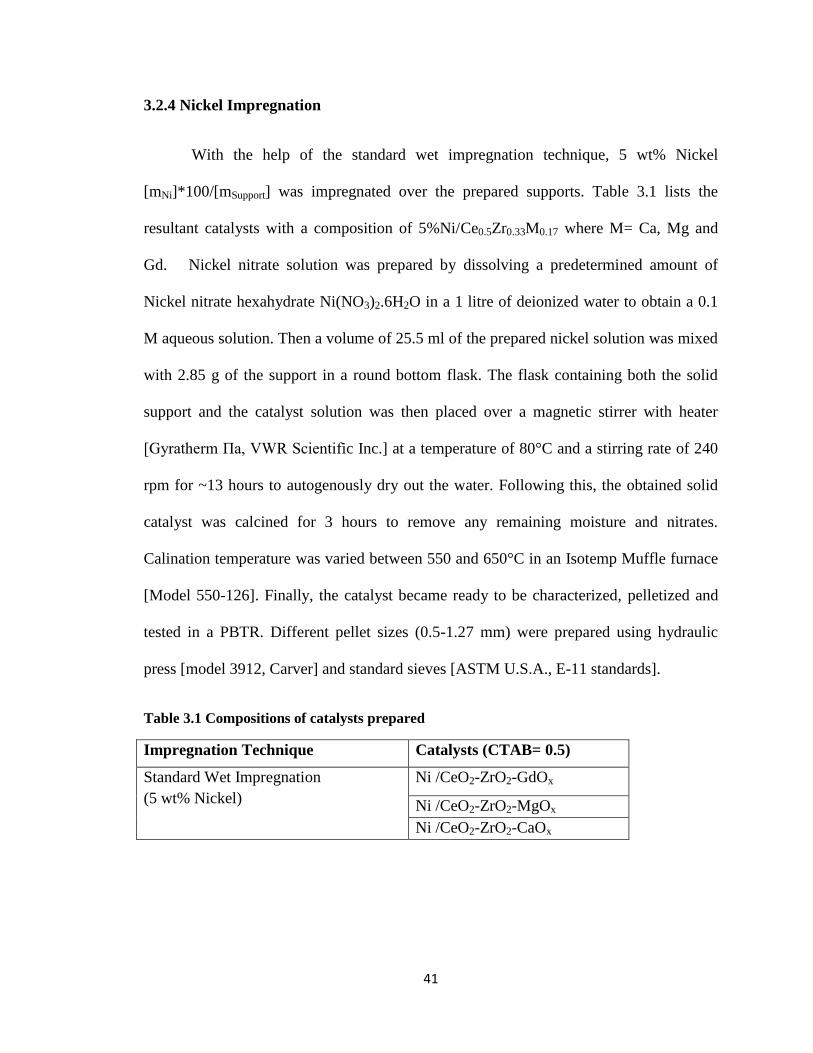
41
3.2.4 Nickel Impregnation
With the help of the standard wet impregnation technique, 5 wt% Nickel
[mNi]*100/[mSupport] was impregnated over the prepared supports. Table 3.1 lists the
resultant catalysts with a composition of 5%Ni/Ce0.5Zr0.33M0.17 where M= Ca, Mg and
Gd. Nickel nitrate solution was prepared by dissolving a predetermined amount of
Nickel nitrate hexahydrate Ni(NO3)2.6H2O in a 1 litre of deionized water to obtain a 0.1
M aqueous solution. Then a volume of 25.5 ml of the prepared nickel solution was mixed
with 2.85 g of the support in a round bottom flask. The flask containing both the solid
support and the catalyst solution was then placed over a magnetic stirrer with heater
[Gyratherm Πa, VWR Scientific Inc.] at a temperature of 80°C and a stirring rate of 240
rpm for ~13 hours to autogenously dry out the water. Following this, the obtained solid
catalyst was calcined for 3 hours to remove any remaining moisture and nitrates.
Calination temperature was varied between 550 and 650°C in an Isotemp Muffle furnace
[Model 550-126]. Finally, the catalyst became ready to be characterized, pelletized and
tested in a PBTR. Different pellet sizes (0.5-1.27 mm) were prepared using hydraulic
press [model 3912, Carver] and standard sieves [ASTM U.S.A., E-11 standards].
Table 3.1 Compositions of catalysts prepared
Impregnation Technique Catalysts (CTAB= 0.5)
Standard Wet Impregnation
(5 wt% Nickel)
Ni /CeO2-ZrO2-GdOx
Ni /CeO2-ZrO2-MgOx
Ni /CeO2-ZrO2-CaOx
42
3.3 CATALYST CHARACTERIZATION
In order to understand the relation between the characteristics of the prepared
catalysts and their behaviours in the process, fresh supports and catalysts were
characterized for their physical and chemical properties. Spent catalysts were also
characterized to investigate the effects of different operating parameters on catalysts’
properties. The catalytic activity was then statistically correlated to the structural and
chemical properties based on the observed performance from the screening experiments.
3.3.1 Thermogravimetry Analysis (TGA)
Thermogravimetric analysis was conducted on fresh catalysts to determine the
calcination temperature. The uncalcined catalysts were subjected to a programmed
temperature increase under inert gas (N2) flow at atmospheric pressure to study the
weight loss and the rate of weight change due to the thermal removal of moisture,
surfactant and nitrates. TGA runs were performed using Shimadzu TGA-50 instrument
connected to a flow controller FC-60A.The applied temperature on the fresh catalyst
samples was 800°C controlled from TA-60WS Collection software. The flow of nitrogen
was adjusted at 50 ml/min from the FC-60A flow controller. The heating rate was set up
at 10°C/min. The cooling of the furnace assembly was done after each run using an
external fan (BLW-50, Shimadzu) purchased alongside with TGA-50 instrument.

43
3.3.2 N2 Physisorption (BET)
N2 physisorption technique was applied to investigate some structural properties
such as BET surface area, pore volume, pore size and pore size distribution of the
prepared supports and catalysts. The analysis was carried out under pure nitrogen flow
(99.99% pure N2; Praxair) using ASAP-2010 apparatus from Micromeritics Instruments
Inc. The amount of catalyst used in each run was about 0.25 g. The samples were first
degassed for about 4 hours at a temperature of 180°C to get rid of the adsorbed moisture
on the surface that can negatively affect the overall analysis and yield inaccurate results.
The isotherms of adsorption and desorption phases of nitrogen on the surface of the
catalyst samples were established at a temperature of -195°C using liquid nitrogen. The
previous mentioned properties related to BET area and porosity were determined based
on these isotherms.
3.3.3 Temperature Programmed Oxidation (TPO)
In order to determine the amount of carbon deposited on the spent catalyst during
the ATR of synthetic crude glycerol, TPO runs were performed using TGA-50
(Shimadzu, Japan) instrument. Catalyst particles were carefully separated from the solid
bulk found inside the PBTR after each screening run. The collected sample was then
oxidized at high temperature to burn the deposited carbon species. The oxidizing gas flow
rate was 50 ml/min (5% O2 balanced with N2; Praxair). The applied heating was
maintained at a constant 10°C/min rate to reach a maximum temperature of 800°C by the
end of the analysis. The coke formed over the surface of the catalyst was quantified by
the weight loss observed between 360 and 600°C. According to Le Minh et al. (1997),

44
formation of CO and CO2 species during TPO analysis on spent catalysts was observed
starting from a temperature around 380°C. In line with this observation, TPO peaks
observed by Nagaoka et al. (2000) for the carbon deposits over spent Pt/ZrO2 and
Pt/Al2O3 catalysts were also obtained between 342 and 567°C. In this work, the major
TPO peak was obtained around 550°C with a small shoulder peak around 400°C, similar
to the curve profiles and temperature ranges obtained also by [Li & Brown (1999); Li &
Brown (2001); Guo et al. (2007)]. The rate of carbon deposition over catalyst surface [mg
C/g cat.h] at different operating parameters was then determined by dividing the obtained
weight of carbon deposits over the weight of the catalyst used at that particular run and
the screening time on stream (6 hours).
3.3.4 Temperature Programmed Reduction (TPR)
The reducibility of the catalyst was determined by the temperature programmed
reduction (TPR) using ChemBET-3000 instrument [Quantachrome, USA] to find out the
optimum reduction temperature required to activate the catalyst before screening its
performance. A catalyst weight of 50 mg was used in each analysis. The sample was
firstly degassed with pure nitrogen flow (UHP 5.0; Praxair) at 180°C for 2 hours. Then,
the sample was moved to the analysis port where a flow of 45 ml/min of the reducing gas
(5% H2 balanced with N2; Praxair) was introduced. The baseline signal of the thermal
conductivity detector (TCD) was then adjusted to zero at ambient temperature. Next, the
temperature of the furnace was raised up to 900°C at a constant heating rate of 15°C/min.
The resultant TPR profiles were plotted by TPRWIN software as the intensity of thermal
conductivity of the effluent gas [mV] versus temperature [°C]. Reducibility was then

45
determined based on the temperature that maximizes the rate of hydrogen consumption
(highest TPR peak).
3.3.5 Powder X-Ray Diffraction Measurements (XRD)
Powder XRD patterns were established using D8 diffractometer (Bruker AXS,
USA) equipped with Ni-Kα radiation source at 40 mA and 40 KV to study the
crystallinity of supports and catalysts and investigate the uniformity of active sites
dispersion over the surface of the carrier material. A 2θ range of 10° - 90° with a step size
of 0.02° and a counting time of 1 second per point was applied to collect the intensity
data. Data from the international centre of Diffraction Data (ICDD) was used as a
reference to identify the crystalline phases. The peaks of nickel were identified by
analyzing a NiO sample and plotting the corresponding profile at the top supports and
catalysts profiles.
3.3.6 Inductively Coupled Plasma-Mass Spectrometry (ICP-MS)
ICP-MS analysis was conducted to quantify the nickel amount incorporated over the
support and obtain the elemental composition of the catalysts. The fundamental idea of
ICP-MS analysis is the ionization of metal atoms at a very high temperature (> 6000°C)
in order to separate them. The ionization part includes the digestion of a sample in a
mixture of specific acids, and then pumping it to a nebulizer in the presence of argon gas.
At the time the dissolved sample reaches the plasma region, the acids will eventually
evaporate and the solid part will break down into atoms and then into ions at the
extremely high plasma temperature. ICP-MS analysis was conducted at the department of
chemistry, University of Regina.

46
3.4 REACTION FEED STOCK
The main reactants in the autothermal reforming process of the current synthetic fuel are:
1. Synthetic Crude Glycerol
2. Steam
3. Oxygen
3.4.1 Synthetic Crude Glycerol Feed
The synthetic crude glycerol utilized in this study was prepared in our lab by mixing
the commonly found chemicals in the commercial crude glycerol generated at biodiesel
plants. In order to investigate the individual effects of crude glycerol components, and to
follow the scientific path of research, a synthetic feed was reformed in this study as the
next step after reforming pure glycerol in a previous study by our group. The next step
after that would be testing crude glycerol mixtures directly obtained from biodiesel
plants. A batch of about 120 ml containing free glycerol, water, methanol, soap, free fatty
acids (FFA) and ashes was prepared prior to each screening run. These are the common
chemicals found in crude glycerol mixtures. An excellent separation of biodiesel was
assumed in the production process so as, glycerol stream does not contain any significant
amounts of methyl esters. This assumption was based on the composition of the crude
glycerol collected from Milligan biofuels, where the weight percentage of fatty acids,
canola oil and methyl esters all together was less than 10 wt%. Potassium hydroxide was
also exempted from the synthetic CG and just ashes of NaCl and KCl were considered.
According to a recent comprehensive study conducted by Hu et al. (2012) on five
different samples of crude glycerol mixtures, sodium and potassium hydroxide salts were

47
not present in the mixtures, but only traces of ashes. The ashes were provided by the
addition of sodium and potassium chlorides (NaCl and KCl) [Ito et al. (2005); Bournay et
al. (2005); Thompson & He (2006)]. The synthetic CG was then prepared by mixing the
individual components in one beaker to yield a mixture with an average molecular
formula of C2.5H7O2 and an average molecular weight of 69.08 g/mol. Average molecular
formula calculations are given in Appendix E. Table 3.2 includes the physical properties
and weight percentages of the below listed chemicals used in synthetic CG preparation.
Glycerol (56-81-5; Sigma Aldrich)
Methanol (67-56-1; Fisher Scientific)
Potassium Palmitate Standard Solution (2624-31-9; Sigma Aldrich)
Oleic Acid (112-80-1; Alfa Aesar)
Potassium Chloride (7447-40-7; Alfa Aesar)
Sodium Chloride (7647-14-5; Alfa Aesar)
Deionized water (ITC labs)
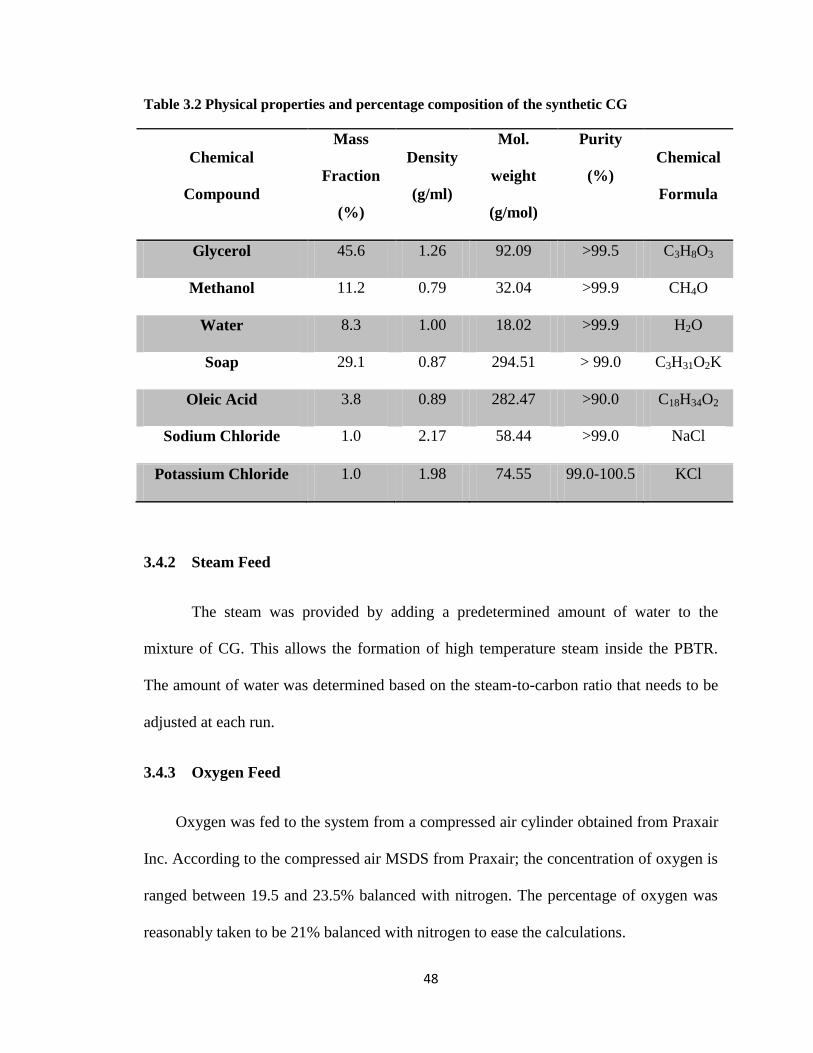
48
Table 3.2 Physical properties and percentage composition of the synthetic CG
Chemical
Compound
Mass
Fraction
(%)
Density
(g/ml)
Mol.
weight
(g/mol)
Purity
(%)
Chemical
Formula
Glycerol 45.6 1.26 92.09 >99.5 C3H8O3
Methanol 11.2 0.79 32.04 >99.9 CH4O
Water 8.3 1.00 18.02 >99.9 H2O
Soap 29.1 0.87 294.51 > 99.0 C3H31O2K
Oleic Acid 3.8 0.89 282.47 >90.0 C18H34O2
Sodium Chloride 1.0 2.17 58.44 >99.0 NaCl
Potassium Chloride 1.0 1.98 74.55 99.0-100.5 KCl
3.4.2 Steam Feed
The steam was provided by adding a predetermined amount of water to the
mixture of CG. This allows the formation of high temperature steam inside the PBTR.
The amount of water was determined based on the steam-to-carbon ratio that needs to be
adjusted at each run.
3.4.3 Oxygen Feed
Oxygen was fed to the system from a compressed air cylinder obtained from Praxair
Inc. According to the compressed air MSDS from Praxair; the concentration of oxygen is
ranged between 19.5 and 23.5% balanced with nitrogen. The percentage of oxygen was
reasonably taken to be 21% balanced with nitrogen to ease the calculations.

49
3.5 PERFROMANCE EVALUATION
Catalytic activity and process performance have been experimentally investigated in
a packed bed tubular reactor at various operating conditions. The effects of the different
components of crude glycerol were first tested by adding them one at a time to the
synthetic feed stock. The varied parameters in this work include the promoter element,
reduction temperature, calcination temperature, particle size, reforming temperature,
steam-to-carbon (S/C) ratio and oxygen-to-carbon ratio (O/C). Besides the extended
period stability run that was conducted for 15 hours time on stream (TOS).
3.5.1 Experimental Setup
The utilized experimental setup was composed of several units as shown in Fig. 3.1.
Packed Bed Tubular Reactor (Inconel 0.5” ID, Homemde at UofR)
Electric Tubular Furnace (ZCP 386, Zesta Engineering Ltd.)
Two K-type thermocouples (1.6 mm x 18", Zesta Engineering Ltd.)
Thermal Mass Flow Controller (DFC26, Aalborg Instruments)
Mass Flow Meter (GFM 17, Aalborg Instruments)
Syringe Pump (100 ml Stainless Steel, KD Scientific)
Gas Chromatograph (GC-TCD, HP 6890, Agilent Technologies)
Pure Nitrogen Cylinder (UHP 5.0,Praxair)
Compressed Air Cylinder (Praxair)
Hydrogen-Nitrogen Cylinder (5% H2-balance N2, Praxair)
Condenser (Water-cooled, Homemade at UofR)
Condensate Collector (Ice-cooled, Homemade at UofR)

50
Figure 3.1 Schematic flow diagram of the experimental setup for synthetic CG autothermal
reforming in a PBTR

51
3.5.2 Catalytic Activity Evaluation
The main target of the experimental part was to optimize the various operating
variables and collect the required intrinsic data for the kinetic study. The components of
crude glycerol were added to the synthetic feed separately to investigate their individual
effects. Three promoter elements were tested (Gd, Mg and Ca). Three calcination
temperatures (550, 600, 650°C) and three reduction temperatures (500, 600, 700°C) were
also applied. Kinetic regions were established by varying particles size (0.55, 0.8, 1.09,
1.27 mm) and carbon flow rate (0.0019, 0.0026, 0.0033 mol C/min). Different catalyst
weights were used (0, 0.05, 0.1, 0.15, 0.2, 0.25 g) at four different reforming
temperatures (500, 550, 600, 650°C). All screening experiments were carried out at
atmospheric pressure.
In order to create a plug flow case and avoid heat and mass transfer limitations,
catalyst bed height (L) and particle diameter (dp) were selected with respect to reactor
diameter (d) so that d/dp≥10 and L/dp≥ 50. This selection was in line with the criteria
followed by [Froment & Bischof (1990); Idem & Bakhshi (1996); Ibrahim & Idem
(2006); Akpan et al. (2007)]. The effect mass diffusion from the bulk to the external
surface of the catalyst was tested by varying the flow rate inside the PBTR. The external
mass transport is strongly influenced by the thickness of the boundary layer that
surrounds the catalyst pellet. The thickness of this layer is inversely proportional to the
mass transfer coefficient and directly proportional to the diffusivity. A low flow velocity
might create a thick boundary layer and thus a small mass transfer coefficient. In this
case, the external mass transfer is the slowest step and the determination of intrinsic
reaction kinetics becomes impossible. On the other hand, catalyst particle diameter was

52
varied to make sure that the internal diffusion is not limiting the rates of reactions and
thus the slowest step is not the internal transfer inside the particles. The effects of heat
transport are totally analogous to those of mass transfer (Fogler, 2011). In the current
work, the ratios of bed length to particle diameter L/dp and reactor diameter to particle
diameter d/dp were maintained at 56.3 and 15.9, respectively after selecting the optimum
diameter for catalyst pellets.
In a typical experimental run, the reactor tube was first removed from the apparatus,
cleaned well with acetone and then installed back to the furnace assembly. The catalyst
was then mixed with 7.6 g of α-Al2O3 particles (0.8 mm) and loaded inside the reactor to
obtain a bed height of ~4.5 cm. The reactor was then heated to the desired reduction
temperature while an inert flow of 100 ml/min of nitrogen was maintained. The
temperature inside the catalyst bed was measured by a K-type thermocouple inserted
from the top of the reactor. The activation of catalyst was then performed by applying a
constant flow of 100ml/min of a reducing gas (5% H2; balance N2) for 2 hours. The
purpose of reduction was to get rid of the oxygen atoms in the metal oxides (NiO and
CeO) and obtain the free active metals Ni and Ce. Meanwhile, the synthetic crude
glycerol was prepared by weighing a specific amount of each component (error<1%).
The different components of synthetic CG plus the predetermined amount of water were
then mixed in a beaker and stirred for about 20 min to obtain a homogenous mixture of a
total volume ~ 120 ml. The syringe pump was then loaded with ~90 ml of the prepared
mixture. Next, the desired reaction temperature was adjusted from the control panel of
the tubular furnace around the reactor. The syringe pump was regulated at 0.15 ml/min
flow rate and turned on just after reaching the desired reforming temperature. At the same

53
time, the inlet flow of oxygen was started from the DFC software that connects to the gas
flow controller. The flow of air was adjusted between 19 and 126 ml/min based on the
oxygen-to-carbon ratio in the inlet feed. The product gas from the PBTR was passed
through the water-cooled condenser (16°C) and the condensate flowing out was collected
in an ice-cooled stainless steel collector. The outlet flow of gas from the liquid collector
was first measured by a digital flow meter, and then sent to a gas chromatograph
equipped with Hayesep Q and Molecular Sieve A columns to analyze for the different
gaseous species produced. The liquid samples were collected and stored in a fridge after
each run.

54
3.6 PERFORMANCE EVALUATION CRITRERIA
The main possibly involved reactions in the autothermal reforming of the synthetic
crude glycerol used in this study include the steam reforming and partial oxidations of
free glycerol, methanol and 2-propanol (present in the soap); besides the water gas shift
(WGS), methanation and methane dry reforming reactions. Reaction expressions with the
corresponding calculated change in the enthalpies (ΔHr) at a constant pressure are given
in the following:
Steam Reforming
C3H8O3 + 3H2O 7H2 + 3CO2 (3.1)
ΔHr (25C) = +122.5 kJ/mol
CH3OH + H2O 3H2 + CO2 (3.2)
ΔHr (25C) = +49.5 kJ/mol
C3H7OH + 5H2O 9H2 + 3CO2 (3.3)
ΔHr (25C) = +283.8 kJ/mol
Partial Oxidation
C3H8O3 + 1.5O2 4H2 + 3CO2 (3.4)
ΔHr (25C) = -603.5kJ/mol
CH3OH + 0.5O2 2H2 + CO2 (3.5)

55
ΔHr (25C) = -102.5KJ/mol
C3H7OH + 2.5O2 4H2 + 3CO2 (3.6)
ΔHr (25C) = -926.2 kJ/mol
Water Gas Shift
CO + H2O H2 + CO2 (3.7)
ΔHr (25C) = -41.8 kJ/mol
Methanation
CO + 3H2 CH4+ H2O (3.8)
ΔHr (25C) = -206.8 kJ/mol
Methane Dry Reforming
CO2 + CH4 2H2 + 2CO (3.9)
ΔHr (25C) = 246 kJ/mol
The combination of steam reforming and partial oxidation reactions of the main
reactants generate three autothermal reforming reactions as the following:
Glycerol Reforming
C3H8O3 + H2O + 0.5 O2 2CO2 + CO + 5H2 (3.10)
ΔHr (25C) = -78.3KJ/mol

56
Methanol Reforming
CH3OH +0.25 H2O+0.125O2 0.5CO2+ 0.5CO+2.25H2 (3.11)
ΔHr (25C) = 9.6 KJ/mol
Propanol Reforming
C3H7OH + 2H2O + O2 2CO2 + CO + 6H2 (3.12)
ΔHr (25C) = -159.0 KJ/mol
Integrating the different components of the synthetic crude glycerol into an
averaged molecular formula will yield an overall formula of C2.5H7O2. The different
stoichiometries for synthetic CG autothermal reaction (3.13) at different inlet ratios of
steam-to-carbon (S/C) and oxygen-to-carbon (O/C) are given in Table 3.3. Conversion
was calculated to determine the amount of reactants that has been converted into
products. However, conversion is a blind criterion if not combined with selectivity.
Selectivity shows the intensity of reactants conversion into target product which is
hydrogen in this case. Yield was determined as the combination of conversion and
selectivity to ease the optimization process. Turnover frequency was determined to select
the most active catalyst. It reveals the amount of product produced per catalytic cycle per
unit time, which in other words represents the activity of the catalyst. Rate of carbon
depositions was also measured in order to minimize coke formation and subsequently
attain a stable process for hydrogen production.
C2.5H7O2 + aH2O + bO2 2CO2 + 0.5CH4 + cH2 + dH2O (3.13)

57
Table 3.3 Different reaction Stoichiometries at different S/C and O/C ratios
S/C O/C a b c d
1.6 0.05 4 0.25 4 2.5
2.6 0.05 6.5 0.25 4 5
3.6 0.05 9 0.25 4 7.5
1.6 0.125 4 0.625 3.25 3.25
2.6 0.125 6.5 0.625 3.25 5.75
3.6 0.125 9 0.625 3.25 8.25
1.6 0.2 4 1 2.5 4
2.6 0.2 6.5 1 2.5 6.5
3.6 0.2 9 1 2.5 9

58
The performance criteria followed in this study are:
Crude glycerol conversion was defined as:
Hydrogen Selectivity was defined as:
RR: Fraction Ratio of H2 to CO2 based on the stoichiometric ratio of the reaction
Hydrogen Yield was defined as:
Rate of Coke Formation was defined as:
Turnover Frequency was defined as:

59
3.7 Design of Experiments (DOE)
The experimental phase of this work was divided into two parts: (1) catalyst
development, (2) optimization and intrinsic data collection. The individual effects of
synthetic CG components were early investigated by adding them separately to the feed
mixture. Promoter element, calcination and reduction temperatures were varied in order
to obtain an active and stable catalyst. The catalyst was selected based on the highest
exhibited activity. The operating parameters were then optimized to attain the best
conditions for a stable hydrogen yield. Then, the kinetic regions were established by
changing the catalyst pellets size and inlet flow rate. Kinetic experiments were designed
based on the factorial design methodology using two combinations of the four kinetically
controlled variables (1) reaction temperature, (2) steam-to-carbon ratio, (3) oxygen-to-
carbon ratio and (4) weight space time W/FA0. Three levels for S/C and O/C factors were
selected, and therefore 3x3 experiments were conducted. On the side of reaction T and
w/FA0 factors, 4 and 6 levels were selected for each factor, respectively, to result in 4x6
experiments. The regions selected for the different parameters were in line with the
thermodynamics and experimental studies discussed in chapter 2. These are given in
Tables 3.4 (a,b,c).

60
Table 3.4a Parametric experiments
Factors Levels
Synthetic CG
Components + methanol + Soap + FFA + Ashes
Promoter
Element Gadolinium Calcium Magnesium
Calcination
Temperature
(°C)
550 600 650
Reduction
Temperature
(°C)
500 600 700
Flow Rate
(ml/min) 0.15 0.2 0.25
Catalyst Pellets
Size (mm) 0.55 0.8 1.09 1.26
Extended TOS
Stability 16 hours TOS
Table 3.4b Kinetic experiments (variables: reactant concentrations)
O/C
S/C
1.6 2.6 3.6
0.05
0.125
0.2
Table 3.4c Kinetic experiments (variables: temperature and W/FA0)
Wcat/FA0
(gcat.min/ mol C)
Reaction Temperature (°C)
500 550 600 650
0.0
12.7
50.9
76.4
101.9
127.4

61
Chapter 4
RESULTS AND DISCUSSION
4.1 CATALYST CHARACTERIZATION
The developed catalysts were characterized for the sake of correlating the
observed catalytic activity to their chemical and structural properties. Investigating the
most affecting factors will help to reasonably select the proper catalyst and optimize the
process performance. In the current study, three promoter elements were checked for
their capabilities of enhancing the performance of the cerium-zircoinum supporting
material Ce-Zr-M, where M is the promoter element Mg, Ca or Gd. The prepared
supports were then impregnated with 5 wt% nickel to obtain an overall catalyst formula
designated by 5Ni/CeZrM.
4.1.1 Thermogravimetric Analysis (TGA)
Thermo-gravimetric analysis was conducted on the uncalcined supports and fresh
impregnated catalysts to investigate the optimum calcination temperature. The catalytic
material has gone through two calcination stages: (1) on the fresh supports just after
drying (2) on the fresh catalysts just after impregnation. The obtained TGA profiles are
shown in Figure 4.1. In these profiles, TGA% represents the weight change with respect
to the initial weight, and DrTGA represents the derivative value of weight change with
respect to time; in other words the time rate of weight change.
In the case of CeZrM support, the first peak of weight loss was observed between
20°C and 100°C where the rate of weight loss reached a maximum value of 0.3 mg/min.
62
This stage corresponds to the removal of moisture from the pores of the support and the
hydrated salts. The hydrated salts associated in this case are Ce(NO3)2.6H2O,
ZrO(NO3)2.xH2O and Ca(NO3)2.4H2O. The second stage of weight loss was identified by
a second peak between 180 and 400°C. This peak attributes to the removal of surfactant
(CTAB) and nitrates (NO3-) remained in the collected solid material (support) after
filtration and rinsing with hot deionized water.
In the case of 5Ni/CeZrM catalyst, the first stage of weight loss was also observed
between 20 and 100°C with a maximum weight loss rate of 0.15 mg/min. Along with the
moisture removed from the pores of the catalyst and the hydrated salts mentioned
previously, Ni(NO3)2.6H2O also contributes to the moisture peak in the catalyst profile.
The second peak of weight loss appears between 150 and 500°C. The wider peak in this
case is justified by the larger amount of nitrates present and their dispersion in the
internal pores of the catalyst. At the time of support preparation, most of the used nitrates
would have gone with the water through filtration and rinsing, unlike the impregnation of
the active material where all the nitrates present in the aqueous Nickel nitrate solution got
aggregated inside the catalyst. According to these results, an optimum calcination
temperature of 550°C was recommended.

63
Figure 4.1 TGA profiles of CeZrCa support and the corresponding 5wt% catalyst

64
4.1.2 N2 Physisorption and ICP-MS on Fresh Supports and Catalysts
N2 physisorption technique was applied to measure the specific surface area,
specific pore volume and pore size of the prepared supports and catalysts. The obtained
isotherms shown in Figure 4.2 manifest the volume change of nitrogen adsorbed at in a
range of relative pressure (P/P0) between 0 and 1.0, where P is the partial vapor pressure
of nitrogen at 77.4 K and P0 is the saturation pressure of nitrogen. The type of the
structure can be identified from the patterns of the isotherms. Obviously, the structure of
our catalyst can be categorized under “Type IV” group, which belongs to the mesoporous
material that has a strong adsorption affinity [Pierotti & Rouquerol, (1985); Schneider,
(1995)]. According to IUPAC Recommendations (1994), the adsorption hysteresis of Ca
tends to belong to H2 type where the interpretation of the loop hysteresis is complex, and
the role of the overall network effects must be considered for defining the distribution of
pore size and shape. On the other hand, H3 type loops corresponding to Gd and Mg
indicate the presence of plate-like particles that yield split-shaped pores where the
limiting adsorption tends to be null at high P/P0.
In this work, the collected measurements of BET surface area, average pore
volume, average pore diameter along with the actual mass fraction of nickel are given in
Table 4.1. The ranges of specific area and pore volume of the prepared catalytic material
were 115.3-187.3 m2/g and 0.23-0.45 cm
3/g, respectively. The average pore size was in
the range of 55.0-109.4 A° within the range of mesoporous material specifications (20-
500°A). Mesoporous materials are widely applied in the field of heterogeneous catalysis
due to the large surface area they provide. The high surface area of the catalyst increases
the rate of the reaction through providing a large number of active sites.

65
Table 4.1 BET and ICP-MS results of fresh supports and catalysts
Promoter
Element
BET Surface Area
(m2/g)
Pore Volume
(cm3/g)
Pore Size
(A0)
Pore V. / S. Area
(10-9
m)
Supports CeZrM, Surfactant/Metal = 0.5
Mg 187.3 0.39 67.3 2.08
Ca 124.4 0.25 63.1 2.01
Gd 131.4 0.45 109.4 3.42
Catalysts 5Ni/CeZrM, Surfactant/Metal= 0.5
Mg 178.4 0.32 55.0 1.78
Ca 115.3 0.23 62.8 1.99
Gd 122.7 0.36 103.5 2.93
Catalyst 5Ni/CeZrGd 5Ni/CeZrCa 5Ni/CeZrMg
Ni Mass Fraction
(ICP-MS) %
2.82 2.82 2.82
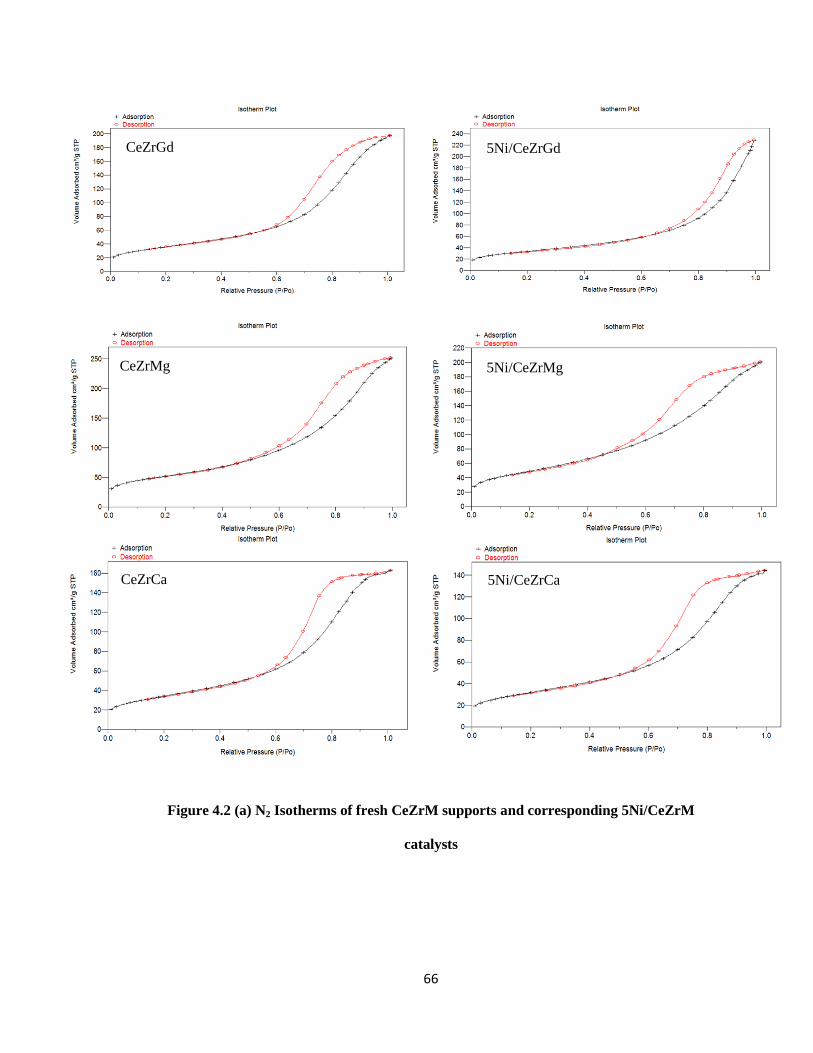
66
Figure 4.2 (a) N2 Isotherms of fresh CeZrM supports and corresponding 5Ni/CeZrM
catalysts
5Ni/CeZrGd CeZrGd
CeZrMg 5Ni/CeZrMg
CeZrCa 5Ni/CeZrCa

67
4.1.3 N2 Physisorption on the Spent Catalysts
The spent catalysts were characterized to investigate the effect of reforming temperature
on the structural properties of the catalyst. The reduction in specific area and pore volume with
reforming temperature can be observed from the results of N2 physisorption. The isotherm
profiles shown in Figure 4.2 correspond again to “Type IV” category, the mesoporous structure
material. The concavity of the desorption loop reduced with the reaction temperature to yield a
lower surface area and pore volume for the spent catalyst.
The promoted Cerium-Zirconium support loaded with 5 wt% nickel (5%Ni/CZM)
showed a stable perfromance in the autothermal reforming of CG. Sintering of metallic atoms and
coke depositions are the main causes of catalyst deactivation. The addition zirconium to cerium
oxide support was proved to enhance the thermal stability of the binary Ce-Zr metal oxides and
thus prevents sintering (Ozawa, 1998). According to Luo et al. (2010), cerium also suppresses
sintering and reduces the selectivity of methane in the product gas for Ni-Co based catalysts.
Previous study in our group by Sukonket et al. (2011) revealed the enhanced thermal stability of
Ni/CeZrMx catalysts. The 5Ni/CeZrCa catalyst retained the mesoporous property and no sintering
effects were observed under a very high calcinations temperature (900°C) (Khan et al. 2011).
In the case of synthetic CG ATR reactions, the possible coke formation over the
surface of Ni/CeZrCa catalyst could be related to the high conversion (C-C cleavage rate)
of synthetic crude glycerol at high temperatures, the reason that would have caused the
observed reduction in surface area and porosity of the catalyst. In order to study this
possibility, TPO runs were performed on the spent catalysts to quantify carbon deposits
in case any presents.

68
Table 4.2 BET results of spent catalysts at different reaction temperatures
Spent “5Ni/CeZrCa” Catalyst
(S/C= 2.6 O/C= 0.125)
Reaction
Temperature
(°C)
BET SA
(m2/g)
Pore Volume
(cm3/g)
Pore Size
(A0)
PV. / SA
(10-9
m)
500 96.57 0.202 69.53 2.08
550 80.46 0.196 80.46 2.43
600 70.35 0.187 106.49 2.66
650 48.79 0.183 133.38 3.54

69
Figure 4.2 (b) N2 Isotherms of spent 5Ni/CeZrCa catalysts at different reaction
temperatures
Reaction T= 500 °C Reaction T= 550 °C
Reaction T= 600 °C Reaction T= 650 °C
70
4.1.4 Temperature Programmed Oxidation (TPO)
TPO runs were performed for the sake of quantifying the carbon that have
deposited on the surface of the spent catalysts during the autothermal reforming of
synthetic CG at different operating variables. Under the flow of oxidizing gas, the
temperature of the spent catalyst was increased to burn off the carbon and measure the
weight change. The weight loss in the range of 360-600°C was considered to be the
amount of coke formed during the ATR of synthetic CG experiments. The peaks of CO
and CO2 that correspond to coke gasification appeared in similar temperature ranges
established by [Le Minh et al. (1997); Nagaoka et al. (2000); Guo et al. (2007)].
It is familiar that ternary oxide mixture (CeZrM) has a high capability of reducing
coking affinity. Indeed, the redox nature of Ce-Zr metal oxides facilitates the gasification
of superficial carbon and minimizes coke formation over the surface of Ni/CeZr catalyst
(Kašpar & Fornasiero, 2002). A very low carbon deposition (~ 8 μmol of C/mg of
catalyst) was observed over Ni/CeZr catalyst by Romero-Sarria et al. (2008) in ethanol
steam reforming study. Moreover, a low carbon propensity factor of <40 mg C/g cat.h
was obtained by Sengupta (2011) and Oluku (2013) for a promoted (CeZrM) support
utilized in the steam reforming of oxygenated hydrocarbons and water gas shift reactions.
The rate of carbon deposition depends on several factors such as feed composition,
catalyst used, reforming temperature, steam-to-carbon (S/C) and oxygen-to-carbon (O/C)
ratios in the inlet feed. TPO profiles obtained at different ratios of O/C, S/C and reaction
temperatures are represented in Figures 4.6(a,b,c). Coke formation over catalyst surface
was expectedly found to decrease with O/C and S/C ratios and increase with the
reforming temperature.

71
As given in figure 4.3, with the increase in oxygen-to-carbon (O/C) ratio, coke
deposition rate decreased from 19.41 mg C/gcat.h at low O/C of 0.05 to almost zero at
high O/C of 0.2. Indeed, this is the one of the major advantages of introducing partial
oxidations alongside with steam reforming reactions. The oxygen will burn off the carbon
and prevents catalyst deactivation due to coke formation. This was discussed in many
studies [Hardiman et al. (2006); Swami & Abraham (2006); Deleplanque at al. (2010);
Wang et al. (2010)].
The molar ratio of steam-to-carbon (S/C) in the inlet feed was varied from 1.6 to
3.6. Figure 4.4 illustrates the variation of the rate of coke formation with S/C ratio; the
highest rate obtained was 10.38 mg C/gcat.h at S/C ratio of 1.6. It decreased to 1.61 mg
C/gcat.h at S/C ratio of 3.6. Actually, the addition of steam suppresses the radical
polymerization reactions that lead to coke formation (Trimm, 1997). However, high
steam-to-carbon ratio might also slow down the kinetics of the involved reactions and
reduce the thermal efficiency of the process. A favorable ratio should be adjusted to keep
the process in a stable and pragmatic area.
Coke deposition rate was found to increase with an increase in reforming
temperature as given in figure 4.5. According to the results given in figure 4.5
recommends a reforming temperature between 550 and 600°C. The maximum rate (6.37
mg C/gcat.h) was reported at the highest temperature (650°C). It has been revealed by
Albright et al, (1983) that the high reaction temperature will cause carbonaceous
intermediates to deposit on the surface of catalyst. In a recent study about the catalytic
steam reforming of glycerol, Chiodo et al. (2010) recommended not to exceed 650°C
reforming temperature in order not to produce encapsulated carbon that consequently

72
affects the stability of the catalyst. The highest rate of carbon deposition was observed at
650°C (4.2 mg C/gcat.h).
Figure 4.3 Coke deposition rates at different O/C ratios
Figure 4.4 Coke deposition rates at different S/C ratios
0
5
10
15
20
25
0.05 0.125 0.2
Co
ke
Fo
rma
tio
n (
mg
C/g
cat.
h)
O/C
Oxygen-to-Carbon
0
2
4
6
8
10
12
1.6 2.6 3.6
Co
ke
Fo
rma
tio
n (
mg
C/g
cat.
h)
S/C
Steam-to-Carbon
5Ni/CeZrCa
S/C= 2.6
Reaction T= 600
°C
5Ni/CeZrCa
O/C= 0.125
Reaction T= 600 °C

73
Figure 4.5 Coke formation rates at different reaction temperatures
0
1
2
3
4
5
6
7
500 550 600 650
Ca
rbo
n D
epo
siti
on
(m
g C
/gca
t.h
)
Reforming T (C)
Temperature
5Ni/CeZrCa
O/C= 0.125
S/C= 2.6

74
Figure 4.6 (a) TPO profiles of spent catalysts at different oxygen-to-carbon ratios

75
Figure 4.6 (b) TPO profiles of spent catalysts at different steam-to-carbon ratios

76
Figure 4.6 (c) TPO profiles of spent catalysts at different reaction temperatures

77
4.1.5 Temperature Programmed Reduction (TPR)
The target of establishing H2-TPR profiles was to study the reducibility of the
prepared metal oxide supports (CeZrM) along with the 5 wt% nickel impregnated
catalysts. The reduction of the metal oxides was detected by a thermal conductivity
detector (TCD). The signal peaks represent the hydrogen consumption by the oxygen
atoms attached to the metallic phase. The corresponding profiles are given in Figure 4.7
and the optimum reduction temperature was determined accordingly.
The H2-TPR profile obtained for CeZrCa was very similar to the one presented by
Ishioma (2013); the main peak was observed in the temperature range of 600-700°C and
another small one around 800°C. In the case of 5Ni/CeZaCa catalyst, two consecutive
peaks were observed in the ranges of 420-530°C and 550-630°C, and a third small one in
the range of 850-900°C. In agreement with the results obtained by Khan & Simirniotis
(2008), the earlier peaks can be ascribed to the surface reduction of nickel and cerium
oxide molecules, while the ones appearing beyond 800°C represent the bulk reduction, in
which oxygen needs first to diffuse and reach the surface where it reacts with the
reducing gas. As expected, no peaks were observed for pristine zirconium oxide. Indeed,
it is well-known that the reduction of ZrO2 molecules takes place at high temperatures
(>1000°C). The reducibility was calculated based on 1/Tmax expression, where Tmax
corresponds to the biggest peak in the pattern. In the case of magnesium promoter
element, a shift to the right was observed with the major peak appeared between 600 and
700°C, again with a similar surface and bulk reduction behavior. The reducibility of
gadolinium promoted catalyst was very similar to calcium one. In both cases the highest
reduction peak appeared around 500°C.

78
Figure 4.7 TPR profiles of the fresh supports and catalysts
-1
4
9
14
19
24
0 100 200 300 400 500 600 700 800 900
Sig
nal
(m
V)
Temperature (C)
Ca
Support
Catalyst
-1
4
9
14
0 100 200 300 400 500 600 700 800 900
Sig
nal
(m
V)
Temperature (C)
Mg
Support
Catalyst
-1
4
9
14
19
24
29
34
0 100 200 300 400 500 600 700 800 900
Sig
nal
(m
V)
Temperature (C)
Gd
Support
Catalyst
CeZrCa
5Ni/CeZrCa
CeZrMg
5Ni/CeZrMg
CeZrGd
5Ni/CeZrGd

79
4.1.6 X-Ray Diffraction (XRD)
The crystallinity of the developed supports and catalysts was investigated through
powder XRD analyses. Figure 4.8 displays the XRD patterns obtained for the prepared
CeZrM supports together with the 5wt% impregnated nickel catalysts. The green
spectrum at the middle is for nickel oxide (NiO2). The reason for presenting nickel oxide
spectrum in between supports and catalysts ones is to be able to pinpoint the existence or
absence of a new crystalline phase; and subsequently this will ensure or deny the
uniformity of active metal dispersion over the support surface.
Same diffraction spectra were obtained for the modified Ce-Zr supports prepared
using different promoter elements, and this confirms the fact that these elements does not
really affect the orientational order of the supporting material phases. The diffraction
patterns shown in Figure 4.8 revealed a cubic fluorite structure having an exact match
with pristine ceria patterns for the prepared supports and catalysts. The diffraction spectra
of supports and catalysts are identical in the case of calcium promoter. No peaks for NiO
were detected in the catalyst patterns, and this supports the significance of using the
surfactant-assisted method for impregnation in order to create a monolayer of the active
metal over the surface of the support. The presence of NiO crystalline phase in case of
magnesium promoter can be identified from the figure. At the same time, it is very hard
to be identified in case of gadolinium promoter. The observed difference in active metal
segregation upon changing the promoter element can be attributed to the dissimilarity of
interactions between NiO and the promoting atoms.

80
Figure 4.8 XRD patterns of the fresh supports and catalysts
0
500
1,000
1,500
0 20 40 60 80 100
In
ten
sity
2Ө
5Ni/CeZrMg
CeZrMg
5Ni/CeZrGd
5Ni/CeZrCa
CeZrGd
CeZrCa
Nickel Oxide NiO

81
4.2 CATALYTIC ACTIVITY
Several chemicals similar to the ones existing in the crude glycerol generated
from biodiesel production were added separately to the synthetic CG feed in order to
investigate their individual effects. The promoter element at the catalyst level was then
varied to select a genuine one for the synthetic CG ATR process.
4.2.1 Effects of Synthetic Crude Glycerol Components
The effects of the different components of crude glycerol were investigated in a
packed bed tubular reactor at steam-to-carbon ratio of 3.6 and oxygen-to-carbon ratio of
0.125 using 5Ni/CeZrGd catalyst. Nickel was impregnated with the help of the wet
impregnation technique at atmospheric pressure. Similar to the composition of crude
glycerol generated at biodiesel plants, the synthetic crude glycerol was prepared to
contain free glycerol, methanol, soap, free fatty acids and ashes. These components have
been widely reported in the literature and confirmed by the collected samples from
Milligan Biofuels Inc. that operates in Saskatchewan-Canada. The individual effect of
each component was experimentally inspected by adding them separately to the liquid
feed at the beginning of the screening tests. Gadolinium was used as the promoter
element. At this stage, the main concern was to check the capability of the prepared
catalyst for handling this mixture of different chemicals without being attacked and
deactivated.
In general, a stable performance was observed for the Gd catalyst with different
effects of each component on the overall activity. The activity of the catalyst was
evaluated based on synthetic CG conversion, hydrogen selectivity and hydrogen yield

82
results. The first data point for pure glycerol reforming was adopted from (Sabri, 2013).
The effect of methanol addition on the conversion of glycerol mixture was very slight,
and a steady performance can be observed from the main effects plot Figure 4.10(a). The
methanol in the feed was reformed to produce hydrogen too. Metallic nickel catalyzes the
decomposition of methanol into hydrogen and carbon monoxide at the proper reaction
conditions (Kobayashi et al., 1981). Coming to the effect of methanol addition on
hydrogen production results, one can clearly observe the decrease in these values from
78.2 to 75.5 mol% and from 1.32 to 1.26 mol H2/ mol Cin for hydrogen selectivity and
hydrogen yield, respectively. This can be attributed to the low moles of hydrogen that can
be produced from methanol reforming reactions compared to glycerol ones. On the other
hand, a sharp decrease in the conversion can be observed due to soap addition that
contains high amount of 2-propanol. This behavior can be ascribed to the soap residues
accumulation in the reaction media and coke formation over the surface of the catalyst
due to 2-propanol reforming reactions. A steam reforming experiment was conducted by
Mizuno et al. (2003) on 2-propanol (Isopropyl alcohol IPA) for 360 min, the amount of
carbon deposits reported over Rh/CeO2 catalyst was 280 mg C/ gcat, and that was the
minimum measured amount compared to the ones deposited over SiO2, ZrO2 and TiO2
supports. The calculated rate of coke formation is 46.67 mg C/gcat.h, which is still a very
high rate. On the side of hydrogen production, the yield of hydrogen production
decreased from 1.26 to 1.17 mol H2/ mol Cin. This can be attributed to the reduction in C-
C cleavage rate due to the active sites blockage by carbon deposits, leading more to liquid
phase products and/or un-reacted feed in the outlet stream. Scanning more the plots of the
main effects in Figure 4.10, one can observe the promoting effect of adding ashes (NaCl

83
and KCl) to the feed. The conversion of synthetic CG and the hydrogen selectivity in the
gas product increased respectively from 78.1 to 84.1 mol% and from 72.3 to 78.5 mol%.
Potassium and sodium chlorides supplied by the ashes enhances the catalytic activity by
stimulating the catalytic oxidation of carbon deposits and thus providing more tolerance
for the catalyst against coke formation. Kumamoto (1995) confirmed the potency of NaCl
and KCl salts in oxidizing Hg0 due to their efficacy of charge-transfer. This enhanced
performance is in line with the low deposition rates observed by [Zhang et al. (2005);
Ibrahim & Idem (2008)] in the presence of promoter elements. The last addition was for
the oleic acid that did not show a significant effect on the catalytic activity. The
conversion was found to slightly increase from 84.1 to 84.5 mol% with a proportional
increase in the hydrogen yield from 1.31 to 1.34 mol H2/ mol Cin. This behavior could be
attributed to the similar acidic nature of the gadolinium support (CeZrGd) and the oleic
acid.

84
Figure 4.9 Evaluation of the individual effects of the different components of CG on the
ATR reactions of synthetic CG at 600°C, 1.0 atm, S/C= 3.6 and O/C= 0.125 using
5Ni/CeZrGd catalyst in a PBTR. (GM: Glycerol + Methanol)
40
50
60
70
80
90
100
0 1 2 3 4 5 6
Co
nv
ersi
on
(m
ol
%)
TOS (h)
Synthetic CG Conversion
GM
GM+Soap
GM+Soap+NaCl&KCl
GM+Soap+NaCl&KCl+Oleic acid
40
50
60
70
80
90
0 1 2 3 4 5 6
Hy
dro
gen
Sel
ecti
vit
y (
mo
l %
)
TOS (h)
Hydrogen Selectivity
GM
GM+Soap
GM+Soap+NaCl&KCl
GM+Soap+NaCl&KCl+Oleic acid
0
0.4
0.8
1.2
1.6
0 1 2 3 4 5 6
Hy
dro
gen
Yie
ld (
mo
l H
2/m
ol
Cin
)
TOS (h)
Hydrogen Yield
GM
GM+Soap
GM+Soap+NaCl&KCl
GM+Soap+NaCl&KCl+Oleic acid

85
GM +
Soa
p + N
aCl&
KCl +
Oleic
Acid
GM +
Soa
p + N
aCl&
KCl
GM +
Soa
p
Glyc
erol
+ M
etha
nol
Glyc
erol
85
84
83
82
81
80
79
78
GM: Glycerol + Methanol
Me
an
Main Effects Plot for ConversionData Means
GM + S
oap +
NaCl&KC
l + O
leic
Acid
GM +
Soa
p +
NaCl&K
Cl
GM +
Soa
p
Glycerol + M
etha
nol
Glyc
erol
80
79
78
77
76
75
74
73
72
GM: Glycerol + Methanol
Me
an
Main Effects Plot for SelectivityData Means
(a)
(b)

86
GM +
Soa
p + N
aCl&
KCl +
Oleic
Acid
GM +
Soa
p + N
aCl&
KCl
GM +
Soa
p
Glycer
ol +
Met
hano
l
Glycer
ol
1.35
1.30
1.25
1.20
1.15
GM: Glycerol + Methanol
Me
an
Main Effects Plot for YieldData Means
GM +
Soa
p + N
aCl&
KCl +
Oleic
Acid
GM +
Soa
p +
NaCl&
KCl
GM +
Soa
p
Glycer
ol +
Met
hano
l
Glyc
erol
0.31
0.30
0.29
0.28
0.27
0.26
0.25
0.24
GM: Glycerol + Methanol
Me
an
Main Effects Plot for TOFData Means
Figure 4.10 Individual effects of the different components of CG on the performance of
ATR reactions (a) Main effects plot for synthetic CG Conversion [mol %] (b) Main effects
plot for hydrogen selectivity [mol %] (c) Main effects plot for hydrogen yield [mol H2/ mol
C] (d) Main effects plot for turnover frequency [1/s].
(c)
(d)

87
4.2.2 CATALYSTS SCREENING- PROMOTER EFFECT
The activities of the prepared mixed oxide supports CeZrM (M= Ca, Mg, Gd)
loaded with 5 wt% nickel catalyst were tested for the authothermal reforming of synthetic
crude glycerol in a packed bed tubular reactor at atmospheric pressure and 600°C.
Throughout these experiments, the steam-to-carbon and oxygen-to-carbon ratios were
maintained at 3.6 and 0.125, respectively. The three tested supports were prepared
according to surfactant assisted technique followed by a wet impregnation of the same
amount of nickel (5 wt%). The catalysts were then calcined at 650°C and then palletized
to 0.8 mm sized particles. A catalyst weight time of 158.2 gcat.min/mol C was applied.
The screening runs of synthetic CG ATR are given as conversion, hydrogen selectivity
and hydrogen yield results versus time-on-stream (TOS) in Figure 4.12.
According to the main effects results shown in Figure 4.13, the performance of
calcium promoted catalyst was very similar to gadolinium one with a very slight
distinction. The conversion obtained was 84.5 mol% with 5Ni/CeZrCa while it was
84.3% with 5Ni/CeZrGd. Same slight difference was obtained in the hydrogen selectivity
results with 79.7 and 79.6 mol% for the Ca and Gd catalysts, respectively. A more
observable deviation was obtained with the magnesium promoted catalyst with 78.8 and
75.3 mol% for conversion and hydrogen selectivity, respectively. The order of catalytic
activity arranged based on the impact of promoter elements is as follows; Ca > Gd > Mg.
The non-catalytic run was carried out at an identical set of operating conditions to
differentiate between the thermal and catalytic effect on the process. The absence of
active sites and the accumulation of carbon deposits inside the reactor during the non-
catalytic experiment could have contributed to the observed poor and unstable

88
performance. The thermal effect (T= 600°C) stimulated the steam reforming reactions
due to their endothermic nature.

89
Figure 4.11 Performance evaluation of 5Ni/CeZrM catalysts for synthetic CG ATR at S/C=
3.6, O/C= 0.125 and reaction T=600°C in a PBTR.
20
40
60
80
100
0 1 2 3 4 5 6
Co
nv
ersi
on
(m
ol
%)
TOS (hr)
Synthetic CG Conversion
5Ni/CZCa 5Ni/CZGd 5Ni/CZMg Non-catalytic
10
30
50
70
90
0 1 2 3 4 5 6
Hy
dro
gen
Sel
ecti
vit
y (
mo
l%)
TOS (hr)
Hydrogen Selectivity
5Ni/CZCa 5Ni/CZGd 5Ni/CZMg Non-Catalytic
0.2
0.6
1
1.4
0 1 2 3 4 5 6
Hy
dro
gen
Yie
ld(m
ol
H2/m
ol
Cin
)
TOS (hr)
Hydrogen Yield
5Ni/CZCa
5Ni/CZGd
5Ni/CZMg
Non-Catalytic

90
Non-Catalytic5Ni/CeZrMg5Ni/CeZrGd5Ni/CeZrCa
85
80
75
70
65
60
55
50
Catalyst
Me
an
Main Effects Plot for ConversionData Means
Non-Catalytic5Ni/CeZrMg5Ni/CeZrGd5Ni/CeZrCa
80
70
60
50
40
Catalyst
Me
an
Main Effects Plot for Hydrogen SelectivityData Means
Non-Catalytic5Ni/CeZrMg5Ni/CeZrGd5Ni/CeZrCa
1.4
1.3
1.2
1.1
1.0
0.9
0.8
0.7
0.6
0.5
Catalyst
Me
an
Main Effects Plot for Hydrogen YieldData Means
5Ni/CeZrMg5Ni/CeZrGd5Ni/CeZrCa
0.30
0.29
0.28
0.27
0.26
Catalyst
Me
an
Main Effects Plot for Turnover FrequencyData Means
Figure 4.12 Effects of the developed catalysts on the ATR of synthetic CG; (a) Main effects
plot for synthetic CG Conversion [mol %] (b) Main effects plot for hydrogen selectivity
[mol %] (c) Main effects plot for hydrogen yield [mol H2/ mol C] (d) Main effects plot for
Turnover Frequency [1/s].
(a) (b)
(c) (d)

91
4.2.3 Structure-Activity Relationship
In general, the overall performance of a catalytic process is the outcome of
complex interactions among the several chemical and structural properties of the utilized
catalyst, alongside with the applied operating conditions. The enhanced performance of
the 5Ni/CeZrCa catalyst in the ATR of CG can be attributed to the reducibility, nickel
dispersion, PV/SA and hammet basicity properties. Figure 4.13 shows the activity-
structure main effects plot based on conversion and hydrogen selectivity results.
According to TPR results given in section 4.1.4, Ca and Gd promoted catalysts were
reduced at 487 and 495°C, respectively; while the reduction of Mg promoted one was
achieved at a higher temperature of 624°C. Consequently, the status of Ca promoted
catalyst can stay more active during the reforming process due to the ease with which
reduction can occur. Moreover, the percentage of active metal dispersion reported by
Sabri (2013) was 11.46% for the 5Ni/CeZrCa catalyst; however this was 3.54 and 0.44
for Gd and Mg promoted ones, respectively. This indicates that more active sites will be
provided by Ca promoted catalyst compared to Gd and Mg ones. The high density of
active sites with the Ca catalyst could reasonably justify the observed trend of activity.
The ratio of pore volume to surface area (PV/SA) could have also contributed to the
observed catalytic performance. The two catalysts (Ca and Gd) that showed the highest
conversion and selectivity results possess the biggest ratios of pore volume to surface
area (PV/SA). Furthermore, the activity was correlated with the surface acid-base
properties of the catalyst. The investigation of surface basicity as a function of basic
strength (H-) was done by Hammet & Deyrup (1932). The values of Ca and Mg Hammett
basicity functions were reported in literature by idem et al. (2012). According to Di

92
Cosimo et al. (1998), some reactions involved in ethanol conversion such as
dehydrogenation, condensation and dehydration requires strong basic sites to initiate
surface ethoxide formation. The authors revealed that, the catalytic performance of Mg-
Al hydrotalcites, with high density and strength of basic sites, presented a higher activity
than the pure MgO.
In order to study the contribution of each factor to the observed catalytic
performance, Pearson correlation coefficients were calculated along with the
corresponding P-values. Pearson coefficient ranged between -1 and +1, measures the
extent of linearity between two variables. The direction and the strength of this
relationship are determined by the sign and the magnitude of the coefficient, respectively.
The degree of confidence in this linear correlation is represented by P-value. Table 4.3
lists the coefficients and their corresponding P-values according to synthetic CG
conversion and hydrogen selectivity results. The relationship between reducibility and
activity exhibits a perfect linearity with a coefficient of 1.0. The corresponding P-values
of 0.017 and 0.007 are both less than α-level (0.05); this confirms that the correlation
between reducibility and activity is different from zero. Nickel dispersion, with Pearson
coefficient of 0.75, comes after reducibility as the most affecting factor on catalytic
activity. In this case, the existence of linear correlation cannot be affirmed since the
corresponding P-value is greater than 0.05. According to Pearson correlation analysis, the
significance order of catalyst structural properties on the overall performance is as
follows; Reducibility> Nickel Dispersion> PV/SA> Surface Basicity.

93
Table 4.3 Pearson correlations coefficients for structure-activity relationship
Based on Conversion Based on H2 Selectivity
Catalyst Property
Pearson
Correlation
Coefficient
P-Value
Pearson
Correlation
Coefficient
P-Value
Reducibility 1.00 0.017 1.00 0.007
Nickel Dispersion 0.75 0.460 0.78 0.435
PV/SA 0.56 0.621 0.53 0.645
Surface Basicity 0.54 0.636 0.57 0.611

94
2.08E-032.04E-031.60E-03
80.0
79.5
79.0
78.5
78.0
11.463.540.44
2.91E-091.92E-091.77E-09
80.0
79.5
79.0
78.5
78.0
2827
Reducibility (1/C)
Me
an
Ni Dispersion (%)
PV/SA (m) Hammett Basicity (H-)
Main Effects Plot for Hydrogen selectivityData Means
2.08E-032.04E-031.60E-03
84.0
83.5
83.0
82.5
11.463.540.44
2.91E-091.92E-091.77E-09
84.0
83.5
83.0
82.5
2827
Reducibility (1/C)
Me
an
Ni Dispersion (%)
PV/SA (m) Hammett Basicity (H-)
Main Effects Plot for ConversionData Means
(a)
(b)

95
2.08E-032.04E-031.60E-03
0.300
0.295
0.290
0.285
11.463.540.44
2.91E-091.92E-091.77E-09
0.300
0.295
0.290
0.285
2827
Reducibility (1/C)
Mean
Ni Dispersion (%)
PV/SA (m) Hammett Basicity (H-)
Main Effects Plot for TOFData Means
Figure 4.13 Activity-structure correlations obtained for 5Ni/CeZrM catalysts where M=
Mg, Gd, Ca; (a) Main effects plot for synthetic CG conversion [mol %] (b) Main effects plot
for hydrogen selectivity [mol %] (c) Main effects plot for Turnover frequency [1/s].
(c)
96
4. 3 PARAMETRIC STUDY
Several operating variables were varied for the sake of optimizing and better
controlling the process. The experimental work was conducted in a PBTR at atmospheric
pressure. The performance was evaluated based on conversion, hydrogen selectivity and
hydrogen yield results. The investigated parameters include calcination temperature,
reduction temperature, particle size, reaction temperature, steam-to-carbon ratio and
oxygen-to-carbon ratio in the inlet feed. The obtained results are discussed in the
following section.
4.3.1 Effect of Reduction Temperature
The catalysts screened in the foregoing experiments for ATR of synthetic CG
were activated at a temperature of 700°C. According to the results obtained from TPR
analyses shown in Figure 4.7, a lower reduction temperature could be sufficient to
activate the 5Ni/CeZrCa catalyst and avoid any negative impacts of high temperature on
its structure. For this reason, the reduction temperature of 5Ni/CeZrCa catalyst was
varied between 500-700°C. 0.25 grams of the catalyst was used in each run. The
activation of the catalyst was achieved in a PBTR by flowing 100 ml/min of
5%H2/balance N2 gas for 2 hours at the desired reduction temperature prior to start
feeding the reactants. The reaction temperature, S/C ratio and O/C ratio were maintained
at 600°C, 3.6 and 0.125, respectively. The observed performances at different reduction
temperatures are illustrated in Figure 4.14. Evidently, a reduction temperature of 500°C
was not sufficient enough to completely reduce the metallic phase (NiO and CeO2) of the
catalyst. The initial conversion corresponding to the first two hours (TOS) was around

97
70% for the catalyst activated at 500°C; however this was around 85% for the catalysts
activated at 600 and 700°C. Almost the same behavior was observed with hydrogen
selectivity and yield results. This can be attributed to the reduction of CeO2 into active
cerium atoms that usually requires a temperature between 550-600°C. The second peak
(~590°C) of 5Ni/CeZrCa TPR profile in Figure 4.7 corresponds to hydrogen consumption
due to cerium oxide activation. The catalyst was then partially activated at 500°C and
tends to be fully active after 2 hours (TOS), because the ATR of synthetic CG was
carried out at 600°C with hydrogen being produced inside the reformer. The catalysts
reduced initially at different temperatures showed similar catalytic activities after
reaching steady state with conversion and hydrogen yield results of ~83% and 1.3 mol
H2/mol Cin, respectively. Taking into account the overall conversion, selectivity and yield
results presented in Figure 4.15, a reduction temperature of 600°C is recommended to
obtain the highest catalytic activity of 5Ni/CeZrCa.

98
Figure 4.14 Effect of reduction temperatures on the activity of 5Ni/CeZrCa catalyst at S/C=
3.6, O/C= 0.125 and reaction T=600°C in a PBTR.
50
55
60
65
70
75
80
85
90
95
0 1 2 3 4 5 6
Co
nv
ersi
on
(m
ol%
)
TOS (h)
Synthetic CG Conversion
T reduction 700 C
T reduction 600 C
T reduction 500 C
50
55
60
65
70
75
80
85
90
95
0 1 2 3 4 5 6
Hy
dro
gen
Sel
ecti
vit
y(m
ol%
)
TOS (h)
Hydrogen Selectivity
T reduction 700 C
T reduction 600 C
T reduction 500 C
0.4
0.6
0.8
1
1.2
1.4
1.6
0 1 2 3 4 5 6
Hy
dro
gen
Yie
ld (
mo
l H
2/m
ol
Ci n
)
TOS (h)
Hydrogen Yield
T reduction 700 C
T reduction 600 C
T reduction 500 C

99
700600500
84
83
82
81
80
79
78
Reduction Temperature
Me
an
Main Effects Plot for ConversionData Means
700600500
81
80
79
78
77
Reduction Temperature
Me
an
Main Effects Plot for Hydrogen SelectivityData Means
700600500
1.34
1.32
1.30
1.28
1.26
1.24
1.22
1.20
Reduction Temperature
Me
an
Main Effects Plot for Hydrogen YieldData Means
700600500
0.295
0.290
0.285
0.280
0.275
0.270
0.265
Reduction Temperature
Me
an
Main Effects Plot for TOFData Means
Figure 4.15 Performance variations with reduction temperature (a) Main effects plot for
synthetic CG conversion [mol%] (b) Main effects plot for hydrogen selectivity [mol %] (c)
Main effects plot for hydrogen yield [mol H2/mol Cin) (d) Main effects plot for turnover
frequency [1/s].
(a) (b)
(c)
(a)
(c) (d)

100
4.3.2 Effect of Calcination Temperature
In the early stages of this work, the catalysts utilized for synthetic CG ATR were
calcined at 650°C. But the results obtained from TGA analyses shown in Figure 4.1
revealed that such a high temperature is unneeded as all the adsorbed moisture, CTAB
and nitrates can be removed at a lower temperature. Exposing the catalyst to a high
temperature is unfavorable since it might cause sintering and thus reduction in the
catalytic activity. The calcination temperature was then varied between 550 and 650°C to
investigate the impact of thermal treatment on the activity of the catalyst. The screening
experiments were conducted in a PBTR at a reforming temperature of 600°C, S/C ratio of
3.6 and O/C ratio of 0.125. According to the results shown in Figures 4.16 and 4.17, the
premier catalytic performance for 5Ni/CeZrCa was obtained at a calcination temperature
of 550 °C. The conversion increased from 82.8% to 87.98% as the calcination
temperature decreased from 650 to 550°C. In addition, the yield of hydrogen increased
from 1.32 to 1.42 mol H2/mol Cin with this decrease in calcination temperature. These
observations could be attributed to the possible deformation in the structure of the
catalyst due to thermal effect. According to Sukonket et al. (2011), the porosity and
surface area of these materials decreases as the temperature increases. Besides that, nickel
particles might agglomerate at high temperatures leading to a dramatic decrease in the
number of active sites.
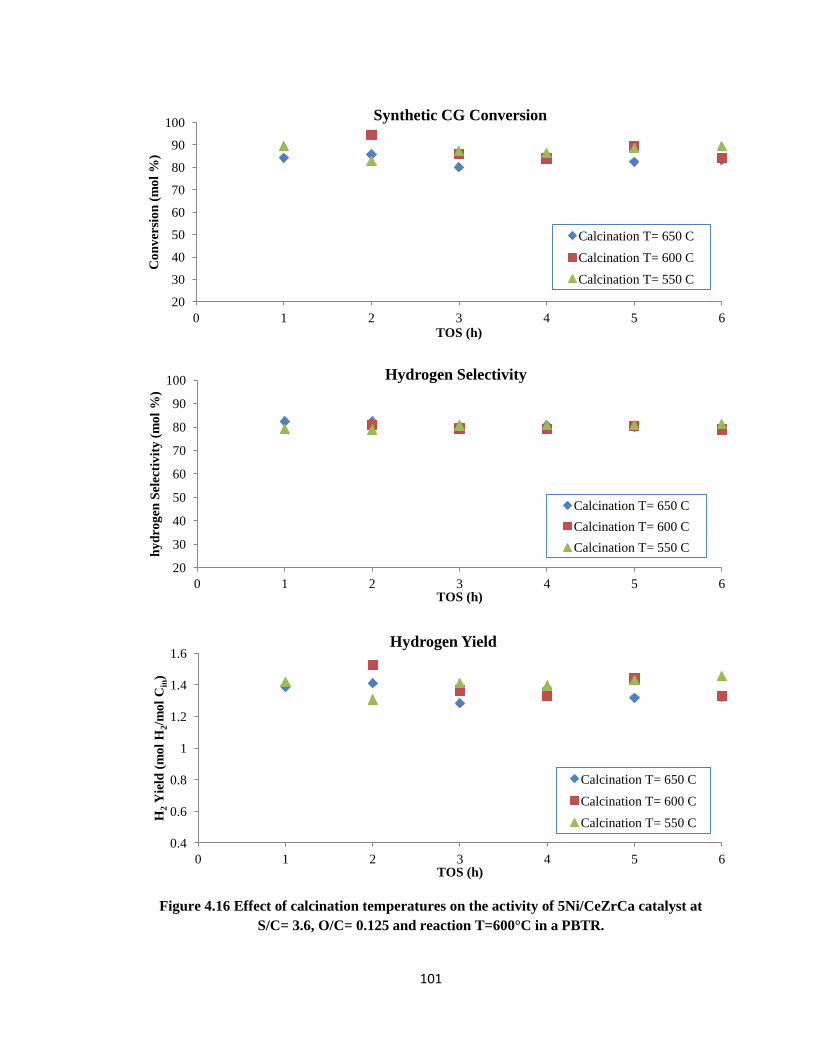
101
Figure 4.16 Effect of calcination temperatures on the activity of 5Ni/CeZrCa catalyst at
S/C= 3.6, O/C= 0.125 and reaction T=600°C in a PBTR.
20
30
40
50
60
70
80
90
100
0 1 2 3 4 5 6
Co
nv
ersi
on
(m
ol
%)
TOS (h)
Synthetic CG Conversion
Calcination T= 650 C
Calcination T= 600 C
Calcination T= 550 C
20
30
40
50
60
70
80
90
100
0 1 2 3 4 5 6
hy
dro
gen
Sel
ecti
vit
y (
mo
l %
)
TOS (h)
Hydrogen Selectivity
Calcination T= 650 C
Calcination T= 600 C
Calcination T= 550 C
0.4
0.6
0.8
1
1.2
1.4
1.6
0 1 2 3 4 5 6
H2 Y
ield
(m
ol
H2/m
ol
Cin
)
TOS (h)
Hydrogen Yield
Calcination T= 650 C
Calcination T= 600 C
Calcination T= 550 C

102
650600550
88
87
86
85
84
83
Calcination T (C)
Me
an
Main Effects Plot for ConversionData Means
650600550
81.0
80.5
80.0
79.5
79.0
Calcination T (C)
Me
an
Main Effects Plot for Hydrogen SelectivityData Means
650600550
1.42
1.40
1.38
1.36
1.34
1.32
Calcination T (C)
Me
an
Main Effects Plot for Hydrogen YieldData Means
650600550
0.310
0.305
0.300
0.295
0.290
Calcination T (C)
Me
an
Main Effects Plot for TOFData Means
Figure 4.17 Performance variations with calcination temperatures (a) Main effects plot for
synthetic CG conversion [mol %] (b) Main effects plot for hydrogen selectivity [mol %] (c)
Main effects plot for hydrogen yield [mol H2/ mol Cin] (d) Main effects plot for Turnover
frequency [1/s].
(a)
(b)
(c)
(d) (c)
(a)

103
4.3.3 Effect of Steam-to-Carbon Ratio
The effect of steam-to-carbon ratio on the ATR reactions of synthetic CG was
investigated in a PBTR with 5Ni/CeZrCa catalyst. Reaction temperature was maintained
at 600°C. The molar ratio of steam to carbon in the inlet feed was varied between 1.6 and
3.6 at three different oxygen-to-carbon molar ratios. An excess steam is usually utilized
to promote steam reforming reactions, suppress methanation ones and minimize coke
formation over the catalyst. Similar to the results obtained by Dauenhauer et al. (2006),
the addition of steam enhanced the production of H2 and CO2 gases as given in the
product distribution plot of Figure 4.18. As expected, the increase of S/C ratio also
reduced methanation. This behavior can be attributed to the chemical reaction given in
(4.1). According to Le Chatelier’s priniciple, at low steam concentrations inside the
reaction media, hydrogen will tend to react with carbon monoxide molecules to produce
methane and steam and shift the system towards equilibrium.
CO + 3H2 CH4 + H2O (4.1)
The conversion of synthetic CG was observed to decrease from 78.9 to 73.4
mol% with an increase in S/C molar ratio from 1.6 to 3.6. Nonetheless, hydrogen
selectivity increased from 78.7 to 89.2 mol%. The decrease in conversion with S/C ratio
can be ascribed to the formation of carbon based unsaturated liquid phase species at high
steam concentrations such as ethanal, acetic acid, acetol, 1,1-ethanediol and others; and
thus less carbon based gaseous species and consequently lower conversion results. Note
that, conversion in this study was just based on the outlet carbon in the gas phase and the
carbon in the inlet feed. The turnover frequency decreased significantly from 0.44 to 0.28

104
s-1
. Indeed, steam was provided by diluting the synthetic CG mixture with a
predetermined amount of water based on S/C molar ratio. For this reason, the
concentration of biomass in the feed dropped with the increase in the molar ratio of S/C
and eventually the potency of hydrogen production per active site decreased. This setup
limitation affected the results of TOF variation with S/C, but not conversion, selectivity
or yield ones. The increasing trend of selectivity with the increase in S/C ratio is due to
the promoted steam reforming reactions at high steam concentrations. Similar sets of S/C
ratios were also tested at O/C ratios of 0.125 and 0.2 and given in the next section.

105
Figure 4.18 Effect of S/C ratio on synthetic CG ATR reactions using 5Ni/CeZrCa catalyst at
O/C= 0.05 and reaction T=600°C in a PBTR.
20
30
40
50
60
70
80
90
100
0 1 2 3 4 5 6
Co
nv
ersi
on
(m
ol
%)
TOS (h)
Synthetic CG Conversion
S/C= 3.6
S/C= 2.6
S/C= 1.6
40
50
60
70
80
90
100
0 1 2 3 4 5 6
Hy
dro
gen
Sel
ecti
vit
y (
mo
l %
)
TOS (h)
Hydrogen Selectivity
S/C= 3.6
S/C= 2.6
S/C= 1.6
0
10
20
30
40
50
60
70
1.5 2 2.5 3 3.5 4
Pro
du
ct d
istr
ibu
tio
n (
mo
l %
)
S/C
Product distribution variation with S/C
H2
CO2
CH4

106
Figure 4.19 Performance variations with steam-to-carbon (S/C) ratio at O/C= 0.05 and
reaction T=600°C in a PBTR.
73
74
75
76
77
78
79
80
1.2 2.2 3.2
Co
nv
ersi
on
(m
ol
%)
S/C
Synthetic CG Conversion
1.2
1.24
1.28
1.32
1.2 2.2 3.2
H2
Yie
ld (
mo
l H
2/M
ol
Cin
)
S/C
Hydrogen Yield
78
80
82
84
86
88
90
1.2 2.2 3.2
H2
Sel
ecti
vit
y (
mo
l %
)
S/C
Hydrogen Selectivity
0.2
0.25
0.3
0.35
0.4
0.45
0.5
1.2 2.2 3.2
TO
F (
1/s
)
S/C
TOF

107
4.3.4 Effect of Oxygen-to-Carbon Ratio
The addition of oxygen to the process of synthetic CG ATR has three principal
effects: (1) improves the energy efficiency by supplying heat via oxidation reactions; (2)
enhances the stability by reducing carbon deposits over the catalyst; (3) moves the
process into a practical level by reducing the fixed and operating cost of the reformer.
However, O/C ratio is a very critical operating parameter that needs attentive adjustment,
since the presence of oxygen at high concentrations depletes the production of hydrogen.
The speedy kinetics of partial oxidations suppresses the reactions of steam reforming
resulting in a small unreacted fraction of the initial synthetic CG in the feed ready to react
with steam and generate hydrogen. In order to investigate the effect of oxygen-to-carbon
ratio on the catalytic ATR of synthetic CG, the ratio of O/C was varied in the range of
0.05-0.2 in a PBTR under atmospheric pressure. The performance was screened at
different S/C ratios with five O/C ratios tested at S/C= 2.6 as given in Figure 4.20. The
overall results of activity variations with O/C ratio at different steam concentrations are
presented in Figure 4.21. Taking an example of S/C at 3.6, the conversion of synthetic
CG increased from 73.5 to 88.4 mol% with an increase of O/C from 0.05 to 0.2; however,
hydrogen selectivity decreased from 89.2 to 54.3 mol%. This can be explained by the
increased flow of CO2 in the effluent gas stream generated via partial oxidation reactions,
concurrently with generating water due to hydrogen consumption by oxygen molecules.
In other words, increasing the ratio of O/C in the inlet feed increased the concentration of
CO2 in the outlet stream and thus the conversion; but at the same time, it reduced the
molar percentage of H2 molecules in the effluent gas and consequently lessened the yield
of production and the turnover frequency.
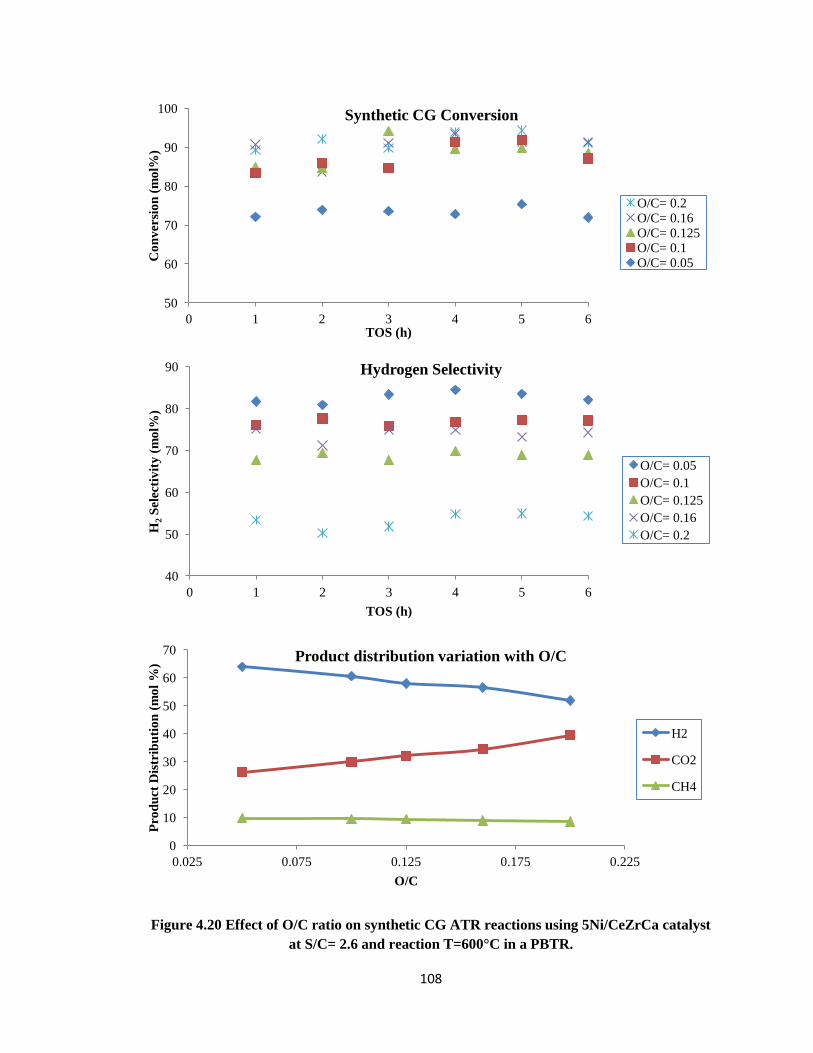
108
Figure 4.20 Effect of O/C ratio on synthetic CG ATR reactions using 5Ni/CeZrCa catalyst
at S/C= 2.6 and reaction T=600°C in a PBTR.
50
60
70
80
90
100
0 1 2 3 4 5 6
Co
nv
ersi
on
(m
ol%
)
TOS (h)
Synthetic CG Conversion
O/C= 0.2 O/C= 0.16 O/C= 0.125 O/C= 0.1 O/C= 0.05
40
50
60
70
80
90
0 1 2 3 4 5 6
H2 S
elec
tiv
ity
(m
ol%
)
TOS (h)
Hydrogen Selectivity
O/C= 0.05
O/C= 0.1
O/C= 0.125
O/C= 0.16
O/C= 0.2
0
10
20
30
40
50
60
70
0.025 0.075 0.125 0.175 0.225
Pro
du
ct D
istr
ibu
tio
n (
mo
l %
)
O/C
Product distribution variation with O/C
H2
CO2
CH4

109
Figure 4.21 Performance variations with oxygen-to-carbon (O/C) ratio at 600°C and
W/FA0=127.4 gcat.min/ mol C using 5Ni/CeZrCa catalyst.
40
50
60
70
80
90
100
0.025 0.075 0.125 0.175 0.225
Hy
dro
gen
Sel
ecti
vit
y (
mo
l %
)
O/C
Hydrogen Selectivity
S/C= 1.6
S/C= 2.6
S/C= 3.6
60
70
80
90
100
0.025 0.075 0.125 0.175 0.225
Co
nv
ersi
on
(m
ol
%)
O/C
Synthetic CG Conversion
S/C= 1.6
S/C= 2.6
S/C= 3.6
0.9
1
1.1
1.2
1.3
1.4
0.025 0.075 0.125 0.175 0.225
H2 Y
ield
(m
ol
H2 /m
ol
Cin
)
O/C
Hydrogen Yield
S/C=1.6
S/C=2.6
S/C=3.6
0
0.1
0.2
0.3
0.4
0.5
0.025 0.075 0.125 0.175 0.225
TO
F (
1/s
)
O/C
TOF
S/C=1.6
S/C=2.6
S/C=3.6

110
4.3.5 Effect of Reaction Temperature
Several chemical reactions are anticipated to be involved in the ATR process of
synthetic CG. Some of these reactions are endothermic such as steam reforming and
methane dry reforming; and others are exothermic such as partial oxidation, methanation
and water gas shift reactions. Hence, operating temperature is a very critical parameter
that can significantly affect the process and drives the production toward the planned
target. According to the experimental results presented in Figure 4.22, the performance of
ATR process of synthetic CG was enhanced by increasing reaction temperature up to a
certain point (550-600°C); beyond this temperature, a steady behavior was observed. The
production of hydrogen increased with increasing the operating temperature due to the
endothermic nature of steam reforming reactions that posses the ability of generating
more H2 than the partial oxidation ones. Turnover frequency also increased from 0.079 to
about 0.17 s-1
with the same raise in temperature. The concentration of CO2 decreased
with increasing the operating temperature; however H2 percentage in the product gas
mixture was practically invariant beyond 575°C. This can be attributed to the promoted
reactions of dry methane reforming at high temperatures. In addition, methane formation
was suppressed by increasing the operating temperature up to ~575°C; beyond this value,
CH4 percentage in the outlet gas remained constant. This can be explained by the
exothermic nature of methanation reactions. The endothermicity of reaction (4.2)
explains the negative impact of operating temperature on the rate of coke formation
presented in Figure 4.5.
CH4 2H2 + C ΔH298k= 74.85 kJ/mol (4.2)

111
Figure 4.22 Performance variations with reaction temperature at S/C= 2.6, O/C= 0.125,
W/FA0 =127.4 gcat.min/ mol C using 5Ni/CeZrCa catalyst.
50
60
70
80
90
100
450 500 550 600 650
Co
nv
ersi
on
(m
ol
%)
Reaction T (°C)
Synthetic CG Conversion
40
50
60
70
80
450 500 550 600 650
Hy
dro
gen
Sel
ecti
vit
y (
mo
l %
)
Reaction T (°C)
Hydrogen Selectivity
0
0.05
0.1
0.15
0.2
450 500 550 600 650
TO
F (
1/s
)
Reaction T (°C)
TOF
0
0.3
0.6
0.9
1.2
1.5
450 500 550 600 650
H2 Y
ield
(m
ol
H2
/mo
l C
in)
Reaction T (°C)
Hydrogen Yield
0
20
40
60
450 500 550 600 650
Pro
du
ct d
istr
ibu
tio
n (
mo
l%)
Reaction T (°C)
Product distribution variation with reaction temperature
H2
CO2
CH4

112
4.4 STATISTICAL ANALYSIS
In order to investigate the causality and quantify the significance of each factor on
the overall performance, a statistical analysis was performed on the experimental data
collected from the ATR of synthetic CG in a PBTR setup. Minitab software was used to
develop main effects, interactions and Pareto charts. Regressions and model development
were achieved with the help of NLREG software.
4.4.1 Main Effects and Interactions
A statistical analysis was conducted to discover the effects of calcination
temperature, reduction temperature, particle size, promoter element, reaction temperature,
S/C and O/C ratios on the catalytic performance of 5Ni/CeZrCa for the ATR of Synthetic
CG. Figure 4.23 shows the main effects plots of these factors based on synthetic CG
conversion, hydrogen selectivity and turnover frequency criteria. The performance of the
process at different levels of several operating factors was shown in one plot with the
corresponding mean line. The presence of a main effect is determined by the relative
position of the response trend to the overall mean line. The larger the verticality of the
plotted response line, the larger the effect of this operating variable on the process
performance. Accordingly, conversion of synthetic CG is mostly affected by reaction
temperature and O/C ratio as shown in Figure 4.23(a). Hydrogen selectivity and turnover
frequency are strong functions of S/C and O/C ratios, with a considerable effect of
reaction and calination temperatures as shown in Figures 4.23(b) and (c), respectively.
These plots are beneficial to divide the parameters into two subcategories, namely, (1)
main factors, and (2) minor factors. Therefore, reaction temperature along with O/C and

113
S/C ratios are the most significant parameters in the ATR of synthetic CG process. The
horizontal trends for reduction temperature, particle size and promoter elements indicate
the minor impacts of these factors on the overall performance. The possible reasons for
these individual trends are presented in the parametric study. Similar statistical analysis
was conducted by Saha et al. (2014).
In general, the overall performance of a chemical process is a result of complex
interactions among the various operating parameters in the system. In order to assess the
extent of significance of these interrelations in the process of synthetic CG ATR,
interaction plots given in Figure 4.24 were established. Again, the degree of intersection
between the plotted lines demonstrates the strength of interaction between the two
corresponding factors. The more is the vertical crossing, the stronger is the interaction.
According to Figure 4.24(a), conversion of synthetic CG is strongly affected by the
interactions among reaction temperature, O/C and S/C ratios. This can be ascribed to the
controlling role of these variables over the kinetics of ATR reactions, and thus possessing
the ability of driving them into different pathways. The interactions of these main factors
with reduction temperature, calcinations temperature, particle size and promoter elements
are negligible. According to Figure 4.24(b), the variations in hydrogen selectivity could
be attributed to the high interactions between S/C and reaction temperature from one side,
and between these two factors and O/C from the other side. Turnover frequency is mostly
affected by the interactions between S/C and reaction temperature as shown in Figure
4.24 (c). In order to appropriately optimize, control and design the different units in this
process, it is very critical to understand these interactions and their resulting effects on
the overall performance.
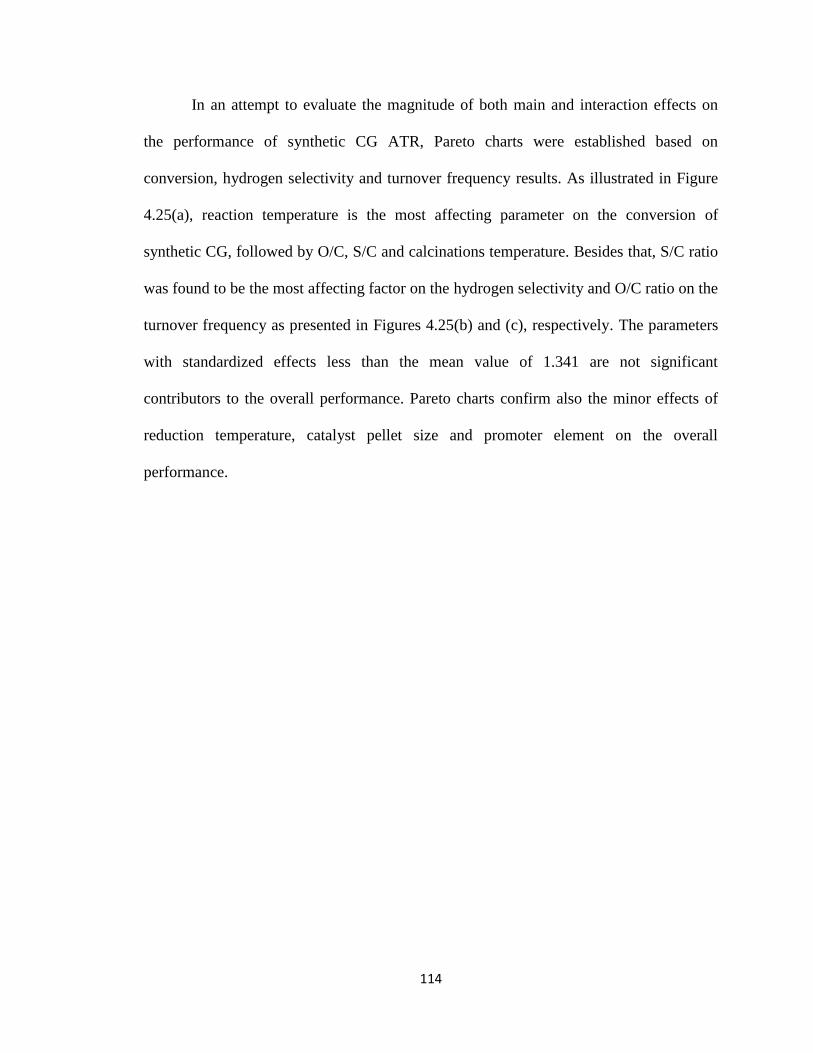
114
In an attempt to evaluate the magnitude of both main and interaction effects on
the performance of synthetic CG ATR, Pareto charts were established based on
conversion, hydrogen selectivity and turnover frequency results. As illustrated in Figure
4.25(a), reaction temperature is the most affecting parameter on the conversion of
synthetic CG, followed by O/C, S/C and calcinations temperature. Besides that, S/C ratio
was found to be the most affecting factor on the hydrogen selectivity and O/C ratio on the
turnover frequency as presented in Figures 4.25(b) and (c), respectively. The parameters
with standardized effects less than the mean value of 1.341 are not significant
contributors to the overall performance. Pareto charts confirm also the minor effects of
reduction temperature, catalyst pellet size and promoter element on the overall
performance.

115
650600550
90
75
60
700600500 1.261.090.800.55
CaGdMg
90
75
60
650600550500 3.62 .61 .6
0 .2000.1250.050
90
75
60
Calcination T (C)
Me
an
Reduction T (C) Particle size (mm)
Promoter Element Reaction T (C) S/C
O/C
Main Effects Plot for ConversionData Means
650600550
80
65
50
700600500 1.261.090.800.55
CaGdMg
80
65
50
650600550500 3.62 .61 .6
0 .2000.1250.050
80
65
50
Calcination T (C)
Me
an
Reduction T (C) Particle size (mm)
Promoter Element Reaction T (C) S/C
O/C
Main Effects Plot for SelectivityData Means
650600550
0.3
0 .2
0 .1
700600500 1.261.090.800.55
CaGdMg
0.3
0 .2
0 .1
650600550500 3.62 .61 .6
0 .2000.1250.050
0.3
0 .2
0 .1
Calcination T (C)
Me
an
Reduction T (C) Particle size (mm)
Promoter Element Reaction T (C) S/C
O/C
Main Effects Plot for TOF (1/S)Data Means
Figure 4.23 Main effects plots (a) Synthetic CG Conversion (b) Hydrogen Selectivity (c)
Turnover Frequency.
(a)
(c)
(b)

116
Figure 4.24 Interactions plots (a) Synthetic CG Conversion (b) Hydrogen Selectivity (c)
Turnover Frequency.
700
600
500
1.26
1.09
0.80
0.55
0.00
208
0.00
204
0.00
160
650
600
550
500
3.6
2.6
1.6
0.20
0
0.12
5
0.05
0
90
75
6090
75
6090
75
6090
75
6090
75
6090
75
60
Calcination T (C)
Reduction T (C)
Particle size (mm)
Reducibility (1/C)
Reaction T (C)
S/C
O/C
550
600
650
T (C)
Calcination
500
600
700
T (C)
Reduction
0.55
0.80
1.09
1.26
size (mm)
Particle
0.00160
0.00204
0.00208
(1/C)
Reducibility
500
550
600
650
T (C)
Reaction
1.6
2.6
3.6
S/C
Interaction Plot for ConversionData Means
700
600
500
1.26
1.09
0.80
0.55
0.00
208
0.00
204
0.00
160
650
600
550
500
3.6
2.6
1.6
0.20
0
0.12
5
0.05
0
80
65
50
80
65
50
80
65
50
80
65
50
80
65
50
80
65
50
Calcination T (C)
Reduction T (C)
Particle size (mm)
Reducibility (1/C)
Reaction T (C)
S/C
O/C
550
600
650
T (C)
Calcination
500
600
700
T (C)
Reduction
0.55
0.80
1.09
1.26
size (mm)
Particle
0.00160
0.00204
0.00208
(1/C)
Reducibility
500
550
600
650
T (C)
Reaction
1.6
2.6
3.6
S/C
Interaction Plot for SelectivityData Means
700
600
500
1.26
1.09
0.80
0.55
0.00
208
0.00
204
0.00
160
650
600
550
500
3.6
2.6
1.6
0.20
0
0.12
5
0.05
0
0.3
0.2
0.1
0.3
0.2
0.1
0.3
0.2
0.1
0.3
0.2
0.1
0.3
0.2
0.1
0.3
0.2
0.1
Calcination T (C)
Reduction T (C)
Particle size (mm)
Reducibility (1/C)
Reaction T (C)
S/C
O/C
550
600
650
T (C)
Calcination
500
600
700
T (C)
Reduction
0.55
0.80
1.09
1.26
size (mm)
Particle
0.00160
0.00204
0.00208
(1/C)
Reducibility
500
550
600
650
T (C)
Reaction
1.6
2.6
3.6
S/C
Interaction Plot for TOFData Means
(a) (b)
(c)

117
Figure 4.25 Pareto Charts (a) Synthetic CG Conversion (b) Hydrogen Selectivity (c)
Turnover Frequency.
B
D
C
F
E
A
G
2.01.51.00.50.0
Te
rm
Standardized Effect
1.341
A C alcination T (C )
B Reduction T (C )
C Particle size (mm)
D Promoter Element
E Reaction T (C )
F S/C
G O /C
Factor Name
Pareto Chart of the Standardized Effects(response is TOF)
C
B
A
D
E
G
F
876543210
Te
rm
Standardized Effect
1.341
A C alcination T (C )
B Reduction T (C )
C Particle size (mm)
D Promoter Element
E Reaction T (C )
F S/C
G O /C
Factor Name
Pareto Chart of the Standardized Effects(response is Selectivity)
C
B
D
A
F
G
E
876543210
Te
rm
Standardized Effect
1.341
A C alcination T (C )
B Reduction T (C )
C Particle size (mm)
D Promoter Element
E Reaction T (C )
F S/C
G O /C
Factor Name
Pareto Chart of the Standardized Effects(response is Conversion)
(a) (b)
(c)

118
4.4.2 Model Development
A regression analysis was performed to correlate the catalytic activity with the
operating parameters for the ATR of synthetic CG. Reducibility and Pore volume to
surface area ratio were also included in as significant textural property in this case. A
non-linear model was developed using NLREG software. The experimental data used to
develop the model are given in Table 4.4 along with the experimental and predicted
conversions. The model expression is given in (4.3).
–
0.2 0.54× 4.1+0.55× 4.2+60.39× 0.3 0.75× 2+63.34× 0.3
where;
a: Calcination temperature in [°C]
b: Reduction temperature in [°C]
c: Pore volume-to-Surface area ratio in [cm3/m
2]
d: Reducibility in [°C -1
]
e: Reaction temperature in [°C]
f: Steam-to-Carbon molar ratio
g: Oxygen-to-Carbon molar ratio
(4.3)

119
The average absolute deviation (AAD) was then determined based on equation
(4.4). An excellent agreement between the experimental and predicted conversions of
synthetic CG was obtained with an AAD of 3.12%. The parity chart presented in Figure
4.26 shows the plot of predicted versus experimental data.

120
Table 4.4a Experimental data for model development
Run Calcination
T (°C)
Reduction
T (°C)
PV/SA
(cm3/m
2)
Reducibility
(C-1
)
Reaction
T (°C)
S/C O/C
1 650 500 0.0019 0.00208 600 3.6 0.125
2 650 600 0.0019 0.00208 600 3.6 0.125
3 650 700 0.0019 0.00208 600 3.6 0.125
4 650 600 0.0019 0.00208 600 3.6 0.125
5 650 600 0.0019 0.00208 600 3.6 0.125
6 650 600 0.0019 0.00208 600 3.6 0.125
7 650 600 0.0019 0.00208 600 3.6 0.125
8 550 600 0.0019 0.00208 600 3.6 0.125
9 600 600 0.0019 0.00208 600 3.6 0.125
10 650 600 0.0019 0.00208 600 3.6 0.125
11 650 600 0.0017 0.00160 600 3.6 0.125
12 650 600 0.0019 0.00208 600 3.6 0.125
13 650 600 0.0029 0.00204 600 3.6 0.125
14 650 600 0.0019 0.00208 500 2.6 0.125
15 650 600 0.0019 0.00208 550 2.6 0.125
16 650 600 0.0019 0.00208 600 2.6 0.125
17 650 600 0.0019 0.00208 600 2.6 0.125
18 650 600 0.0019 0.00208 600 1.6 0.125
19 650 600 0.0019 0.00208 600 2.6 0.125
20 650 600 0.0019 0.00208 600 3.6 0.125
21 650 600 0.0019 0.00208 600 2.6 0.05
22 650 600 0.0019 0.00208 650 2.6 0.125
23 650 600 0.0019 0.00208 600 2.6 0.25

121
Table 4.4b Experimental and predicted conversions
Run
Experimental
Conversion
(mol%)
Predicted
Conversion
(mol%)
AAD
(%)
1 78.6 79.5 1.06
2 83.4 81.8 1.91
3 82.9 83.8 1.04
4 81.3 81.7 0.64
5 84.3 81.7 2.96
6 83.7 81.8 2.31
7 83.6 81.7 2.15
8 87.9 86.9 1.16
9 85.9 84.5 1.64
10 82.8 81.7 1.22
11 79.6 81.7 2.79
12 84.1 81.7 2.77
13 83.8 81.8 2.49
14 60.4 64.5 6.89
15 81.6 75.8 7.05
16 90.5 86.4 4.44
17 90.5 86.4 4.52
18 92.9 89.5 3.59
19 90.5 86.4 4.52
20 86.9 81.7 5.93
21 76.4 78.2 2.41
22 91.1 96.4 5.90
23 92.3 94.3 2.12
Average 3.12

122
Figure 4.26 Parity plot of experimental versus predicted conversion
50
60
70
80
90
100
50 60 70 80 90 100
Pre
dic
ted
Con
ver
sion
(m
ol
%)
Experimental Conversion (mol %)
AAD= 3.12 %

123
4.5 KINETICS
A kinetic study was conducted in order to investigate the behaviour of the
corresponding ATR reactions of synthetic CG at both macroscopic and microscopic
levels. The developed rate expression demonstrates the speed of change of synthetic CG
concentration in terms of the main kinetic factors applied; reaction temperature and
concentrations of reactants.
4.5.1 Heat and Mass Transport Limitations
Intrinsic kinetic data can only be collected after eliminating the effects of heat and
mass transfer resistances on the rate of the studied reactions. For this reason, a kinetic
region free of heat and mass transfer limitations was experimentally established prior to
kinetic data collection.
4.5.1.1 Effect of Pellets Size
The size of catalyst pellets were varied in the range of 0.55-1.26 mm. The
experiments were performed in a PBTR at atmospheric pressure using 5Ni/CeZrCa
catalyst. An identical set of operating conditions were applied: Treaction=600°C; S/C= 3.6;
O/C= 0.125 and W/FA0= 15.82 gcat.min/mol C. In order to ensure a plug flow behavior
inside the PBTR, the ratios of bed length to particle diameter (l/dp) and reactor diameter
to particle diameter (d/dp) were maintained at 56.3 and 15.9, respectively, after selecting
the optimum particle diameter. The variation of process performance with the size of
pellets is shown in Figure 4.27. It can be observed from the figure that synthetic CG
conversion, hydrogen selectivity and hydrogen yield results are steady within the tested
range. A conversion of around 83% and a hydrogen selectivity of around 79% were

124
obtained with invariant behavior with the change in particle size. Therefore, any particle
diameter between 0.55 and 1.26 mm is appropriate to avoid heat and mass transport
effects and carry out the kinetic study on synthetic CG ATR process. These criteria:
d/dp≥10 and l/dp≥50 must be satisfied in a PBTR to have a plug flow conditions and
avoid back mixing and channeling [Froment & Bischof (1990); Idem & Bakhshi (1996)].
Accordingly, a particle diameter of 0.8 mm was selected.

125
1.261.090.800.55
100
80
60
40
20
0
Particle size (mm)
Co
nv
ersio
n (
mo
l %
)
Synthetic CG Conversion
1.261.090.800.55
100
80
60
40
20
0
Particle size (mm)
Hy
dro
ge
n S
ele
ctiv
ity
(m
ol %
)
Hydrogen Selectivity (mol %)
1.261.090.800.55
2.0
1.5
1.0
0.5
0.0
Particle size (mm)
Yie
ld (
mo
l H
2/
mo
l C
)
Hydrogen Yield
Figure 4.27 Effects of catalyst pellets size on the activity (a) Synthetic CG Conversion (b)
Hydrogen Selectivity (c) Hydrogen Yield
(a) (b)
(c)

126
4.5.1.2 Effect of Flow Rate
Besides the size of catalyst particles, the inlet flow rate was also varied in the
range of 0.15-0.25 ml/min in order to ensure the absence of heat and mass transfer
limitations on the rates of synthetic CG ATR reactions. The reactions were carried out at
a lower S/C ratio than the 3.6 ratio applied with the particle size experiments. The reason
was to provide higher carbon flow rates and make sure the rate of reaction is not affected
by the dilute stream. The reactions were carried out at 600°C temperature and
atmospheric pressure in the same PBTR. The ratios of S/C and O/C were maintained at
2.6 and 0.125, respectively. A fixed amount of 0.25 grams of 5Ni/CeZrCa (dp= 0.8 mm)
catalyst was employed in each run. The overall performance of the synthetic CG ATR
reactions is presented in Figure 4.28. A conversion of around 90% and a hydrogen
selectivity of around 70% were obtained within the tested range of flow rates.
Consequently, the rate of synthetic CG ATR reactions is invariant to feed flow rate in the
range of 0.15-0.25 ml/min, and any rate within this region is adequate to be utilized for
intrinsic kinetic data collection. Tsipouriari & Verykios (2001) followed a similar
experimental procedure to conduct their kinetic study on CO2 reforming of methane using
Ni/La2O3 catalyst.
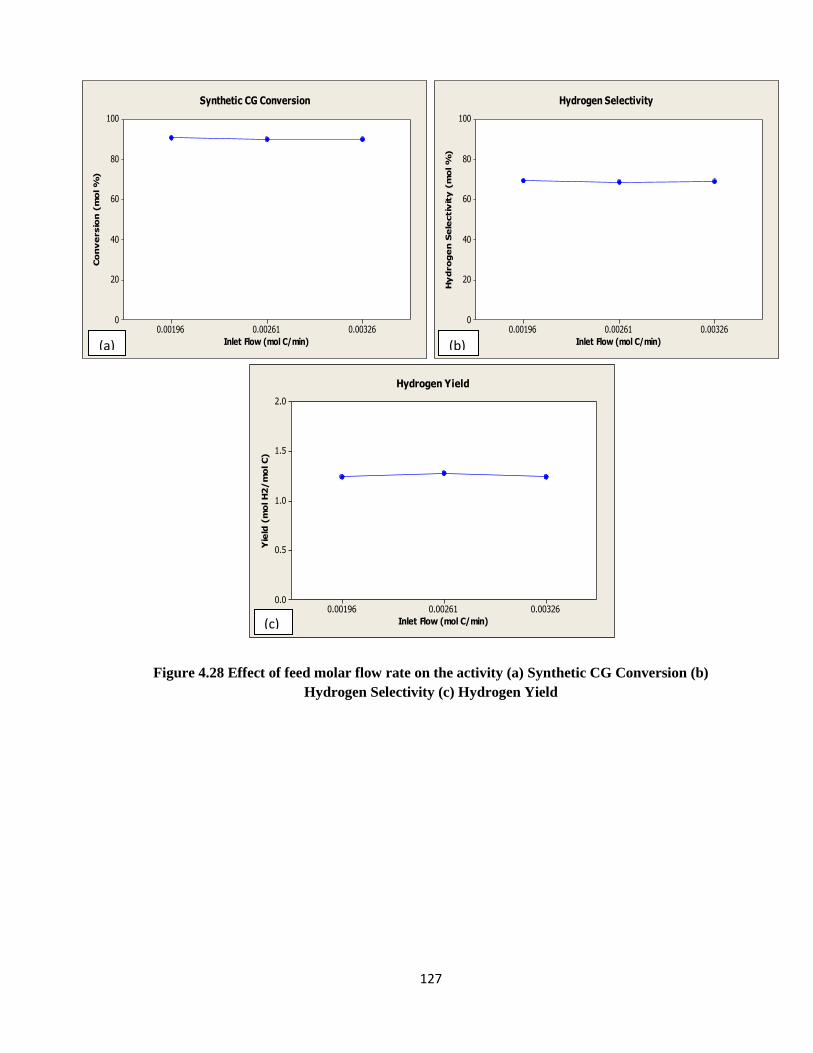
127
0.003260.002610.00196
100
80
60
40
20
0
Inlet Flow (mol C/min)
Co
nv
ersio
n (
mo
l %
) Synthetic CG Conversion
0.003260.002610.00196
100
80
60
40
20
0
Inlet Flow (mol C/min)
Hy
dro
ge
n S
ele
ctiv
ity
(m
ol %
)
Hydrogen Selectivity
0.003260.002610.00196
2.0
1.5
1.0
0.5
0.0
Inlet Flow (mol C/min)
Yie
ld (
mo
l H
2/
mo
l C
)
Hydrogen Yield
Figure 4.28 Effect of feed molar flow rate on the activity (a) Synthetic CG Conversion (b)
Hydrogen Selectivity (c) Hydrogen Yield
(a) (b)
(c)

128
4.5.2 Extended TOS Stability
An extended period experiment was performed for the ATR of synthetic CG to
check the stability of 5Ni/CeZrCa catalyst. The results of conversion, hydrogen
selectivity and turnover frequency are given Figure 4.29. A stable performance was
observed with an average conversion of ~ 85 mol%; hydrogen selectivity of ~ 73% and
turnover frequency of ~0.14 s-1
under the prevailing conditions. The activity of the
catalyst was observed to ascend with time due probably to the accumulation of NaCl and
KCl salts in the reaction media, thus suppressing coke formation over the surface of
catalyst. This is clear from the increasing trends of conversion, hydrogen selectivity and
turnover frequency presented in Figures 4.29. I-control charts were then established to
assess whether the process is under control or not. The center line represents the overall
average of the process along with two control limit . As seen from Figure 4.30(a)
and (b), the first point of conversion results was the only observation that failed to pass
the control test, since the corresponding value was less than . This was expected
since it takes more than an hour for the system to reach steady state. Besides this point,
the last point from turnover frequency results was also beyond the control limits, most
likely due to the promoted performance of catalyst and/or the refill of the syringe pump
after 10 hours. Unlike the conventional catalysts and their deactivation with time, I-charts
illustrate the enhanced activity of 5Ni/CeZrCa catalyst for the ATR of synthetic CG
process.

129
Figure 4.29 Long term stability run for synthetic CG ATR over 5Ni/CeZrCa catalyst at
S/C= 3.6; O/C= 0.125; reaction T= 600°C and W/FA0= 2.64 gcat. h/mol C.
0
20
40
60
80
100
0 2 4 6 8 10 12 14 16
Co
nv
ersi
on
(m
ol%
)
TOS (h)
Synthetic CG Conversion
0
20
40
60
80
100
0 2 4 6 8 10 12 14 16
H2 S
elec
tiv
ity
(m
ol%
)
TOS (h)
Hydrogen Selectivity
0
0.05
0.1
0.15
0.2
0 2 4 6 8 10 12 14 16
TO
F (
1/s
)
TOS (h)
Turnover Frequency

130
1413121110987654321
95
90
85
80
75
70
Observation
Ind
ivid
ua
l V
alu
e _X=85.28
UCL=93.66
LCL=76.91
1
I Chart of Conversion
1413121110987654321
0.16
0.15
0.14
0.13
0.12
0.11
Observation
Ind
ivid
ua
l V
alu
e
_X=0.13923
UCL=0.15159
LCL=0.12688
1
1
I Chart of Turover Frequency
Figure 4.30 I-Control charts of conversion (a) and turnover frequency (b).

131
4.5.3 Mass Distribution
A material balance was conducted around the reformer in order to investigate the
mass distribution in the system. The law of mass conservation allows us to quantify the
carbon deposited over the walls of the PBTR and study the compatibility of the
experimental measurements with the predicted ones. The analyses of carbon in the
system presented in Figure 4.31 were performed as follows:
• Carbon in the gas phase was analyzed in ITC labs using an online GC/TCD (Agilent
6890) equipped with Hayesep Q and Molecular Sieve A columns.
• Carbon deposited over the catalyst was analyzed in ITC labs using TGA-50
(Shimadzu) instrument via TPO analysis.
• Carbon in the liquid phase was analyzed by Loring Laboratories LTD. (Calgary, AB)
according to ASTM D5373 standard method.
The law of mass conservation states that:
(4.5)
Therefore;
(4.6)
The inlet flow of carbon was determined based on the carbon content of the various
chemicals used in synthetic CG preparation.

132
The difference between the measured carbon in the outlet streams and the inlet carbon in
the feed is the carbon deposited over walls of the reactor, besides the possible errors in
measurements.
The distribution of carbon in the different streams was analyzed as mentioned before;
Therefore;
0.041
The carbon in the liquid phase was measured by a total carbon analysis (TOC)
given in Appendix D. The carbon deposited over the walls of the reactor was found as the
difference between inlet carbon and the carbon analyzed in the liquid, gas and over the
catalyst surface. As can be seen from Table 4.5, the majority of carbon goes into the gas
phase as carbon dioxide and methane gases; however the amount of carbon deposited
over the catalyst was very low. This justifies the stable and enhanced performance of
5Ni/CeZrCa catalyst.

133
Table 4.5 Carbon distribution in the system (basis: 1 hour of operations)
Stream Mass of Carbon (g) Carbon Percentage (wt%)
Effluent Gas 1.32 94.06
Liquid Condensate 0.042 2.99
Catalyst surface 0.00024 0.017
Reactor walls 0.041 2.93

134
Figure 4.31 Carbon balance around the reformer

135
4.5.4 Results of Kinetics Experiments
The reaction kinetics of synthetic CG autothermal reforming over 5Ni/CeZrCa
catalyst was investigated in a PBTR at atmospheric pressure. Four kinetic controlled
factors were varied, (1) reaction temperature, (2) weight space velocity W/FA0, (3) steam-
to-carbon ratio, and (4) oxygen-to-carbon ratio. Four operating temperatures of 500, 550,
600 and 650°C were applied. Weight space time (W/FA0) was varied between 0-127.4
gcat.min/ mol C at six different levels. This was achieved by employing different catalyst
weights of 0, 0.05, 0.1, 0.15, 0.2 and 0.25 grams. Steam-to-carbon ratio was varied
between 1.6-3.6 at three different O/C ratios of 0.05, 0.125 and 0.2. The variations of
conversion results at different S/C and O/C were presented above in Figure 4.21. The
variations of conversion with respect to weight space time (W/FA0) at different reaction
temperatures are given in Figure 4.32.
It is clear that the conversion of synthetic CG increased with increasing O/C ratio,
reaction temperature and weight space time (W/FA0). However, it decreased with
increasing the S/C ratio in the inlet feed. Figure 4.33 shows the variations of experimental
conversion versus W/FA0 at different reaction temperatures. The integral method of
kinetic analysis discussed by [Froment et al. (1990); Fogler (2011)] was then applied to
develop a rate expression for the ATR reactions of synthetic CG.

136
Figure 4.32 (a) Conversion variations with W/FA0 at different reaction temperatures
(500 and 550°C)
0
20
40
60
80
0 1 2 3 4 5 6
Co
nv
ersi
on
(m
ol
%)
TOS (h)
T= 500 °C
W/FA0=127.4 gcat.min/mol C
W/FA0=101.9 gcat.min/mol C
W/FA0=76.4 gcat.min/mol C
W/FA0=50.9 gcat.min/mol C
W/FA0=12.7 gcat.min/mol C
W/FA0=0.0 gcat.min/mol C
0
20
40
60
80
100
0 1 2 3 4 5 6
Co
nv
ersi
on
(m
ol%
)
TOS (h)
T= 550 °C
W/FA0= 127.4 gcat.min/mol C
W/FA0= 101.9 gcat.min/mol C
W/FA0= 76.4 gcat.min/mol C
W/FA0= 50.9 gcat.min/mol C
W/FA0= 12.7 gcat.min/mol C
W/FA0= 0.0 gcat.min/mol C

137
Figure 4.32 (b) Conversion variations with W/FA0 at different reaction temperatures
(600 and 650°C)
0
20
40
60
80
100
0 1 2 3 4 5 6
Co
nv
ersi
on
(m
ol%
)
TOS (h)
T= 600 °C
W/FA0= 127.4 gcat.min/mol C
W/FA0= 101.9 gcat.min/mol C
W/FA0= 76.4 gcat.min/mol C
W/FA0= 50.9 gcat.min/mol C
W/FA0= 12.7 gcat.min/mol C
W/FA0= 0.0 gcat.min/mol C
0
20
40
60
80
100
0 1 2 3 4 5 6
Co
nv
ersi
on
(m
ol
%)
TOS (h)
T= 650 °C
W/FA0= 127.4 gcat.min/mol C
W/FA0= 101.9 gcat.min/mol C
W/FA0= 76.4 gcat.min/mol C
W/FA0= 50.9 gcat.min/mol C
W/FA0= 12.7 gcat.min/mol C
W/FA0= 0.0 gcat.min/mol C

138
Figure 4.32 (c) Conversion of synthetic CG versus W/FA0
y = -0.0014x2 + 0.343x + 70.669
R² = 0.9989
y = -0.0014x2 + 0.3966x + 62.114
R² = 0.9917
y = -0.0017x2 + 0.4704x + 48.85
R² = 0.9967
y = -0.0005x2 + 0.2135x + 41.352
R² = 0.9862
30
40
50
60
70
80
90
100
0 20 40 60 80 100 120 140
Co
nv
ersi
on
(m
ol%
)
W/FA0 (gcat.min/mol C)
T= 650 C
T= 600 C
T= 550 C
T= 500 C

139
4.5.5 Rate Model
A power law model was proposed for the rate of synthetic CG ATR reactions.
This kind of rate expressions is widely applied in the field of reaction engineering and
can accurately predict the rate values. Nonetheless, generating a mechanistic model was
always preferred due to its accountability for the pathways followed by the corresponding
chemical reactions. Discovering the true reaction mechanism gives a deep understanding
of the process, and thus improves the efficiency of designing and controlling tasks.
However, it is incredibly hard to determine a reaction mechanism in the case of crude
hydrocarbon reforming, because according to Parmar et al. (2010), such systems include
thousands of different reactions of hydrogenation/dehydrogenation, cracking,
isomerization, hydrogenolysis and hydrocyclisation. In our study about the ATR of
synthetic CG, several chemical species were involved, namely, (1) free glycerol, (2)
methanol, (3) 2-propanol, (4) oxygen, and (5) steam. These compounds and others such
as NaCl, KCl, oleic acid and soap, were all present in the inlet feed to the reformer.
Accordingly, an overall reaction given in (4.7) was suggested for the ATR of synthetic
CG and a power law expression was developed. In this case of the synthetic feed, coming
up with a mechanistic model for reaction kinetics was very hard due to the complexity of
reactions and large number of reactants. For the sake of simplicity, a power law model
was then proposed.
(4.7)

140
Where; the stoichiometric coefficients (a,b,c & d) are strong functions of operating
conditions. Tables 4.6 lists the corresponding values of a,b,c and d for the kinetic runs
based on the experimental observations at different conditions.

141
Table 4.6 Reaction stoichiometries at different operating conditions
Run S/C O/C T (K)
W/FA0
(gcat.min/
mol C)
a b c d
1 2.6 0.125 773 12.71 6.5 0.625 3.25 5.75
2 2.6 0.125 773 50.97 6.5 0.625 3.25 5.75
3 2.6 0.125 773 76.47 6.5 0.625 3.25 5.75
4 2.6 0.125 773 101.94 6.5 0.625 3.25 5.75
5 2.6 0.125 823 12.71 6.5 0.625 3.25 5.75
6 2.6 0.125 823 50.97 6.5 0.625 3.25 5.75
7 2.6 0.125 823 76.47 6.5 0.625 3.25 5.75
8 2.6 0.125 823 101.94 6.5 0.625 3.25 5.75
9 2.6 0.125 873 12.71 6.5 0.625 3.25 5.75
10 2.6 0.125 873 50.97 6.5 0.625 3.25 5.75
11 2.6 0.125 873 76.47 6.5 0.625 3.25 5.75
12 2.6 0.125 873 101.94 6.5 0.625 3.25 5.75
13 2.6 0.125 923 12.71 6.5 0.625 3.25 5.75
14 2.6 0.125 923 50.97 6.5 0.625 3.25 5.75
15 2.6 0.125 923 76.47 6.5 0.625 3.25 5.75
16 2.6 0.125 923 101.94 6.5 0.625 3.25 5.75
17 1.6 0.05 873 96.86 4 0.25 4 2.5
18 2.6 0.05 873 127.42 6.5 0.25 4 5
19 3.6 0.05 873 158.23 9 0.25 4 7.5
20 1.6 0.125 873 96.86 4 0.625 3.25 3.25
21 2.6 0.125 873 127.42 6.5 0.625 3.25 5.75
22 3.6 0.125 873 158.23 9 0.625 3.25 8.25
23 1.6 0.2 873 96.86 4 1 2.5 4
24 2.6 0.2 873 127.42 6.5 1 2.5 6.5
25 3.6 0.2 873 158.23 9 1 2.5 9

142
An empirical, reversible power law model can then be written as:
(4.8)
Here, A= synthetic CG; B= steam; C= oxygen;
rA= rate of reaction with respect to synthetic CG, mol C gcat-1
min-1
k0: frequency or collision factor, mol C gcat-1
min-1
atm-(x+y+z)
EA: activation energy, kJ mol-1
T: reaction temperature, K
R: molar gas constant, 8.314 J mol-1
K-1
PA: partial pressure of Synthetic CG, atm
PB: partial pressure of steam, atm
PC: partial pressure of oxygen, atm
x: reaction order with respect to A
y: reaction order with respect to B
z: reaction order with respect to C

143
4.5.6 Estimation and Validation of Model Parameters
Experimental conversion data were used to estimate the parameters of the power
law model. In line with a study by Parmar et al. (2010), an integral analysis was
performed to obtain the outlet flow of reactants based on the minimization of squared
sum of residuals (SSE). The change of synthetic crude glycerol flow along the height of
PBTR can be written as:
(4.9)
Where;
FA: flow rate of synthetic CG, mol min-1
W: weight of catalyst, g
ρ: density of catalyst, g ml-1
A´: cross sectional area, cm2
z: axial direction inside the PBTR
Therefore;
(4.10)
Where;
: outlet flow of synthetic CG for the ith
run, mol min-1
: inlet flow of synthetic CG for the ith
run, mol min-1

144
The regression analysis was done using PLKA software developed by our group.
A modified genetic algorithm was applied to get to the best estimates of parameters based
on the least deviation between experimental and predicted outlet flow of synthetic CG.
Then, the predicted conversion for each run was obtained based on this formula:
Where; (i) always corresponds to the number of the specific run.
After that, the individual error of each experiment was calculated as follows:
The average absolute deviation is given by:
The results of regression are given in Tables 4.7 and 4.8. An excellent agreement
between the experimental and predicted conversions was obtained with 5.2% average
absolute deviation (AAD).

145
Table 4.7 Estimation results of model parameters
Parameter Value
K0 2.09 x 10¹¹
[mol C gcat-1
min-1
atm-3.46
]
EA 9.37 x 10⁴
[kJ mol-1
]
x 1.05
y 0.56
z 1.85
AAD 5.2%
Figure 4.33 Parity plot of predicted data versus experimental data

146
Table 4.8 Experimental Kinetic data with the predicted conversion results
Run T
(K)
W/FA0
(gcat.min/
mol C)
Psynthetic
CG *102
(atm)
P
steam
(atm)
Poxygen
*102
(atm)
Pnitrogen
(atm)
Experimental
Conversion
(mol%)
Predicted
Conversion
(mol%)
AAD
(%)
1 773 12.71 9.48 0.61 5.87 0.23 45.25 38.00 16.11
2 773 50.97 9.48 0.61 5.87 0.23 50.15 60.12 19.90
3 773 76.47 9.48 0.61 5.87 0.23 55.34 65.71 18.75
4 773 101.94 9.48 0.61 5.87 0.23 56.99 69.34 21.66
5 823 12.71 9.48 0.61 5.87 0.23 55.65 52.53 5.60
6 823 50.97 9.48 0.61 5.87 0.23 68.83 71.61 4.03
7 823 76.47 9.48 0.61 5.87 0.23 74.09 75.96 2.53
8 823 101.94 9.48 0.61 5.87 0.23 79.38 78.70 0.87
9 873 12.71 9.48 0.61 5.87 0.23 65.03 64.08 1.40
10 873 50.97 9.48 0.61 5.87 0.23 79.15 79.51 0.40
11 873 76.47 9.48 0.61 5.87 0.23 84.77 82.83 2.32
12 873 101.94 9.48 0.61 5.87 0.23 88.46 84.48 4.54
13 923 12.71 9.48 0.61 5.87 0.23 74.85 72.70 2.93
14 923 50.97 9.48 0.61 5.87 0.23 84.29 84.95 0.78
15 923 76.47 9.48 0.61 5.87 0.23 88.82 100 12.61
16 923 101.94 9.48 0.61 5.87 0.23 90.16 91.23 1.14
17 873 96.86 16.11 0.64 3.99 0.16 78.93 78.63 0.34
18 873 127.42 11.52 0.74 2.85 0.11 76.43 76.21 0.24
19 873 158.23 8.95 0.79 2.22 0.08 73.45 73.42 0.10
20 873 96.86 12.39 0.49 7.68 0.30 92.45 88.72 4.08
21 873 127.42 9.48 0.61 5.87 0.23 90.54 86.50 4.42
22 873 158.23 7.67 0.68 4.59 0.19 86.94 85.24 1.91
23 873 96.86 10.07 0.39 9.99 0.39 94.56 94.39 0.22
24 873 127.42 8.07 0.52 7.99 0.32 92.32 89.84 2.66
25 873 158.23 6.72 0.60 6.66 0.26 88.42 88.82 0.48
Average 5.2

147
Finally, it is clear that the predicted conversions match extremely well with the
experimental values. The developed rate expression is valid at atmospheric pressure and
in a temperature range of 773-923 K; S/C range of 1.6-3.6; O/C range of 0.05-0.2; and
W/FA0 range of 0-158.23 gcat.min/ mol C. The final rate model can be written as:

148
CHAPTER 5
CONCLUSIONS AND RECOMMENDATIONS
5.1 CONCLUCIONS
A set of ternary metal oxide catalysts having a nominal composition of
5Ni/CeZrM (where M= Ca, Gd, Mg) was prepared, characterized and tested for the
autothermal reforming of synthetic CG. The catalysts were prepared using the surfactant
assisted method and nickel was impregnated according to the wet impregnation
technique. The catalyst containing calcium promoter element exhibited the highest
activity with a conversion of 84.5% and hydrogen selectivity of 79.7%. Synthetic CG
composed of free glycerol, methanol, soap, FFA, water and ashes was utilized in this
study. The individual effects of these components were investigated by adding them
separately to the feed mixture. Ashes composed of NaCl and KCl, showed a positive
effect on the catalytic performance.
In order to investigate the relationship between the observed activity and the
structure of the catalyst, several characterization techniques were applied on the prepared
supports and catalysts. These techniques include TGA, TPR, TPO, N2 physisorption,
XRD and ICP-MS analyses. The results of structure activity relationship (SAR) revealed
that the catalytic activity in the case of synthetic CG ATR process is mostly affected by
the reducibility and Ni dispersion properties of the catalyst.
Several variables at the level of catalyst preparation and operating conditions
were varied in order to optimize the process. Calcination temperature was varied in a
range of 550-650°C, reduction temperature was varied in the range of 500-700°C,

149
catalyst pellets size was varied in the range of 0.55-1.26 mm, volumetric flow rate was
varied in the range of 0.15-0.25 ml/min, reaction temperature was varied in the range of
500-650°C and, S/C and O/C ratios were varied in the ranges of 1.6-3.6 and 0.05-2.0,
respectively. All screening experiments were conducted in a lab scale PBTR at
atmospheric pressure. An increase in catalytic activity was observed with a decrease in
calcination temperature from 650 to 550°C. A temperature of 600 °C was enough to
activate the catalyst prior to screen its performance. Thus calcination and reduction
temperatures of 550 and 600°C were selected for further parametric studies, respectively.
In addition, S/C ratio was revealed to have a significant effect on process
performance. At a constant O/C ratio of 0.05, hydrogen selectivity increased from 78.7 to
89.2 mol% with an increase in S/C from 1.6 to 3.6; however synthetic CG conversion
decreased from 78.9 to 73.4 mol%. On the other hand, increasing O/C ratio from 0.05 to
0.2 showed a negative effect on hydrogen selectivity and turnover frequency that
decreased from 89.2 to 54.3 mol% and from 0.29 to 0.1 s-1
, respectively, at a fixed S/C of
3.6. Coke formation over catalyst surface was observed to become negligible at S/C and
O/C ratios greater than 2.6 and 0.125, respectively. Again, hydrogen selectivity, turnover
frequency and synthetic CG conversion increased with an increase in reaction
temperature from 550 to 650°C, but this increase was completely insignificant with a
considerable amount of carbon depositions at reaction temperatures beyond 600°C.
Therefore, the optimum reaction temperature, S/C and O/C ratios selected based on
conversion, hydrogen selectivity, turnover frequency and coke formation criteria were
550°C, 2.6 and 0.125, respectively.

150
A statistical analysis was then conducted to investigate the main effects and
interactions among the different operating parameters. The results revealed that reaction
temperature is the most affecting parameter on the conversion of synthetic CG, followed
by O/C, S/C and calcinations temperature. S/C and O/C ratios were the most effective in
terms of hydrogen selectivity. O/C and calcination temperature were the most effective
based on turnover frequency results. Overall, the results from analysis of variances
(ANOVA) showed that reaction temperature, S/C, O/C and calcination temperatures are
the most significant parameters in the process. A nonlinear mathematical model was then
developed to express the conversion of synthetic CG in terms of the different operating
parameters.
In order to collect intrinsic data for the kinetic study, an operating region free of
heat and mass transfer limitations was experimentally established. The stability of
5Ni/CeZrCa catalyst was then confirmed via an extended TOS run for a period of 15
hours. The mass distribution in the process was also studied by a carbon material balance
around the reactor. The carbon content of outlet streams was experimentally measured
using different techniques. The majority of carbon in the inlet feed was found to move
into the gas phase with a negligible deposition over the catalyst surface. A power law
model was then suggested for the rate expression. An integral analysis for reaction
kinetics was applied to estimate the parameters of the model. The activation energy was
found to be 93.7 kJ/mol; along with reaction orders of 1, 0.5 and 2 with respect to
synthetic crude glycerol, steam and oxygen, respectively. The predicted conversion
values were in an excellent agreement the experimental conversion results with an AAD
of 5.2%.

151
5.2 RECOMMENDATIONS
Based on the scope of this research work, it is recommended that:
A crude glycerol feed collected directly from biodiesel operations should be
tested at the optimum conditions obtained from this study.
A steam-to-carbon ratio of more than 2.6 would be more desirable in case of real
crude glycerol that contains more impurities and might yield more depositions.
Reactor modeling and simulations should be performed using software such as
Aspen or COMSOL Multiphysics.
The process should be tested at a pilot scale for further confirmation on its
performance and efficiency.

152
REFERENCES
1. Adhikari, S., Fernando, S. D., & Haryanto, A. (2009). Hydrogen production from
glycerol: An update. Energy Conversion and Management, 50(10), 2600-2604.
2. Adhikari, S., Fernando, S. D., & Haryanto, A. (2009). Kinetics and reactor
modeling of hydrogen production from glycerol via steam reforming process over
Ni/CeO2 catalysts. Chemical engineering & technology, 32(4), 541-547.
3. Adhikari, S., Fernando, S. D., To, S. F., Bricka, R. M., Steele, P. H., & Haryanto,
A. (2008). Conversion of glycerol to hydrogen via a steam reforming process over
nickel catalysts. Energy & Fuels, 22(2), 1220-122
4. Adhikari, S., Fernando, S., Gwaltney, S. R., Filip To, S. D., Mark Bricka, R.,
Steele, P. H., & Haryanto, A. (2007). A thermodynamic analysis of hydrogen
production by steam reforming of glycerol. International Journal of Hydrogen
Energy, 32(14), 2875-2880.
5. Ahmed, S., & Krumpelt, M. (2001). Hydrogen from hydrocarbon fuels for fuel
cells. International Journal of Hydrogen Energy, 26(4), 291-301.
6. Akpan, E., Akande, A., Aboudheir, A., Ibrahim, H., & Idem, R. (2007).
Experimental, kinetic and 2-D reactor modeling for simulation of the production
of hydrogen by the catalytic reforming of concentrated crude ethanol (CRCCE)
over a Ni-based commercial catalyst in a packed-bed tubular reactor. Chemical
engineering science, 62(12), 3112-3126.
7. Akpan, E., Sun, Y., Kumar, P., Ibrahim, H., Aboudheir, A., & Idem, R. (2007).
Kinetics, experimental and reactor modeling studies of the carbon dioxide
reforming of methane (CDRM) over a new Ni/CeO2–ZrO2 catalyst in a packed
bed tubular reactor. Chemical engineering science, 62(15), 4012-4024.
8. Albright, L. F., Crynes, B. L., & Corcoran, W. H. (1983). Pyrolysis, theory and
industrial practice.
9. Authayanun, S., Arpornwichanop, A., Paengjuntuek, W., & Assabumrungrat, S.
(2010). Thermodynamic study of hydrogen production from crude glycerol
autothermal reforming for fuel cell applications. International Journal of
Hydrogen Energy, 35(13), 6617-6623.
153
10. Ayoub, M., & Abdullah, A. Z. (2012). Critical review on the current scenario and
significance of crude glycerol resulting from biodiesel industry towards more
sustainable renewable energy industry. Renewable and Sustainable Energy
Reviews, 16(5), 2671-2686.
11. Bartels, J. R., Pate, M. B., & Olson, N. K. (2010). An economic survey of
hydrogen production from conventional and alternative energy sources.
International journal of hydrogen energy, 35(16), 8371-8384.
12. Bournay, L., Casanave, D., Delfort, B., Hillion, G., & Chodorge, J. A. (2005).
New heterogeneous process for biodiesel production: A way to improve the
quality and the value of the crude glycerin produced by biodiesel plants. Catalysis
Today, 106(1), 190-192.
13. Buffoni, I. N., Pompeo, F., Santori, G. F., & Nichio, N. N. (2009). Nickel
catalysts applied in steam reforming of glycerol for hydrogen production.
Catalysis Communications, 10(13), 1656-1660.
14. Cavendish, H. (1766). Three Papers, Containing Experiments on Factitious Air,
by the Hon. Henry Cavendish, FRS. Royal Society of London Philosophical
Transactions Series I, 56, 141-184.
15. Chen, H., Ding, Y., Cong, N. T., Dou, B., Dupont, V., Ghadiri, M., & Williams,
P. T. (2011). A comparative study on hydrogen production from steam-glycerol
reforming: thermodynamics and experimental. Renewable Energy, 36(2), 779-
788.
16. Cheng, C. K., Foo, S. Y., & Adesina, A. A. (2010). Glycerol Steam Reforming
over Bimetallic Co− Ni/Al2O3. Industrial & Engineering Chemistry Research,
49(21), 10804-10817.
17. Chhetri, A. B., Watts, K. C., & Islam, M. R. (2008). Waste cooking oil as an
alternate feedstock for biodiesel production. Energies, 1(1), 3-18.
18. Chi, Z., Pyle, D., Wen, Z., Frear, C., & Chen, S. (2007). A laboratory study of
producing docosahexaenoic acid from biodiesel-waste glycerol by microalgal
fermentation. Process Biochemistry, 42(11), 1537-1545.

154
19. Chiodo, V., Freni, S., Galvagno, A., Mondello, N., & Frusteri, F. (2010).
Catalytic features of Rh and Ni supported catalysts in the steam reforming of
glycerol to produce hydrogen. Applied Catalysis A: General, 381(1), 1-7.
20. Chisti, Y. (2007). Biodiesel from microalgae. Biotechnology advances, 25(3),
294-306.
21. Czernik, S., French, R., Feik, C., & Chornet, E. (2002). Hydrogen by catalytic
steam reforming of liquid byproducts from biomass thermoconversion processes.
Industrial & Engineering Chemistry Research, 41(17), 4209-4215.
22. Dauenhauer, P. J., Salge, J. R., & Schmidt, L. D. (2006). Renewable hydrogen by
autothermal steam reforming of volatile carbohydrates. Journal of Catalysis,
244(2), 238-247.
23. Davda, R. R., Shabaker, J. W., Huber, G. W., Cortright, R. D., & Dumesic, J. A.
(2005). A review of catalytic issues and process conditions for renewable
hydrogen and alkanes by aqueous-phase reforming of oxygenated hydrocarbons
over supported metal catalysts. Applied Catalysis B: Environmental, 56(1), 171-
186.
24. Deleplanque, J., Dubois, J. L., Devaux, J. F., & Ueda, W. (2010). Production of
acrolein and acrylic acid through dehydration and oxydehydration of glycerol
with mixed oxide catalysts. Catalysis Today, 157(1), 351-358.
25. Di Cosimo, J. I., Dıez, V. K., Xu, M., Iglesia, E., & Apesteguıa, C. R. (1998).
Structure and surface and catalytic properties of Mg-Al basic oxides. Journal of
Catalysis, 178(2), 499-510.
26. Dou, B., Dupont, V., Williams, P. T., Chen, H., & Ding, Y. (2009).
Thermogravimetric kinetics of crude glycerol. Bioresource technology, 100(9),
2613-2620.
27. Douette, A. M., Turn, S. Q., Wang, W., & Keffer, V. I. (2007). Experimental
investigation of hydrogen production from glycerin reforming. Energy & Fuels,
21(6), 3499-3504.
28. Dyer, J. A., Vergé, X. P. C., Desjardins, R. L., Worth, D. E., & McConkey, B. G.
(2010). The impact of increased biodiesel production on the greenhouse gas

155
emissions from field crops in Canada. Energy for Sustainable Development,
14(2), 73-82.
29. Encyclopædia Britannica. 2007. Encyclopædia Britannica Online. 24 July 2007.
30. Fogler, H. S. (2010). Essentials of chemical reaction engineering. Pearson
Education (Ch.7).
31. Froment, G. F., & Bischoff, K. B. (1990). Chemical Reactor Analysis and Design.
2nd ed. New York: Wiley.
32. Glycerin Market Analysis, ABG, Inc. for the U.S. Soybean Export Council
(2007). Available at: http://www.glycosbio.com/partners/biodiesel-producers/
[accessed on 10 April 2014]
33. International Panel on Climate Change (IPCC), 2014.
34. Guo, J., Lou, H., & Zheng, X. (2007). The deposition of coke from methane on a
Ni/MgAl< sub> 2</sub> O< sub> 4</sub> catalyst. Carbon, 45(6), 1314-1321.
35. Gutiérrez Ortiz, F. J., Ollero, P., & Serrera, A. (2011). Thermodynamic analysis
of the autothermal reforming of glycerol using supercritical water. International
Journal of Hydrogen Energy, 36(19), 12186-12199.
36. Gutiérrez Ortiz, F. J., Ollero, P., Serrera, A., & Galera, S. (2012). Process
integration and exergy analysis of the autothermal reforming of glycerol using
supercritical water. Energy, 42(1), 192-203.
37. Hammett, L. P., & Deyrup, A. J. (1932). A series of simple basic indicators. I.
The acidity functions of mixtures of sulfuric and perchloric acids with water1.
Journal of the American Chemical Society, 54(7), 2721-2739.
38. Hansen, C. F.; Hernandez, A.; Mullan, B. P.; Moore, K.; Trezona-Murray, M.;
King, R. H.; Pluske, J. R. A Chemical Analysis of Samples of Crude Glycerol
from the Production of Biodiesel in Australia, and the Effects of Feeding Crude
Glycerol to Growing- Finishing Pigs on Performance, Plasma Metabolites and
Meat Quality at Slaughter. Anim. Product. Sci. 2009, 49, 154−161
39. Hardiman, K. M., Cooper, C. G., Adesina, A. A., & Lange, R. (2006). Post-
mortem characterization of coke-induced deactivated alumina-supported Co–Ni
catalysts. Chemical engineering science, 61(8), 2565-2573.

156
40. Hill, J., Nelson, E., Tilman, D., Polasky, S., & Tiffany, D. (2006). Environmental,
economic, and energetic costs and benefits of biodiesel and ethanol biofuels.
Proceedings of the National Academy of Sciences, 103(30), 11206-11210.
41. Hirai, T., Ikenaga, N. O., Miyake, T., & Suzuki, T. (2005). Production of
hydrogen by steam reforming of glycerin on ruthenium catalyst. Energy & Fuels,
19(4), 1761-1762
42. Hoffmann, P. (2012). Tomorrow's energy: hydrogen, fuel cells, and the prospects
for a cleaner planet. MIT press.
43. Holladay, J. D., Hu, J., King, D. L., & Wang, Y. (2009). An overview of
hydrogen production technologies. Catalysis Today, 139(4), 244-260.
44. Hu, S., Luo, X., Wan, C., & Li, Y. (2012). Characterization of crude glycerol
from biodiesel plants. Journal of agricultural and food chemistry, 60(23), 5915-
5921
45. Ibrahim, H. H., & Idem, R. O. (2006). Kinetic studies of the partial oxidation of
isooctane for hydrogen production over a nickel–alumina catalyst. Chemical
engineering science, 61(17), 5912-5918.
46. Ibrahim, H. H., & Idem, R. O. (2008). Single and mixed oxide-supported nickel
catalysts for the catalytic partial oxidation reforming of gasoline. Energy & Fuels,
22(2), 878-891.
47. Idem, R. O., & Bakhshi, N. N. (1996). Kinetic modeling of the production of
hydrogen from the methanol-steam reforming process over Mn-promoted
coprecipitated Cu-Al catalyst. Chemical Engineering Science, 51(14), 3697-3708.
48. Idem, R., Khan, A.M., Saha, B. (2012) Sulphur Tolerant Catalysts for Hydrogen
Production by carbon dioxide reforming of methane rich gas, WIPO 2012/167351
A1.
49. Iriondo, A., Barrio, V. L., Cambra, J. F., Arias, P. L., Guemez, M. B., Sanchez-
Sanchez, M. C., ... & Fierro, J. L. G. (2010). Glycerol steam reforming over Ni
catalysts supported on ceria and ceria-promoted alumina. International Journal of
Hydrogen Energy, 35(20), 11622-11633.
50. Ishioma J.O. (2013). Hydrogen Production by Water Gas Shift Reaction
Following Dry Reforming of Biogas Methane in Membrane and Packedbed

157
Tubular Reactors (Master’s Thesis). University of Regina, Canada.
51. Ito, T., Nakashimada, Y., Senba, K., Matsui, T., & Nishio, N. (2005). Hydrogen
and ethanol production from glycerol-containing wastes discharged after biodiesel
manufacturing process. Journal of bioscience and bioengineering, 100(3), 260-
265.
52. IUPAC Recommendations, (1994). Pure Appl. Chem. 66, 1739.
53. Johnson, D. T.; Taconi, K. A. The Glycerin Glut: Options for the Value-Added
Conversion of Crude Glycerol Resulting from Biodiesel Production. Envi. Pro.
2007, 26, 338−348.
54. Kale, Ganesh R., and Bhaskar D. Kulkarni. "Thermodynamic analysis of dry
autothermal reforming of glycerol." Fuel Processing Technology 91.5 (2010):
520-530.
55. Kamonsuangkasem, K., Therdthianwong, S., & Therdthianwong, A. (2011).
Hydrogen Production via Oxidative Steam Reforming of Biodiesel By-products
over Ni/CeO2-ZrO2/Al2O3 Catalyst. In Proceedings of International Conference
on Chemistry and Chemical Process (ICCCP 2011).
56. Kapdan, I. K., & Kargi, F. (2006). Bio-hydrogen production from waste materials.
Enzyme and microbial technology, 38(5), 569-582.
57. Kašpar, J., & Fornasiero, P. A. O. L. O. (2002). Structural properties and thermal
stability of ceria-zirconia and related materials. Catalysis by Ceria and Related
Materials"//A. Trovarelli (Ed.), 217-241.
58. Khan, A., & Smirniotis, P. G. (2008). Relationship between temperature-
programmed reduction profile and activity of modified ferrite-based catalysts for
WGS reaction. Journal of Molecular Catalysis A: Chemical, 280(1), 43-51.
59. Khan, A., Sukonket, T., Saha, B., & Idem, R. (2011). Catalytic Activity of
Various 5 wt% Ni/Ce0. 5Zr0. 33M0. 17O2− δ Catalysts for the CO2 Reforming
of CH4 in the Presence and Absence of Steam. Energy & Fuels, 26(1), 365-379.
60. King, D. L., Zhang, L., Xia, G., Karim, A. M., Heldebrant, D. J., Wang, X., ... &
Wang, Y. (2010). Aqueous phase reforming of glycerol for hydrogen production
over Pt–Re supported on carbon. Applied Catalysis B: Environmental, 99(1), 206-
213.

158
61. Kulkarni, M. G., & Dalai, A. K. (2006). Waste cooking oil an economical source
for biodiesel: a review. Industrial & engineering chemistry research, 45(9), 2901-
2913.
62. Kunkes, E. L., Simonetti, D. A., Dumesic, J. A., Pyrz, W. D., Murillo, L. E.,
Chen, J. G., & Buttrey, D. J. (2008). The role of rhenium in the conversion of
glycerol to synthesis gas over carbon supported platinum–rhenium catalysts.
Journal of Catalysis, 260(1), 164-177.
63. Le Minh, C., Jones, R. A., Craven, I. E., & Brown, T. C. (1997). Temperature-
programmed oxidation of coke deposited on cracking catalysts: combustion
mechanism dependence. Energy & fuels, 11(2), 463-469.
64. Lehnert, K., & Claus, P. (2008). Influence of Pt particle size and support type on
the aqueous-phase reforming of glycerol. Catalysis Communications, 9(15), 2543-
2546.
65. Levenspiel, O., (1999), Chemical Reaction Engineering (3rdedition), Wiley, New
York.
66. Li, C. E., & Brown, T. C. (1999). Temperature-programmed oxidation of coke
deposited by 1-octene on cracking catalysts. Energy & fuels, 13(4), 888-894.
67. Li, C. E., & Brown, T. C. (2001). Carbon oxidation kinetics from evolved carbon
oxide analysis during temperature-programmed oxidation. Carbon, 39(5), 725-
732.
68. Luo, N., Fu, X., Cao, F., Xiao, T., & Edwards, P. P. (2008). Glycerol aqueous
phase reforming for hydrogen generation over Pt catalyst–effect of catalyst
composition and reaction conditions. Fuel, 87(17), 3483-3489.
69. Luo, N., Ouyang, K., Cao, F., & Xiao, T. (2010). Hydrogen generation from
liquid reforming of glycerin over Ni–Co bimetallic catalyst. Biomass and
bioenergy, 34(4), 489-495.
70. Luo, N., Zhao, X., Cao, F., Xiao, T., & Fang, D. (2007). Thermodynamic study
on hydrogen generation from different glycerol reforming processes. Energy &
Fuels, 21(6), 3505-3512.
71. Ma, F. R.; Hanna, M. A. Biodiesel Production: A Review. Bioresource
Technology 1999, 70, 1−15

159
72. McMichael, A. J. (Ed.). (2003). Climate change and human health: risks and
responses. World Health Organization.
73. McNaught, A. D., Wilkinson, A. (1997). Compendium of chemical terminology
(Vol. 1669). Oxford: Blackwell Science.
74. Meher Kotay, S., & Das, D. (2008). Biohydrogen as a renewable energy resource
prospects and potentials. International Journal of Hydrogen Energy, 33(1), 258-
263.
75. Menezes, A. O., Rodrigues, M. T., Zimmaro, A., Borges, L. E., & Fraga, M. A.
(2011). Production of renewable hydrogen from aqueous-phase reforming of
glycerol over Pt catalysts supported on different oxides. Renewable Energy,
36(2), 595-599.
76. Milligan Biofuels Inc. (2013, February 27). Stripped Glycerin. [Material Safety
Data Sheet]. Obtained directly from the company.
77. Mills, R. L., Ray, P., Dhandapani, B., Nansteel, M., Chen, X., & He, J. (2002).
New power source from fractional quantum energy levels of atomic hydrogen that
surpasses internal combustion. Journal of molecular structure, 643(1), 43-54.
78. Mizuno, T., Matsumura, Y., Nakajima, T., & Mishima, S. (2003). Effect of
support on catalytic properties of Rh catalysts for steam reforming of 2-propanol.
International journal of hydrogen energy, 28(12), 1393-1399.
79. Nagaoka, K., Seshan, K., Aika, K. I., & Lercher, J. A. (2001). Carbon Deposition
during Carbon Dioxide Reforming of Methane—Comparison between Pt/Al<
sub> 2</sub> O< sub> 3</sub> and Pt/ZrO< sub> 2</sub>. Journal of Catalysis,
197(1), 34-42.
80. Ozawa, M. (1998). Role of cerium–zirconium mixed oxides as catalysts for car
pollution: A short review. Journal of alloys and compounds, 275, 886-890.
81. Parmar, R. D., Kundu, A., Thurgood, C., Peppley, B. A., & Karan, K. (2010).
Kinetic studies of the autothermal reforming of tetradecane over Pt/Al< sub>
2</sub> O< sub> 3</sub> catalyst in a fixed-bed reactor. Fuel, 89(6), 1212-1220.
82. Pierotti, R. A., & Rouquerol, J. (1985). Reporting physisorption data for gas/solid
systems with special reference to the determination of surface area and porosity.
Pure Appl Chem, 57(4), 603-619.

160
83. Pompeo, F., Santori, G., & Nichio, N. N. (2010). Hydrogen and/or syngas from
steam reforming of glycerol. Study of platinum catalysts. International Journal of
Hydrogen Energy, 35(17), 8912-8920.
84. Rand, D. A. J., & Dell, R. (2008). Hydrogen energy: challenges and prospects
(Vol. 1). Royal Society of Chemistry.
85. Rennard, D. C., Kruger, J. S., & Schmidt, L. D. (2009). Autothermal Catalytic
Partial Oxidation of Glycerol to Syngas and to Non‐Equilibrium Products.
ChemSusChem, 2(1), 89-98.
86. Romero-Sarria, F., Vargas, J. C., Roger, A. C., & Kiennemann, A. (2008).
Hydrogen production by steam reforming of ethanol: Study of mixed oxide
catalysts Ce2Zr1. 5Me0. 5O8: Comparison of Ni/Co and effect of Rh. Catalysis
Today, 133, 149-153.
87. Sabri F. (2013). Catalysts for Hyrdrogen Production by the Auto-thermal
Reforming of Glycerol. (Master’s Thesis). University of Regina, Canada.
88. Saha, B., Khan, A., Ibrahim, H., & Idem, R. (2014). Evaluating the performance
of non-precious metal based catalysts for sulfur-tolerance during the dry
reforming of biogas. Fuel, 120, 202-217.
89. Schneider, P. (1995). Adsorption isotherms of microporous-mesoporous solids
revisited. Applied Catalysis A: General, 129(2), 157-165.
90. Sengupta, P. (2011). Catalysts for hydrogen production by the steam reforming of
mixtures of oxygenated hydrocarbons (Master’s Thesis). University of Regina,
Canada.
91. Shabaker, J. W., Huber, G. W., & Dumesic, J. A. (2004). Aqueous-phase
reforming of oxygenated hydrocarbons over Sn-modified Ni catalysts. Journal of
Catalysis, 222(1), 180-191.
92. Simon, Jonathan. "Authority and authorship in the method of chemical
nomenclature." Ambix 49.3 (2002): 206-226.
93. Slinn, M., Kendall, K., Mallon, C., & Andrews, J. (2008). Steam reforming of
biodiesel by-product to make renewable hydrogen. Bioresource technology,
99(13), 5851-5858.

161
94. Smith, E. G., Janzen, H. H., & Newlands, N. K. (2007). Energy balances of
biodiesel production from soybean and canola in Canada. Canadian Journal of
Plant Science, 87(4), 793-801.
95. Sørensen, B. (2012). Hydrogen and fuel cells: Emerging technologies and
applications. Academic Press.
96. Sukonket, T., Khan, A., Saha, B., Ibrahim, H., Tantanayon, S., Kumar, P., Idem,
R. (2011). Influence of the catalyst preparation method, surfactant amount, and
steam on CO2 reforming of CH4 over 5Ni/CeZrO catalysts. Energy Fuel, 25, (864
– 877).
97. Sutar, P. N., Vaidya, P. D., & Rodrigues, A. E. (2010). Glycerol‐Reforming
Kinetics Using a Pt/C Catalyst. Chemical Engineering & Technology, 33(10),
1645-1649.
98. Swami, S. M., & Abraham, M. A. (2006). Integrated catalytic process for
conversion of biomass to hydrogen. Energy & fuels, 20(6), 2616-2622.
99. Takehira, K., Shishido, T., & Kondo, M. (2002). Partial Oxidation of CH< sub>
4</sub> over Ni/SrTiO< sub> 3</sub> Catalysts Prepared by a Solid-Phase
Crystallization Method. Journal of Catalysis, 207(2), 307-316.
100. Thompson, J. C.; He, B. B. Characterization of Crude Glycerol from
Biodiesel Production from Multiple Feedstocks. Appl. Eng. Agric. 2006, 22,
261−265.
101. Trimm, D. L. (1997). Coke formation and minimisation during steam
reforming reactions. Catalysis Today, 37(3), 233-238.
102. Tsipouriari, V. A., & Verykios, X. E. (2001). Kinetic study of the catalytic
reforming of methane with carbon dioxide to synthesis gas over Ni/La< sub>
2</sub> O< sub> 3</sub> catalyst. Catalysis Today, 64(1), 83-90.
103. US President's Committee of Advisors on Science and Technology.
Report to the President on Federal Energy Research and Development for the
Challenges of the Twenty-First Century, Panel on Energy Research and
Development (November 1997)

162
104. Vaidya, P. D., & Rodrigues, A. E. (2009). Glycerol reforming for
hydrogen production: a review. Chemical engineering & technology, 32(10),
1463-1469.
105. Varrone, C., Giussani, B., Izzo, G., Massini, G., Marone, A., Signorini, A.,
& Wang, A. (2012). Statistical optimization of biohydrogen and ethanol
production from crude glycerol by microbial mixed culture. International Journal
of Hydrogen Energy, 37(21), 16479-16488.
106. Wang, F., Dubois, J. L., & Ueda, W. (2010). Catalytic performance of
vanadium pyrophosphate oxides (VPO) in the oxidative dehydration of glycerol.
Applied Catalysis A: General, 376(1), 25-32.
107. Wang, H., Wang, X., Li, M., Li, S., Wang, S., & Ma, X. (2009).
Thermodynamic analysis of hydrogen production from glycerol autothermal
reforming. International Journal of Hydrogen Energy, 34(14), 5683-5690.
108. Wang, W. (2010). Thermodynamic analysis of glycerol partial oxidation
for hydrogen production. Fuel Processing Technology, 91(11), 1401-1408.
109. Wang, X., Li, M., Wang, M., Wang, H., Li, S., Wang, S., & Ma, X.
(2009). Thermodynamic analysis of glycerol dry reforming for hydrogen and
synthesis gas production. Fuel, 88(11), 2148-2153.
110. Wawrzetz, A., Peng, B., Hrabar, A., Jentys, A., Lemonidou, A. A., &
Lercher, J. A. (2010). Towards understanding the bifunctional
hydrodeoxygenation and aqueous phase reforming of glycerol. Journal of
Catalysis, 269(2), 411-420.
111. Wen, G., Xu, Y., Ma, H., Xu, Z., & Tian, Z. (2008). Production of
hydrogen by aqueous-phase reforming of glycerol. international journal of
hydrogen energy, 33(22), 6657-6666.
112. Wijesekara, R. G., Nomura, N., Sato, S., & Matsumura, M. (2008).
Pre‐treatment and utilization of raw glycerol from sunflower oil biodiesel for
growth and 1, 3‐propanediol production by Clostridium butyricum. Journal of
chemical technology and biotechnology, 83(7), 1072-1080.

163
113. Yang, G., Yu, H., Peng, F., Wang, H., Yang, J., & Xie, D. (2011).
Thermodynamic analysis of hydrogen generation via oxidative steam reforming
of glycerol. Renewable Energy, 36(8), 2120-2127.
114. Yazdani, S. S., & Gonzalez, R. (2007). Anaerobic fermentation of
glycerol: a path to economic viability for the biofuels industry. Current opinion in
biotechnology, 18(3), 213-219.
115. Zhang, B., Tang, X., Li, Y., Xu, Y., & Shen, W. (2007). Hydrogen
production from steam reforming of ethanol and glycerol over ceria-supported
metal catalysts. International Journal of Hydrogen Energy, 32(13), 2367-2373.
116. Zhang, J., Xu, H., Jin, X., Ge, Q., & Li, W. (2005). Characterizations and
activities of the nano-sized Ni/Al< sub> 2</sub> O< sub> 3</sub> and Ni/La–
Al< sub> 2</sub> O< sub> 3</sub> catalysts for NH< sub> 3</sub>
decomposition. Applied Catalysis A: General, 290(1), 87-96.
117. Zhang, Y., Dube, M. A., McLean, D., & Kates, M. (2003). Biodiesel
production from waste cooking oil: 1. Process design and technological
assessment. Bioresource technology, 89(1), 1-16.
APPENDICES
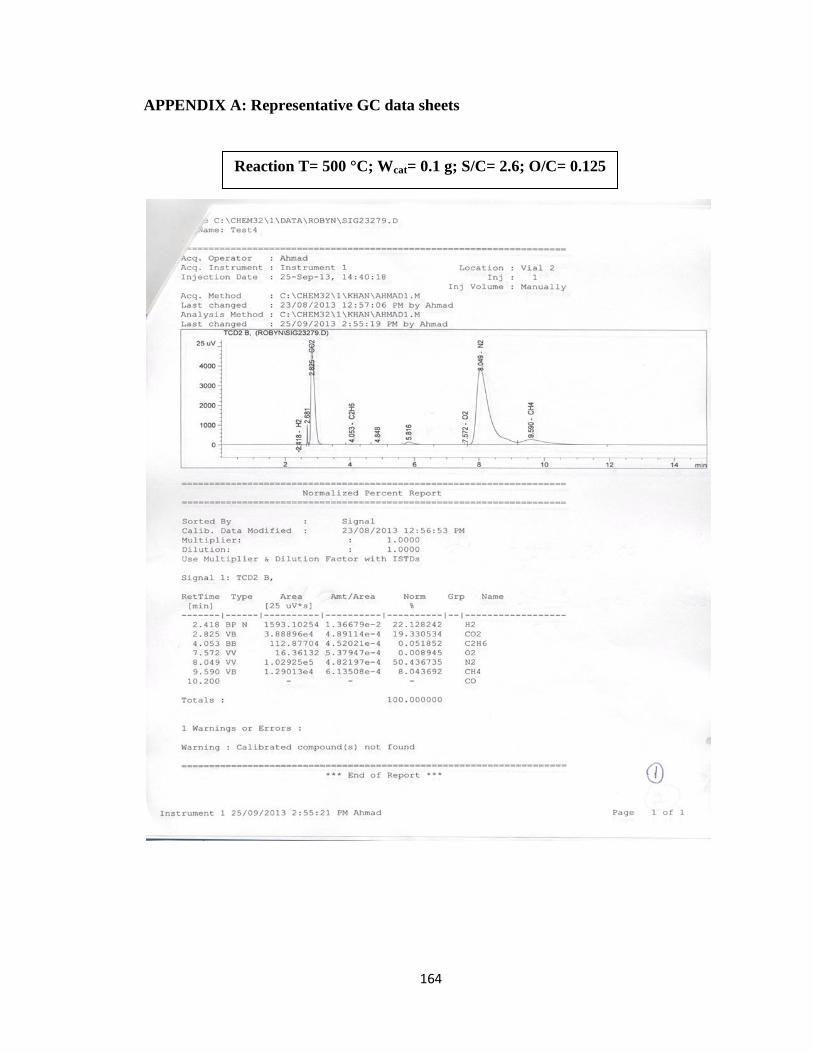
164
APPENDIX A: Representative GC data sheets
Reaction T= 500 °C; Wcat= 0.1 g; S/C= 2.6; O/C= 0.125

165
Reaction T= 550 °C; Wcat= 0.25 g; S/C= 2.6; O/C= 0.125

166
Reaction T= 550 °C; Wcat= 0.15 g; S/C= 2.6; O/C= 0.125

167
Reaction T= 550 °C; Wcat= 0.1 g; S/C= 2.6; O/C= 0.125

168
Reaction T= 600 °C; Wcat= 0.15 g; S/C= 2.6; O/C= 0.125

169
Reaction T= 600 °C; Wcat= 0.1 g; S/C= 2.6; O/C= 0.125

170
Reaction T= 600 °C; Wcat= 0.05 g; S/C= 2.6; O/C= 0.1

171
Reaction T= 600 °C; Wcat= 0.25g; S/C= 2.6; O/C= 0.2

172
Reaction T= 650 °C; Wcat= 0.025 g; S/C= 2.6; O/C= 0.125

173
Reaction T= 500 °C; Wcat= 0.15 g; S/C= 2.6; O/C= 0.125

174
Reaction T= 500 °C; Wcat= 0.25 g; S/C= 2.6; O/C= 0.125

175
Reaction T= 550 °C; Wcat= 0.15 g; S/C= 2.6; O/C= 0.125

176
Reaction T= 600 °C; Wcat= 0 g; S/C= 2.6; O/C= 0.125

177
Reaction T= 600 °C; Particle size= 1.26 mm; S/C= 3.6; O/C= 0.125

178
Reaction T= 650 °C; Wcat= 0.25 g; S/C= 2.6; O/C= 0.125
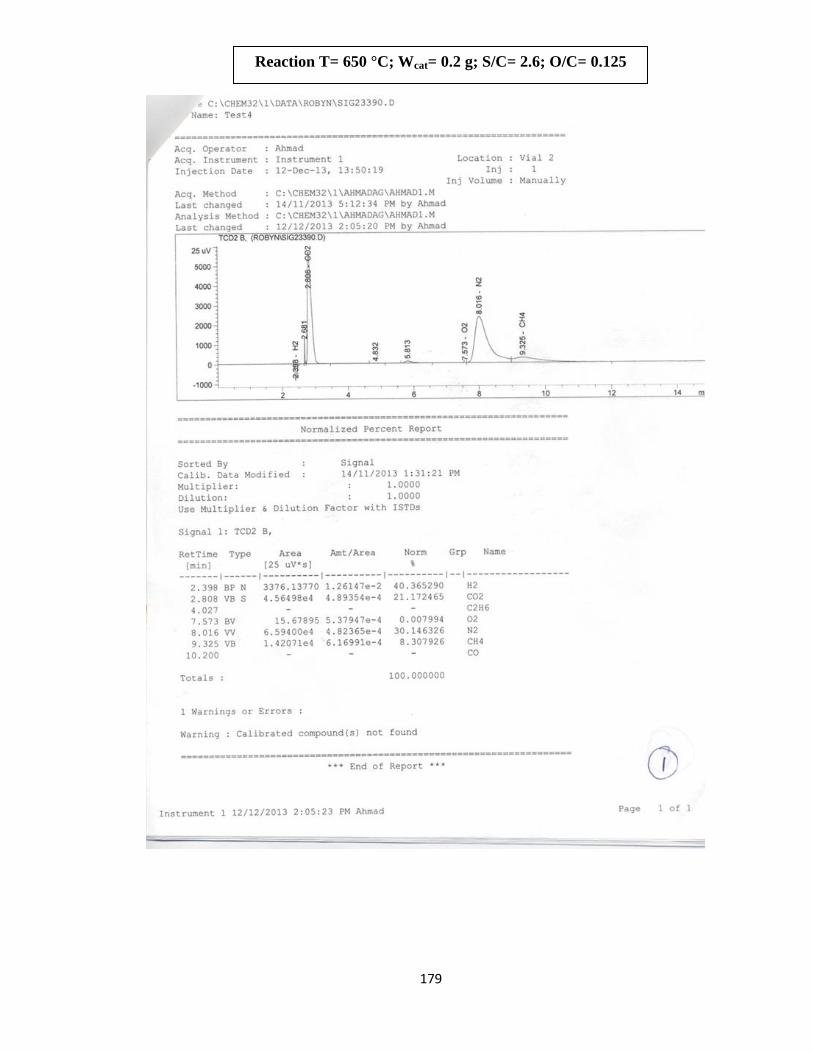
179
Reaction T= 650 °C; Wcat= 0.2 g; S/C= 2.6; O/C= 0.125

180
Reaction T= 650 °C; Wcat= 0.15 g; S/C= 2.6; O/C= 0.125
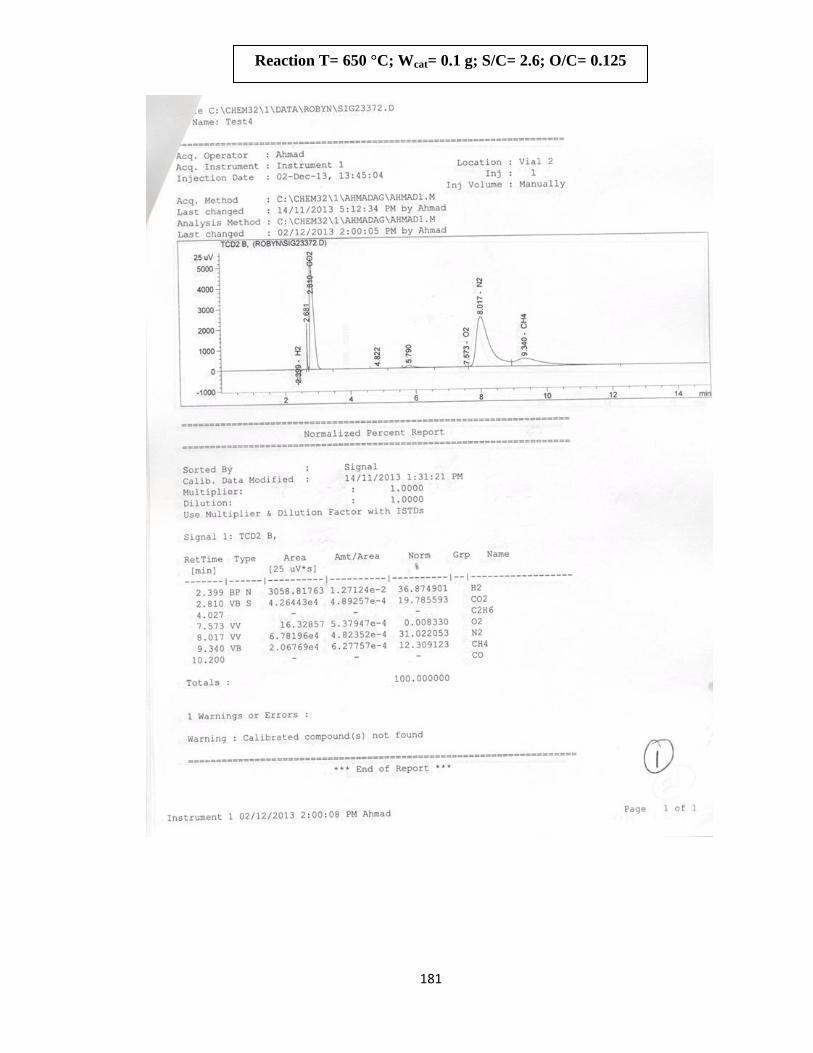
181
Reaction T= 650 °C; Wcat= 0.1 g; S/C= 2.6; O/C= 0.125
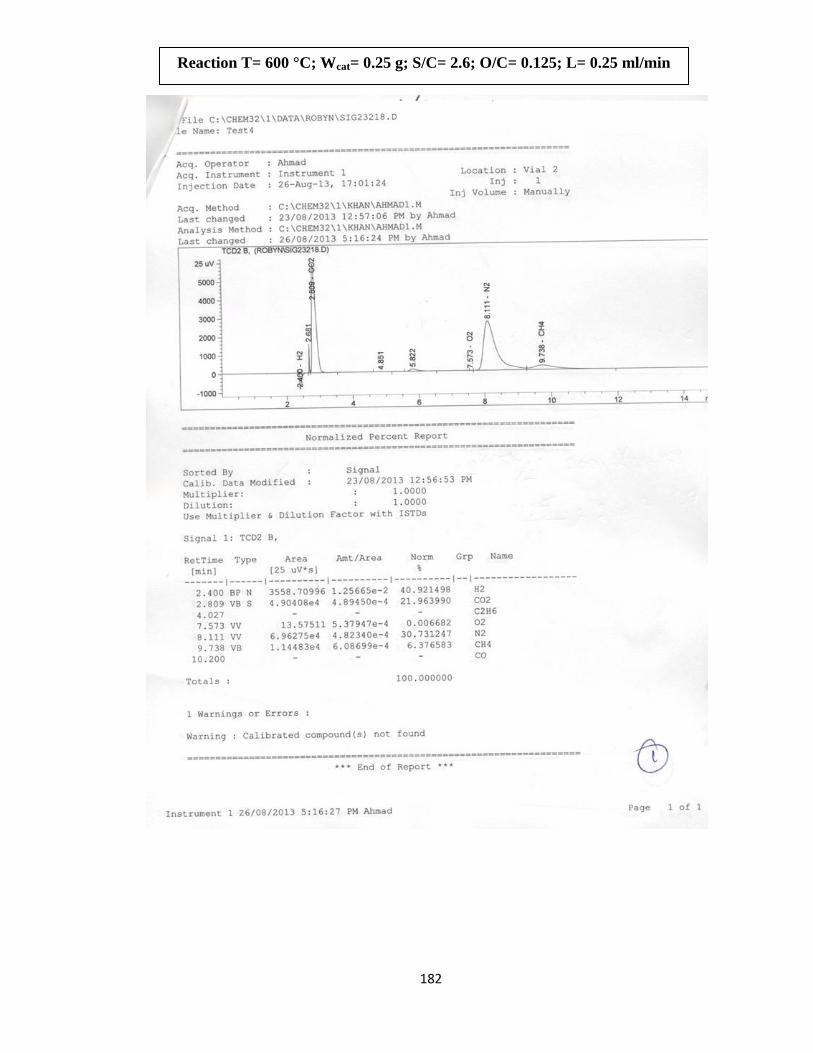
182
Reaction T= 600 °C; Wcat= 0.25 g; S/C= 2.6; O/C= 0.125; L= 0.25 ml/min

183
Reaction T= 600 °C; Wcat= 0.25 g; S/C= 2.6; O/C= 0.125; L= 0.2 ml/min

184
APPENDIX B: Regression results from NLREG software for conversion model
---- Final Results ----
NLREG version 6.3
Copyright (c) 1992-2005 Phillip H. Sherrod. All rights reserved.
This is a registered copy of NLREG that may not be redistributed.
Number of observations = 23
Maximum allowed number of iterations = 500
Convergence tolerance factor = 1.000000E-010
Stopped due to: Function did not converge before iteration limit reached.
Number of iterations performed = 500
Final sum of squared deviations = 1.8474232E+002
Final sum of deviations = -8.6097533E-002
Standard error of estimate = 4.09814
Average deviation = 2.2959
Maximum deviation for any observation = 6.44201
Proportion of variance explained (R^2) = 0.8214 (82.14%)
Adjusted coefficient of multiple determination (Ra^2) = 0.6428 (64.28%)
Durbin-Watson test for autocorrelation = 1.463
Analysis completed 1-Jun-2014 16:55. Runtime = 0.16 seconds.

185
---- Descriptive Statistics for Variables ----
Variable Minimum value Maximum value Mean value Standard dev.
------------------ -------------- -------------- -------------- --------------
calcT 550 650 643.4783 22.88483
reducT 500 700 600 30.15113
PVtoSA 0.0017708 0.0029128 0.001958778 0.0002103501
Reducibility 0.0016 0.00208 0.002057391 0.0001000553
reactionT 500 650 595.6522 25.73044
StoC 1.6 3.6 3.165217 0.5897678
OtoC 0.05 0.25 0.1271739 0.03099949
con 60.3665 92.925 84.14085 6.85719
---- Calculated Parameter Values ----
Parameter Initial guess Final estimate Standard error t Prob(t)
------------------ ------------- ---------------- -------------- --------- -------
a 1 -393.165709 0 1.0E+030 0.00001
b 1 -1.34168725E-005 0 1.0E+030 0.00001
c 1 12.9106537 0 1.0E+030 0.00001
d 1 0.539416108 0 1.0E+030 0.00001
g 1 -0.751241511 0 1.0E+030 0.00001
h 1 63.3448397 0 1.0E+030 0.00001
f 1 60.3999101 0 1.0E+030 0.00001
k 1 0.547904849 0 1.0E+030 0.00001
q 1 4.18480948 0 1.0E+030 0.00001
x 1 2.17347658 0 1.0E+030 0.00001

186
y 1 0.233845151 0 1.0E+030 0.00001
z 1 4.05743302 0 1.0E+030 0.00001
---- Analysis of Variance ----
Source DF Sum of Squares Mean Square F value Prob(F)
---------- ---- -------------- -------------- --------- -------
Regression 11 849.7209 77.24736 4.60 0.00890
Error 11 184.7423 16.79476
Total 22 1034.463

187
APPENDIX C: Regression results for reaction kinetics using PLKA software

188
APPENDIX D: TOC Carbon Analysis results from Loring Laboratories LTD.

189
APPENDIX E: Synthetic CG average molecular formula
Average “CHO” molecular formula calculations for synthetic CG
For the sake of simplicity, Potassium and Sodium atoms were not included in the overall
formula
Note: the very small amounts of ethanol and phenolphthalein come from the soap solution
Chemical Formula Amount
(mol)
C H O Component
fraction
C H O
Glycerol C3H8O3 0.25518 3 8 3 0.4534252 1.36028 3.6274 1.36028
Methanol CH3OH 0.17478 1 4 1 0.3105638 0.31056 1.24226 0.31056
2-propanol C3H8O 0.1284 3 8 1 0.2281519 0.68446 1.82522 0.22815
Potassium
palmitate
C16H31KO2 0.00123 16 31 2 0.0021856 0.03497 0.06775 0.00437
Oleic acid C18H34O2 0.0023 18 34 2 0.0040868 0.07356 0.13895 0.00817
Ethanol C2H5OH 0.00051 2 6 1 0.0009009 0.0018 0.00541 0.0009
Phenolphthalein C20H14O4 0.00039 20 14 4 0.0006859 0.01372 0.0096 0.00274
Total 0.56278 SUM 1 2.47935 6.91658 1.91518