hydrogen safety sensor performance and use gap analysis
TRANSCRIPT

Hydrogen Safety Sensor Performance and Use Gap Analysis Preprint William Buttner, Robert Burgess, Kara Schmidt Hannah Wright, and Carl Rivkin National Renewable Energy Laboratory
Eveline Weidner, Rafael Ortiz-Cebeolla, Christian Bonato, and Pietro Moretto Joint Research Centre, Petten, the Netherlands
Laura Hill and Charles James Office of Energy Efficiency and Renewable Energy, U. S. Department of Energy
Presented at the 7th International Conference on Hydrogen Safety (ICHS 2017) Hamburg, Germany September 11-13, 2017
NREL is a national laboratory of the U.S. Department of Energy Office of Energy Efficiency & Renewable Energy Operated by the Alliance for Sustainable Energy, LLC
This report is available at no cost from the National Renewable Energy Laboratory (NREL) at www.nrel.gov/publications.
Conference Paper NREL/CP-5400-68773 November 2017
Contract No. DE-AC36-08GO28308

NOTICE
The submitted manuscript has been offered by an employee of the Alliance for Sustainable Energy, LLC (Alliance), a contractor of the US Government under Contract No. DE-AC36-08GO28308. Accordingly, the US Government and Alliance retain a nonexclusive royalty-free license to publish or reproduce the published form of this contribution, or allow others to do so, for US Government purposes.
This report was prepared as an account of work sponsored by an agency of the United States government. Neither the United States government nor any agency thereof, nor any of their employees, makes any warranty, express or implied, or assumes any legal liability or responsibility for the accuracy, completeness, or usefulness of any information, apparatus, product, or process disclosed, or represents that its use would not infringe privately owned rights. Reference herein to any specific commercial product, process, or service by trade name, trademark, manufacturer, or otherwise does not necessarily constitute or imply its endorsement, recommendation, or favoring by the United States government or any agency thereof. The views and opinions of authors expressed herein do not necessarily state or reflect those of the United States government or any agency thereof.
This report is available at no cost from the National Renewable Energy Laboratory (NREL) at www.nrel.gov/publications.
Available electronically at SciTech Connect http:/www.osti.gov/scitech
Available for a processing fee to U.S. Department of Energy and its contractors, in paper, from:
U.S. Department of Energy Office of Scientific and Technical Information P.O. Box 62 Oak Ridge, TN 37831-0062 OSTI http://www.osti.gov Phone: 865.576.8401 Fax: 865.576.5728 Email: [email protected]
Available for sale to the public, in paper, from:
U.S. Department of Commerce National Technical Information Service 5301 Shawnee Road Alexandria, VA 22312 NTIS http://www.ntis.gov Phone: 800.553.6847 or 703.605.6000 Fax: 703.605.6900 Email: [email protected]
Cover Photos by Dennis Schroeder: (left to right) NREL 26173, NREL 18302, NREL 19758, NREL 29642, NREL 19795.
NREL prints on paper that contains recycled content.

1 This report is available at no cost from the National Renewable Energy Laboratory (NREL) at www.nrel.gov/publications.
HYDROGEN SAFETY SENSOR PERFORMANCE AND USE GAP ANALYSIS
Buttner, W.J.1, Burgess, R.2, Schmidt, K.3, Wright, H.4, Rivkin, C. 5, Weidner, E.6, Ortiz-Cebolla, R.7, Bonato, C.8, Moretto, P.9, Hill, L.10, and James, C.W.11
1 Hydrogen Safety Codes and Standards, Transportation and Hydrogen Systems Center, National Renewable Energy Laboratory, 15013 Denver West Pkwy., Golden CO 80401, USA, [email protected]
2 Hydrogen Safety Codes and Standards, Transportation and Hydrogen Systems Center, National Renewable Energy Laboratory, 15013 Denver West Pkwy., Golden CO 80401, USA, [email protected]
3 Hydrogen Safety Codes and Standards, Transportation and Hydrogen Systems Center, National Renewable Energy Laboratory, 15013 Denver West Pkwy., Golden CO 80401, USA, [email protected]
4 Hydrogen Safety Codes and Standards, Transportation and Hydrogen Systems Center, National Renewable Energy Laboratory, 15013 Denver West Pkwy., Golden CO 80401, USA, [email protected]
5 Hydrogen Safety Codes and Standards, Transportation and Hydrogen Systems Center, National Renewable Energy Laboratory, 15013 Denver West Pkwy., Golden CO 80401, USA, Carl.Rivkin @nrel.gov
6 Joint Research Centre, Petten, the Netherlands, [email protected] 7 Joint Research Centre, Petten, the Netherlands, [email protected]) 8 Joint Research Centre, Petten, the Netherlands, [email protected] 9 Joint Research Centre, Petten, the Netherlands, [email protected] 10 Office of Energy Efficiency and Renewable Energy, U.S. Department of Energy, Washington
DC, USA, [email protected] 11 Office of Energy Efficiency and Renewable Energy, U.S. Department of Energy, Washington
DC, USA, [email protected]
ABSTRACT
Hydrogen sensors are recognized as an important technology for facilitating the safe implementation of hydrogen as an alternative fuel, and there are numerous reports of a sensor alarm successfully preventing a potentially serious event. However, gaps in sensor metrological specifications, as well as in their performance for some applications, exist. The U.S. Department of Energy (DOE) Fuel Cell Technologies Office published a short list of critical gaps in the 2007 and 2012 Multiyear Project Plans; more detailed gap analyses were independently performed by the Joint Research Centre (JRC) and the National Renewable Energy Laboratory (NREL). There have been, however, some significant advances in sensor technologies since these assessments, including the commercial availability of hydrogen sensors with fast response times (t90 < 1 s, which had been an elusive DOE target since 2007), improved robustness to chemical poisons, improved selectivity, and improved lifetime and stability. These improvements, however, have not been universal and typically pertain to select platforms or models. Moreover, as hydrogen markets grow and new applications are being explored, more demands will be imposed on sensor performance. The hydrogen sensor laboratories at NREL and the JRC are currently updating the hydrogen safety sensor gap analysis through direct interaction with international stakeholders in the hydrogen community, especially end users. NREL and the JRC are currently organizing a series of workshops (in Europe and the United States) with sensor developers, end-users, and other stakeholders in 2017 to identify technology gaps and to develop a path forward to address them. One workshop was held on May 10 in Brussels, Belgium, at the Headquarters of the Fuel Cell and Hydrogen Joint Undertaking. A second workshop is planned at NREL in Golden, CO, USA. This paper reviews improvements in sensor

2 This report is available at no cost from the National Renewable Energy Laboratory (NREL) at www.nrel.gov/publications.
technologies in the past 5 to 10 years, identifies gaps in sensor performance and use requirements, and identifies potential research strategies to address the gaps. The outcomes of the Hydrogen Sensors Workshops are also summarized.
NOMENCLATURE
CGS combustible gas sensor DOE U.S. Department of Energy FCH-JU Fuel Cell and Hydrogen Joint Undertaking FCTO Fuel Cell Technologies Office HMDS hexamethyldisiloxane IFC International Fire Code JRC Joint Research Centre MYPP Multi-Year Project Plan NFPA National Fire Protection Association NREL National Renewable Energy Laboratory P pressure T temperature TC thermal conductivity
1.0 INTRODUCTION
In the United States, the Department of Energy’s (DOE’s) Fuel Cell Technologies Office (FCTO) has taken the lead to support the development and deployment of hydrogen as an alternative energy source [1]. The FCTO supports DOE’s mission to ensure the United States’ security and prosperity by addressing energy and environmental challenges through transformative science and technology solutions [2]. Similarly, the European Commission identified the potential of hydrogen and fuel cells in the 2011 Technologies Map of the European Strategic Energy Technology Plan [3].
1.1 The NREL and JRC Sensor Laboratories
Hydrogen infrastructure and vehicles must be developed safely if hydrogen is to be used successfully as a fuel. One element of a hydrogen safety system is the use of sensors to detect and monitor unexpected hydrogen releases. To support the development and use of hydrogen sensors, sensor test facilities were independently established by the European Joint Research Centre (JRC) at the Institute for Energy and Transport in Petten, the Netherlands [4], and by the Safety Codes and Standards Sub-Program Office within the DOE FCTO at the National Renewable Energy Laboratory (NREL) in Golden, Colorado, U.S. [5]. The purpose of each facility is to assure that stakeholders have the sensor technology they need. The sensor laboratories support hydrogen deployment by direct collaboration with the hydrogen community, including:
• Sensor developers and manufacturers for independent verification of sensor performance [6].1
• End users (stationary and vehicular) on sensor selection, qualification, and implementation [7]. The selection may be dependent on application-specific requirements.
1 Although the sensor platform may be identified when openly reporting results, it is the policy of the NREL and JRC laboratories to not identify the specific model or manufacturer of a specific sensor. This confidentiality is maintained for both sensor developers and end users.

3 This report is available at no cost from the National Renewable Energy Laboratory (NREL) at www.nrel.gov/publications.
• Participation on hydrogen safety panels, code development organizations, standards development organizations. Support of this activity includes document development [8], pre-normative research [9, 10], verification technology [11], and expert guidance.
• Outreach and education of the hydrogen community on the proper use of hydrogen sensors.
With nearly identical missions, the NREL and JRC sensor laboratories have been collaborating since 2008. This collaboration was first formalized under a Memorandum of Agreement that was signed in 2010 [12], and more recently under an agreement between DOE FCTO and the Fuel Cell and Hydrogen Joint Undertaking (FCH-JU) of the European Commission, in which it was agreed to collaborate on hydrogen sensor research. The European activity was performed under the auspices of H2Sense [13], a FCH-JU–funded consortium of European sensor manufacturers and research laboratories. The U.S. activity was headed by the NREL Sensor Test Laboratory. This agreement was the first formal international collaboration with common objectives between the hydrogen programs within the DOE and the FCH-JU. The goals were to identify pathways to make available effective, cost-efficient sensors. Presently, the NREL-JRC sensor collaboration is under the auspices of a recently implemented program-level agreement between the DOE and the JRC to foster energy research and development partnerships [14].
1.2 Sensor Performance Specifications
Focus areas addressed by FCTO are summarized in the Hydrogen, Fuel Cells & Infrastructure Technologies Program Multi-Year Research, Development and Demonstration Plan (the Multi-Year Project Plan, or MYPP), which was published in 2007 [15] and updated in 2012 [16]. A short list of critical hydrogen sensor parameters with target specifications was identified in 2007. The table summarizing these metrics and corresponding specifications is reproduced in Figure 1. A nearly identical table was included in the 2012 MYPP [16].
Figure 1: Target performance metrics for hydrogen sensors extracted from the 2007 DOE MYPP [15].
There are a variety of hydrogen sensor platforms, which are defined primarily by the transduction mechanism of the sensing element to produce an electrical signal when exposed to hydrogen. A basic classification of the main commercially available platforms types is presented in Table 1, along with generalized performance metrics. There is, however, variability in the performance from one manufacturer to another. For example, there are commercially available palladium thin-film hydrogen sensors that are not significantly affected by common catalyst poisons (e.g., sulfur compounds), but this is

4 This report is available at no cost from the National Renewable Energy Laboratory (NREL) at www.nrel.gov/publications.
typically achieved by ancillary, and often proprietary, means, such as protective coatings or filters. Many developmental palladium thin-film sensors are not successfully commercialized because of their sensitivity to chemical poisons. A more comprehensive list and descriptions of hydrogen sensor platforms have been developed [17]. It is noted that each sensor platform has its advantages, but there are also limitations, and no single platform will be ideally suited for all applications.
Table 1. Common H2 Sensing Elements
2.0 RECENT IMPROVEMENTS AND CONTINUING DISAPPOINTMENTS IN SENSOR PERFORMANCE
There have been incremental but significant improvements in the performance of hydrogen sensors on some critical metrics since the publication of the MYPPs in 2007 and 2012 [15, 16], some of which are illustrated in Figure 2. The 1-s response time has been an elusive target for DOE for over 10 years. Advanced manufacturing methods, such as microfabrication of miniaturized devices, have resulted in improved performance in critical metrics, especially response time. Sensors are now available with response times that significantly exceed the DOE target of less than 1 sec. Figure 2A shows the response of a commercial thermal-conductivity (TC) hydrogen sensor to short square-wave pulses of hydrogen. The pulse duration ranged from approximately 0.7 s to several seconds. In all cases, the output of the sensor reached an identical stable final indication, even for hydrogen pulses of sub-second duration. Independent response time measurements confirmed that the response time of the sensor (t90) was approximately 250 ms. Several other commercial models have response times on the order of 2 to 3 seconds, and thus are also approaching the DOE target; these fast-responding sensors were also based on miniaturized devices. In contrast, sensors manufactured through traditional, often manual, methods tend to be bulkier and have significantly longer response times. A survey performed in 2010 indicated that the manufacturer specifications for sensor response time typically ranged from 5 sec to over 30 sec [18], depending to some extent on platform type. The manufacturer’s specifications quoted in this survey were not independently verified, and thus the reported response times could be somewhat optimistic.
Another metric highlighted in Figure 2 is the long operational lifetime of some sensors, at least under some circumstances. In Figure 2B, the results from long-term testing of several hydrogen sensors are displayed. Long-term stability has two aspects. One is the basic functionality of the sensor, the other pertains to the ability of the sensor to maintain its calibration and not drift. In this test, the sensors were left powered up except during the “stand-by” period. Background exposure was to ambient air maintained at 45% relative humidity. Periodically, the sensors were exposed to a 2 vol% H2 challenge. No calibration
Elec
tro-
chem
ical
Se
nsor
s
Com
bust
ible
G
as S
enso
rs
Ther
mo-
cond
ucti
vity
se
nsor
s
Met
al O
xide
Se
nsor
s
Palla
dium
Th
in F
ilm
Sens
ors
Features EC CGS TC MOX PTFTransduction Mechanism
Faradaic e transfer (current)
catalytic combustion (ΔR induced by ΔT)
Heat Transfer (ΔR induced by ΔT)
(ΔR) semiconductor doping
Sel. H2 adsorption (various platforms)
Advantages Good LDL Robust Fast response time Low cost versatile sensor
Selectivity
Disadvantages Prone to poisoning, drift
Cross-sensitivity Non-selective (sensitive to Δ[H2]
Reputation for instability
Prone to poisoning; still expensive
Application Low level detection; personal monitors;
ESIF
Industry Standard; Petroleum Industry;
Infrastructure
Modeling studies; controlled environ.;
vehicles
General Deployment; containers
Petroleum Industry; specialized applic.

5 This report is available at no cost from the National Renewable Energy Laboratory (NREL) at www.nrel.gov/publications.
or adjustment of the sensor output was performed for the duration of the test. One sensor, a low-temperature metal oxide semiconductor, lasted for the full duration of the test, nearly 5 years, without any drift in response. A palladium thin-film sensor lasted over four years before it failed. In contrast, one of the TC sensors that we tested showed an immediate and continuous positive drift over time in its response to hydrogen such that within a few weeks it was out of the manufacturer’s specification for accuracy; it eventually failed. Other sensors (e.g., another TC sensor, a metal oxide sensor, and an electrochemical sensor), not shown in Figure 2B, were tested for up to three years without a measurable change in response. The actual start times for the life test were staggered so that the test initiation for some sensors was earlier than for others. Although not within the 10-year lifetime specification identified in the MYPP, the operational lifetimes of the sensors are improving.
Another improvement in hydrogen sensor performance has been the robustness to chemical exposures; including both poisons (Figure 2C) and interferents (Figure 2D). A poison is a chemical that induces a permanent negative effect on the sensor response and is manifested as a permanent loss of sensitivity to hydrogen, while an interferent is a chemical that induces a reversible response that may be mistakenly interpreted as due to hydrogen. An interferent may possibly generate a false positive alarm and in some cases, inhibit the hydrogen response, which will result in a false negative alarm. The robustness against interferents is often called sensor selectivity. Silicone compounds, such as those found in commercial sealants and lubricants (e.g., RTV silicones), are notorious poisons on some chemical sensor platforms, including many metal oxide and combustible gas sensor (CGS) models. For this reason, a specific test protocol was included in ISO 26142 to test hydrogen for robustness against silicone compounds [19]. In the ISO 26142 protocol, sensors are to be exposed to 10 ppmv hexamethyldisiloxane (HMDS) as a test against silicon poisoning. Figure 2C shows the robustness of a commercial metal oxide sensor to HMDS, as verified through the ISO 26142 protocol. For controls, 1 vol% H2 was exposed to the sensor prior to and following the HMDS exposure. The selectivity of hydrogen sensors to chemical interferents is also improving. Figure 2D shows the nearly ideal selectivity of a commercial hydrogen CGS when exposed to 1 vol% CH4 (methane), which is the simplest hydrocarbon.

6 This report is available at no cost from the National Renewable Energy Laboratory (NREL) at www.nrel.gov/publications.
However, not all is necessarily good with regard to the use and performance of hydrogen sensors, especially in actual field deployments, as illustrated in Figure 3, which compares the performance of two commercial sensor models simultaneously deployed in a “Clean Environment” and in an “Industrial Environment.” In Figure 3, sensor accuracy is indicated by the closeness of the color lines to the black line, which represents the actual test gas concentration, while long-term stability is indicated by the closeness of the color traces to each other. The color traces are plots of sensor response upon exposure to various hydrogen concentrations (0 to 2 vol% H2 in air), and were obtained before and following the deployment of the sensor in the “clean” and “industrial” environments.
Figure 2: Recent improvements in hydrogen sensor performance pertaining to A): Response time as measured with short pulses of hydrogen; B): Lifetime; C: Robustness to silicon poisoning (10 ppmv HMDS); D):
Selectivity of a hydrogen CGS in response to 1 vol% methane.
7 This report is available at no cost from the National Renewable Energy Laboratory (NREL) at www.nrel.gov/publications.
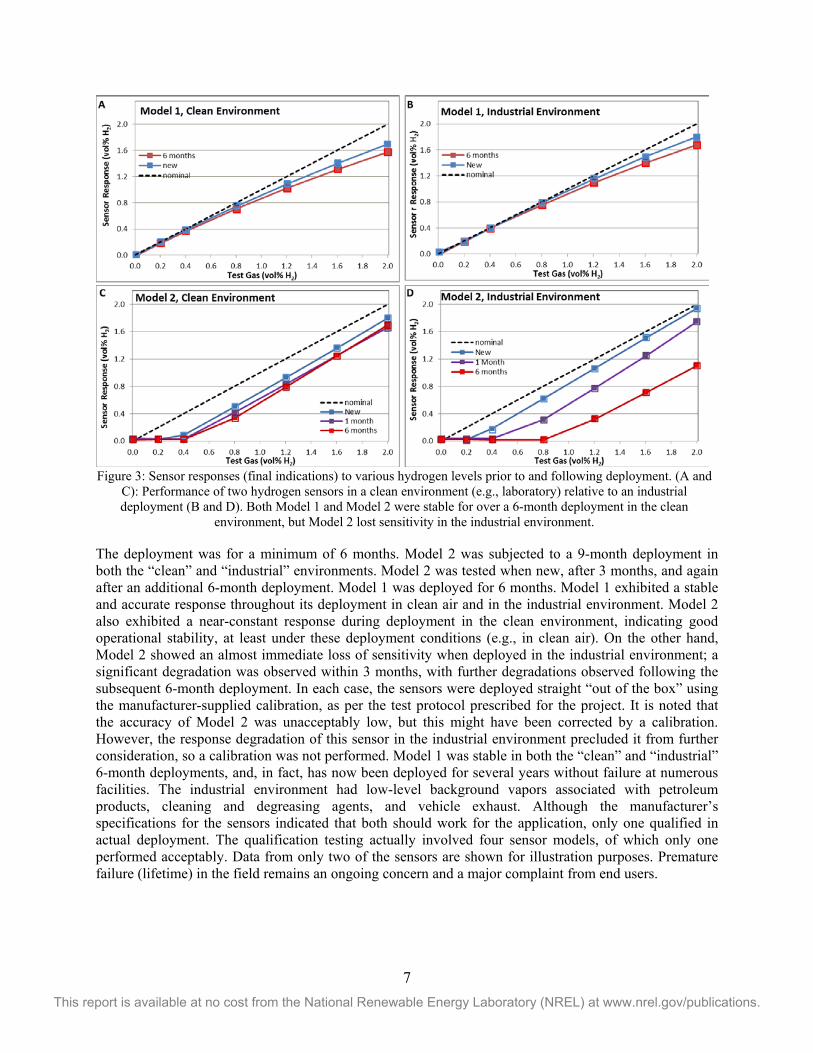
The deployment was for a minimum of 6 months. Model 2 was subjected to a 9-month deployment in both the “clean” and “industrial” environments. Model 2 was tested when new, after 3 months, and again after an additional 6-month deployment. Model 1 was deployed for 6 months. Model 1 exhibited a stable and accurate response throughout its deployment in clean air and in the industrial environment. Model 2 also exhibited a near-constant response during deployment in the clean environment, indicating good operational stability, at least under these deployment conditions (e.g., in clean air). On the other hand, Model 2 showed an almost immediate loss of sensitivity when deployed in the industrial environment; a significant degradation was observed within 3 months, with further degradations observed following the subsequent 6-month deployment. In each case, the sensors were deployed straight “out of the box” using the manufacturer-supplied calibration, as per the test protocol prescribed for the project. It is noted that the accuracy of Model 2 was unacceptably low, but this might have been corrected by a calibration. However, the response degradation of this sensor in the industrial environment precluded it from further consideration, so a calibration was not performed. Model 1 was stable in both the “clean” and “industrial” 6-month deployments, and, in fact, has now been deployed for several years without failure at numerous facilities. The industrial environment had low-level background vapors associated with petroleum products, cleaning and degreasing agents, and vehicle exhaust. Although the manufacturer’s specifications for the sensors indicated that both should work for the application, only one qualified in actual deployment. The qualification testing actually involved four sensor models, of which only one performed acceptably. Data from only two of the sensors are shown for illustration purposes. Premature failure (lifetime) in the field remains an ongoing concern and a major complaint from end users.
Figure 3: Sensor responses (final indications) to various hydrogen levels prior to and following deployment. (A and C): Performance of two hydrogen sensors in a clean environment (e.g., laboratory) relative to an industrial deployment (B and D). Both Model 1 and Model 2 were stable for over a 6-month deployment in the clean
environment, but Model 2 lost sensitivity in the industrial environment.

8 This report is available at no cost from the National Renewable Energy Laboratory (NREL) at www.nrel.gov/publications.
3.0 HYDROGEN SENSORS GAPS AND BARRIERS
The performance targets shown in Figure 1 represent a short list of critical metrics identified by DOE in their MYPPs [15, 16]. More thorough reviews of sensor metrics and gaps were developed by the JRC [18] and NREL [20]. These analyses are now several years old and need to be updated to account for technical advances. Moreover, as the use of hydrogen increases, new markets will emerge (such as hydrogen in natural gas), and these will impose new and unique challenges to the use of hydrogen sensors. Although there have been recent improvements in sensor performance (e.g., see Figure 2), performance issues still remain (e.g., see Figure 3). Furthermore, the results illustrated in Figure 2 were for specific models of a sensor. Because of variability in design from one manufacturer to another, comparable performance is not guaranteed even for a different model of the same platform. The NREL and JRC sensor laboratories have been developing a list of ongoing issues on hydrogen sensor performance based on the experiences with the ongoing partnerships with the hydrogen community. A brief synopsis of the perceived performance gaps is summarized below, separated into end-user requirements as defined by metrological metrics, logistic metrics, and operational metrics, and from a sensor manufacturer’s perspective. Representative examples of identified gaps are presented for illustration.
3.1 General Metrological Metrics
The most important and obvious performance parameters for a hydrogen sensor pertain to the metrological performance parameters of the device. These are those metrics that are directly related to the ability of the sensor to perform the analytical measurements required by the application. Examples include the sensor measurement range and lower detection limit. Other metrics and a detailed description of each can be found elsewhere [13, 20]. Hydrogen sensors are commercially available that meet most of the common analytical requirements for safety applications. However, there are still gaps in some metrics, some of which are discussed below. These generally pertain to the sensor stability (short and long term).
Selectivity: The avoidance of false alarms is critical for assuring end-user confidence in sensor technology. Factors that may potentially induce a false alarm must be identified. Although there are now models that will not respond to methane, CGS hydrogen sensors had a tendency to alarm in the presence of other combustible gases [21]. Although there have been improvements in selectivity, false alarms have also been reported [21], which can be at best a nuisance, but can also lead to a disregard of the sensor alarms by end users. It is important that hydrogen sensors are not used in an environment where an interferent can cause a false response on the sensor. Sensors based upon palladium thin films are noted for the near-ideal selectivity to hydrogen, but there are relatively few commercial versions available and those tend to be expensive.
Lifetime/Sensor Stability (Impact of Environment): Factors that affect sensor long-term stability under normal deployment conditions are critical. These can include physical stressors, such as fluctuations in environmental parameters (T, P, relative humidity), which can affect the sensor background signal and accelerate device degradation. Chemical stressors (contaminants), even if they do not induce a measureable signal may also affect catalyst functionality over time, and thus ultimately lead to sensor failure. As indicated above, premature failure in the field remains a common complaint regarding hydrogen sensors.
3.2 Deployment Metrics
The deployment parameters pertain primarily to installation or incorporation of the sensor for a specific application and are typically one-time, up-front considerations. An example of a deployment metric would be the up-front cost of the sensor (e.g., the capital cost). As with the metrological metrics, a more complete list of logistic metrics have been presented elsewhere [13, 20].

9 This report is available at no cost from the National Renewable Energy Laboratory (NREL) at www.nrel.gov/publications.
Capital Cost: Capital cost refers primarily to the actual purchase price of the sensor. An acceptable capital cost is guided by the application and by end-user expectations, but in general, the desire is for the capital cost to be as low as possible. Capital cost is one of two main factors covering the cost of ownership for the sensor; the other is maintenance cost, which is covered in Section 3.3, Operational Metrics.
Sensor Placement: The positioning of a sensor within a facility can be critical in optimizing its effectiveness. While there are general suggestions for sensor placement within a facility, these are often based on intuition. There are no formal guidelines on sensor placement. There is currently no guidance in documents such as National Fire Protection Association (NFPA) 2 [22] or the International Fire Code (IFC) [23], which actually mandate the use of sensors for some applications in the United States.
3.3 Operational Metrics
The operational parameters are those metrics that pertain to operation and maintenance of the sensors, once they have been installed. Unlike deployment parameters, these are ongoing or recurring considerations or activities. An obvious example of an operational metric would be the maintenance cost, including especially the calibration requirements of the sensor, which is still perceived as a main barrier by many end users impeding the use of hydrogen sensors. A more complete list of operational metrics has been presented elsewhere [13, 20].
Maintenance Cost (Including Calibration Cost): There are two factors affecting the cost of ownership for a hydrogen sensor. One is the upfront cost (e.g., the purchase price, as discussed under Deployment Metrics) and the other is maintenance expenses. Because of the need to perform regular calibrations, maintenance cost can dominate the cost of ownership. The maintenance requirements was identified as a major barrier to acceptance of hydrogen sensors [20]. Minimizing or eliminating the calibration requirement for a defined period (ideally for over 5 years) with a low-cost plug and play substitution would be beneficial for several applications, including large scale deployments in either infrastructure or on-board vehicle applications.
End-of-life Indication: Typically, the output of a safety sensor is zero or at a baseline reading except in the event of an out-of-normal event. The functionality of a sensor is often only demonstrated by a challenge with a hydrogen test gas, which is typically performed only during calibration procedures. A non-functional sensor can lead to a false negative, which, of course, can be dangerous.
3.4 Sensor Manufacturer/Developer Perspective
The above discussion on metrological, deployment, and operational metrics pertains mainly to the use of a hydrogen sensor, and thus are from an end-user perspective. Manufacturers will typically provide specifications to at least some of the identified parameters, which can help guide sensor selection. However, we have found that the sensor manufacturer’s perspective is also a consideration. Some examples that affect sensor development include market sustainability and sensor test protocols/ certification requirements.
Market Sustainability: The use of hydrogen in the commercial market is growing, but it is not yet fully mature. In our sensor testing, we have encountered some impressive hydrogen sensor technology with regard to metrological performance, including selectivity and stability. However, one of the best performing sensor that we have encountered is no longer commercially available because, in part, of the lack of a market to support the product line.
Certification Requirements: In the United States, sensors certified to specific performance standards are required. For example, not only does the IFC require that hydrogen sensors be used for certain

10 This report is available at no cost from the National Renewable Energy Laboratory (NREL) at www.nrel.gov/publications.
applications (e.g., hydrogen vehicle repair facilities) [23], it further stipulates that the hydrogen sensor be certified to a specific performance standard (e.g., UL 2075 [24]). While there are ways to circumvent this requirement, such as by demonstrating a comparable safety level through an engineering study, they are usually time-consuming and expensive. However, the cost of certification is hard to justify with the current market and sales, hence manufacturers are not meeting this requirement. This also impacts deployment metrics from the end-user perspective because of the need to find alternative means to meet the IFC requirement.
3.5 New and Emerging Applications
There are a growing number of new and unique hydrogen applications, which often will present unique challenges to hydrogen sensors. New applications for hydrogen sensors range from conventional production units (e.g., electrolyzers, reformers) to the use of landfill gases for hydrogen production. Other specialized uses exist. Some examples are presented below.
Power to Gas: The addition of hydrogen into natural gas is one approach to enhance the use of renewable energy; instead of curtailment when generation exceeds demand, excess electricity can be used to produce hydrogen for use in the gas grid. The measurement of the hydrogen in natural gas is important, but detection methods with conventional process control analyzers (e.g., gas chromatographs or mass spectrometers) are cumbersome and expensive. Low-cost sensors would be an attractive alternative, but sensors do not yet exist that can reliably quantify hydrogen with a large natural gas background.
Hydrogen Production by Electrolysis: Water electrolysis is the second most common means to produce hydrogen. It is viewed as a renewable provided renewable sources (wind or solar) are used for the electrical power. As with other hydrogen operations, electrolyzers will need hydrogen sensors to monitor for unintended releases. While used for hydrogen production, electrolysis will also generate an oxygen stream; this process is in fact used in closed environments, such as submarines and spacecraft, to generate breathing air. The oxygen stream should be devoid of hydrogen. Operationally, the oxygen stream is also at a high humidity, which over time may affect the stability of some sensors, which were designed for operation under ambient conditions.
4.0 THE PATH FORWARD—THE HYDROGEN SENSOR WORKSHOP
The gaps listed in Section 3 were based on direct interactions with stakeholders in the hydrogen community. The discussion in Section 3 was primarily from an end-user perspective, although the manufacturer perspective was also introduced. Sensor metrics were separated into different categories (e.g., the metrological, deployment, and operational parameters). Further details on the distinction between the metrological, deployment, and operational sensor performance parameters have been published, along with a list of metrics for each category [12]. Such an approach allows for assessing a technology for a specific application. In fact, for a given metric (e.g., response time), the required specification will vary with the application [20].
The examples of hydrogen sensor gaps discussed in Section 3 represent only a short list of possible gaps, which will be more fully developed for the ICHS Conference, based upon a series of hydrogen sensor workshops that are scheduled prior to the International Conference on Hydrogen Safety.
The JRC and NREL sensor laboratories were established as a resource for the hydrogen community. The common goal of the laboratories is to ensure that hydrogen sensors are available to meet the needs of the hydrogen infrastructure and to educate the hydrogen community on the proper use of hydrogen sensors. This is achieved by working directly with sensor developers and manufacturers to provide an independent assessment of sensor performance. The sensor laboratories also work closely with end users to guide the proper selection and use of hydrogen sensors. To help identify and prioritize gaps, a series of workshops

11 This report is available at no cost from the National Renewable Energy Laboratory (NREL) at www.nrel.gov/publications.
are being organized by the JRC and NREL Sensor Laboratories. A primary goal of the workshop is to update the sensor gap analysis. The gap analysis will be based directly on input from stakeholders in the hydrogen community, including both end-users (stationary and automotive) and sensor manufacturers. An outcome of the workshops will be a guidance document to outline proposed research directions to DOE, FCH JU, and sensor manufacturers. The findings of the two workshops, including the updated gap analysis and guidance document, will also be covered at the 7th International Conference on Hydrogen Safety in the talk corresponding to this paper.
The specific details on the workshops are:
• Hydrogen Sensor Workshop—End User Needs versus Capability of Current Technology, Brussels, Belgium (FCH JU Headquarters), organized by JRC, NREL, and FCH JU (May 10, 2017) (see Figure 4)
• Hydrogen Sensor Workshop, Golden Colorado, organized by NREL and JRC (2017). Details are pending.
Figure 4: Announcement for the Hydrogen Sensor Workshop, jointly organized by the JRC, NREL, and the FCH JU.
Understanding gaps is important to improve sensor reliability. Accordingly, to a major extent the respective research programs at the JRC and NREL sensor laboratories have been guided by the gaps in sensor performance, including characterization of sensor responses to chemical stresses [25]. The study of the impact of chemical stresses on sensor performance is ongoing and expanding. The sensor laboratories are also studing indoor hydrogen releases to help develop guidance documents on sensor releases. Future research activity will, in part, be guided by the outcome of the sensor workshops.

12 This report is available at no cost from the National Renewable Energy Laboratory (NREL) at www.nrel.gov/publications.
ACKNOWLEDGMENTS
This work was supported by the U.S. Department of Energy under Contract No. DE-AC36-08GO28308 with Alliance for Sustainable Energy, LLC, the Manager and Operator of the National Renewable Energy Laboratory. Funding was provided by the U.S. Department of Energy Office of Energy Efficiency and Renewable Energy Fuel Cell Technologies Office. The U.S. Government retains and the publisher, by accepting the article for publication, acknowledges that the U.S. Government retains a nonexclusive, paid-up, irrevocable, worldwide license to publish or reproduce the published form of this work, or allow others to do so, for U.S. Government purposes.
REFERENCES
1. DOE Fuel Cell Technologies Program, http://www1.eere.energy.gov/hydrogenandfuelcells/. 2. U.S. Department of Energy, http://energy.gov/mission. 3. European Commission, Strategic Energy Technologies Information System,
http://setis.ec.europa.eu/about-setis/technology-map/2011_Technology_Map1.pdf/view. 4. Boon-Brett, L., Bousek, J., Castello, P., Salyk, O., Harskamp, F., Aldea, L., and Tinaut, F., Reliability
of Commercially Available Hydrogen Sensors for Detection of Hydrogen at Critical Concentrations: Part I - Testing Facility and Methodologies, Int. J. Hydrogen Energy, 33, 2008, pp. 7648-7657.
5. NREL Sensor Testing Laboratory, see: http://www.nrel.gov/hydrogen/facilities_hsl.html. 6. Black, G., Boon-Brett, L., Harskamp, F., Moretto, P., Buttner, W. J., Post, M. B., Burgess, R., Rivkin,
C., Interim Report of the SINTERCOM Project, Technical Report: EUR 24854 EN – 2011. 7. Buttner, W., Hydrogen-Powered Vehicles–A Safe Alternative to Traditional Gasoline Internal
Combustion Engines, KPA Technical Note (March 10, 2017) http://www.kpaonline.com/ehs/hydrogen-powered-vehicles-safe-alternative-traditional-gasoline-internal-combustion-engines
8. Characterization of On-Board Vehicular Hydrogen Sensors, Technical Information Report (TIR), SAE J3089 in development
9. Buttner, W., Rivkin, C., Schmidt, K., Hartmann, K., Schmidt, H., and Weidner, E., Empirical Profiling of Cold Hydrogen Plumes formed from Venting of LH2 Storage Vessels, , To be presented: 7th International Conference on Hydrogen Safety, Hamburg, Germany, September 11-17, 2017.
10. Buttner, W., Post, M., Burgess, R., Rivkin, C., Boon-Brett, L., and Palmisano, V., An Assessment on the Quantification of Hydrogen Releases Through Oxygen Displacement Using Oxygen Sensors, Int. J. Hydrogen Energy, 39, 2014, pp. 20491-20496.
11. Buttner, W., Rivkin, C., Burgess, R., Hartmann, K., Bloomfield, I., Bubar, M., Post, M., Boon-Brett, L., Weidner, E., and Moretto P., Hydrogen Monitoring Requirements in the Global Technical Regulation on Hydrogen and Fuel Cell Vehicles, Int. J. Hydrogen Energy 42, 2017, pp. 7664-7671. http://www.sciencedirect.com/science/article/pii/S0360319916307893).
12. Buttner, W., Post, M., Burgess, R., Rivkin, C., Boon-Brett, L., Palmisano, V., Bonato, C., and Harskamp, F., Steering Committee Progress Report on Hydrogen Sensor Performance Testing and Evaluation under the Memorandum of Agreement between NREL, U.S. DOE and JRC-IET, EC, Technical Report, NREL/TP-5600-57207, December 2012.
13. Hübert, T., Cost-effective and Reliable Hydrogen Sensors for Facilitating the Safe Use of Hydrogen, H2Sense-Project final report, October 2014.
14. Collaboration Arrangement for Research and Development in Energy-Related Fields between the U.S. Department of Energy and the Joint Research Centre of the European Commission, dated June 2, 2016.
15. Hydrogen, Fuel Cells & Infrastructure Technologies Program, Multi-Year Research, Development and Demonstration Plan Planned program activities for 2005-2015, (2007).

13 This report is available at no cost from the National Renewable Energy Laboratory (NREL) at www.nrel.gov/publications.
http://www.nrel.gov/docs/fy08osti/39146.pdf 16. DOE FCTO Multi-Year Research, Development and Demonstration Plan, (2012).
https://energy.gov/sites/prod/files/2015/06/f23/fcto_myrdd_safety_codes.pdf 17. Hübert, T., Buttner, W., and Boon-Brett, L., Sensors for Safety and Process Control in Hydrogen
Technology, CRC Press. ISBN 9781466596542 (2015).( https://www.crcpress.com/Sensors-for-Safety-and-Process-Control-in-Hydrogen-Technologies/Hϋbert-BoonBrett-Buttner/9781466596542)
18. Brett, L., Bousek, J., Black, G., Moretto, P., Castello, P., Hűbert, T., and Banach, U., Identifying Performance Gaps in Hydrogen Safety Sensor Technology for Automotive and Stationary Applications, Int. J. Hydrogen Energy, 35, 2010, pp. 373-384.
19. ISO 26142 Hydrogen Detector Apparatus—Stationary Applications. 20. Buttner, W., Burgess, R., Post, M., and Rivkin, C., Summary and Findings from the NREL/DOE
Hydrogen Sensor Workshop (June 8, 2011), NREL Technical Report NREL/TP-5600-55645, 2012, http://www.nrel.gov/docs/fy12osti/55645.pdf
21. Hydrogen Tools, Lessons Learned, Two False H2 Alarms in Research Laboratory, www.h2tools.org/lessons
22. NFPA 2: Hydrogen Technologies Code,” accessed May 27, 2015, http://www.nfpa.org/codes-and-standards/document-information-pages?mode=code&code=2&tab=nexteditio .
23. International Code Council, Inc., 2009 International Fire Code, Country Club Hills, IL: International Code Council, 2009, (http://www.efsec.wa.gov/Tesoro%20Savage/Land%20Use/Friends%20of%20the%20Gorge/14%20-%20International%20Fire%20Code%20(2012).pdf).
24. UL 2075: Gas and Vapor Detectors and Sensors, Underwriters Laboratory, September 28, 2007. 25. Palmisano, V., Weidner, E., Boon-Brett, L., Bonato, C., Harskamp, F., Moretto, P., Post, M., Burgess,
R., Rivkin, C., and Buttner, W.J., Selectivity and Resistance to Poisons of Commercial Hydrogen Sensors, Int. J. Hydrogen Energ, 40, 2015, pp. 11740-11747.