hydrogen sorption in palladium doped microporous...
TRANSCRIPT
HYDROGEN SORPTION IN PALLADIUM
DOPED MICROPOROUS MATERIALS
by
PHILIP HAMILTON
A thesis submitted to the University of Birmingham for the
degree of Masters in Research (MRes)
School of Metallurgy & Materials
College of Engineering & Physical Sciences
University of Birmingham
B15 2TT
United Kingdom
September 2009

University of Birmingham Research Archive
e-theses repository This unpublished thesis/dissertation is copyright of the author and/or third parties. The intellectual property rights of the author or third parties in respect of this work are as defined by The Copyright Designs and Patents Act 1988 or as modified by any successor legislation. Any use made of information contained in this thesis/dissertation must be in accordance with that legislation and must be properly acknowledged. Further distribution or reproduction in any format is prohibited without the permission of the copyright holder.

ABSTRACT
This research investigated “hydrogen spillover” which has been suggested to improve
the hydrogen uptake of bridged and chemically doped porous materials at room
temperatures. XRD, Temperature Programmed Desorption and hydrogen sorption
measurements were used to characterise the as-received and palladium doped porous
materials.
The hydrogen uptakes of as-received Maxsorb (activated carbon), Black Pearls
(carbon furnace black) and MOF-5 (metal organic framework) were all very low
(<0.16 wt.%) at room temperature and 16 bar. Bridging the Black Pearls and Maxsorb
carbon samples with 5 wt.% Pd/C resulted in fractionally higher hydrogen uptakes
(0.01 wt.%). These results bore a closer resemblance to a physical mixture of Pd and
carbon which suggested that the bridges had not been formed and spillover was not
occurring.
A higher wt.% Pd chemically doped carbon showed an initial rapid hydrogen uptake
(0.03 wt.% at <1 bar) followed by a shallower near linear uptake above this pressure.
The hydrogen uptake seemed more consistent with palladium and carbon sorbing
independently, rather than hydrogen spilling over from palladium to carbon giving
enhanced uptake. However, good contact between Pd and carbon must be established
and the result must be replicated to confirm its validity in the face of much contrary
literature.

Soli Deo Gloria
ACKNOWLEDGEMENTS
I would like to thank my supervisor Dr. David Book for his knowledge, enthusiasm
and positive approach to this research, Dr. Allan Walton for his perseverance,
discussions and instruction especially on the IGA & HTP, Phil Chater for his
assistance in the chemistry department and the Hydrogen Research Group for
providing an enjoyable atmosphere to study in. I also thank Alvaro Amieiro and the
rest of the staff at Johnson Matthey for their discussions and assistance in the
synthesis of palladium doped microporous samples. Furthermore, I would also thank
my fiancée, family and friends for their support and encouragement throughout the
year. Finally, my thanks to Birmingham University for paying my tuition fees and for
the generous financial support of the Engineering and Physical Sciences Research
Council (EPSRC).

TABLE OF CONTENTS
1. INTRODUCTION.................................................................................................................1
1.1 BACKGROUND .....................................................................................................................1
1.1.1 Adverse Climate Change............................................................................................1
1.1.2 Negative Health Effects..............................................................................................1
1.1.3 Resource Depletion....................................................................................................2
1.1.4 Energy Security..........................................................................................................2
1.2 A FUTURE ENERGY ECONOMY ............................................................................................3
1.2.1 Production..................................................................................................................4
1.2.2 Utilisation ..................................................................................................................5
1.2.3 Safety..........................................................................................................................5
1.3 HYDROGEN STORAGE ..........................................................................................................6
1.3.1 Compression ..............................................................................................................6
1.3.2 Liquid Storage............................................................................................................7
1.3.3 Solid State Storage.....................................................................................................9
1.3.4 Chemisorption............................................................................................................9
1.3.5 Physisorption ...........................................................................................................10
1.4 GAS ADSORPTION & RELIABILITY OF MEASUREMENT ...................................................14
1.5 SPILLOVER ......................................................................................................................16
2. LITERATURE REVIEW ..................................................................................................17
2.1 BACKGROUND ...................................................................................................................17
2.2 HYDROGEN SPILLOVER FOR STORAGE ..............................................................................20
2.2.1 Hydrogen spillover by physical mixing....................................................................21
2.2.2 Hydrogen spillover using carbon bridges................................................................21
2.2.3 Hydrogen spillover by chemical doping and other methods ...................................24
2.2.4 Hydrogen spillover on other novel storage materials .............................................26
2.3 TEMPERATURE PROGRAMMED DESORPTION SUPPORT FOR HYDROGEN SPILLOVER............27
2.4 PRETREATMENT STUDIES ...................................................................................................28
2.5 SPILLOVER, SURFACE AREA & HEAT OF ADSORPTION .......................................................29
2.6 SUMMARY OF SPILLOVER ENHANCEMENTS........................................................................31
2.7 BIOSYNTHESIS OF PALLADIUM NANOPARTICLES ...............................................................32
2.8 AIM....................................................................................................................................35
3. EXPERIMENTAL..............................................................................................................36
3.1 MATERIALS SYNTHESIS .....................................................................................................36
3.1.1 As-received samples.................................................................................................36
3.1.2 Bridged samples.......................................................................................................36
3.1.3 Chemically doped samples.......................................................................................37
3.2 MATERIALS CHARACTERISATION ......................................................................................37
3.2.1 Gravimetric hydrogen measurements ......................................................................38
3.2.2 Volumetric hydrogen measurements........................................................................39
3.2.3 Temperature Programmed Desorption (TPD).........................................................41
3.2.4 X-Ray Diffraction (XRD) .........................................................................................41
3.2.5 Gas Pycnometry .......................................................................................................43
3.3 EXPERIMENTAL ERRORS ....................................................................................................43

4. RESULTS & DISCUSSION...............................................................................................46
4.1 XRD OF MATERIALS .........................................................................................................47
4.1.1 XRD of commercial activated carbon supports doped with palladium ...................47
4.1.2 XRD of Bridged Black Pearls 2000 .........................................................................48
4.1.3 XRD of 6 wt.% Black Pearls 2000 (JM) ..................................................................49
4.1.4 XRD of Bridged Maxsorb.........................................................................................50
4.1.5 XRD of As-received and Bridged MOF-5................................................................51
4.2 HYDROGEN STORAGE PROPERTIES OF MATERIALS ...........................................................52
4.2.1 Hydrogen storage in As-received Palladium...........................................................52
4.2.2 Hydrogen storage in Maxsorb .................................................................................55
4.2.3 Hydrogen storage in Black Pearls 2000..................................................................58
4.2.4 Hydrogen storage in MOF-5 ...................................................................................63
4.2.5 Summary of hydrogen storage in Pd Bridged materials..........................................65
5 CONCLUSION ....................................................................................................................67
6 FUTURE WORK.................................................................................................................69
7 APPENDIX...........................................................................................................................70
7.1 Chemical doping method for MOF-5..........................................................................70
7.2 Methodological problems associated with the HTP system .......................................70
7.3 Hydrogen storage in Pd-doped carbon made from pyrolysed bacteria .....................71
8 REFERENCES.....................................................................................................................75

1 - INTRODUCTION
1.1 - BACKGROUND
There are growing pressures to progress from a fossil fuel based economy to an alternative,
more sustainable energy economy. The multiple drivers for change in energy economy include
adverse climate change, negative health effects, resource depletion and energy security
concerns.
1.1.1 - Adverse Climate Change
Global greenhouse gas emissions due to human activities have grown since pre-industrial
times by 70% between 1970 and 20041. Although the CO2 levels do naturally rise and fall, the
current atmospheric concentrations of 387 ppm determined from ice cores far exceed the
natural range of the past 750,000 years2. Although climate predictions are dependent on which
climate model is used and assumptions made about future global emissions, the
Intergovernmental Panel on Climate Change estimates a global average temperature rise of
1.8 - 4°C this century1. There is also increasing statistical confidence in projected increases in
extremes of weather such as droughts, heat waves and floods.
1.1.2 - Negative Health Effects
Air pollution such as SO2, NO2, O3 and particulate matter from fossil fuel combustion have
been linked to cardiovascular and respiratory problems3. Continued global warming would
1

increase the spread of disease due to elevated temperatures and through damaged sanitation
systems by extreme weather events. Rising sea levels as a result global warming pose a
serious risk to both developed and undeveloped coastal populations such as London, New
York, Shanghai and the Ganges delta in Bangladesh.
1.1.3 - Resource Depletion
There are a variety of “peak oil” models that predict the maximum rate of global oil
production, after which, the production enters into terminal decline. Many models suggest that
we are already at, or have nearly reached peak oil. This problem is further exacerbated by the
projection of world marketed energy consumption increasing by 50 % from 2005 to 2030 if
current laws and policies remain unchanged4. This does not take into account the additional
expected demand from developing countries such as China and India. Much of the deviation
between models comes from confusion surrounding world oil reserves.
1.1.4 - Energy Security
Energy resources such as coal, gas, oil and uranium are not uniformly distributed across
continents and countries which creates a dependence on a few countries for energy. The
changeable energy policies of distributing governments are not conducive for a long term and
secure energy supply. Recent instability in Iraq, Venezuela and Nigeria, and the arguable use
of oil for political influence in Russia and the Middle East contribute to feelings of energy
uncertainty5.
2
The UK government recently released a review6 on the economics of climate change that
concluded that the benefits of strong, early action on climate change outweigh the costs of
doing nothing now and that there is still time to avoid the worst economic impacts of climate
change, if strong action is taken now.
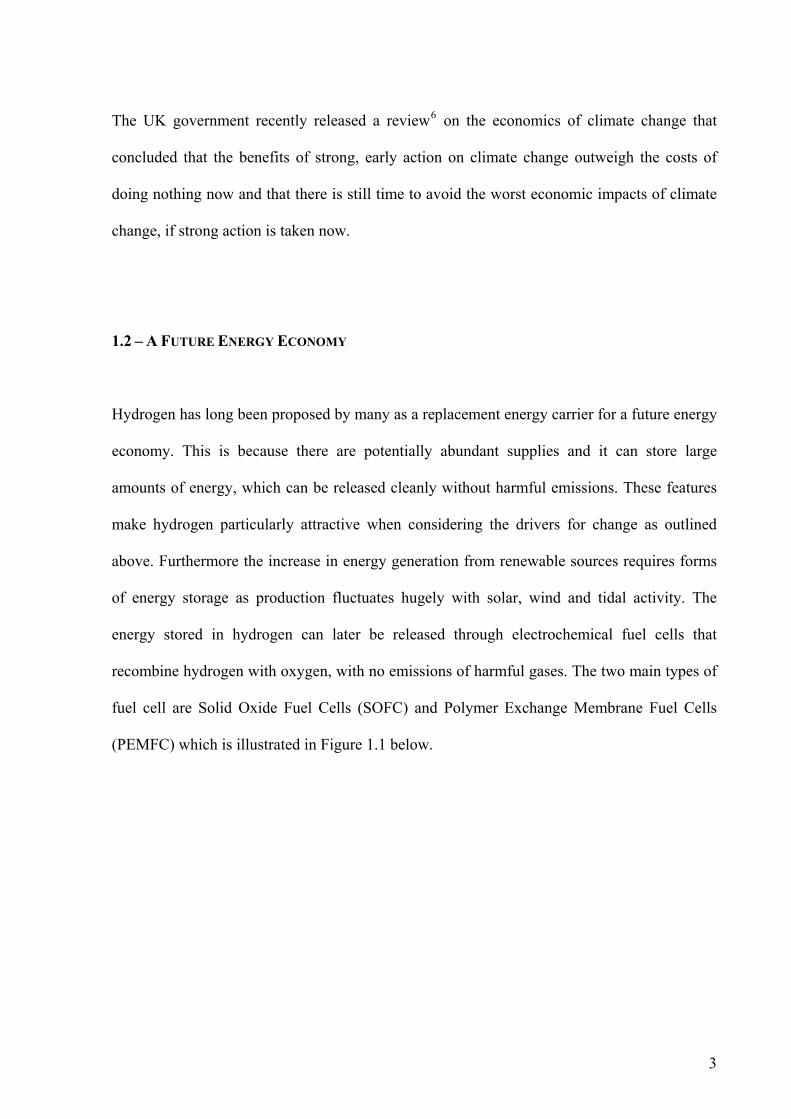
1.2 – A FUTURE ENERGY ECONOMY
Hydrogen has long been proposed by many as a replacement energy carrier for a future energy
economy. This is because there are potentially abundant supplies and it can store large
amounts of energy, which can be released cleanly without harmful emissions. These features
make hydrogen particularly attractive when considering the drivers for change as outlined
above. Furthermore the increase in energy generation from renewable sources requires forms
of energy storage as production fluctuates hugely with solar, wind and tidal activity. The
energy stored in hydrogen can later be released through electrochemical fuel cells that
recombine hydrogen with oxygen, with no emissions of harmful gases. The two main types of
fuel cell are Solid Oxide Fuel Cells (SOFC) and Polymer Exchange Membrane Fuel Cells
(PEMFC) which is illustrated in Figure 1.1 below.
3

Figure 1.1 shows a Proton Exchange Membrane (PEM) fuel cell
1.2.1 - Production
Although there are large amounts of hydrogen in the world, it naturally exists being
chemically bonded to other elements e.g. oxygen in H2O, rather than as a free gas. Production
is currently achieved primarily through steam reforming of natural gas but is also possible by
coal gasification. Electrolysis and other novel methods including photolytic processes and
biological methods are also currently possible. Future methods of hydrogen production
include high temperature electrolysis, which offers increased efficiency as some of the energy
required to split hydrogen and oxygen is provided by the higher temperatures. These high
temperatures could be generated from high temperature energy generation plants including
nuclear, concentrated solar and geothermal. Alternatively, thermochemical processes could
potentially be taken advantage of which may use the sulphur-iodine cycle to produce
hydrogen7.
4

1.2.2 - Utilisation
Currently, the vast majority of hydrogen is either used in agriculture in the production of
ammonia for fertilizer through the Haber process, or in the oil industry to convert heavy crude
oil distillation fractions to lighter hydrocarbons through hydrocracking. Future utilisation of
hydrogen could include long term energy storage for balancing varying supply from low
carbon/renewable energy sources with varying demand, a replacement for fossil fuels in the
transport and domestic sectors and in portable electronics such as mobile phones and laptops
which could be powered by fuel cells.
1.2.3 – Safety
Despite the advantages of using hydrogen as a fuel source, there are some potential safety
concerns. These however, are to be expected from all good fuels that are capable of carrying
large amounts of energy. The disadvantages are that hydrogen has a very wide explosive limit
in air (4 – 75%), low ignition energy, a clear flame in daylight and is easily leaked. This final
characteristic could also be seen as an advantage as hydrogen gas disperses rapidly away from
the source of the leak and it is also lighter than air, which means that it will not pool as a
liquid fuel would. Changing public perception through increasing public awareness of the
different dangers associated with hydrogen still needs to be properly addressed before
hydrogen will be accepted as a safe energy carrier.
In summary, before a hydrogen/electric economy can be established, issues such as mass
production, storage, distribution and safety must be overcome.
5

1.3 - HYDROGEN STORAGE
The storage of hydrogen is one of these primary challenges to its successful implementation in
an alternative energy economy that includes both mobile and static applications. Although
hydrogen has an excellent gravimetric energy density of around 120 MJ/kg, the volumetric
energy density is substantially poorer in comparison to current fuels: 1 kg of H2 occupying
11 m3 at STP. To put this in perspective, about 4 kg of stored hydrogen would be necessary to
fuel a small car for 400 km. Consequently a technique by which the hydrogen molecules can
be packed more closely is needed. The current target set by the US Department Of Energy
(DOE) for a vehicular hydrogen storage system is 6 wt.% by 2010. The ideal hydrogen storage
method has a good gravimetric density and volumetric density, equilibrium properties near
ambient temperature and pressure, is reversible over many cycles, has fast transfer rate and is
stable in air. Further considerations are costs, recycling and charging infrastructures.
Hydrogen can be stored in three states of matter as a gas, liquid or solid forms. The best
method of storage is often dependent on the intended application. Transport applications are
often the most stringent as they require both high gravimetric and volumetric energy densities.
1.3.1 – Compression
As hydrogen is a gas at room temperature and pressure it can be relatively easily compressed
and stored in cylinders such as that shown in Figure 1.2. These usually have a protective layer,
a carbon fibre shell for strength and a polymer liner to prevent gas leakage.
6
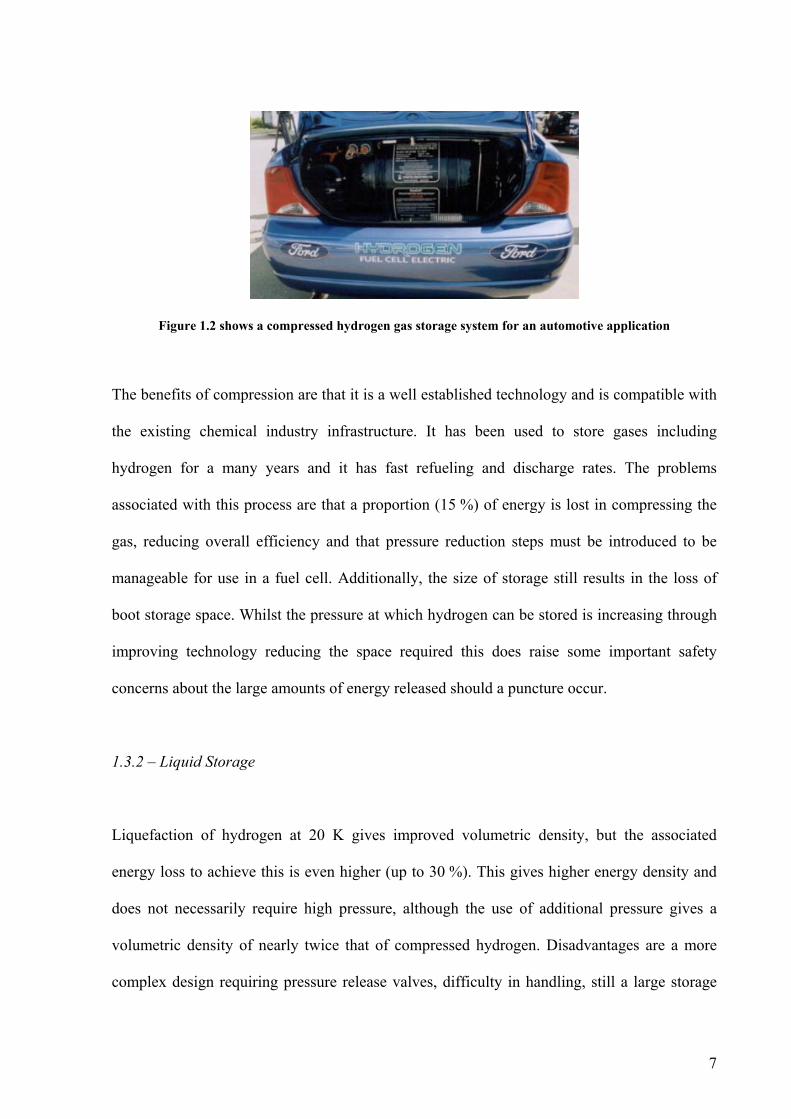
Figure 1.2 shows a compressed hydrogen gas storage system for an automotive application
The benefits of compression are that it is a well established technology and is compatible with
the existing chemical industry infrastructure. It has been used to store gases including
hydrogen for a many years and it has fast refueling and discharge rates. The problems
associated with this process are that a proportion (15 %) of energy is lost in compressing the
gas, reducing overall efficiency and that pressure reduction steps must be introduced to be
manageable for use in a fuel cell. Additionally, the size of storage still results in the loss of
boot storage space. Whilst the pressure at which hydrogen can be stored is increasing through
improving technology reducing the space required this does raise some important safety
concerns about the large amounts of energy released should a puncture occur.
1.3.2 – Liquid Storage
Liquefaction of hydrogen at 20 K gives improved volumetric density, but the associated
energy loss to achieve this is even higher (up to 30 %). This gives higher energy density and
does not necessarily require high pressure, although the use of additional pressure gives a
volumetric density of nearly twice that of compressed hydrogen. Disadvantages are a more
complex design requiring pressure release valves, difficulty in handling, still a large storage
7
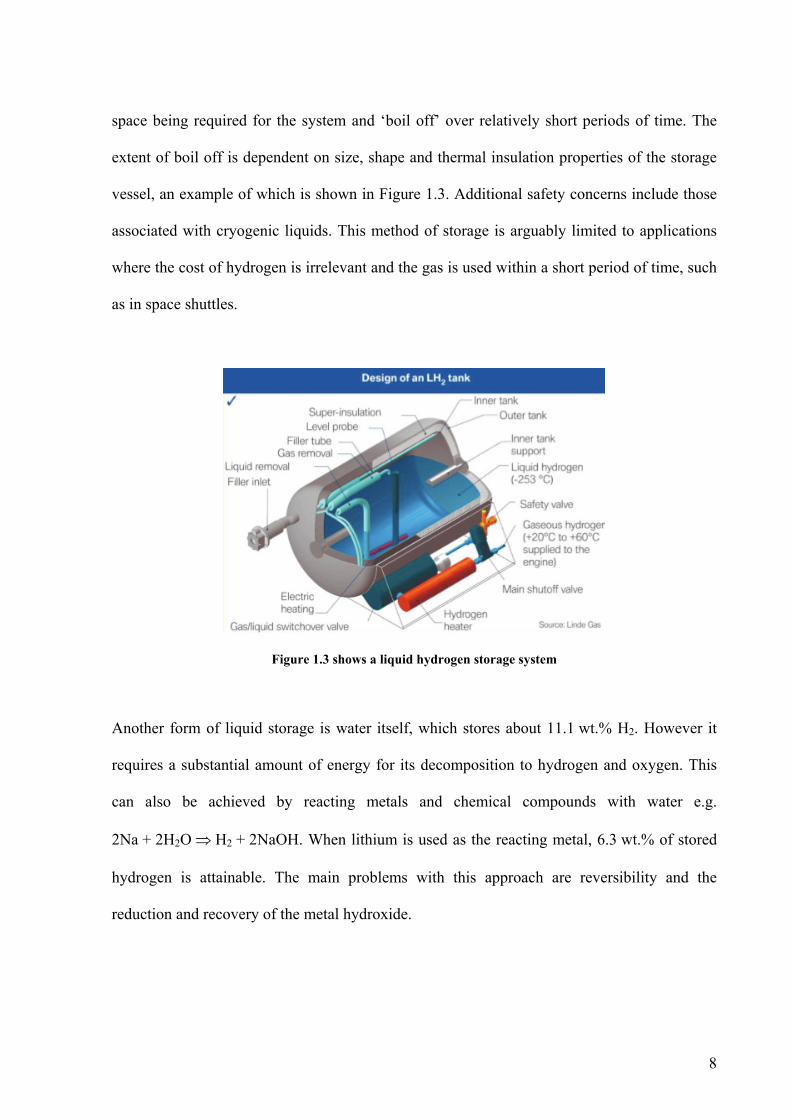
space being required for the system and ‘boil off’ over relatively short periods of time. The
extent of boil off is dependent on size, shape and thermal insulation properties of the storage
vessel, an example of which is shown in Figure 1.3. Additional safety concerns include those
associated with cryogenic liquids. This method of storage is arguably limited to applications
where the cost of hydrogen is irrelevant and the gas is used within a short period of time, such
as in space shuttles.
Figure 1.3 shows a liquid hydrogen storage system
Another form of liquid storage is water itself, which stores about 11.1 wt.% H2. However it
requires a substantial amount of energy for its decomposition to hydrogen and oxygen. This
can also be achieved by reacting metals and chemical compounds with water e.g.
2Na + 2H2O ⇒ H2 + 2NaOH. When lithium is used as the reacting metal, 6.3 wt.% of stored
hydrogen is attainable. The main problems with this approach are reversibility and the
reduction and recovery of the metal hydroxide.
8
1.3.3 - Solid State Storage
Solid state storage of hydrogen can be achieved by “binding” the hydrogen to other materials.
There are two ways by which this can be achieved; chemisorption and physisorption.
1.3.4 – Chemisorption
Chemisorption of hydrogen is possible by using metal hydrides (MgH2) and complex hydrides
(e.g. LiBH4). Hydrogen is dissociated at the surface forming H ions that diffuse into the
material and form ionic, covalent or metallic bonds. The difficulties associated with this type
of storage method area high enthalpy of formation, which requires high temperatures for
desorption in order to break the strong bonds, slow desorption kinetics and a high reactivity
toward air and oxygen. Due to the very high proportion of metal atoms in these storage
materials the gravimetric energy densities are generally poorer for metal hydrides. However,
they do have potential for stationary applications and where weight is not a significant issue
such as submarines or barges. Complex hydrides such as LiBH4 are usually made from
alkaline metal elements in the first three groups of the periodic table. They differ from metal
hydrides in that they change to a ionic and/or covalent compound on absorption. They include
alanates (AlH4-), amides (NH2
-), imides and borohydrides (BH4-). They have advantages of
being lightweight and more importantly the ability to generally bind two H atoms per
metal/non metal. This results in very good volumetric and gravimetric densities, for example
LiBH4 contains around 18 wt.% H2. Unfortunately due to the stronger type of bonding, the
hydrogen desorption temperature is too high and the desorption kinetics too slow for practical
use.
9

1.3.5 – Physisorption
Physisorption can be achieved through a range of high surface area materials including
zeolites, metal organic frameworks, polymers with intrinsic microporosity and a wide range of
carbons. This process takes advantage of the attractive van der Waals forces between
molecular hydrogen and the surface of the storage material for adsorption. This storage
method has good reversibility and fast kinetics. However due to the low enthalpy of
adsorption (5-10 kJ/mol) linked with weak bonding these materials require low temperatures
(∼77 K). To adsorb significant quantities of gas the materials require very high surface areas
(∼1000 m2/g) and small pore sizes.
Carbon materials have long been considered for hydrogen storage as they have low densities,
large diversity of structural forms, extensive pore structures and are able to be widely
modified8. There were some initial extravagant claims9 10, but further research has shown that
there is no unique mechanism operating other than the relationship between increasing
hydrogen uptake with apparent surface area and micropore volume11. The maximum uptake
recorded for high surface area zeolite-like carbon is 6.9 wt% at 77 K and 20 bar12. The storage
properties of carbon aerogels and foams, which are highly porous solid materials with
extremely low densities, are also being investigated. However, as with all low density
materials, these will have very low volumetric storage densities.
BLACK PEARLS 2000 used in this investigation (as seen in Figure 1.4) is a type of carbon
black that can be further categorized to a furnace black or carbon soot due to the method of
manufacture. The furnace method of production involves the incomplete combustion of oil
10

based products. They are primarily used for rubber reinforcement in tyres and also as black
pigment.
Figure 1.4 TEM image of Black Pearls 2000 obtained from Cabot Corporation Ltd.14
This type of carbon black has been previously used for Pd/C catalysts13 and as a hydrogen
storage material14 (see Figure 1.5). It has an external surface area, which means that the
surface area is not as high as those with both an internal and external surface area. The BET
surface area given by suppliers is 1475 m2/g, but previous research at the University of
Birmingham has found it to be 1346 m2/g14.
Figure 1.5 Hydrogen adsorption on as received Black Pearls 2000 at 77 K measured on a Hiden IGA system upto 15 bar 14
11
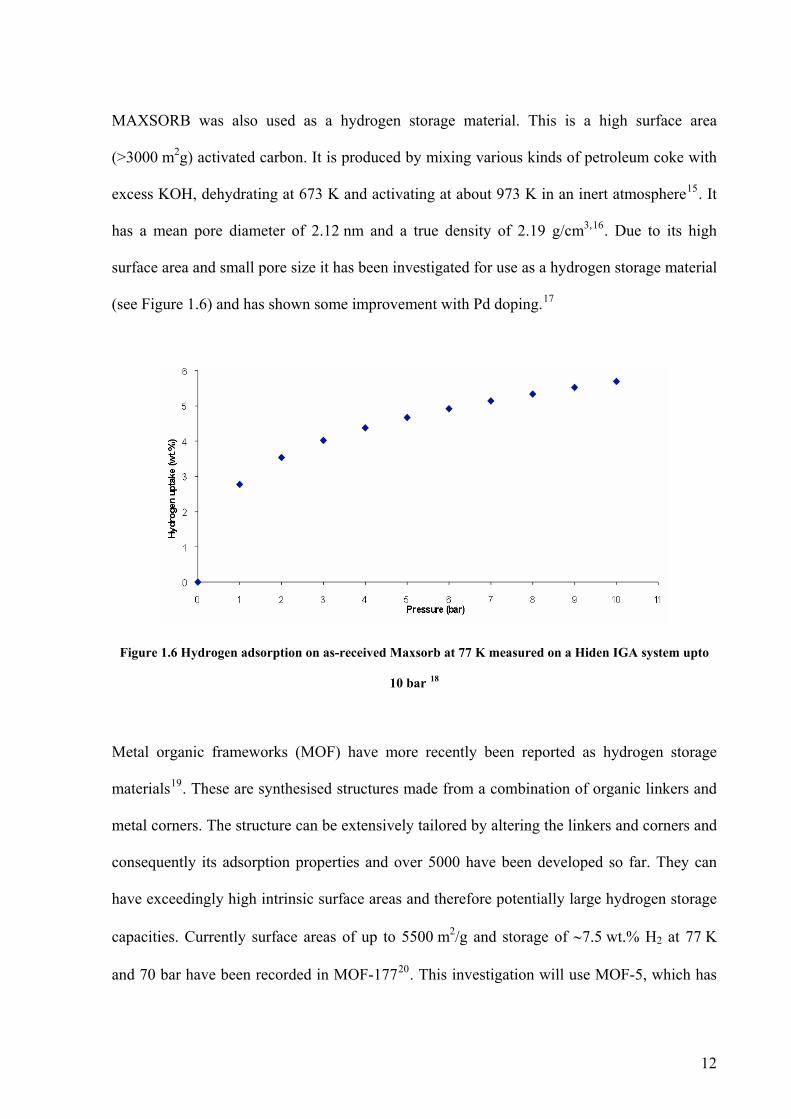
MAXSORB was also used as a hydrogen storage material. This is a high surface area
(>3000 m2g) activated carbon. It is produced by mixing various kinds of petroleum coke with
excess KOH, dehydrating at 673 K and activating at about 973 K in an inert atmosphere15. It
has a mean pore diameter of 2.12 nm and a true density of 2.19 g/cm3,16. Due to its high
surface area and small pore size it has been investigated for use as a hydrogen storage material
(see Figure 1.6) and has shown some improvement with Pd doping.17
Figure 1.6 Hydrogen adsorption on as-received Maxsorb at 77 K measured on a Hiden IGA system upto
10 bar 18
Metal organic frameworks (MOF) have more recently been reported as hydrogen storage
materials19. These are synthesised structures made from a combination of organic linkers and
metal corners. The structure can be extensively tailored by altering the linkers and corners and
consequently its adsorption properties and over 5000 have been developed so far. They can
have exceedingly high intrinsic surface areas and therefore potentially large hydrogen storage
capacities. Currently surface areas of up to 5500 m2/g and storage of ∼7.5 wt.% H2 at 77 K
and 70 bar have been recorded in MOF-17720. This investigation will use MOF-5, which has
12

previously been characterized at low temperatures at the University of Birmingham as seen
below in Figure 1.7.
Figure 1.7 Hydrogen adsorption on MOF-5 at 87 to 217 K measured on a Hiden IGA system upto 2 MPa21
Figure 1.8 below shows the temperature for significant hydrogen release by present hydrogen
storage materials and where the ideal 2010 US Department Of Energy complete system target
is situated. The actual storage material will have to 30-50 % higher to compensate for the
weight of the complete system. Although the storage wt.% of current bridged materials is too
low, they do release hydrogen within the ideal temperature zone.
13

Figure 1.8 Hydrogen wt.% vs release temperature22
1.4 – GAS ADSORPTION & RELIABILITY OF MEASUREMENT
Adsorption is the condensation of gas on the surfaces of a material. The amount of gas
adsorbed is dependent on the properties of the solid and gas, pressure and temperature. An
adsorption isotherm can be achieved when the amount of gas adsorbed is measured versus the
pressure of gas at a fixed temperature. There are six types of isotherm, but the Langmuir
Type I isotherm (see Figure 1.9) is characteristic of the physisorption of gas onto microporous
solids. This shows a sharp initial increase followed by a long plateau as the micropores and
surface sites become filled.
14
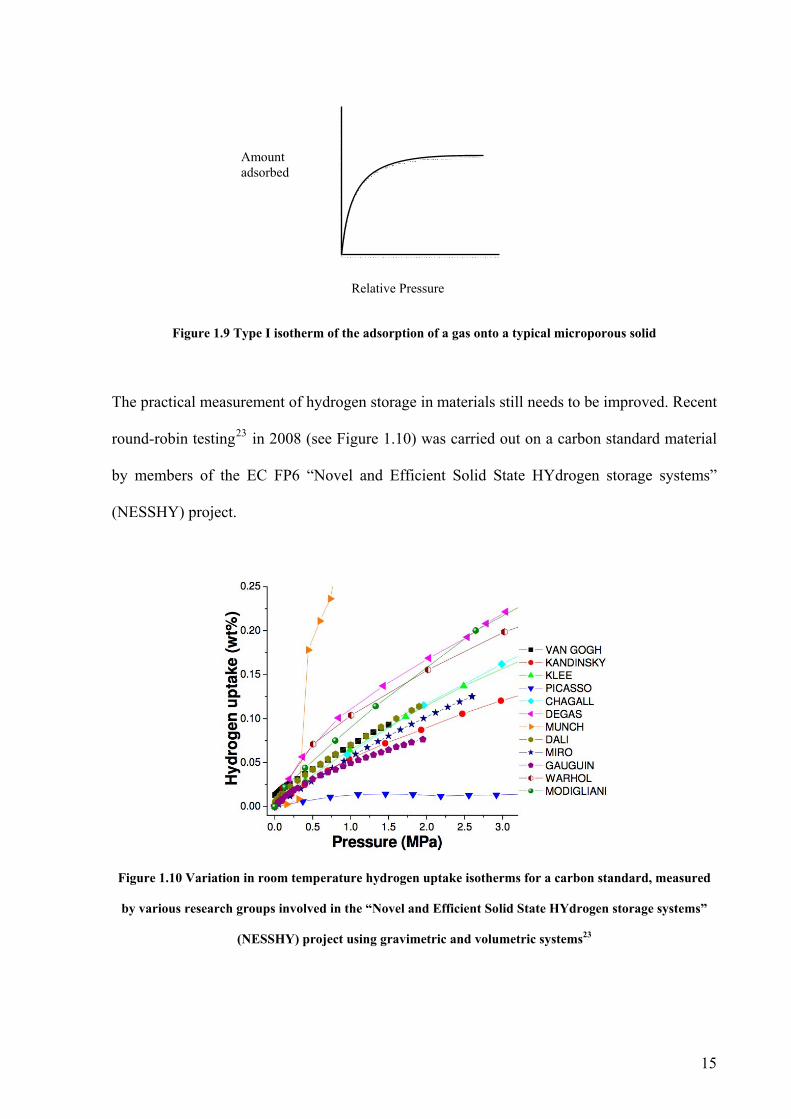
Amount adsorbed
Relative Pressure
Figure 1.9 Type I isotherm of the adsorption of a gas onto a typical microporous solid
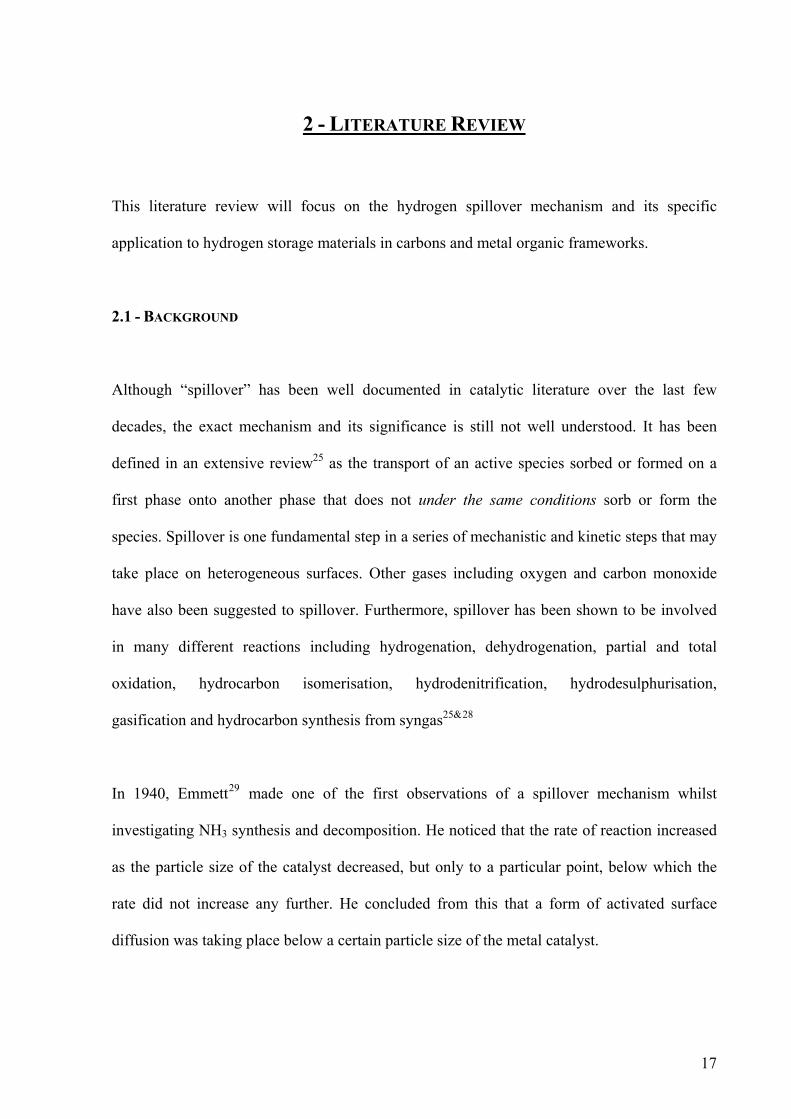
The practical measurement of hydrogen storage in materials still needs to be improved. Recent
round-robin testing23 in 2008 (see Figure 1.10) was carried out on a carbon standard material
by members of the EC FP6 “Novel and Efficient Solid State HYdrogen storage systems”
(NESSHY) project.
Figure 1.10 Variation in room temperature hydrogen uptake isotherms for a carbon standard, measured
by various research groups involved in the “Novel and Efficient Solid State HYdrogen storage systems”
(NESSHY) project using gravimetric and volumetric systems23
15

These results above clearly show a wide scatter in hydrogen uptake at low pressures and
ambient temperatures. This shows that there are still a number of methodological issues to be
resolved before hydrogen uptake measurements of high surface area carbons can be reliably
reported.
1.5 – SPILLOVER
A mechanism of hydrogen spillover has recently been proposed for high surface area materials
that has suggested that the adsorption enthalpy can be increased to be in the region between
physisorption (<10 kJ/mol) and chemisorption (∼50 kJ/mol)24. If spillover is proved to be
correct then enhanced hydrogen adsorption at near ambient temperature and pressure would
be possible. Spillover has been defined25 as the transport of an active species sorbed or formed
on a first phase onto another phase that does not under the same conditions sorb or form the
species. A variety of catalysts have been utilised to increase hydrogen storage, however
palladium has shown the best catalytic effect for the dissociation of hydrogen26. Figure 1.11
below shows a proposed mechanism for hydrogen spillover where H2 dissociates on the metal
particle and protons migrate via a “bridge” to the adsorbent material.
Catalyst
Porous adsorbent material
Figure 1.11 Proposed spillover mechanism27
16
2 - LITERATURE REVIEW
This literature review will focus on the hydrogen spillover mechanism and its specific
application to hydrogen storage materials in carbons and metal organic frameworks.
2.1 - BACKGROUND
Although “spillover” has been well documented in catalytic literature over the last few
decades, the exact mechanism and its significance is still not well understood. It has been
defined in an extensive review25 as the transport of an active species sorbed or formed on a
first phase onto another phase that does not under the same conditions sorb or form the
species. Spillover is one fundamental step in a series of mechanistic and kinetic steps that may
take place on heterogeneous surfaces. Other gases including oxygen and carbon monoxide
have also been suggested to spillover. Furthermore, spillover has been shown to be involved
in many different reactions including hydrogenation, dehydrogenation, partial and total
oxidation, hydrocarbon isomerisation, hydrodenitrification, hydrodesulphurisation,
gasification and hydrocarbon synthesis from syngas25&28
In 1940, Emmett29 made one of the first observations of a spillover mechanism whilst
investigating NH3 synthesis and decomposition. He noticed that the rate of reaction increased
as the particle size of the catalyst decreased, but only to a particular point, below which the
rate did not increase any further. He concluded from this that a form of activated surface
diffusion was taking place below a certain particle size of the metal catalyst.
17
Another early study specifically showing the action of hydrogen spillover was recorded in
1964 by Koobiar30. In this case, the presence of a Pt/Al2O3 (0.5 wt.% Pt) catalyst caused an
instantaneous colour change from yellow to blue associated with the reduction of WO3 to
W4O11 in H2 gas which otherwise did not occur. He concluded that the H2 had dissociated on
the Pt catalyst even at room temperature and migrated to the WO3, but acknowledged that the
details of hydrogen migration were unknown.
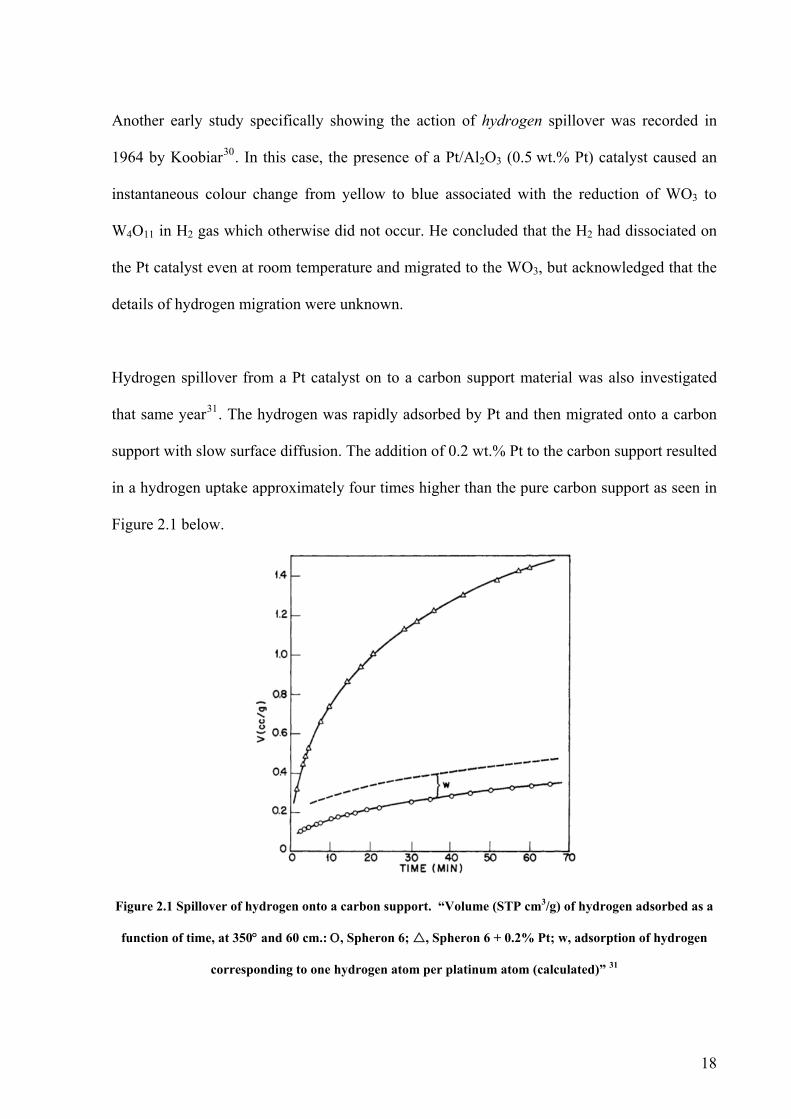
Hydrogen spillover from a Pt catalyst on to a carbon support material was also investigated
that same year31. The hydrogen was rapidly adsorbed by Pt and then migrated onto a carbon
support with slow surface diffusion. The addition of 0.2 wt.% Pt to the carbon support resulted
in a hydrogen uptake approximately four times higher than the pure carbon support as seen in
Figure 2.1 below.
Figure 2.1 Spillover of hydrogen onto a carbon support. “Volume (STP cm3/g) of hydrogen adsorbed as a
function of time, at 350° and 60 cm.: Ο, Spheron 6; , Spheron 6 + 0.2% Pt; w, adsorption of hydrogen
corresponding to one hydrogen atom per platinum atom (calculated)” 31
18

The phrase “spillover” was first coined to describe the mechanism observed in 1969 by
Boudart et al.32. Later that year it was found33 that the uptake of hydrogen by Pt/C was
decreased significantly or nullified when the carbon on the Pt surface was burned off. They
argued that this contamination by carbon was necessary to provide bridges that allowed
surface diffusion of hydrogen from the Pt to the carbon support, as shown in Figure 2.2 below.
Figure 2.2 Illustrates carbon bridges between Pt and receptor. “Spillover of adsorbed atomic hydrogen
from a platinum surface contaminated with carbon in the form of small particles and bridges to
neighboring Spheron 6 particles”33
A similar study34 to the first study in 196430 investigated the platinum catalysed reduction of
WO3 to HxWO3 at room temperature. They found that surface diffusion of hydrogen could be
facilitated by the presence of a co-catalyst such as water or alcohol, which acted as a proton
carrier. The higher the proton affinity of the co-catalyst was, the faster the rate of reduction.
This suggests that the relationship between the receptor material and protons plays a key role
in the diffusion of hydrogen.
2.2 – HYDROGEN SPILLOVER FOR STORAGE
19
Chen et al35 reported a significant enhancement in hydrogen uptake for alkali-metal doped
carbon nanotubes (CNTs). They measured that lithium and potassium doped CNTs adsorbed
an extraordinary 20 wt.% and 14 wt.% of hydrogen respectively at ambient pressure and 473 -
673 K. Due to the potentially huge significance of this study, Yang36 re-examined the results
by repeating the same procedure, but the results were not repeatable. The effect of moisture in
the hydrogen supply on hydrogen uptake of doped CNT was found to be the cause of the
dramatic change in adsorption. This was attributed to the formation of alkaline hydroxides and
hydrates. Yang used >99.999 % purity hydrogen from which “copious amounts of water were
removed” using a series of traps. When this “dry” hydrogen was used for the measurements,
2.5 and 1.7 wt.% of hydrogen were adsorbed by Li and K doped CNTs respectively.
Hydrogen spillover was first used to describe the improvement in hydrogen storage materials
by Leuking & Yang37. They found that the residual NiMgO catalyst used in the production of
multi-walled carbon nanotubes (MWCNTs) also acted as a spillover source. Consequently
these MWCNTs had a higher hydrogen uptake than those which had the catalyst completely
removed by acid reflux. The interaction between metal and support was found to be crucial to
the spillover mechanism as dry mixing of the MWCNT with catalyst did not enhance storage,
but in situ production increased storage capacity by 40 %. Importantly it was also noted that
the process was reversible at moderate temperatures giving a distinct advantage over metal
hydrides and cryogenic porous materials. This reversibility also implied that spillover is
reversible where the spiltover species diffuses back to the source of spillover. Yang and co
workers have conducted much of the following literature on hydrogen spillover.39,41,42,49,53
20
2.2.1 Hydrogen spillover by physical mixing
The hydrogen uptake of physically mixed supported palladium and platinum catalysts with
various carbons has been studied38. This was done at room temperature and included single
wall carbon nanotubes (SWCNT), multiwall carbon nanotubes (MWCNT), graphitic
nanofibres and activated carbon. The results showed that simple physical mixing of the
catalyst with the carbon improved the overall uptake of hydrogen in all carbon materials
tested. Interestingly, the baseline adsorption of the pure carbon was still the predominant
factor in the size of the overall uptake.
This approach has also been used with porous Metal Organic Frameworks (MOFs) by Li &
Yang39. They investigated the physical mixing (9:1 weight ratio) of MOF-5 or IRMOF-8 with
a catalyst of 5 wt.% Pt on active carbon. They found that the hydrogen uptake was increased
by a factor of 3.3 and 3.1 respectively at 298 K and 10 MPa. IRMOF-8 had the highest overall
uptake of 1.8 wt.% at 298 K and 10 MPa. The adsorption was completely reversible and did
not show any saturation up to 10 MPa.
2.2.2 Hydrogen spillover using carbon bridges
In a further study by Lachawiec et al.40, bridge building was investigated by using carbon
bridges. This was found to further increase the H2 storage capacity of AX-21 by a factor of 2.9
at 298 K and 1 bar as seen in Figure 2.3.
21

Figure 2.3 Bridging of carbon (AX-21) to palladium for increased hydrogen uptake. “Low-pressure
hydrogen isotherms at 298 K for the AX-21 receptor: , 5 wt % Pd-C catalyst; , AX-21/Pd-C/carbon
bridge (8:1:1); , AX-21/Pd-C physical mixture (9:1); , AX-21. The dotted line is the sum of the
fractional contributions based on uptake of individual mixture components”40
Using this method the receptor, catalyst and glucose (8:1:1 ratio) were mixed together. This
mixture was then heated up to melt the glucose (to fill the gaps between catalyst and receptor)
and then further heated to carbonise the glucose and form the carbon bridges as seen in
Figure 2.3.
Figure 2.3 Pd particle connected to AX-21 via a carbon bridge40
Lachawiec et al.40 also postulated that spillover was limited by surface diffusion on the
22

receptor rather than the dissociation of H2 on the Pt catalyst. This implied that the contact and
receptor properties are very important.
The possibility of improving the hydrogen spillover through carbon bridging on MOFs has
also been investigated by Li & Yang41. They used a similar method to the previous study to
bridge IRMOF 8. It differed because MOFs are thermally unstable at the temperatures needed
for the carbonization of the glucose. Consequently a sucrose precursor was used instead,
which has a lower melting and carbonization point to avoid collapse of the MOF structure.
Complete carbonization of the bridges was confirmed by TGA. XRD and N2 adsorption
suggested that the structure of the MOF was still intact after the bridging process. The results
showed spillover had a greater effect in MOFs than in carbons with improvements in
hydrogen storage capacity from 0.5 % for pure IRMOF-8 to 2.2 – 4 wt.% for bridged IRMOF-
8 at 298 K and 100 bar. However, there was also significant hydrogen uptake variation
between the three bridged IRMOF-8 samples from 2.2 to 4 wt.% at 298 K and 10 MPa as
shown in Figure 2.4.
Figure 2.4 shows variable improvement in hydrogen uptake of bridged samples outlined in red41
This carbon bridging method has also been used to bridge MOFs with higher surface areas
23

such as MOF-177, which was found to enhance hydrogen adsorption by a factor of 2.542.
The problems with the physical mixing and bridging doping methods outlined above are the
inherent inaccuracies associated with mixing, including sample amounts, grinding time and
intensity which will in turn affect the quality of contact between catalyst, bridge and receptor
particles. However, a recent study has used a mechanical means to produce a more repeatable
method for bridging43. They investigated both mixed and bridged doping methods for two
types of MOFs, MIL-101 and MIL-53. The difference in approach included mixing samples
using a planetary ball miller under argon for 3hrs and using higher wt.% Pt/C catalyst. They
found that physically mixed MIL-101 was improved by a factor of 2 and bridged MIL-101 by
a factor of 3 at 5 MPa and 293 K.
An alternative method for doping giving more reproducible samples and better reliability can
be achieved through chemical doping as discussed in the next section.
2.2.3 - Hydrogen spillover by chemical doping and other methods
Anson et al.17 have doped both SWCNTs and Maxsorb with Pd by reacting the carbon support
with a palladium organometallic complex Pd2(dba)3·CHCl3 [tris(dibenzylidene-
acetone)dipalladium(0)]. They carried out hydrogen uptake measurements at low and
intermediate pressures as seen in Figure 2.5 below.
24

Figure 2.5 High pressure composition isotherm at room temperature for: (a) as received Maxsorb; (b)
Maxsorb:Pd 1:1 second cycle; (c) Maxsorb:Pd 1:1 first cycle; (d) Maxsorb:Pd 1:2 second cycle; and (e)
Maxsorb:Pd 1:2 first cycle17
The hydrogen adsorption characteristics differed from other work previously described for
bridged samples by Li & Yang41 with an initial rapid adsorption phase at low pressure
followed by slower adsorption after the pressure had been raised by a few bar. At low
pressures, the H/Pd atomic ratios in chemically doped palladium samples were higher than in
bulk palladium. Anson et al. 17 suggested that this might be due to the spillover of hydrogen.
However, at higher pressures and room temperature this effect of spillover was considered to
be very low.
The ultrasound-assisted impregnation of H2PtCl6 into carbon has also been used to dope
carbons44. The results showed enhancement by a factor of 2, to give 1.2 wt.% at 298 K and
10 MPa for a 5.6 wt % Pt doped AX-21 carbon. The adsorption of hydrogen was also
completely reversible at 298 K. The US National Renewable Energy Laboratory and the US
Department of Energy have also validated these results.
25

The chemical doping of MOFs by infiltrating Pd in to MOF-5 by using a palladium
acetylacetonate precursor has also been investigated45. As with most studies of spillover the
surface area was decreased significantly after infiltration, however hydrogen uptake still
increased from 1.15 wt.% to 1.86 wt.% at 0.1MPa and 77 K.
The chemical doping method has also been compared with a plasma assisted reduction method
on an activated carbon, Norit SX ULTRA46. Hydrogen storage at 298 K and 10 MPa was
found to increase by a factor 3 by doping with 3 wt.% Pt using plasma assisted doping. The
hydrogen uptake of the chemically doped sample was only enhanced by 54 % (under the same
measurement conditions). This again suggests that the nature of contact between receptor and
catalyst is a primary factor in the degree of spillover.
2.2.4 - Hydrogen spillover on other novel storage materials
Hydrogen spillover has also been shown on other novel materials, including; carbon templates
using high surface area silicon and chemical vapour deposition47; templated carbons using a
Na-Y zeolite template48; covalent organic frameworks49; and carbon foams50. Of particular
note, the most recent study on carbon foams50,51 has used a Pd/Hg catalyst, and reported an
astonishing 8 wt.% H2 uptake at 8 MPa and room temperature (see Figure 2.6 below).
However these results are yet to be validated.
26

Figure 2.6 High pressure composition isotherm at room temperature for a Pd/Hg carbon foam51
2.3 - TEMPERATURE PROGRAMMED DESORPTION SUPPORT FOR HYDROGEN SPILLOVER
Bulk PdO (Sigma Aldrich) and Pd supported on activated carbon has been characterized using
TEM, Temperature Programmed Desorption (TPD) and XRD52. The TPD of bulk Pd (see
Figure 2.7) down to room temperature showed a single low temperature (∼373 K) desorption
peak whereas carbon supported Pd showed a slightly lower low temperature desorption peak
and additional higher temperature (∼873 K) desorption peak.
Figure 2.7 Hydrogen Temperature Programmed Desorption of bulk Pd (I), Physically mixed bulk Pd and Activated Carbon (II) and Pd chemically doped Activated Carbon (III)
27
These findings suggest that hydrogen associated with palladium and the support can be
differentiated. Interestingly, the intensity of the second higher temperature peak was greater
for the carbon supported Pd that had been chemically doped than the physical mixture of
support and palladium. This was attributed to an enhanced palladium/support interface, which
supports the idea that bridging the catalyst to the receptor would further enhance hydrogen
spillover.
Sequential dosing of H2 and D2 on Pt/AX-21 and bridged IRMOF-8 has also been performed
by Lachawiec and Yang53. The hydrogen desorption was then measured from the samples by
TPD at several intervals. They found that desorption of the isotopes followed essentially the
reverse doping sequence, suggesting that reverse spillover was taking place upon desorption.
2.4 – PRETREATMENT STUDIES
The formation of Pd-C phase has been observed by Ziemecki et al.54 when Pd was heated in
carbon containing gases such as ethylene, acetylene, or carbon monoxide. They concluded that
a carbonaceous layer was deposited followed by the active diffusion of carbon through the Pd
metal lattice. The addition of carbon to palladium results in the loss of ability to form β-PdH.
The suppression of Pd hydride formation has also been observed with increasing Pd
dispersion55.
The effect of Pd precursor and pretreatment on the adsorption and absorption behavior of
supported Pd catalysts has also been investigated by Krishnankutty et al.56 They found that
using a palladium acetylacetonate precursor contaminated the bulk and surface of the Pd
crystallites in Pd/C catalysts during H2 reduction at 573 K. This carbon could be removed by
28

calcination in oxygen. Further contamination also occurred during the following reduction-
evacuation period at 573 K for Pd catalysts supported on a high surface area carbon black.
They found that this could be prevented by chemisorbed layer of oxygen on the Pd surface.
Figure 2.8 below shows some of the different circumstances that could occur in the case of Pd
supported on carbon.
Figure 2.8 Carbon contamination of Pd particles supported on carbon56
Therefore, from the literature examined there seems to be a complex relationship between
carbon and palladium. On one hand carbon bridging appears to improve uptake to a carbon
support, whilst on the other, carbon contamination reduces the capacity of palladium to
interact with hydrogen.
2.5 – SPILLOVER, SURFACE AREA & HEAT OF ADSORPTION
Normally, there is a strong correlation between surface area of materials and hydrogen uptake
at 77 K. This is because the storage capacity is due to physisorption of H2 molecules into the
porous sites of the material. However at 298 K and 10 MPa, it has been suggested by Wang &
29

Yang57 that the hydrogen uptake of bridged materials correlates much better with the heat of
adsorption -ΔH (calculated from the Clausius-Clapeyron equation) as shown in Figure 2.10,
rather than the BET surface area (Figure 2.9)
Figure 2.9 Relationship between surface area and H2 uptake for bridged porous materials at room temperature57
Figure 2.10 Relationship between heat of adsorption and H2 uptake for bridged porous materials at room
temperature57
30

Wang & Yang57 propose that the heat of adsorption is related to metal content. This is most
clearly seen when comparing MOF-177 with IRMOF-8. These both have the same type of
metal clusters, ZnO4, but the metal content of IRMOF-8 is higher than MOF-177 due to the
smaller pore sizes. This results in a higher H2 uptake by bridged IRMOF-8 despite bridged
MOF-177 having a significantly higher surface area of 3100 m2/g compared with 548 m2/g.
The rate of spillover has been proposed to be dependent on the rate of adsorption by the
catalyst and also the rate of surface diffusion away from the source. Surface diffusion of
hydrogen has been proposed to be the rate limiting step in the spillover process31.
2.6 – SUMMARY OF SPILLOVER ENHANCEMENTS
Table 2.1 below shows a summary of some of the receptor materials and catalysts that have
been investigated for hydrogen spillover at ambient temperature and the associated
enhancement in hydrogen uptake.
Table 2.1 “Spillover” hydrogen uptake enhancements for a wide range of doped carbon and MOF receptors (* Measurement to be verified)
Author & conditions
Receptor & BET* surface
area
Uptake without dopant Catalyst Doping
method Uptake with
dopant Enhancement
Robell et al., 196431
Spheron 6 100 m2/g 0.35 cm3/g 0.2 wt.% Pt - 1.4 cm3/g 4
Li, atomic ratio 1:15 Chemical 2.5 wt.% 6.25
Yang, 199936 MWCNT 148 m2/g
0.4 wt.%, 1 atm (Chen 1999) K, atomic
ratio 1:15 Chemical 1.82 wt.% 4.55
Lueking& Yang, 200137 MWCNT Below detection NiMgO Chemical 0.58 - 0.65 wt.%
298 K, 1 bar Significant
Lueking& Yang, 200438
Carbon nanotubes - Pd Physical
mixing - 3
Zielinski, 200558
Activated Carbon
0.1 wt%, 293 K, 30 bar 1wt.% Ni Chemical 0.53 wt.%,
293 K, 30 bar 5.3
V Chemical 0.69 wt.% 298 K 2 MPa ∼0.3 Zacharia,
200559 Carbon
nanotubes 0.53 wt% 298 K
2 MPa Pd Chemical 0.66 wt.% 298 K 2 MPa ∼0.3
31

SWNT 10 wt.% Pd/C Bridged 1.6 wt.% 298 K, 100 kPa 1.6
AX-21 0.6 wt% 298 K, 10 MPa 10 wt.% Pd/C Physical
mixing 0.85 wt.%,
298 K, 10 MPa 1.42 Lachawiec et al., 200540
AX-21 0.6wt% 298K, 10 MPa 10 wt.% Pd/C Bridged 1.8 wt.%, 298 K,
10 MPa 3
Li & Yang, 200641 IRMOF-8 0.5 wt.% 298 K,
10 MPa 10 wt.% Pt/AC Bridged 2.2 – 4 wt.%
298 K, 10 MPa 6.2 (Avg.)
Carbon nanotubes
0.21 wt.% 298 K 9 MPa
13-31 wt.% Pd 5-7 nm Chemical 0.51 wt.% 298 K
9 MPa 2.43 Anson et al., 200617 Maxsorb
activated carbon 0.42 wt.% 298 K
9 MPa 30-50wt.% Pd
32-42 nm Chemical 0.7 wt.% 298 K 9 MPa 0.69
Li & Yang, 200760 AX-21 0.6 wt% 298 K,
10 MPa 5.6 wt.% Pt,
2nm Chemical 1.2 wt.%, 298 K, 10 MPa 2
Li & Yang, 200742 MOF-177 0.62 wt.% 298 K,
10 MPa 5 wt.% Pt/AC Bridged 1.5 wt.% 298 K, 10 MPa 2.5
Chemical ∼0.5wt.%298 K, 10 MPa 0.54
Li & Yang, 200746
Activated Carbon
1200 m2/g
∼0.3 wt.% 298 K, 10 MPa 3 wt.% Pt Plasma
assisted doping
∼0.9 wt.% 298 K, 10 MPa ∼3
20 wt.% Pt/C Physical mixing
0.75 wt.% 293 K, 5 MPa 2 MIL-101
2578 m2/g 0.37 wt.% 293 K,
5 MPa 20 wt.% Pt/C Bridged 1.14 wt.% 293 K, 5 MPa 3
20 wt.% Pt/C Physical mixing
0.43 wt.% 293 K, 5 MPa Significant
Liu et al., 200743 MIL-53
299 m2/g (Langmuir)
No obvious hydrogen adsorption 20 wt.% Pt/C Bridged 0.63 wt.% 293 K,
5 MPa Significant
Sabo et al., 200745
MOF-5 2885 m2/g
(specific SA)
1.15 wt.% at 1 atm, 77 K 1 wt.% Pd Chemical 1.86 wt.% 1 Atm,
77 K 1.62
Campesi et al., 200847
Carbon Template
847 m2/g TSA
0.01 wt.%, 298 K, 0.5 MPa 10 wt.% Pd Chemical
0.08, 0.06 &0.053 wt.%,
298 K, 0.5 MPa 5.3 - 8
Lachaweic& Yang, 200853
Templated Carbon
3400 m2/g
0.8 wt.%, 298 K, 10 MPa 6 wt.% Pt Chemical 1.35 wt.%,
298 K, 10 MPa 1.7
COF-1 628 m2/g
0.26 wt.% 298 K, 10 MPa 5 wt.% Pt/AC Bridged 0.68 wt.% 298 K,
10 MPa 2.6
HKUST 1296 m2/g
0.35 wt.% 298 K, 10 MPa 5 wt.% Pt/AC Bridged 1.12wt.% 298K,
10 MPa 3.2 Li & Yang, 200849
MIL-101 2931 m2/g
0.51 wt.%, 298 K, 10 MPa 5 wt.% Pt/AC Bridged 1.43wt.% 298K,
10 MPa 2.8
Bourlinos et al. 200850 Carbon Foam Negligible 10 wt.% Pd - 2.1 wt.%, 298 K,
3 bar* Significant
Bourlinos et al. 200850 Carbon Foam Negligible Pd/Hg - 8 wt.%, 298 K,
8 MPa* Significant
2.7 – BIOSYNTHESIS OF PALLADIUM NANOPARTICLES
Normally small particles of palladium are produced by purely chemical means by the
precipitation of the solid phase from a palladium solution, which involves the nucleation and
particle growth of palladium particles. A novel and potentially more sustainable alternative is
32

to manufacture palladium nanoparticles for catalysis through biosynthesis. This process takes
advantage of bacteria, which use enzymes to deposit metal ions from solution to the cell
surface layers as a detoxification mechanism (see Figure 2.11). This is a relatively rapid and
inexpensive method in comparison.
Figure 2.11 TEM of Pd nanoparticles in the cell walls of bacteria61
If the bacteria containing palladium could be pyrolysed, the resulting carbon could then
potentially be used, if it had a sufficiently high surface area, as a support for the nanoparticles
of palladium already present. Therefore creating a hydrogen storage material with catalyst
from one process.
This project will briefly investigate biologically produced palladium nanoparticles from waste
material, which were produced by Mikheenko & Macaskie in Biosciences62. This mechanism
of biosyntheis has already been used to recover other precious metals, although only certain
types of bacteria are capable of the biosynthetic process. Bacteria that have been used to
reduce Na2PdCl4 (sodium tetrachloropalladate (II)) to palladium nanoparticles include various
33
species of Desulfovibro, namely desulfuricans, fructosivorans and vulgaris63 Shewanella
oneidensis64 and Bacillus Sphaericus61. The biosynthetic process also reduces waste products
and pollution by removing unnecessary chemical reagents used in chemical production
methods.
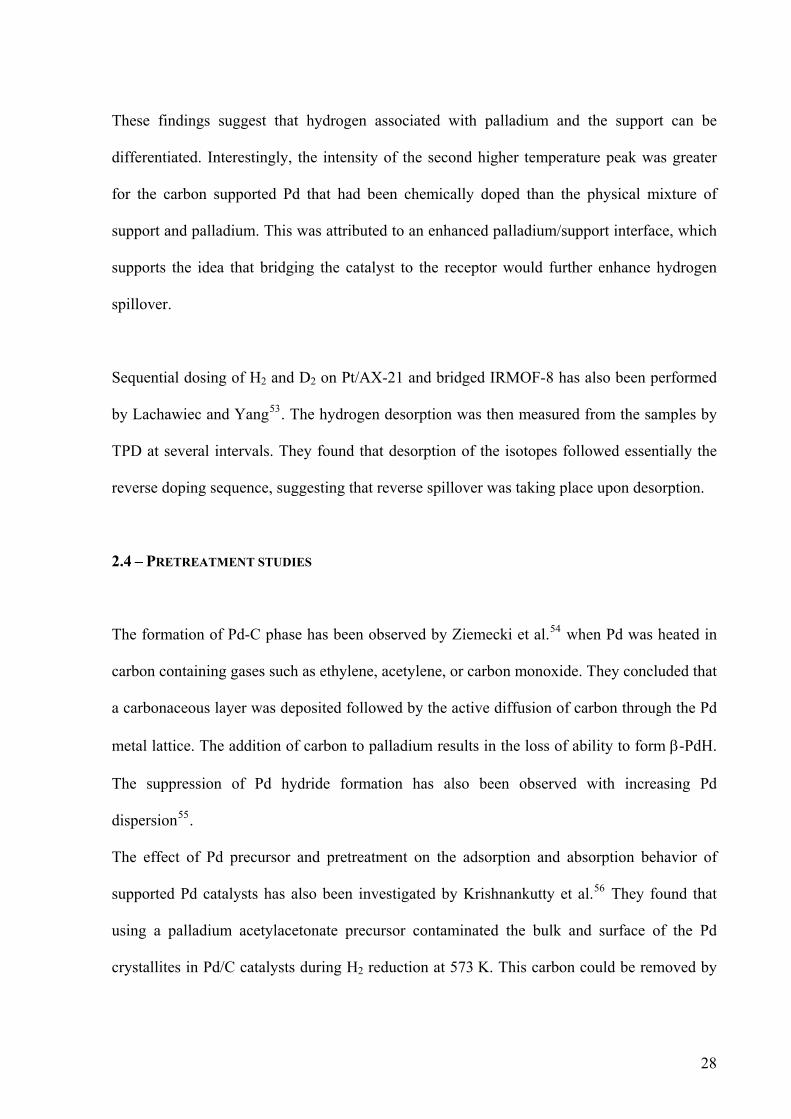
The catalytic activity of the biosynthesized Pd has been further investigated (see Figure 2.12)
for potential use in fuel cells by comparing it to commercial 5 % Pd-graphite catalysts by
Creamer et al.61 They found that the initial rates of reaction were up to 92 % of that of the
commercial catalyst.
Figure 2.12 Comparison of the conversion rates of itaconic acid by: a) 5% Pd on graphite (Johnson–Matthey); b) 2% Pd on B. sphaericus; and c) 5% Pd on D. desulfuricans.61
It has also been found64 that the particle size of palladium produced can be varied by altering
the ratio of palladium to cell dry weight (Pd:CDW). Consequently the catalytic reactivity of
palladium produced could potentially be controlled to give properties on demand. It was found
that at high Pd:CDW ratios the particles were larger and at low Pd:CDW ratios the particles
were smaller.
34

2.8 - AIM
Therefore, the primary aim of this research project is to investigate whether a “spillover”
effect, leading to enhanced hydrogen uptake, can be achieved in three types of high surface
area materials at room temperature: a carbon furnace black (Black Pearls 2000); an activated
carbon (Maxsorb); and a metal organic framework compound (MOF-5). Particles of palladium
will be deposited onto the surface of these materials through bridging and chemical doping
techniques. The physical characteristics and hydrogen storage properties of these materials
will then be measured. In addition, the hydrogen storage properties of a biopalladium/carbon
material, produced in the School of Biosciences (University of Birmingham), will be very
briefly investigated.
35

3 - EXPERIMENTAL APPROACH
3.1 MATERIAL SYNTHESIS
3.1.1 As-received samples
Samples of Maxsorb (activated carbon), Black Pearls 2000 (carbon furnace black) and MOF 5
(Metal Organic Framework) were obtained from Nottingham University, Cabot Corporation
and BASF, respectively. These as-received samples were compared with those bridged and
chemically doped with palladium.
3.1.2 Bridged samples
All three materials were bridged by glucose or sucrose obtained from Sigma Aldrich using a
similar method to that given in the literature40 41 to try to improve the contact between the Pd
catalyst and receptor by creating carbon bridges between them. The ratios of receptor, catalyst
and bridge material are shown in the table below.
Receptor Catalyst Bridge material200 mg MOF-5 25 mg 5 wt.% Pd on Activated Carbon 33.2 mg Sucrose
200 mg Black Pearls 20 mg 5 wt.% Pd on Activated Carbon 20 mg Glucose 200 mg Maxsorb 20 mg 5wt.% Pd on Activated Carbon 20 mg Glucose
Table 3.1 Composition of bridged materials
The carbon bridged samples were mixed in air using an agate mortar and pestle for 30 minutes
and then heated under argon at 1 K/min to 453 K and held for 3 hrs to melt the bridge
material. They were then further heated to 673 K at 1 K/min for 6 hrs to carbonise the glucose
36

bridge material. A similar method was used for MOF-5. The bridged samples were mixed in
air using an agate mortar and pestle for 1 hr and then heated under argon at 1 K/min to 473 K
and held for 3 hrs to melt the bridge material. They were then further heated to 523 K at
1 K/min for 12 hrs to carbonise the sucrose bridge material. Sucrose has a lower carbonisation
point (523 K) and was used as the bridge material because the temperatures required for the
carbonisation of glucose (673 K) would damage the structure of MOF-5. The bridged MOF-5
samples were then stored in an inert atmosphere to await testing.
3.1.3 Chemically doped samples
A chemical Pd-doping method was also used by Johnson Matthey to deposit 6 wt.% palladium
onto the Black Pearls sample using a solution-based technique which is commonly used for
depositing Pd onto fuel cell membranes. Further details could not be provided, as this
technique is confidential.
3.2 MATERIAL CHARACTERIZATION
The hydrogen storage characteristics (kinetics and pressure composition isotherms) of all the
materials were measured gravimetrically or volumetrically using a Hiden Pressure controlled
thermogravimetric balance (IGA) or a Hiden Sieverts apparatus (HTP). These different
instruments were used firstly because this enabled measurements to be made over different
pressure ranges, and secondly, to try to eliminate errors specific to one particular type of
instrument. The purity of hydrogen used in both techniques was 99.99996 %, which was also
passed through a liquid nitrogen trap. The purity of helium used for the mass spectrometry and
in the pycnometer was 99.99995%.
37
3.2.1 Gravimetric Hydrogen Measurements
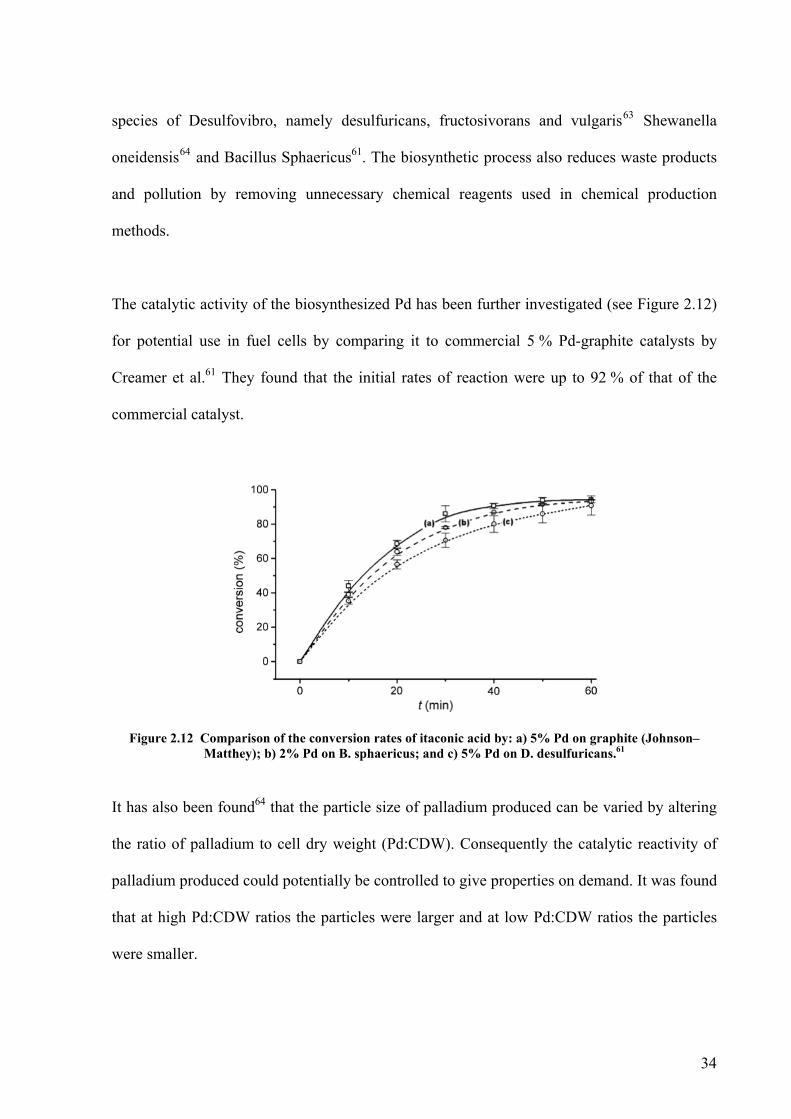
A Hiden Intelligent Gravimetric Analyser (IGA) was used to monitor the mass change of
samples verses time at specific temperatures and pressures (see Figure 3.1). This technique
requires buoyancy correction due to the sample and counterweight displacing different
volumes of gas and sometimes being at different temperatures.
Figure 3.1 Schematic diagram of the Hiden Intelligent Gravimetric Analyser (IGA) system14
All samples (∼100 mg) were loaded in air and then outgassed using a combination of
membrane and turbomolecular pumps to about 10-5 mbar. The temperature was then increased
to 673 K for carbons and 523 K for MOF-5 to remove any moisture or solvents that may
remain from the sample synthesis. These conditions were maintained until the mass of the
sample had stabilised. The sample was then cooled back to room temperature and the dry
mass was recorded in the vacuum. Measurements to produce a pressure composition isotherm
38
were then performed, which consists of a series of pressure steps at room temperature. At each
pressure step the mass change was monitored against time and allowed to reach equilibrium
before moving onto the next pressure step. After all pressure steps were completed, uptake
was plotted against pressure. The buoyancy of the sample at each pressure step was calculated
within the software by using the Archimedes principle for the upthrust of an object. The
weight change due to buoyancy Δwb, of an object of density ρs and mass ms, in a gas of density
ρg can be given as:
where Δv is the volume of gas displaced by the object and g is the acceleration due to gravity.
After each run was completed on the IGA, the sample bucket was carefully washed with
industrial methylated solvent in an ultrasonic bath and dried before loading the subsequent
sample.
BET (Brunauer, Emmett and Teller) surface area measurements were also carried out to
calculate the surface area of selected samples. The reactor was immersed in a dewar of liquid
nitrogen to reach 77 K, in order to cool the sample. At this low temperature nitrogen gas may
liquefy in the pores and on the surface of the sample. The quantity of gas adsorbed can be
correlated to surface area.
3.2.2 Volumetric Hydrogen Measurements
A Sieverts volumetric technique (Hiden HTP) was also used to measure hydrogen uptake (see
Figure 3.2). The HTP measures a pressure drop via a pressure transducer in a sealed volume
39

(5 cm3). The apparatus is comprised of two volumes (dosing and sample volume). During the
experiment the dosing volume is filled to a programmed pressure and allowed to equilibrate.
The valve between the dosing and sample volumes is then opened at which point the pressure
falls by approximately half due to the overall larger volume. If the sample in the sample
volume absorbs hydrogen then the pressure will continue to fall and eventually reach
equilibrium. As the pressure, temperature, sample mass and volume of the system are known,
it is possible to calculate an amount of gas absorbed and subsequently a wt.% of hydrogen
absorbed. For desorption a pressure rise will be observed. The calibration of the sample
volume required the input of 9 bar pressure, 5 times per calibration and this was repeated at
least three times. The sample volume was then outgassed using a turbomolecular pump. Due
to the low density and fine particle size of many of the samples, glass beads and ceramic wool
were required to prevent the sample from being propelled out of the sample volume into the
rest of the machine.
Figure 3.2 Schematic diagram of Hiden HTP system
After each run the sample volume was carefully washed with industrial methylated solvent in
an ultrasonic bath and dried before loading the subsequent sample.
40

3.2.3 Temperature Programmed Desorption (TPD)
Mass spectrometry and TPD were also used in conjunction with HTP to measure the
temperature dependence of hydrogen desorption from the samples. The samples were first
hydrided at room temperature for 6 hrs and 100 bar to saturate the sample. The samples were
consequently cooled to 79 K using a liquid nitrogen cryostat and slowly heated up to 773 K at
a ramp rate of 5 K/min in a flow of helium (purity 99.9999995 %) at 5 cm3/min.
3.2.4 X-ray Diffraction (XRD)
Powder XRD was performed on a Bruker D8 Advance machine and was used to verify the
composition and particle size of the palladium. This uses an X-ray source, sample stage and a
detector as shown in Figure 3.3. A beam of electrons are produced by heating a tungsten
filament, which are then accelerated using a target copper anode. These electrons cause
ionisation and the production of Cu K α and β radiation. The X-rays are then filtered using a
metal foil or a crystal monochromator to produce a monochromatic source of X-rays. When
these X-rays are incident on the sample they are diffracted by the atomic structure of the
sample. The resulting diffraction pattern of the X-rays at certain angles are then interpreted
using Bragg’s Law to show structural information about the sample as shown below.
nλ = 2d⋅sinθ
n - an integer determined by the order given
41

λ - wavelength of x-rays, and moving electrons, protons and neutrons
d - spacing between the planes in the atomic lattice
θ - angle between the incident ray and the scattering planes
Figure 3.3 schematic of an X-ray diffraction machine in reflection mode65
The Scherrer equation as shown below was then applied to the XRD data to calculate
crystallite size.
βhkl = Kλ .
Lhklcosθhkl
β - width of peak at half maximum intensity of a specific phase (hkl) in radians
K - constant according to method used to calculate breadth
λ - wavelength of incident x rays
L - crystallite length
θ - centre angle of the peak
42

3.2.5 Gas Pycnometry
A Micromeritics AccuPyc 1340 gas pycnometer (Figure 3.4) was used within an Ar glovebox
to measure the skeletal density of the samples. The sample container was 2/3 filled with a
sample and the weight was recorded on a mass balance (normally ∼100 mg). The pycnometer
with sample was purged 30 times with helium to remove impurities. It uses a similar
technique to the HTP with a reference and sample volume. The sample volume was
pressurised to 19.5 Psig (1.35 bar) at 0.01 Psig/min (0.7 mbar/min) and the valve between the
sample volume and reference volume was then opened. Using the pressure change between
the sample and reference volumes, the sample density was then calculated. This process was
repeated for 50 cycles to obtain a reliable result.
Figure 3.4 Photograph of a Micromeritics AccuPyc 1340 gas pycnometer66
3.3 EXPERIMENTAL ERRORS
The hydrogen storage capacities of high surface area materials at room temperatures are low,
typically ~0.1 wt% from this work. Consequently, errors potentially have a larger impact on
43

the overall uptake. Errors were minimized by the use of both gravimetric and volumetric
hydrogen measurements. Inaccuracies and errors associated with the IGA measurement used
may have included;
• Small buoyancy correction errors caused by inaccurate density measurements.
• Impurities such as water in the gas stream adsorbing on carbon are shown by drift and
taking a very long time for the mass to reach equilibrium (Figure 3.5). This effect was
minimized by the use of liquid nitrogen traps.
Figure 3.5 Model pressure composition isotherm shows apparent uptake (blue line) whilst pressure
remains constant (red line)
Inaccuracies and errors associated with the Hiden HTP measurement on Bridged Maxsorb
may have included;
• Temperature gradient correction between variable sample volume and dosing volume
• Correction for sample volume and density, potential for volume expansion of sample
• Errors from switching between different gases
• Leaks on pycnometer resulting in density errors
44

• Gas leaks, which are often difficult to distinguish between uptake (Figure 3.6)
Figure 3.6 Pressure composition isotherm shows apparent uptake of an empty sample container caused by
a leak
The volumetric system does have the advantage over the gravimetric system in that higher
pressures can be achieved and it does not have to compensate for buoyancy effects. This
means that although both techniques suffer from errors, they are of a different nature. The
errors were further minimized by the following;
• Using high purity hydrogen (99.99995 %) and helium (99.99995 %)
• Using liquid nitrogen to scrub the inlet gas
• Using fittings and regulators suitable for high purity gas.
• Monitoring the kinetic points during the pressure composition isotherm to ensure that
each point reached equilibrium before going on to the next point.
45

4 - RESULTS & DISCUSSION
Table 4.1 below summarises the synthesised materials and their characterisation.
Material Treatment Wt.% Pd Characterisation
Palladium powder - 100 XRD, TPD, HTP
Pd/C (Sigma Aldrich) - 5 XRD
As received - IGA Maxsorb
(Activated carbon) Pd/C bridged 0.44* XRD, IGA, HTP
As received - IGA
Pd/C bridged 0.44* XRD, IGA Black Pearls 2000
(Carbon furnace black) Johnson Matthey
Chemically doped 6 XRD, IGA, TPD
As received - XRD, IGA MOF-5
(Metal Organic Framework) Pd/C bridged 0.44* XRD, IGA
Table 4.1 Summary of materials, treatment and characterisation
XRD – X-ray Diffraction
IGA – Hydrogen sorption measured on a Hiden IGA gravimetric system
HTP – Hydrogen sorption measured on a Hiden HTP volumetric system
TPD – Temperature Programmed desorption
* 0.44 wt.% was calculated as follows
5 wt.% of Pd in 20 mg Pd/C = 1 mg of Pd
= 19 mg of Carbon
Receptor material = 200 mg
Bridge material (assuming fully carbonised) = 8 mg of Carbon
46
1 mg of Pd/Total mass of 228 mg x 100 = 0.44 wt.% Pd
4.1 XRD OF MATERIALS
4.1.1 XRD of commercial activated carbon supports doped with palladium
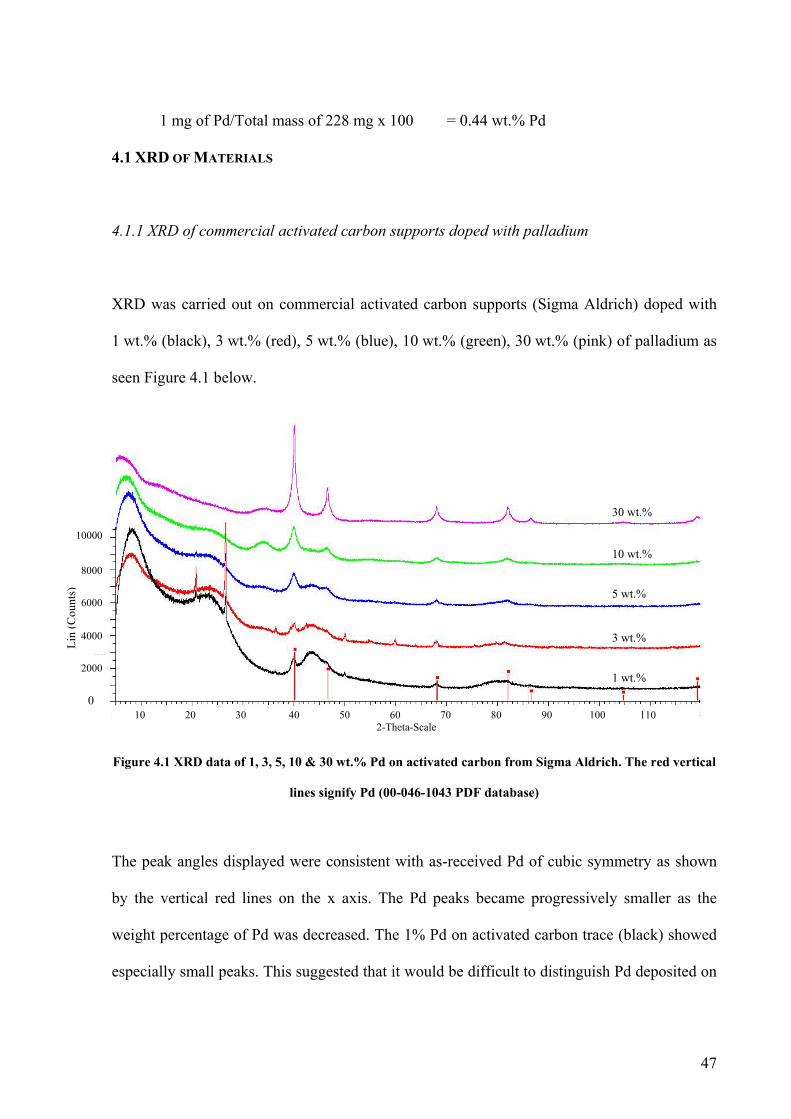
XRD was carried out on commercial activated carbon supports (Sigma Aldrich) doped with
1 wt.% (black), 3 wt.% (red), 5 wt.% (blue), 10 wt.% (green), 30 wt.% (pink) of palladium as
seen Figure 4.1 below.
30 wt.%
Lin
(Cou
nts)
10000 8000
4000
2000
0
6000
10 wt.%
5 wt.%
3 wt.%
1 wt.%
10 20 30 40 50 60 70 80 90 100 110 2-Theta-Scale
Figure 4.1 XRD data of 1, 3, 5, 10 & 30 wt.% Pd on activated carbon from Sigma Aldrich. The red vertical
lines signify Pd (00-046-1043 PDF database)
The peak angles displayed were consistent with as-received Pd of cubic symmetry as shown
by the vertical red lines on the x axis. The Pd peaks became progressively smaller as the
weight percentage of Pd was decreased. The 1% Pd on activated carbon trace (black) showed
especially small peaks. This suggested that it would be difficult to distinguish Pd deposited on
47

the doped receptor materials because they also contained very low percentages of palladium
(around 0.44 wt%). The peaks at 20°, 27°, 50° and 60° for 1 & 3 wt.% Pd activated carbon
samples were unassigned. They may have been due to contamination of the substrate material
that was used to contain the sample for XRD. However, these peaks were not considered
significant because these samples were not being used to bridge receptor materials, only the 5
wt.% Pd on carbon (blue line). The particle size of palladium from this 5 wt.% Pd on carbon
was unable to be calculated from the full width half maximum values due to the small and
undefined peaks.
Bridged materials consisted of the receptor (either carbon or MOF), 5 wt.% Pd/C activated
carbon and a sugar (carbonised), which was used to bind them together (8:1:1 ratio). The final
overall wt.% of palladium used in the bridged materials was around 0.44 wt.%. These
proportions were chosen as it has been reported that hydrogen uptake can be enhanced by
approximately a factor of three for carbons38 and MOFs41.
4.1.2 XRD of Bridged Black Pearls 2000
Lin
(Cou
nts)
500
300
200
400
100
0 10 20 30 40 50 60 70 80 90 100 110 2-Theta-Scale
Figure 4.2 XRD data of bridged Black Pearls 2000
48

The bridged Black Pearls sample did not show any XRD peaks associated with Pd (see Figure
4.2). This was attributed to the very low wt.% of palladium deposited (0.44 wt.%); this value
was selected in order to match that used in the literature38. It was not possible to calculate the
Pd particle size from the full width half maximum due to the lack of peaks. However, it seems
unlikely that the Pd grain/particle size would have changed from the starting material through
the bridging process.
4.1.3 XRD of 6 wt.% Black Pearls 2000 (Johnson Matthey)
Separate XRD data was provided by Johnson Matthey on the chemically doped 6 % Pd Black
Pearls carbon sample (black line). This was then compared to as-received Black Pearl (blue
line) as seen in Figure 4.3 below.
Lin
(Cou
nts)
3000
2000
1000
20 30 40 50 60 70 80 2-Theta-Scale
0
Figure 4.3 XRD data of Johnson Matthey chemically doped Black Pearls 2000
As received Black Pearls
Johnson Matthey chemically doped
Black Pearls
49

Johnson Matthey analysis of the XRD diffraction pattern showed that the chemically doped
Black Pearls was composed of a significant amount of palladium supported on carbon. A
palladium crystallite size of 12.2 nm was calculated using the Scherrer equation, and the peaks
were found to be consistent with Pd of cubic symmetry. The peaks had significantly higher
intensities than those of the bridged samples, which was due to the much higher 6 wt.% Pd
used.
4.1.4 XRD of Bridged Maxsorb
Lin
(Cou
nts)
600
200
400
300
500
10 20 30 40 50 60 70 80 90 100 2-Theta-Scale
0
100
Figure 4.4 XRD data of bridged Maxsorb carbon
Figure 4.4 of bridged Maxsorb confirmed what had been observed with the bridged Black
Pearls. There were no XRD peaks associated with Pd, which was again attributed to the very
low wt.% of palladium deposited (0.44 wt.%), which was selected in order to match that used
in the literature. It was not possible to calculate the Pd particle size from the full width half
maximum due to the lack of peaks. However, it seems unlikely that the Pd grain/particle size
would have changed from the starting material through the bridging process.
50

4.1.5 XRD of As-received and Bridged MOF-5
0
2000
4000
6000
8000
10000
12000
14000
16000
18000
20000
0 10 15 20 25 30 35 40 45 50 55 60 65 70 75 80 85 90 95 100
Lin (Coun
t)
2‐Theta‐Scale
As‐received MOF‐5
Bridged MOF‐5
Figure 4.5 XRD data of as-received (blue) & bridged (red) MOF-5
Lin (Cou
nt)
2 – Theta‐Scale
Figure 4.6 XRD data of magnified section of as-received & bridged MOF-5
51

Bridged MOF-5 (0.44 wt.%) also did not show any Pd XRD peaks, due to the low Pd wt.%
content (see Figure 4.5). However, the XRD data did show a significant shift and reduction in
intensity of the peaks (see Figure 4.6). This suggested that the bridging procedure, which
included physical mixing/grinding in air with a mortar and pestle might well have damaged
the highly ordered framework structure. This explanation was later confirmed by a
corresponding reduction in surface area and consequent lower hydrogen uptake at 77 K (see
section 4.2.4).
4.2 HYDROGEN STORAGE PROPERTIES OF MATERIALS
4.2.1 Hydrogen storage in As-received Palladium
Figure 4.7 shows the hydrogen uptake of as-received palladium powder (particle size
<100μm) as measured on a Hiden HTP volumetric system up to 40 bar, to act as a baseline for
high surface area materials.
Figure 4.7 Absorption of H2 in as-received palladium powder at 50ºC, measured on a volumetric Hiden HTP system
52

The result showed the rapid uptake of hydrogen by palladium at very low pressures followed
by a long plateau indicative of hydrogen saturation, which occurred effectively under 1 bar
pressure of hydrogen and uptake was around 0.64 wt.% which is similar to the literature
values of 0.66 wt.%52. The palladium particle size was found to be <100 µm, using a confocal
laser microscope as shown in Figure 4.8 below.
Figure 4.8 Image of palladium powder using a confocal microscope
Temperature Programmed Desorption (TPD) was also carried out to observe the hydrogen
desorption behaviour over a range of temperatures. It showed two distinct hydrogen
desorption peaks at around -100°C and 100°C. The two peaks of hydrogen desorption seen at -
100ºC and 100ºC are very similar to those observed in the literature for bulk palladium
hydride desorption67.
53

Figure 4.9 TPD of as-received palladium powder (hydrided for 6 hrs at 100 bar, then cooled to 79 K),
heated at 5 K/min under He flowing at 5 cm3/min
The first lower temperature peak in Figure 4.9 was attributed to the release of hydrogen from
the near-surface hydride layer and the second was associated with the desorption of
chemisorbed hydrogen67. The first peak is only visible when the palladium has been exposed
to hydrogen below 140 K (-133 ºC)67 which was the case in these conditions. The desorption
characteristics seen are also a function of the palladium particle size and dispersion55. The
peak intensities are dependent on the set-up parameters of the mass spectrometer, such as flow
rate and vacuum levels. Since the palladium used to bridge the porous materials was of
smaller particle size and in contact with a carbon support, it was expected that the desorption
behaviour of these samples would be slightly different.
54

4.2.2 Hydrogen storage in Maxsorb
The skeletal density of as-received Maxsorb from the literature was 2.19 g/cm3,16. The
hydrogen uptake of Maxsorb at room temperature was measured on both the IGA and HTP
systems as shown in Figure 4.10 below.
Figure 4.10 As-received Maxsorb hydrogen adsorption and desorption data run twice at room
temperature (297 K) measured on a gravimetric Hiden IGA system
As expected for high surface area materials at room temperature, the uptake of hydrogen by
as-received Maxsorb was low (0.15 wt.% at 16 bar), near linear and reversible. This is slightly
higher than the reported value of 0.1 wt.% at 16 bar17. There was a little hysteresis on the as-
received Maxsorb measurements, but this is relatively common for these types of high surface
area materials with very small hydrogen uptakes at room temperature. More interestingly,
55
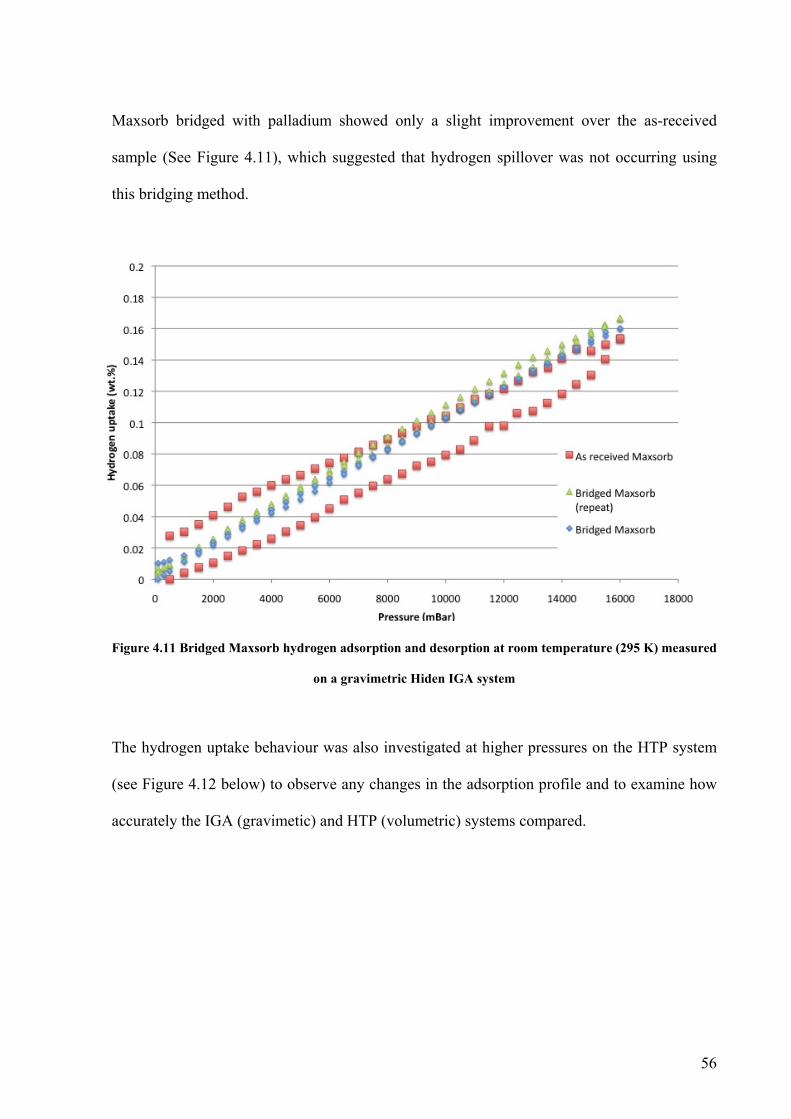
Maxsorb bridged with palladium showed only a slight improvement over the as-received
sample (See Figure 4.11), which suggested that hydrogen spillover was not occurring using
this bridging method.
Figure 4.11 Bridged Maxsorb hydrogen adsorption and desorption at room temperature (295 K) measured
on a gravimetric Hiden IGA system
The hydrogen uptake behaviour was also investigated at higher pressures on the HTP system
(see Figure 4.12 below) to observe any changes in the adsorption profile and to examine how
accurately the IGA (gravimetic) and HTP (volumetric) systems compared.
56
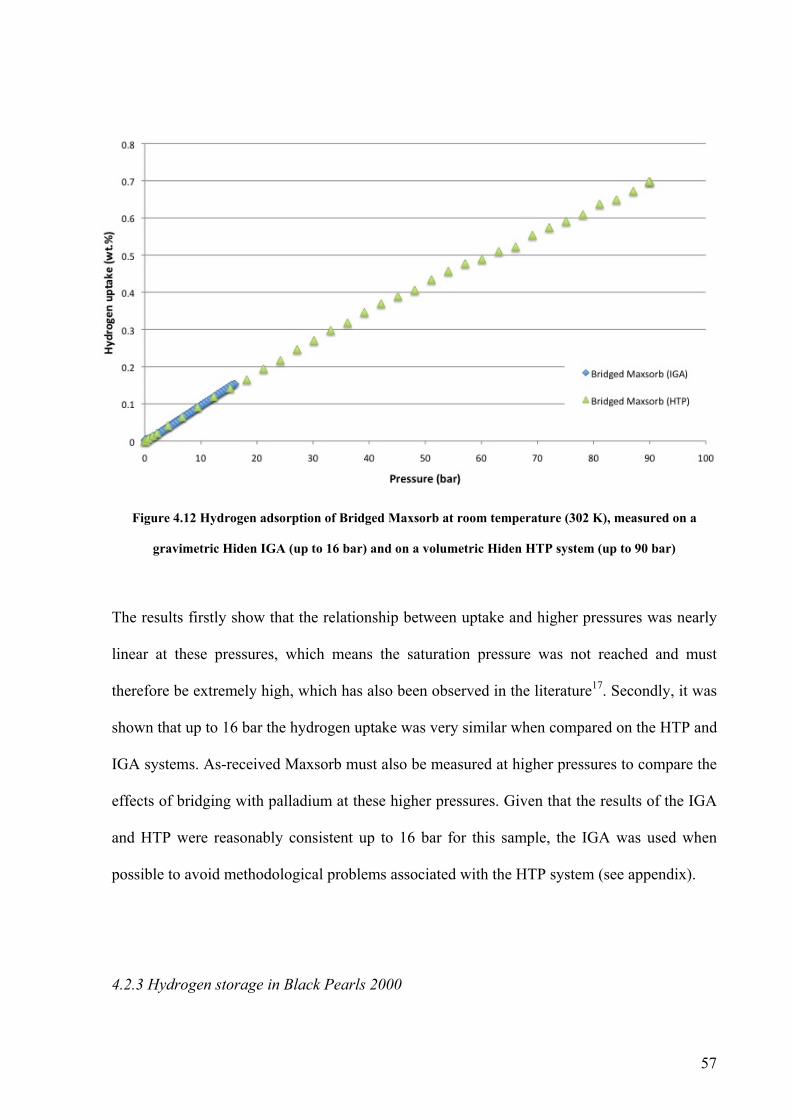
Figure 4.12 Hydrogen adsorption of Bridged Maxsorb at room temperature (302 K), measured on a
gravimetric Hiden IGA (up to 16 bar) and on a volumetric Hiden HTP system (up to 90 bar)
The results firstly show that the relationship between uptake and higher pressures was nearly
linear at these pressures, which means the saturation pressure was not reached and must
therefore be extremely high, which has also been observed in the literature17. Secondly, it was
shown that up to 16 bar the hydrogen uptake was very similar when compared on the HTP and
IGA systems. As-received Maxsorb must also be measured at higher pressures to compare the
effects of bridging with palladium at these higher pressures. Given that the results of the IGA
and HTP were reasonably consistent up to 16 bar for this sample, the IGA was used when
possible to avoid methodological problems associated with the HTP system (see appendix).
4.2.3 Hydrogen storage in Black Pearls 2000
57
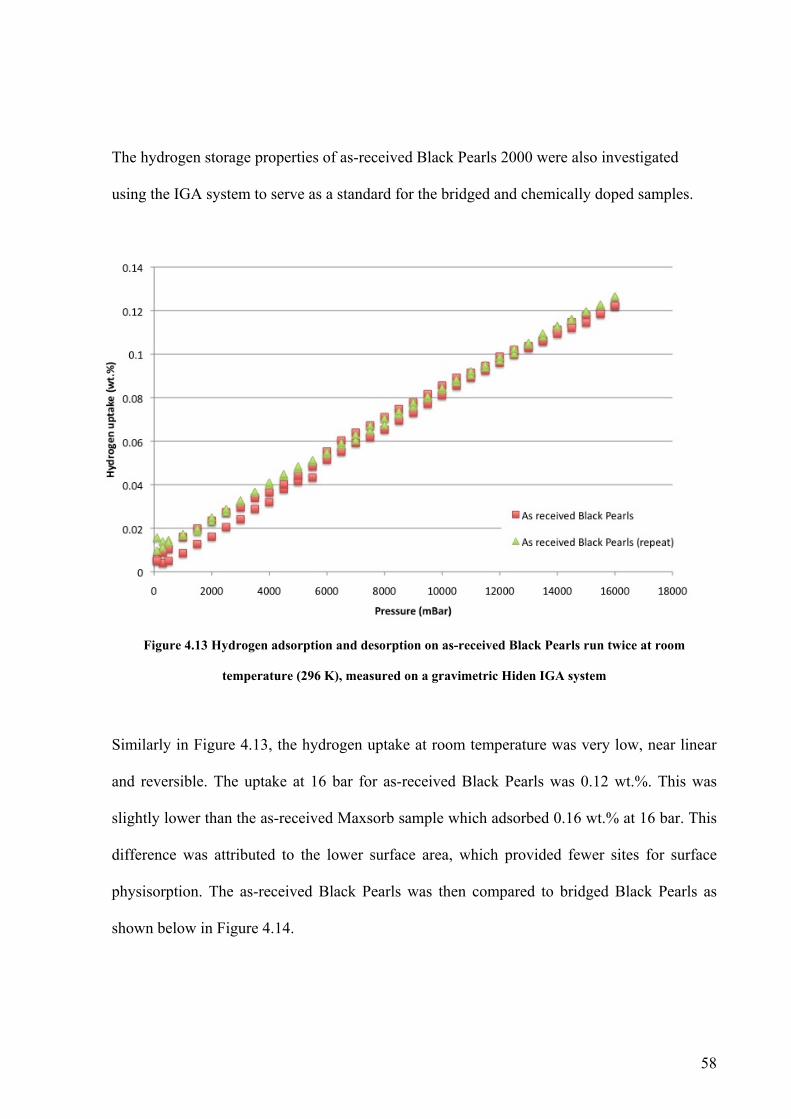
The hydrogen storage properties of as-received Black Pearls 2000 were also investigated
using the IGA system to serve as a standard for the bridged and chemically doped samples.
Figure 4.13 Hydrogen adsorption and desorption on as-received Black Pearls run twice at room
temperature (296 K), measured on a gravimetric Hiden IGA system
Similarly in Figure 4.13, the hydrogen uptake at room temperature was very low, near linear
and reversible. The uptake at 16 bar for as-received Black Pearls was 0.12 wt.%. This was
slightly lower than the as-received Maxsorb sample which adsorbed 0.16 wt.% at 16 bar. This
difference was attributed to the lower surface area, which provided fewer sites for surface
physisorption. The as-received Black Pearls was then compared to bridged Black Pearls as
shown below in Figure 4.14.
58

Figure 4.14 Hydrogen adsorption and desorption on as-received and Pd-bridged Black Pearls at room
temperature (291 K), measured on a gravimetric Hiden IGA system
The results show that the as-received and Pd-bridged Black Pearls carbon samples have very
similar hydrogen uptake behaviour. There did not seem to be a significant hydrogen
adsorption enhancement (under these conditions), after bridging with small amounts of
palladium. This was not consistent with the literature40 that showed an enhancement by a
factor of 2.9 for another high surface area carbon (AX-21) at 298 K and 60 bar with the same
level of Pd-doping.
The reason for the lack of significant enhancement on both carbons may well have been that
the bridges between the 5 wt.% Pd/C and carbon receptors were not formed. This is suggested
because these marginally higher results for hydrogen uptake bear a closer resemblance to
physically mixed Pd and carbon40 rather than bridged. Alternatively, it is possible that the
59

palladium may have been in some measure encapsulated by carbon during the bridging
process causing a reduction hydrogen uptake56. However, both of these possibilities should be
tested by the use of direct observation, such as SEM.
An alternative approach to investigate hydrogen spillover was by chemically doping Black
Pearls carbon with Pd, using a proprietary technique at Johnson Matthey, resulting in a
chemically-doped sample that consisted of 6 wt.% Pd. The density of this Johnson Matthey
chemically doped Black Pearls sample was calculated to be 2.47 g/cm3 using He pycnometry.
The uptake results were compared to the previous as-received and Pd-bridged samples in
Figure 4.15 below.
Figure 4.15 Hydrogen adsorption and desorption of different types of Pd-doped Black Pearls carbon at
room temperature, measured on a gravimetric Hiden IGA system
60

The Johnson Matthey 6 wt.% Pd Black Pearls showed an initial rapid uptake rate at very low
pressures (<1 bar) followed by a return to similar adsorption rates observed for the as-received
and bridged samples. This uptake behaviour seems to be consistent with an initial hydrogen
absorption by palladium at low pressures followed by linear adsorption on carbon. This
suggests that the palladium and carbon support are sorbing hydrogen independently, rather
than hydrogen spilling over from the palladium to the carbon support. The hydrogen uptake of
the palladium exclusively in this sample can be estimated because it is 6 wt.% of the total
mass of 122 mg, which corresponds to 7.32 mg of palladium. If the palladium absorbs
approximately 0.6 wt.% of hydrogen (see section 4.2.1), then it would be expected to absorb
around 0.0439 wt.% of hydrogen. This estimate of hydrogen uptake exclusively by palladium
shows some resemblance to the initial uptake of the 6 wt.% Pd Black Pearls sample. A similar
double uptake response has been observed by Lachawiec et al.40 and Anson et al. 17 at low
pressures (<1 bar) on carbons doped with higher loadings of Pd. However the initial hydrogen
uptake of a 5 wt.% Pd on activated carbon (Lachawiec et al.40) and the overall hydrogen
uptake at higher pressures were both significantly higher than that observed in this work.
Temperature Programmed Desorption measurements were then carried out (see Section 3.2.3)
to observe the desorption characteristics of this sample and the response was compared to that
of the as-received Pd powder in Figure 4.16 below.
61

Figure 4.16 TPD of as-received Pd and Johnson Matthey Black Pearls carbon chemically doped with Pd
Figure 4.16 shows an obvious peak at around 30 °C for the desorption of hydrogen from the
sample which was lower than previously seen from (100 °C) with the as-received palladium.
Amorim & Keane52 have also found that the temperature for maximum hydrogen
release/hydride decomposition was lower for supported palladium than bulk palladium. This
suggests that the presence of a support is having an effect on the desorption of hydrogen from
the palladium. The first very low temperature peak for as-received palladium was difficult to
distinguish, suggesting that the contact with the carbon support had inhibited the hydrogen
being released from the near surface hydride layer. The difference in intensity of the peaks
between the two samples was attributed to the smaller amount of palladium used in the
chemically doped sample compared to the as-received palladium powder.
62

4.2.4 Hydrogen storage in MOF-5
The density of as-received MOF-5 and bridged MOF-5 were calculated using a He
pycnometer to be 1.98 g/cm3 and 1.99 g/cm3 respectively. Hydrogen uptake measurements on
as-received and bridged MOF-5 were carried out using a Hiden IGA system up to 18 bar (see
Figure 4.17).
Figure 4.17 Hydrogen adsorption and desorption of as-received and Pd-bridged MOF-5 at room
temperatures (295 & 296 K) measured on a Hiden IGA system
The uptake of hydrogen at room temperature for as-received MOF-5 was again low (0.13
wt.% at 18 bar), near linear and reversible. However, the uptake of bridged MOF-5 at 0.03
wt.% was significantly lower. Therefore, it seemed likely that the bridging process had
damaged the complex structure of the metal organic framework, resulting in the reduction of
surface area and consequently in hydrogen uptake. To confirm if this was actually the case,
hydrogen isotherms were measured at 77 K on both as-received and bridged MOF-5 up to 18
bar (see Figure 4.18). As-received MOF-5 has been well characterized at these temperatures
63

and pressures, typically adsorbing 5 wt.% at 77 K and 50 bar68. Hydrogen uptake at 77 K for
high surface area MOF materials can be roughly correlated to surface area, 1.5 wt.% uptake
corresponding to 1000 m2/g of surface area69,8.
Figure 4.18 Hydrogen adsorption of as-received and Pd-bridged MOF-5 at 79 K measured on a gravimetric Hiden IGA system
The isotherms showed that bridged MOF-5 only adsorbed ~0.2 wt.% at 77 K in contrast to
5 wt.% for as-received MOF-5. This suggests that the surface area of the bridged MOF-5 has
been drastically reduced by the bridging procedure as there are far fewer sites for
physisorption and consequently hydrogen storage was lower. Using the approximate
relationship between surface area and hydrogen uptake at 77 K, the bridged MOF-5 with a
hydrogen uptake of 0.2 wt.% could be expected to have a surface area of ~120 m2/g. This
significant surface area change following the bridging procedure, agrees with the XRD data in
section 4.1.5 that showed significant structural change had occurred. These results of
significantly reduced surface area contradict the literature on Pt doped MOFs,42 on which the
64
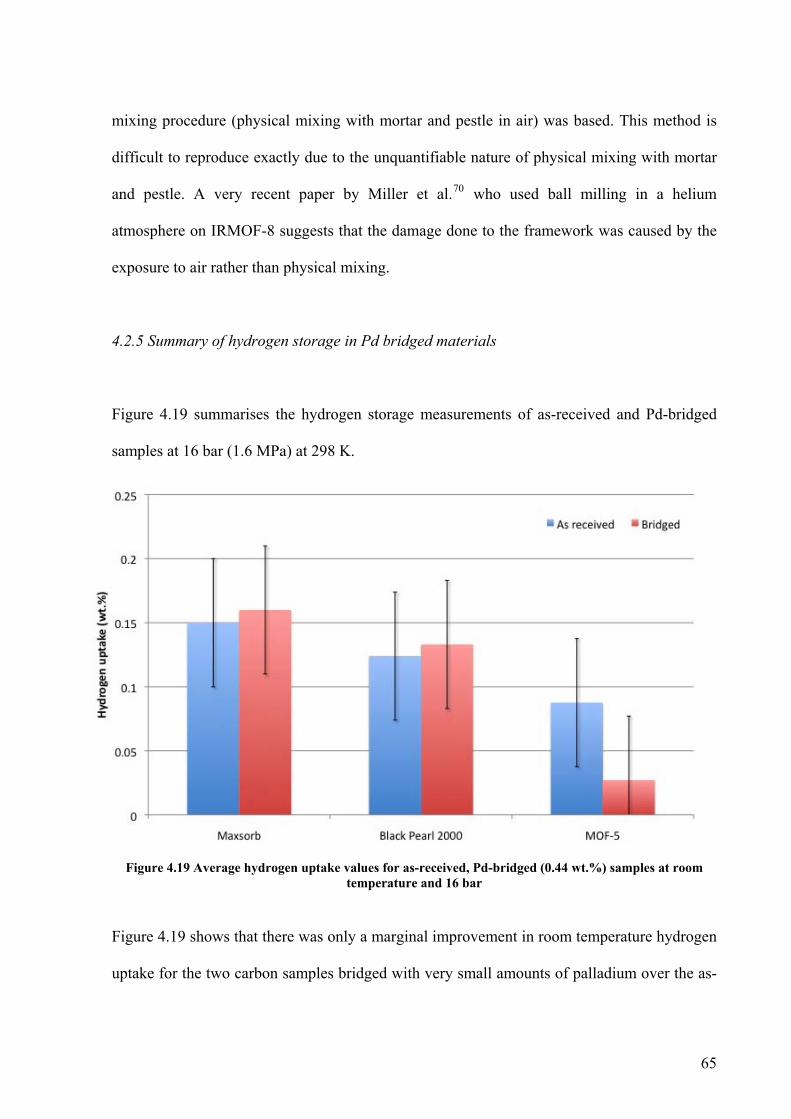
mixing procedure (physical mixing with mortar and pestle in air) was based. This method is
difficult to reproduce exactly due to the unquantifiable nature of physical mixing with mortar
and pestle. A very recent paper by Miller et al.70 who used ball milling in a helium
atmosphere on IRMOF-8 suggests that the damage done to the framework was caused by the
exposure to air rather than physical mixing.
4.2.5 Summary of hydrogen storage in Pd bridged materials
Figure 4.19 summarises the hydrogen storage measurements of as-received and Pd-bridged
samples at 16 bar (1.6 MPa) at 298 K.
Figure 4.19 Average hydrogen uptake values for as-received, Pd-bridged (0.44 wt.%) samples at room temperature and 16 bar
Figure 4.19 shows that there was only a marginal improvement in room temperature hydrogen
uptake for the two carbon samples bridged with very small amounts of palladium over the as-
65

received samples. The ± 0.05 wt. % error bars were used from previous research on hydrogen
storage using the same IGA system71. The marginal improvement observed for palladium
bridged carbons is contrary to much literature earlier reviewed (Section 2.6) which saw much
larger enhancements that were attributed to hydrogen spillover. This seems to suggest that the
formation of bridges between palladium and carbon were not formed in this work and
consequently highlights that the bridging procedure is critical for the spillover of hydrogen.
The Johnson Matthey chemically doped carbon also showed no significant enhancement in
overall hydrogen storage. It is difficult to speculate why this was the case as the exact
synthesis conditions were unknown. Additionally, the quality of contact between the
palladium particles and carbon was unknown which could have inhibited the hydrogen
spillover mechanism if the contact was poor. In contrast to the bridged and chemically doped
carbon results, Pd-bridged MOF-5 showed a significant reduction in hydrogen storage
capacity. This was attributed to a structural change brought about by the mixing procedure as
observed by changes in XRD peak data between as received and bridged MOF-5.
66
5 - CONCLUSION
This research primarily aimed to investigate the presence and significance of hydrogen
spillover in palladium doped high surface area materials through bridged and chemical
doping.
XRD was unable to be used to identify palladium dopants on the receptor materials after
bridging Pd/C onto Maxsorb (activated carbon), Black Pearls 2000 (carbon furnace black) and
MOF-5 samples. This was attributed to the very small wt.% of palladium used. However,
palladium peaks were observed on the Johnson Matthey chemically doped Black Pearls
sample of higher palladium content (6 wt.%). Unfortunately, the XRD data for MOF-5
showed signs of significant structural change following the bridging process that involved
physical grinding in air.
Hydrogen adsorption measurements were carried using gravimetric (Hiden IGA) and/or
volumetric (Hiden HTP) systems at room temperature for the carbon and MOF samples. As
expected as-received Maxsorb, Black Pearls and MOF-5 uptakes were all very low at room
temperature (0.1 - 0.2 wt.%). A comparison of the hydrogen uptake of an identical Maxsorb
sample on both the gravimetric (IGA) and volumetric (HTP) systems suggested that
comparable results were obtainable from the two different techniques (upto the maximum
operating pressure of the IGA of 20 bar). Experimental errors including corrections, impurities
and leaks were potentially significant especially when measuring very low hydrogen uptakes.
However, a number of precautions were taken to minimise them, including the use of high
purity gases, liquid nitrogen traps and appropriate fittings.
67

Bridging the Black Pearls and Maxsorb carbon samples with 5 wt.% Pd/C, using the method
in the literature40, resulted in a fractionally higher hydrogen uptake at 16 bar which was near
linear in nature. This was different to the literature40 which saw a slightly steeper initial uptake
at very low pressures (0.25 bar) and a sustained further enhancement up to 100 bar. The
reason for the lack of significant enhancement may well have been that the bridges between
the 5 wt.% Pd/C and carbon receptor were not formed, which is supported by this work
bearing a closer resemblance to physically mixed 5 wt.% Pd and carbon40. Alternatively the
palladium may have been in some measure encapsulated by carbon during the bridging
process causing a reduction hydrogen uptake.
The bridging process for MOF-5 resulted in a significant decrease in hydrogen uptake when
compared with as-received MOF-5. This was attributed to a reduction in surface area brought
about by damage due to the mixing process used in previous literature41, as shown by a greatly
reduced hydrogen uptake at 77 K. The reason why an enhancement was not seen despite the
replication of the method was suggested to be the detrimental process of physical mixing in
air.
When the higher 6 wt.% Pd chemically doped Black Pearls sample was measured, an initial
rapid hydrogen uptake was observed (<1 bar) followed by a shallower near linear uptake. A
similar double uptake response has been observed by Lachawiec et al.40 and Anson et al. 17 at
low pressures (<1 bar) on carbons doped with higher loadings of Pd. However the initial
hydrogen uptake and the overall uptake at higher pressures found for a 5 wt.% Pd on activated
carbon (Lachawiec et al.40) were both significantly higher than that observed in this work. The
hydrogen uptake from the 6 wt.% chemically doped Black Pearls sample seems more
68

consistent with palladium and carbon independently sorbing hydrogen, rather than hydrogen
spilling over from the palladium to the carbon support giving improved uptake. However, this
tenuous result must be further replicated to establish the validity of this conclusion. In addition
the synthesis conditions must be clarified and the material examined by SEM to ensure that
there is indeed a good Pd/carbon interface.
Temperature Programmed Desorption (TPD) measurements compared the desorption of
hydrogen from Pd powder and 6 wt.% Pd Black Pearls. The presence of a carbon support
resulted in a reduction of the low temperature peak associated with near surface hydrogen and
a lowering of the temperature for maximum hydrogen desorption from 100 °C to 30 °C
suggesting an important interaction between palladium and carbon. The parameters of this
interaction need to be further examined. Amorim & Keane52 have suggested that any
hydrogen desorbed from the carbon support would occur above the maximum operating
temperature of 773 K for the Hiden system.
69

6 - FUTURE WORK
There is much future work that is needed to further clarify the nature of the hydrogen spillover
mechanism in the porous hydrogen storage materials examined. This may include the
investigation of:
• The repetition of Johnson Matthey chemically doped Black Pearls 2000 to verify the
conclusion that spillover was not occurring under these conditions. This would also
involve clarification of synthesis conditions and SEM to ensure that the palladium
particles are actually in good contact with carbon support.
• Very low-pressure (0-1 bar) measurements with low pressure transducers for greater
accuracy on all samples to observe more clearly the effect of palladium.
• High-pressure HTP measurements on as-received Maxsorb and Black Pearls samples to
check hydrogen sorption behaviour at higher pressures.
• Higher wt.% of palladium (e.g. 5 wt.%) to bridge the receptor materials in order to see
more clearly the effects of doping.
• The use of other catalysts for spillover such as platinum, which does not form hydrides
and may have different hydrogen dissociation mechanisms to palladium.
• Modification of the doping technique for MOF-5, specifically, mixing in an inert
atmosphere to avoid the degradation of the framework structure.
• A more reproducible method for physical mixing of carbon receptors used such as
mechanical mixing.
• Synthesis conditions needed to achieve bridging and analysis of the resulting “bridges”
by FTIR or Raman.
70

• The effects of repeatedly adsorbing and desorbing to examine if there are any cycling
effects.
• Measuring the surface areas of samples to see how much of a detrimental impact doping
with Pd had on surface area.
• TEM to further characterize material properties including particle size, dispersion and
the nature of deposition in receptor materials.
• The Pd/carbon interaction and the effect of Pd particle size on hydrogen absorption and
desorption with Temperature Programmed Desorption (TPD).
• Calculation of the heats of desorption of various doped receptors to find near ambient
temperature desorption behaviour.
• TPD of hydrogen to higher temperatures to show the desorption of hydrogen from both
the palladium and the support.
• The pyrolysis conditions of the carbonized bacteria in order to increase the surface area
and consequently the hydrogen storage capacity.
71

7 - APPENDIX
7.1 Chemical doping method for MOF-5
A chemical method was also attempted for doping a MOF-5 sample at Johnson Matthey. An
amine group was used in order to promote the attachment of palladium nanoparticles to the
MOF-5 structure. MOF-5 was prepared by two solutions of 0.498 g of Zn(NO3)2.6H2O in
10 ml of DEF (diethylformamide) and 0.666 g of the ligand in 50 ml of DEF. The ligand was
heated to 373 K and then the zinc solution was added. The solution was then left for 5 hrs.
After this time the solution was filtered by vacuum filtration and washed with chloroform. Pd
nanoparticles were prepared by using 0.1 g of Pd(acac)2 in 20 ml of a confidential amine. The
temperature was then increased to 403 K for 30 minutes, centrifuged to remove the amine,
suspended in 30 mls of toluene and sonicated for 10 minutes. The nanoparticles solution was
then added to the MOF-5 powder and stirred overnight. The resulting solution was then
vacuum filtered. Unfortunately, this process did not yield sufficient quantities for the
characterisation of the resulting materials hydrogen sorption properties.
7.2 Methodological problems associated with the HTP system
The large pressure changes associated with the HTP volumetric technique resulted in the
propulsion of some of the sample out of the sample container through 0.5 μm filter and into
the machines pipework. This was also found to be the case even when using ceramic wool and
anti bumping alumina beads to trap the sample. A secondary 0.5 µm microfilter was fitted to
reduce the likelihood of damage to the HTP system. However this resulted in a diminished
flow rate which was a particular problem for the TPD which required a higher flow rate.
72

7.3 Hydrogen storage in Pd-doped carbon made from pyrolysed bacteria
The hydrogen storage properties of Pd-doped carbon made from pyrolysed bacteria were
measured using a Hiden IGA. However, the BET surface area was calculated to be only about
1.5 m2/g, which is much too low to be useful as a substrate support for hydrogen storage
materials. A hydrogen adsorption isotherm showed that the overall adsorption was negligible
(highest of ∼0.018 wt.%) at 298 K and 1 bar as shown in Figure 7.1 below.
Figure 7.1 Hydrogen adsorption isotherm for Pd doped carbon made from pyrolysed bacteria at 298 K and 1 bar measured on the Hiden IGA system
The most probable explanations for the very low uptake of hydrogen are the very low surface
area of the pyrolysed bacteria and the low pressures used. It is also possible that the palladium
was enveloped in carbon through the biosynthetic process as it has been shown61 that
palladium nanoparticles are formed in the outer layers of the cell wall (see Figure 7.2). A
reference material of carbon made from pyrolysed bacteria without palladium was not used
and so conclusions are limited.
73

Figure 7.2 TEM of Pd nanoparticles in the cell walls of bacteria72
The Temperature Programmed Desorption (TPD) trace of bio palladium showed a leftward
shift of the two desorption peaks. The difference in intensity of peaks was attributed to the
different flow rates to the mass spectrometer rather than the quantity of palladium.
Interestingly, the maximum peak for desorption was the low temperature peak (-140 °C)
which has been associated with near surface hydrogen which shows that the carbon made
from pyrolysed bacteria is influencing the desorption behaviour of palladium. A TPD of
carbon made from pyrolysed bacteria should also be carried out for further comparison.
TPD of as-received and Pd powder and Pd-doped carbon made from pyrolsyed bacteria, from -190 to
120 °C measured on the Hiden HTP
74

75
REFERENCES
1 Intergovernmental Panel on Climate Change (2007), Climate Change 2007 Fourth Assessment Report, http://www.ipcc.ch/ipccreports/assessments-reports.htm, accessed August 2008 2 D. Lüthi, M. Le Floch, B. Bereiter, T. Blunier, J. M. Barnola, U. Siegenthaler, D. Raynaud, J. Jouzel, H. Fischer, K. Kawamura & T. F. Stocker (2008) Nature 453, p. 379-382 3 Health Effects of Climate Change in the UK (2008), UK Department of Health 4 International Energy Outlook (2008) US Energy Information Adminstration, http://www.eia.doe.gov/oiaf/ieo/highlights.html, accessed August 2008 5 http://www.bp.com/genericarticle.do?categoryId=98&contentId=7033952, accessed August 2008 6 N.H. Stern (2007) The Economics of Climate Change: The Stern Review, Cambridge University Press 7 P.M. Mathias & L.C. Brown (23 March 2003) "Thermodynamics of the Sulfur-Iodine Cycle for Thermochemical Hydrogen Production", presented at the 68th Annual Meeting of the Society of Chemical Engineers, Japan 8 K.M. Thomas (2007) Catalysis Today, 120, p.389-398 9 A.C. Dillon K.M. Jones, T.A. Bekkedahi, C.H. Kiang, D.S. Bethune, M.J. Heben (1997) Nature, 386, p.377-379 10 A. Chambers, C. Park, R. T. K. Baker and N. M. Rodriguez (1998) Journal of Physical Chemistry B, 102, p.4253-4256 11 K.M. Thomas (2009) The Royal Society of Chemistry, Dalton Transactions p.1487–1505 12 Z. Yang, Y. Xia & R. Mokaya (2007) Journal of the American Chemical Society, 129, p.1673-1679 13 N. Krishnankutty & M.A. Vannice (1995) Journal of Catalysis, 155, p.312-326 14 H.W. Langmi (2004) PhD Thesis, The University of Birmingham 15 T. Otowa, R. Tanibata & M. ltoh (1993) Gas Separation & Purification, 7, p.241-245 16 Y. Takeuchi, M. Hino, Y. Yoshimura, T. Otowa, H. Izuhara & T. Nojima (1999) Separation and Purification Technology, 15, p.79-90 17 A. Anson, E. Lafuente, E. Urriolabeitia, R. Navarro, A.M. Benito, W.K. Maser and M.T. Martinez (2006) Journal of Physical Chemistry B, 110, p.6643-6648 18http://www.cea.fr/content/download/3112/14773/file /061a063pehr.pdf, accessed September 2008 19 M. Hirscher & B. Panella (2007) Scripta Materialia, 56, p.809–812 20 A.G. Wong-Foy, A.J. Matzger, & O.M. Yaghi (2006) Journal of the American Chemical Society, 128, p.3495 21 A. Walton, S. Tedds & D. Book, (2009) To be published in the Journal of Alloys & Compounds 22 S. Satyapal (2007) DOE Hydrogen Program Merit Review and Peer Evaluation Meeting 23http://nsm.raunvis.hi.is/~nsm/abstracts/M3-HydrNanoPorpous%2072/Poster/CZloteaNESSHYtest.pdf, accessed January 2009 24 DOE Annual Merit Review in Washington, D.C., NREL presentation, May 16-19th, 2006 25 Conner, W.C (Ed.) (1984) Proceedings from the 1st International Conference on Spillover, Lyons, France, University of Claude Bernard, Lyon-Villeurbanne 26 A. Borgschulte, R.J. Westerwaal, J.H. Rector, H. Schreuders, B. Dam & R. Griessen (2006) Journal of Catalysis, 239, p.263-271
76
27 A.D. Leuking & R.T. Yang (2004) Applied Catalysis A: General, 265, p.259-268, 28 G.M. Pajonk (2000) Applied Catalysis A: General, 202, p.157-169 29 P.H. Emmett (1940) Twelfth Report of the Committee on Catalysis (National Research Council); John Wiley & Sons: New York p.64 30 S. Koobiar (1964) Journal of Physical Chemistry, 68, p.411- 412 31 A.J. Robell, E.V. Ballou, & M. Boudart (1964) Journal of Physical Chemistry, 68, p.2748 32 M. Boudart, M.A. Vannice & J.E. Benson, (1969) Z. Phyls. Chem. N.F. 64, p.171 33 M. Boudart, A.W. Aldag & M.A. Vannice, (1970) Journal of Catalysis 18, p.46-51 34 Levy & Boudart (1974) Journal of Catalysis, 32, p.304-314 35 P. Chen, X. Wu, J. Lin, K. L. Tan (1999) Science, 285, p.91-93 36 R.T. Yang (2000) Carbon, 38, p.623–641 37 A.D. Lueking & R.T. Yang (2002) Journal of Catalysis 206, p.165-168 38 A.D. Lueking & R.T. Yang, (2004) Applied Catalysis A: General, 265, p.259-268 39 Y. Li & R.T. Yang, (2006) Journal of the American Chemical Society, 128, p.726-727 40 A.J. Lachawiec, G. Qi & R.T. Yang (2005) Langmuir, 21, p.11418-11424, 41 Y. Li & R.T. Yang (2006) Journal of the American Chemical Society, 128, p.8136-8137 42 Y. Li & R.T. Yang, (2007) Langmuir, 23, p.12937-12944 43 Y. Y. Liu, J. L. Zeng, J. Zhang, F. Xu & L. X. Sun (2007) International Journal of Hydrogen Energy, 32, p.4005-4010 44 Y. Li & R.T. Yang (2007) Journal of Physical Chemistry C, 111, p.11086-11094 45 M. Sabo, A. Henschel, H. Frode, E. Klemm & S. Kaskel (2007) Journal of Materials Chemistry, 17, p.3827-3832 46 Y. Li , R.T. Yang, C. Liu & Z. Wang (2007) Industrial & Engineering Chemistry Research, 46, p.8277-8281 47 R. Campesi, F. Cuevas, R. Gadiou, E. Leroy, M. Hirscher, C. Vix-guterl & M. Latroche (2008), Carbon, 46, p.206-214 48 A.J. Lachawiec & R.T. Yang (2008), Langmuir, 24, p.6159-6165 49 Y. Li & R.T. Yang (2008), American Institute of Chemical Engineers Journal, 54, p.269-279 50 A. Bourlinos, E. Kouvelos, M. A. Miller, C. Zlotea, A. Stubos & Th. Steriotis (2008) Angew. Chemie., (submitted) 51 National Testing Laboratory for Solid-State Hydrogen Storage Technologies, DOE Annual Merit Review Meeting, Washington DC, June 9-13th, 2008 52 C. Amorim & M.A. Keane (2008) Journal of Colloid Interface Science, 322, p.196-208 53 A.J. Lachawiec & R.T. Yang (2008), Langmuir, 24, p.6159-6165. 54 S. B. Ziemecki, G. A. Jones, D. G. Swartzfager & R. L. Harlow (1985) Journal of the American Chemical Society, 107, p.4547-4548 55 N.K. Nag (2001), Journal of Physical Chemistry B, 105, p.5945 56 N. Krishnankutty, J. Li & M. Albert Vannice (1998), Applied Catalysis A: General, 173, p.137-144 57 L. Wang & R.T. Yang (2008) Energy & Environmental Science, Royal Society of Chemistry Cambridge, Invited Featured Review 1, 268 58 M. Zielinski, R. Wojcieszak, S. Monteverdi, M. Mercy & M. Bettahar (2005) Catalysis Communications, 6, p.777-783 59 R. Zacharia, K.Y. Kim, A.K.M. Fazle Kibria & K.S. Nahm (2005) Chemical physics letters, 412, p.369-375 60 Y. Li & R.T. Yang (2007) Journal of Physical Chemistry C, 111, p.11086-11094
77
61 N.J. Creamer, I.P. Mikheenko, P. Yong, K. Deplanche, D. Sanyahumbi, J. Wood, K. Pollmann, M. Merroun, S. Selenska-Pobell & L.E. Macaskie (2007) Catalysis Today, 128, p.80-87 62 http://gow.epsrc.ac.uk/ViewGrant.aspx?GrantRef=EP/F027133/1, accessed January 2009 63 I. de Vargas, L.E. Macaskie & E. Guibal (2004), Journal of Chemical Technology and Biotechnology, 79, p.49-56 64 W. de Windt, N. Boon, J. Van den Bulcke, L. Rubberecht, F. Prata, J. Mast, T. Hennebel & W. Verstraete (2006), Antonie van Leeuwenhoek, 90, p.377-389 65 http://pubs.usgs.gov/of/2001/of01-041/htmldocs/images/xrdschem.jpg, accessed August 2008 66http://www.globalspec.com/FeaturedProducts/Detail/Micromeritics/AccuPyc_II_1340_Series_Gas_Pycnometers/42148/0?deframe=1, accessed August 2008 67 G.E. Gdowski, T.E. Felter & R.H. Stulen (1987) Surface Science, 181, p.147-155 68 A.G. Wong-Foy, A.J. Matzger & O.M. Yaghi, (2006) Journal of the American Chemical Society, 128, p. 3494. 69 L. Schlapbach & A. Zuttel (2001), Nature, 414, p. 353-358 70 M.A. Miller, C. Wang & G.N. Merrill (2009) Journal of Physical Chemistry C, 113, p.3222–3231 71 H.W. Langmi, D. Book, A. Walton, S.R. Johnson, M.M. Al-Mamouri, J.D. Speight, P.P. Edwards, I.R. Harris, P.A. Anderson (2005) Journal of Alloys and Compounds 404–406 p. 637–642 72 N.J. Creamer, I.P. Mikheenko, P. Yong, K. Deplanche, D. Sanyahumbi, J. Wood, K. Pollmann, M. Merroun, S. Selenska-Pobell & L.E. Macaskie (2007) Catalysis Today, 128, p.80-87