hydrogen transport in european cities hytec - fch.europa.eu · roberta pacciani (matgas)2 laura...
TRANSCRIPT
Hydrogen Transport in European Cities
HyTEC
Project No: 278727
Deliverable No. 6.8
Final Life Cycle Assessment Report
Status: F
(D-Draft, FD-Final Draft, F-Final)
Dissemination level: PU
(PU – Public, RE – Restricted, CO – Confidential)
D6.8 – Final environmental impact assessment report
Project no: 2/124 29.10.2015
278727
Authors:
Aleksandar Lozanovski (Fraunhofer)1
Michael Baumann (Fraunhofer)1
Lourdes F. Vega (MATGAS)2
Gabriel Blejman (MATGAS)2
Patricia Ruiz (MATGAS)2
Acknowledged contributions:
Roberta Pacciani (MATGAS)2
Laura Gelabert (MATGAS)2
1 Fraunhofer IBP, Wankelstraße 5, 70563 Stuttgart, Germany
+49 711 / 970 - 3163
2 MATGAS Research Center, Campus UAB, 08193 Bellaterra, Barcelona, Spain
+34 935929950
Note: Author printed in bold is the contact person for this document.
Date of this document:
29th October 2015
D6.8 – Final environmental impact assessment report
Project no: 3/124 29.10.2015
278727
Executive Summary
Sustainability has become an integral part of most business models today and
companies are finding it to be a pathway to new business opportunities and a source
of competitive advantage. One of the goals of HyTEC, corresponding to this
deliverable from Work Package 6, was to provide a quantitative assessment on the
environmental impacts of both the infrastructures and the vehicles involved in the
project. For this purpose a Life Cycle Assessment (LCA) of hydrogen vehicles in
urban fleets compared with other fuel and driving options was conducted.
This deliverable compiles the results obtained from task 6.3 entitled “Environmental
impact assessment and reporting”. In this task, we have calculated the environmental
profile of hydrogen vehicles regarding the production of the vehicles, vehicle
operation including hydrogen infrastructure (HRS) and vehicle end of life. The study
was focused on the CO2-Equiv. emissions (or Global Warming Potential category) as
the main environmental impact category. By way of an example, when a FC taxi was
compared to a diesel taxi, on the same day, using the same routes, in mixed driving
conditions, the FC taxi was shown to have lower overall GWP impacts over all drive
cycles. When fuelled with fossil based H2, a reduction of up to 28% GWP is possible.
If H2 is produced through low carbon processes such as using an electrolyser
powered by renewables energy (e.g. wind), this reduction could be as high as 83%.
Additionally three other environmental impact categories (Acidification Potential,
Eutrophication Potential and Photochemical Ozone Creation Potential) were also
calculated for the vehicles and the stations.
The assessment for the HRSs involved in HyTEC, carried out by MATGAS, was
performed considering the current status and corresponding electricity mix, with data
gathered from the HyTEC partners. In addition, the environmental impact of these
stations has been compared to electric vehicle charging stations, to a diesel
refuelling station and a hypothetical electrolysis HRS for the case of London, and to
electric charging, petrol and diesel stations, for the case of Copenhagen. A state of
the art review was carried out for comparative purposes. CO2-Equiv. emission results
from the London HRS are in the lower range of GWP values compared to available
literature data for the same type of HRSs.
D6.8 – Final environmental impact assessment report
Project no: 4/124 29.10.2015
278727
London results obtained by this study indicate that best fuel supply technology,
regarding the environmental performance, is the electrolysis HRS with only wind and
66.5% efficiency, followed by diesel and the current HRS.
The main contributor to the environmental impact of the HRS in Copenhagen is the
electricity used to carry out the electrolysis. Three scenarios of electricity grid mix
were studied, as well as two different electrolyser efficiencies. The HRSs used in the
HyTEC project operate with a certified 100% RE energy. Using 100% RE versus the
current electricity mix reduces the GWP by an order of magnitude, while the influence
of the electrolyser efficiency is much lower. These results are in line with some other
published results, being the ones for the HRS in the lower impact values.
The LCA of the vehicles in London and Copenhagen and the integration of the fuel
supply LCA into the use phase was carried out by Fraunhofer.
In the case of London two London taxis (so-called Black Cabs) were assessed. One
was a diesel TX4 taxi and the other a fuel cell (FC) taxi. The FC taxi was converted
to a fuel cell hybrid drivetrain by the project partner Intelligent Energy (IE). IE
provided a bill of materials on the FC taxi as well as information on conventional
parts to be removed from the diesel taxi, such as the internal combustion engine and
gear box before being equipped with the FC system. Hence, the Life Cycle
Assessment of the FC taxi was performed on a detailed level. Results on the
production of the vehicles show that the FC taxi has higher impacts than the diesel
taxi. This was expected, as the FC system with the platinum load, battery, H2 tank
and the power electronics is more energy and resource intensive in the production
than a conventional drivetrain. The platinum and the high-tech and rare materials of
the FC and the battery show an especially high impact due to the resource intensive
extraction and processing compared to the standard materials in a normal drivetrain,
such as steel, iron, non-ferrous metals and plastics. In the production phase a clear
shift of burden takes place from the locally emission free use phase of the FC taxi
towards a higher impact production phase.
For the evaluation of the use phase in London two consumption runs were
undertaken with the FC and the diesel taxi. Both vehicles were run together on the
same day, under the same weather conditions and the same route. This was done to
D6.8 – Final environmental impact assessment report
Project no: 5/124 29.10.2015
278727
obtain comparable consumption values for both vehicles. One route was a fast outer
urban run with constant speed and few stops resulting in a low consumption called
“Min” (FC: 1.31 kg H2/100 km; diesel: 8.51 l/100 km). The other was an inner urban,
heavy traffic route with many stops called “Max” (FC: 1.63 kg H2/100 km; diesel:
11.97 l/100 km). The FC taxi had lower overall GWP impacts in all combinations.
Even with the fossil based H2 via SMR a reduction of 16 to 28% is possible. With
green H2 produced via a wind power driven electrolyser the reduction is in between
78 to 83%. The larger reductions were achieved in the heavy-traffic inner urban
route. Here the FC electric drivetrain achieved a higher efficiency than the diesel taxi.
15 Hyundai ix35 FC (called SUV FC within this report) are operated in Copenhagen.
These vehicles are commercially produced by Hyundai in serial production. Hyundai
provided some information on technical specifications of the vehicles, regarding the
FC, the tank and the battery for example. These vehicles were compared to generic
vehicles with different drivetrain options like diesel, petrol, battery electric (BEV) and
plug-in hybrid vehicle (PHEV). In terms of the production phase the SUV FC has the
highest impact followed by the BEV and the PHEV. The conventional drivetrains
have the lowest impacts. Again a shift of burden is visible between the electric
propelled local emission free vehicles and the higher impact production phase.
In Copenhagen only the SUV FC had real life consumption measurements
(1.28 kg/100 km). The other vehicles were generic and hence there were no real-life
consumption measurements. Therefore, NEDC consumption values were used for
the comparison, which are 0.95 kg H2/100 km for the SUV FC, 6.8 l/100 km for the
SUV petrol, 5.4 l/100 km for the SUV diesel, 16.9 kWh/100 km and 5.0 l/100 km for
the PHEV and 14.3 kWh/100 km for the BEV. These values were combined with the
different fuel supply routes mentioned above. When the conventional Danish energy
mix is used for the H2 production the SUV FC has the highest overall impacts of all
vehicles. This changes when renewable power is used as it is actually done in
HyTEC in Copenhagen. Then all electric propelled vehicles have lower GWP impacts
than the conventional vehicles with the BEV being slightly the lowest. However, the
BEV is not directly comparable as it has a lower range than all other vehicles.
Generally the FC vehicles show a better environmental performance when fuelled
with green H2 and are locally emission free. The emissions are shifted to the location
D6.8 – Final environmental impact assessment report
Project no: 6/124 29.10.2015
278727
where the H2 is produced or in the case of the electrolyser towards the electricity
production. This is especially important for metropolitan areas like London and
Copenhagen with high local emission exposures.
D6.8 – Final environmental impact assessment report
Project no: 7/124 29.10.2015
278727
Content
EXECUTIVE SUMMARY ............................................................................................ 3
CONTENT .................................................................................................................. 7
LIST OF FIGURES ..................................................................................................... 9
LIST OF TABLES .....................................................................................................12
LIST OF ABBREVIATIONS ......................................................................................13
1 OBJECTIVES OF THE REPORT .......................................................................15
1.1 DOCUMENT SCOPE AND STRUCTURE ........................................................................ 15
1.2 DISCLAIMER ............................................................................................................. 16
2 STATE OF THE ART .........................................................................................17
2.1 PREVIOUS STUDIES ON LIFE CYCLE ASSESSMENT OF H2 PRODUCTION/HRS ............... 17 2.1.1 Hydrogen production from Steam Methane Reforming ............................................... 18 2.1.2 Hydrogen production by electrolysis ........................................................................... 18 2.1.3 Petrol and diesel production ........................................................................................ 20 2.1.4 Previous Life Cycle Assessment of Hydrogen Refuelling Stations ............................. 21 2.1.5 Conclusions ................................................................................................................. 23
2.2 PREVIOUS STUDIES ON LIFE CYCLE ASSESSMENT OF FC VEHICLES............................ 23 2.2.1 LCA studies on vehicles .............................................................................................. 23 2.2.2 LCA studies on fuel cells and FC vehicles .................................................................. 24
3 GOAL OF THE LIFE CYCLE ASSESSMENT ...................................................27
3.1 INTENDED APPLICATION ............................................................................................ 27
3.2 REASONS FOR CARRYING OUT THE STUDY ................................................................. 27
3.3 TARGET AUDIENCE ................................................................................................... 27
3.4 COMPARISONS ......................................................................................................... 28
3.5 COMMISSIONER OF THE STUDY ................................................................................. 28
4 SCOPE OF THE LIFE CYCLE ASSESSMENT .................................................29
4.1 METHOD, ASSUMPTIONS AND IMPACT LIMITATIONS ..................................................... 29
4.2 FUNCTIONAL UNIT / REFERENCE FLOW ...................................................................... 29
4.3 MULTI-FUNCTIONALITY .............................................................................................. 30
4.4 SYSTEM BOUNDARY .................................................................................................. 30
4.5 CUT-OFF CRITERIA.................................................................................................... 31
4.6 LIFE CYCLE IMPACT ASSESSMENT METHODS AND CATEGORIES ................................... 31
4.7 TYPE, QUALITY AND SOURCES OF REQUIRED DATA AND INFORMATION ........................ 32
4.8 COMPARISONS BETWEEN SYSTEMS ........................................................................... 33
4.9 IDENTIFICATION OF CRITICAL REVIEW NEEDS .............................................................. 33
5 LIFE CYCLE INVENTORY ANALYSIS – LONDON ..........................................34
5.1 REFUELLING STATIONS ............................................................................................. 34 5.1.1 Hydrogen Production ................................................................................................... 35 5.1.2 Hydrogen Transportation ............................................................................................. 37 5.1.3 Hydrogen Fuelling Stations ......................................................................................... 38
5.2 VEHICLES ................................................................................................................. 40 5.2.1 Production ................................................................................................................... 41 5.2.2 Use phase ................................................................................................................... 46

D6.8 – Final environmental impact assessment report
Project no: 8/124 29.10.2015
278727
5.2.3 End of life ..................................................................................................................... 48
6 LIFE CYCLE INVENTORY ANALYSIS – COPENHAGEN ................................52
6.1 HYDROGEN REFUELLING STATIONS ........................................................................... 52 6.1.1 On-site hydrogen production within the HRS .............................................................. 53 6.1.2 HRS operation ............................................................................................................. 55 6.1.3 Electric Charging Station ............................................................................................. 56 6.1.4 Electricity mixes ........................................................................................................... 57
6.2 VEHICLES ................................................................................................................. 58 6.2.1 Production ................................................................................................................... 60 6.2.2 Use phase ................................................................................................................... 62 6.2.3 End of life ..................................................................................................................... 64
7 RESULTS – LONDON .......................................................................................66
7.1 HYDROGEN REFUELLING STATIONS ........................................................................... 66
7.2 VEHICLES ................................................................................................................. 68 7.2.1 Production ................................................................................................................... 68 7.2.2 Sensitivity analysis – Pt loading of fuel cell ................................................................. 70 7.2.3 Life cycle ...................................................................................................................... 71 7.2.4 End of life ..................................................................................................................... 74
8 RESULTS – COPENHAGEN .............................................................................77
8.1 HYDROGEN REFUELLING STATIONS ........................................................................... 77 8.1.1 Environmental impact of the HRS in 2014 and 2023 .................................................. 77 8.1.2 Comparison of HRS with petrol and ECS for Copenhagen ........................................ 78
8.2 VEHICLES ................................................................................................................. 79 8.2.1 Production ................................................................................................................... 80 8.2.2 Sensitivity analysis – Platinum loading of fuel cell ...................................................... 81 8.2.3 Life cycle ...................................................................................................................... 82 8.2.4 End of life ..................................................................................................................... 91
9 CONCLUSIONS .................................................................................................94
9.1 LONDON ................................................................................................................... 94 9.1.1 Hydrogen refuelling station .......................................................................................... 94 9.1.2 Vehicle production ....................................................................................................... 95 9.1.3 Life cycle ...................................................................................................................... 96
9.2 COPENHAGEN .......................................................................................................... 97 9.2.1 Hydrogen refuelling station .......................................................................................... 97 9.2.2 Vehicle production ....................................................................................................... 97 9.2.3 Life cycle ...................................................................................................................... 98
9.3 SUMMARY ................................................................................................................ 99
10 REFERENCES .................................................................................................100
11 ANNEX .............................................................................................................108
11.1 LONDON RESULTS .................................................................................................. 108 11.1.1 Hydrogen refuelling stations ...................................................................................... 108 11.1.2 Vehicles ..................................................................................................................... 112
11.2 COPENHAGEN RESULTS .......................................................................................... 116 11.2.1 Hydrogen refuelling stations ...................................................................................... 116 11.2.2 Vehicles ..................................................................................................................... 122
D6.8 – Final environmental impact assessment report
Project no: 9/124 29.10.2015
278727
List of figures
Figure 1: GWP of H2 production by electrolysis technologies using different energy sources. ....................................................................................................19
Figure 2: GWP values of different H2 production technologies. ...............................19
Figure 3: Results of the LCA for different hydrogen production processes, including the HRS. ...................................................................................................22
Figure 4: System boundary for the study. ................................................................31
Figure 5: Centralized SMR plant layout and process schematic view (courtesy of Air Products). .................................................................................................36
Figure 6: Basic hydrogen transport pathway selected for the LCA study: tube trailer transport of gaseous H2. ...........................................................................37
Figure 7: Heathrow HRS, Air Products Series 125 ..................................................38
Figure 8: Comparison of FC and diesel taxi. ............................................................41
Figure 9: Material mix of the fuel cell system. ..........................................................43
Figure 10: Weight distribution of the 14 kWh battery in the FC taxi. ..........................44
Figure 11: Production LCA model. .............................................................................46
Figure 12: Basic H2 production infrastructure selected for the Copenhagen case study. ........................................................................................................52
Figure 13: Copenhagen HRS, HySTAT®-10-25. .......................................................53
Figure 14: Alkaline water electrolysis scheme. ..........................................................54
Figure 15: ECS technology scope. ............................................................................56
Figure 16: Hyundai ix35 FC. ......................................................................................59
Figure 17: Contributions of the different phases of fuel production for the London case to the GWP, measured in kg of CO2-Equiv. / MJ of energy. .............67
Figure 18: Comparison of the production of a London diesel TX4 and FC TX4. ........69
Figure 19: Results of the detailed evaluation of the FC system. ................................70
Figure 20: Sensitivity analysis of FC with Pt loadings of 1 and 0.5 g Pt/kW...............71
Figure 21: Comparison of the FC and diesel taxi combining the min consumption with fossil and green H2. ..................................................................................72
Figure 22: Comparison of the FC and diesel taxi combining the Max consumption with fossil and green H2. ...........................................................................73
Figure 23: Comparison of end of life impacts with production and use phase impacts of the FC and diesel taxi (Min fuel consumption). .....................................75
Figure 24: End of life impacts of the FC and diesel taxi. ............................................76
Figure 25: Contribution of the different efficiency ratios and energy sources to the GWP for the three electricity mixes proposed for Denmark. .....................78

D6.8 – Final environmental impact assessment report
Project no: 10/124 29.10.2015
278727
Figure 26: Contributions of the different phases of fuel production for the Copenhagen case, to the GWP category, measured in kg of CO2-Equiv. /MJ of energy. ...........................................................................................79
Figure 27: Comparison of the production of the SUV FC and equivalent vehicles. ....80
Figure 28: Sensitivity analysis of the SUV FC with platinum loadings of 1 and 0.5 g Pt/kW. .......................................................................................................82
Figure 29: Comparison of the SUV FC combining the measured consumption with H2 from 2014 Danish present and renewable electricity mix. .........................83
Figure 30: Comparison of the SUV FC combining the measured consumption with H2 from 2014 Danish present and renewable electricity mix with increased electrolyser efficiency. ..............................................................................85
Figure 31: Comparison of the SUV FC combining measured and the NEDC consumption with H2 from 2014 Danish current and renewable electricity mix. ...........................................................................................................86
Figure 32: Comparison of the SUV FC with the SUV petrol and the SUV diesel using H2 from 2014 Danish present and renewable electricity mix (NEDC consumption). ...........................................................................................88
Figure 33: Comparison of the SUV FC with all equivalent vehicles using H2 and electricity from 2014 Danish present electricity mix (NEDC consumption). 89
Figure 34: Comparison of the SUV FC with all equivalent vehicles using H2 and electricity from 2014 Danish renewable electricity mix (NEDC consumption). ...........................................................................................90
Figure 35: Comparison of end of life impacts with production and use phase impacts of the SUV FC and equivalent vehicles (NEDC fuel consumption). ..........92
Figure 36: End of life impacts of the SUV FC and equivalent vehicles. .....................93
Figure 37: Contributions of the different phases of fuel production for the London case, to the Acidification Category, measured in kg of SO2-Equiv../ MJ of energy. ....................................................................................................108
Figure 38: Contributions of the different phases of fuel production for the London case, to the EP Category, measured in kg of PO4-Equiv./ MJ of energy. 110
Figure 39: Contributions of the different phases of fuel production for the London case, to the POCP, measured in kg of Ethene-Equiv./ MJ of energy. .....111
Figure 40: Comparison of the production of a London diesel TX4 and an FC TX4. .112
Figure 41: Comparison of the production of a London diesel TX4 and an FC TX4. .112
Figure 42: Comparison of the production of a London diesel TX4 and an FC TX4. .113
Figure 43: Comparison of the FC and diesel taxi combining the min consumption with fossil and green H2. ................................................................................113
Figure 44: Comparison of the FC and diesel taxi combining the min consumption with fossil and green H2. ................................................................................114
D6.8 – Final environmental impact assessment report
Project no: 11/124 29.10.2015
278727
Figure 45: Comparison of the FC and diesel taxi combining the min consumption with fossil and green H2. ................................................................................114
Figure 46: Comparison of the FC and diesel taxi combining the max consumption with fossil and green H2. .........................................................................115
Figure 47: Comparison of the FC and diesel taxi combining the max consumption with fossil and green H2. .........................................................................115
Figure 48: Comparison of the FC and diesel taxi combining the max consumption with fossil and green H2. .........................................................................116
Figure 49: Contribution of the different efficiency ratios and energy sources to the AP for the three electricity mixes proposed for Denmark. .............................117
Figure 50: Contribution of the different efficiency ratios and energy sources to the EP for the three electricity mixes proposed for Denmark. .............................117
Figure 51: Contribution of the different efficiency ratios and energy sources to the POCP for the three electricity mixes proposed for Denmark. .................118
Figure 52: Contributions of the different phases of fuel production for the Copenhagen case, to the AP Category, measured in kg of SO2-Equiv./ MJ of energy. ................................................................................................119
Figure 53: Contributions of the different phases of fuel production for the Copenhagen case, to the EP Category, measured in kg of PO4-Equiv./ MJ of energy. ................................................................................................120
Figure 54: Contributions of the different phases of fuel production for the Copenhagen case, to the POCP Category, measured in kg of Ethene-Equiv./ MJ of energy. ..............................................................................121
Figure 55: Comparison of the production of the SUV FC and equivalent vehicles. ..122
Figure 56: Comparison of the production of the SUV FC and equivalent vehicles. ..122
Figure 57: Comparison of the production of the SUV FC and equivalent vehicles. ..123
Figure 58: Comparison of the SUV FC with all equivalent vehicles using H2 and electricity from 2014 Danish present and renewable electricity mix (NEDC consumption). .........................................................................................123
Figure 59: Comparison of the SUV FC with all equivalent vehicles using H2 and electricity from 2014 Danish present and renewable electricity mix (NEDC consumption). .........................................................................................124
Figure 60: Comparison of the SUV FC with all equivalent vehicles using H2 and electricity from 2014 Danish present and renewable electricity mix (NEDC consumption). .........................................................................................124
D6.8 – Final environmental impact assessment report
Project no: 12/124 29.10.2015
278727
List of tables
Table 1: A comparison of the GWP for hydrogen produced by SMR from different literature sources. .....................................................................................18
Table 2: GWP values of different H2 production technologies. ...............................20
Table 3: GWP for petrol and diesel. ........................................................................21
Table 4: Overview recent studies on GHG of FC stacks. .......................................25
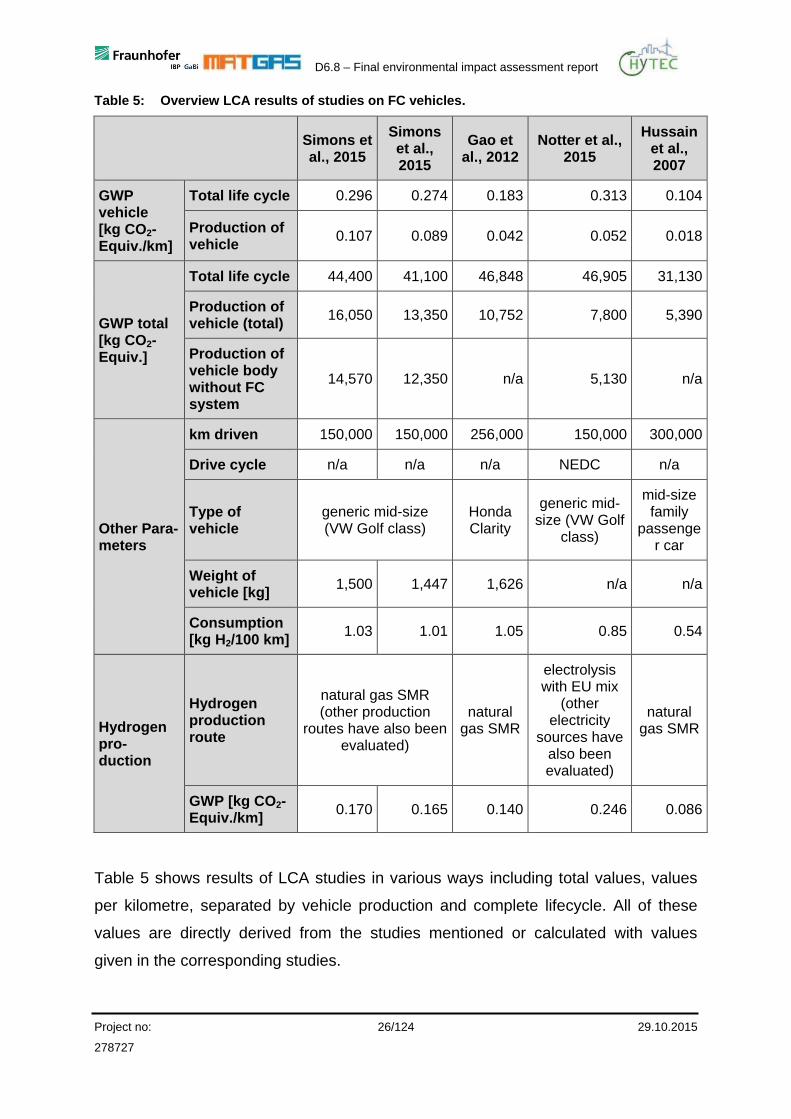
Table 5: Overview LCA results of studies on FC vehicles. .....................................26
Table 6: Relevant parameters for delivering 1 MJ H2 at 25ºC and 99.9995% purity, including H2 production, transportation, HRS construction and operation phases. Data is presented per FU. ...........................................................39
Table 7: Vehicle specifications of the London taxis. ...............................................40
Table 8: Overview mass of the main vehicle parts. ................................................41
Table 9: Assumed material mix of NMC battery cell. ..............................................44
Table 10: Conditions for consumption measurements for London taxi operation. ....47
Table 11: Main parameters for HRS referred to the delivery of 1 MJ of energetic content (hydrogen) at 25ºC, 700 bar with a purity of 99.9995%. ...............55
Table 12: Main parameters for ECS referred to the delivery of 1 MJ of electricity. ..56
Table 13: Share of energy sources in Danish electricity mix according to the three scenarios studied. .....................................................................................57
Table 14: Vehicle specifications of the FC, petrol and diesel compact SUV. ............58
Table 15: Data basis for the generic vehicles. ..........................................................59
Table 16: Vehicle specifications of compact plug-in hybrid and battery electric average vehicles. ......................................................................................60
Table 17: NEDC consumption values and mileage of the compared vehicles. .........62
Table 18: Assumptions on driving operation of the plug-in hybrid average vehicle. .63
Table 19: Overview LCA results of FC and diesel taxi. .............................................74
Table 20: Overview LCA results of SUV FC with different H2 production routes. .....85
Table 21: Overview LCA results of SUV FC and SUVs petrol/diesel. .......................88
Table 22: Overview LCA results of SUV FC, BEV and PHEV (different electricity mixes). ......................................................................................................91
D6.8 – Final environmental impact assessment report
Project no: 13/124 29.10.2015
278727
List of abbreviations
AP Acidification Potential
BEV Battery Electric Vehicle
BoM Bill of Materials
CO Carbon Monoxide
CO2 Carbon Dioxide
COTS Components-Off-The-Shelf
CPH Copenhagen City
DEA Danish Energy Agency
DK Denmark
DoW Description of Work
ECS Electric Charging Station
EP Eutrophication Potential
Equiv. Equivalents
EREV Extended-Range Electric Vehicles
EU European Union
EV Electric Vehicle
FC Fuel Cell
FCH JU Fuel Cells and Hydrogen Joint Undertaking
FCV Fuel Cell Vehicle
FU Functional Unit
GHG Greenhouse Gas emissions
GWP Global Warming Potential
H2 Hydrogen
HBEFA Handbook Emission Factors for Road Transport
HDPE High Density Polyethylene
HHV Higher Heating Value
HPPT High Pressure Tube Trailer
HRS Hydrogen Refuelling Station
HV High Voltage
ICE Internal Combustion Engine
IE Intelligent Energy
ISO International Organization for Standardization

D6.8 – Final environmental impact assessment report
Project no: 14/124 29.10.2015
278727
Khs Kilo hours
LCA Life Cycle Assessment
LCI Life Cycle Inventory
LCIA Life Cycle Impact Assessment
LHV Lower Heating Value
Li Lithium
LPG Liquid Petroleum Gas
LV Low Voltage
MJ Mega Joule
MSDS Material Safety Data Sheets
NEDC New European Driving Cycle
NG Natural Gas
NMC Lithium Nickel Manganese Cobalt oxide
NMVOC Non-Methane Volatile Organic Compounds
PEM Polymer Electrolyte Membrane
PEMFC Polymer Exchange Membrane Fuel Cell
PHEV Plug-in Hybrid Electric Vehicle
PMSM Permanent Magnet Synchronous Motor
POCP Photochemical Ozone Creation Potential
PS Pumping Station
Pt Platinum
RE Renewable Energy
RS Refuelling Station
SMR Steam Methane Reforming
SOFC Solid Oxide Fuel Cell
STOC Steam-to-Carbon
SUV Sports Utility Vehicle
UCTE Union for the Co-ordination of Transmission of Electricity
UK United Kingdom
VOCs Volatiles Organic Compounds
D6.8 – Final environmental impact assessment report
Project no: 15/124 29.10.2015
278727
1 Objectives of the report
1.1 Document Scope and Structure
This deliverable collects and interprets the results obtained in Task 6.3 of the Work
Package 6 (WP6) in the HyTEC project. The final objective of this task was to
perform a Life Cycle Assessment (LCA) of fuel cell electric vehicles operated in the
European cities London (FC taxi) and Copenhagen (FC SUV) taking into account the
following phases: (i) car production, ii) hydrogen production pathways (Steam
Methane Reforming –SMR-, and water electrolysis), and iii) hydrogen consumption
during their use as well as iv) the vehicles’ end of life.
In this report, the environmental impacts of the FC vehicles are compared to current
petrol, diesel and plug-in hybrid as well as battery electric vehicles. A special focus is
set also on the environmental comparison of the energy supply pathways (well-to-
tank analysis) considering additionally the impacts of petrol and diesel refuelling
stations as well as Electric Charging Stations (ECS).
The well-to-tank analysis, considering all relevant hydrogen production pathways for
the London and Copenhagen vehicle operation has been carried out by MATGAS. In
addition, as a benchmark for the hydrogen stations, MATGAS has also performed the
LCA for other fuelling stations, including equivalent conventional petrol and diesel
refuelling stations and ECS, allowing a comparative assessment of the environmental
impact of the different refuelling technologies. All LCAs were performed using the
commercial software SimaPro 8.03.14 and the Ecoinvent Version 3.1 database [PRé
Consultants, 2015].
Based on vehicle data from HyTEC project partners, Fraunhofer analysed the life
cycle of the London and Copenhagen FC vehicles. For benchmarking the FC
vehicles, Fraunhofer conducted additional LCAs of current petrol, diesel and plug-in
hybrid as well as battery electric vehicles and compared their environmental impacts.
For the vehicles LCAs the commercial software system GaBi 6 with datasets from
GaBi database Service Pack 27 was used [thinkstep AG, 1992-2015].
This report is organized as follows. Chapter 2 describes the state of the art of the
LCA of both fuel production and fuel cell vehicles. Chapter 3 and 4 define the goal
D6.8 – Final environmental impact assessment report
Project no: 16/124 29.10.2015
278727
and scope of the LCA, respectively. In chapter 5 and 6, the Life Cycle Inventories
(LCI) for the London and Copenhagen cases are described in detail. Chapter 7 and 8
address the results of the Life Cycle Impact Assessment (LCIA) concerning different
scenarios for fuel/energy supply and vehicle specifications in the case of London and
Copenhagen. Finally, chapter 9 gives conclusions and possible future directions
1.2 Disclaimer
Despite the care that was taken while preparing this document, the following
disclaimer applies:
THE INFORMATION INCLUDED IN THIS DOCUMENT IS PROVIDED AS IT IS AND
NO GUARANTEE OR WARRANTY IS GIVEN THAT THE INFORMATION IS FIT
FOR ANY PARTICULAR PURPOSE. THE USER THEREOF EMPLOYS THE
INFORMATION AT HIS/HER SOLE RISK AND LIABILITY.
The report reflects only the authors’ views. The Fuel Cell and Hydrogen Joint
Undertaking (FCH JU) and the European Union (EU) are not liable for any use that
may be made of the information contained therein.

D6.8 – Final environmental impact assessment report
Project no: 17/124 29.10.2015
278727
2 State of the art
In order to have an overview of the state of the art of the LCA from well-to-wheel, and
for a better understanding of the results obtained in HyTEC, this chapter includes the
state of the art divided in two sections;
- Section 2.1 includes studies related to different hydrogen production
procedures (SMR, electrolysis, petrol and diesel production) and HRSs.
- In section 2.2, LCA studies from both conventional and FC vehicles are
included.
2.1 Previous studies on Life Cycle Assessment of H2 production/HRS
Understanding the impact of the different hydrogen production pathways is
considered the first step in the LCA of hydrogen fuelling infrastructures. SMR is the
most common industrial production method for hydrogen, being a very mature and
optimized technology. Nonetheless, in addition to SMR, there are also other
hydrogen production methods, depending on the sources of the raw materials used
[Ruiz et al., 2015], among them:
Natural gas (NG) and hydrocarbons: including Liquid Petroleum Gas (LPG),
ethanol, biogas, etc.; hydrogen is produced by using reforming-based
processes (either using steam reforming, auto thermal reforming or through
partial oxidation).
Solid or heavy fuels: coal, biomass, refinery residues, etc., where hydrogen is
produced through gasification or pyrolysis processes.
Water or other chemicals, e.g. sodium chloride solutions, where hydrogen is
obtained through electrolysis.
Globally, the hydrogen production sources were about 48% from natural gas, 30%
from fossil oil, 18% from coal and 4% with electricity via water electrolysis [Merino,
2006]. Although approximately 96% of the hydrogen production comes from fossil

D6.8 – Final environmental impact assessment report
Project no: 18/124 29.10.2015
278727
fuels, SMR being the most used process, there is an increasing interest on promoting
other sources of hydrogen, with focus on sustainable processes.
We present next a comparison of different published data regarding the GWP of
hydrogen production, as obtained by LCAs performed by different authors, in order to
put in context the work on LCA carried out at the HyTEC project. The review includes
H2 transportation and the environmental impact of the HRS, when available.
2.1.1 Hydrogen production from Steam Methane Reforming
Table 1 summarizes the main results on GWP published in the last 15 years
concerning different SMR LCA studies. Results range from 0.0834 to 0.1066 kg CO2-
Equiv./MJ, and the efficiencies from 64 to 90%, depending on the source, the
electricity mix and some other considerations.
Table 1: A comparison of the GWP for hydrogen produced by SMR from different literature sources.
GWP (kg CO2-Equiv./MJ)
Efficiency Energy Mix/Region Reference
0.0996 76.8% Canada Suleman, 2014
0.0879 65% Spain Susmozas et al., 2013
0.0834 85% European electricity generation mix
Dufour et al., 2012
0.0990 90% Canada Cetinkaya et al., 2012
0.0880 85% Electric generation mix for OECD Europe region
Dufour et al., 2009
0.1066 64% Indian electricity mix Manish et al., 2008
0.084 77% Greece Koroneos et al., 2004
0.0990 89% Mix of the mid –continental United States
Spath et al., 2001
2.1.2 Hydrogen production by electrolysis
Regarding the production of hydrogen by electrolysis, the reader is referred to a
recent review published in 2013 by [Bhandari et al., 2013]. These authors evaluated
and compared different hydrogen production technologies regarding their
environmental impact, focused on the carbon footprint. Figure 1 shows the GWP of
D6.8 – Final environmental impact assessment report
Project no: 19/124 29.10.2015
278727
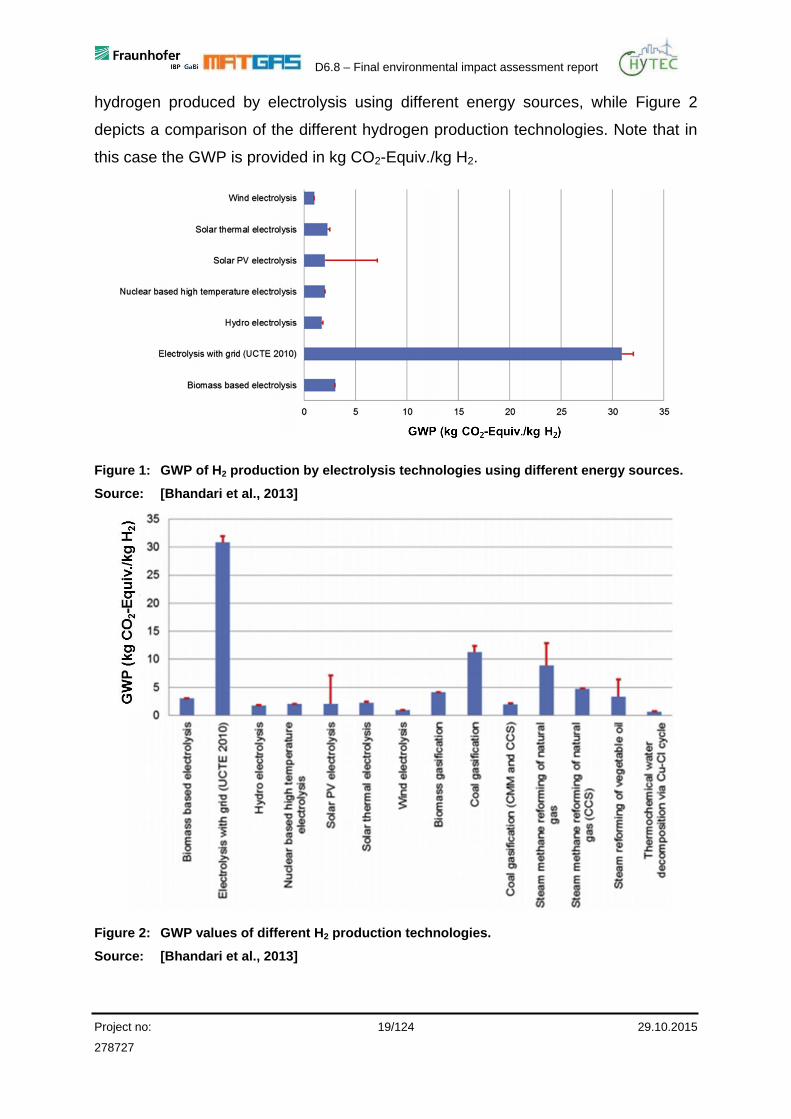
hydrogen produced by electrolysis using different energy sources, while Figure 2
depicts a comparison of the different hydrogen production technologies. Note that in
this case the GWP is provided in kg CO2-Equiv./kg H2.
Figure 1: GWP of H2 production by electrolysis technologies using different energy sources.
Source: [Bhandari et al., 2013]
Figure 2: GWP values of different H2 production technologies.
Source: [Bhandari et al., 2013]
D6.8 – Final environmental impact assessment report
Project no: 20/124 29.10.2015
278727
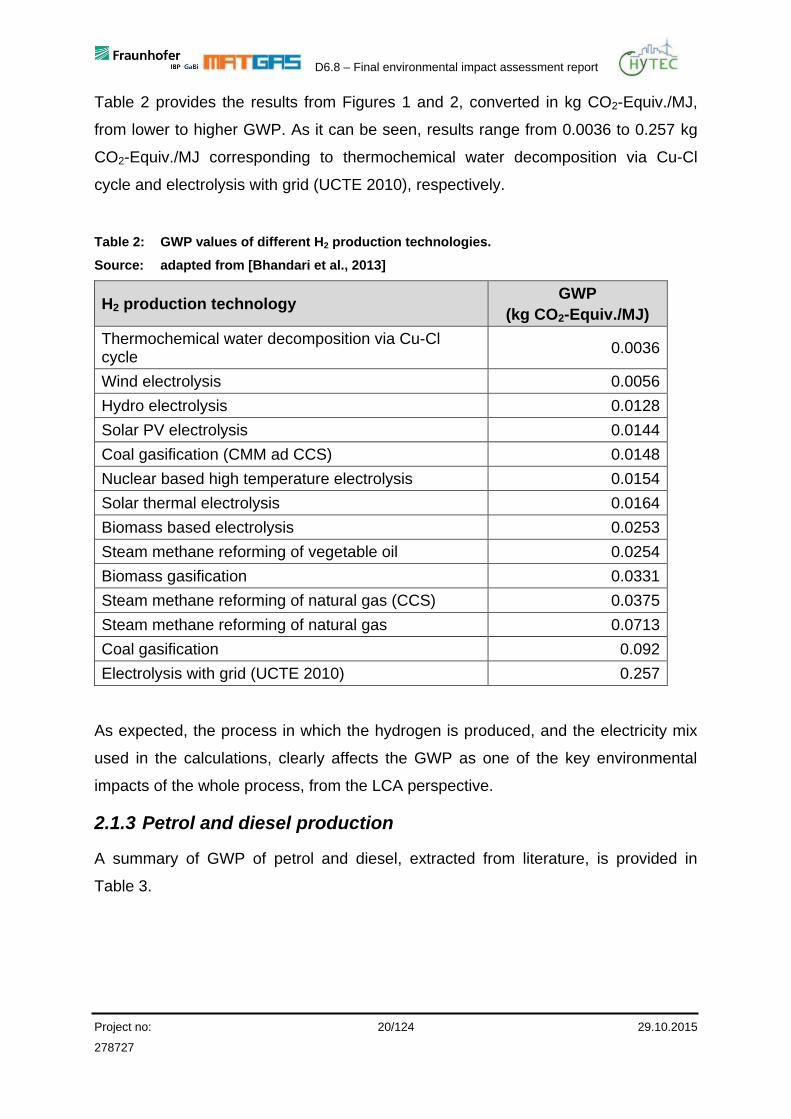
Table 2 provides the results from Figures 1 and 2, converted in kg CO2-Equiv./MJ,
from lower to higher GWP. As it can be seen, results range from 0.0036 to 0.257 kg
CO2-Equiv./MJ corresponding to thermochemical water decomposition via Cu-Cl
cycle and electrolysis with grid (UCTE 2010), respectively.
Table 2: GWP values of different H2 production technologies.
Source: adapted from [Bhandari et al., 2013]
H2 production technology GWP
(kg CO2-Equiv./MJ)
Thermochemical water decomposition via Cu-Cl cycle
0.0036
Wind electrolysis 0.0056
Hydro electrolysis 0.0128
Solar PV electrolysis 0.0144
Coal gasification (CMM ad CCS) 0.0148
Nuclear based high temperature electrolysis 0.0154
Solar thermal electrolysis 0.0164
Biomass based electrolysis 0.0253
Steam methane reforming of vegetable oil 0.0254
Biomass gasification 0.0331
Steam methane reforming of natural gas (CCS) 0.0375
Steam methane reforming of natural gas 0.0713
Coal gasification 0.092
Electrolysis with grid (UCTE 2010) 0.257
As expected, the process in which the hydrogen is produced, and the electricity mix
used in the calculations, clearly affects the GWP as one of the key environmental
impacts of the whole process, from the LCA perspective.
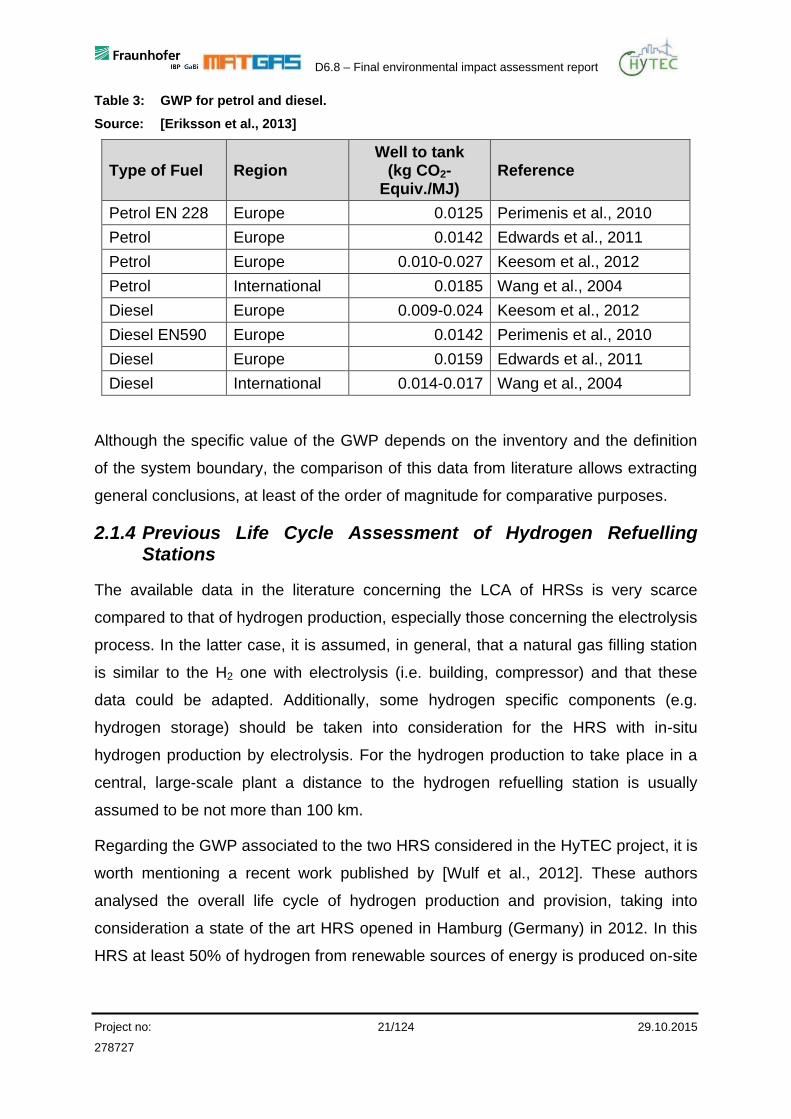
2.1.3 Petrol and diesel production
A summary of GWP of petrol and diesel, extracted from literature, is provided in
Table 3.
D6.8 – Final environmental impact assessment report
Project no: 21/124 29.10.2015
278727
Table 3: GWP for petrol and diesel.
Source: [Eriksson et al., 2013]
Type of Fuel Region Well to tank
(kg CO2-Equiv./MJ)
Reference
Petrol EN 228 Europe 0.0125 Perimenis et al., 2010
Petrol Europe 0.0142 Edwards et al., 2011
Petrol Europe 0.010-0.027 Keesom et al., 2012
Petrol International 0.0185 Wang et al., 2004
Diesel Europe 0.009-0.024 Keesom et al., 2012
Diesel EN590 Europe 0.0142 Perimenis et al., 2010
Diesel Europe 0.0159 Edwards et al., 2011
Diesel International 0.014-0.017 Wang et al., 2004
Although the specific value of the GWP depends on the inventory and the definition
of the system boundary, the comparison of this data from literature allows extracting
general conclusions, at least of the order of magnitude for comparative purposes.
2.1.4 Previous Life Cycle Assessment of Hydrogen Refuelling Stations
The available data in the literature concerning the LCA of HRSs is very scarce
compared to that of hydrogen production, especially those concerning the electrolysis
process. In the latter case, it is assumed, in general, that a natural gas filling station
is similar to the H2 one with electrolysis (i.e. building, compressor) and that these
data could be adapted. Additionally, some hydrogen specific components (e.g.
hydrogen storage) should be taken into consideration for the HRS with in-situ
hydrogen production by electrolysis. For the hydrogen production to take place in a
central, large-scale plant a distance to the hydrogen refuelling station is usually
assumed to be not more than 100 km.
Regarding the GWP associated to the two HRS considered in the HyTEC project, it is
worth mentioning a recent work published by [Wulf et al., 2012]. These authors
analysed the overall life cycle of hydrogen production and provision, taking into
consideration a state of the art HRS opened in Hamburg (Germany) in 2012. In this
HRS at least 50% of hydrogen from renewable sources of energy is produced on-site
D6.8 – Final environmental impact assessment report
Project no: 22/124 29.10.2015
278727
by water electrolysis based on surplus electricity from wind. The remaining 50% of
hydrogen is provided by trucks from a large scale production plant where H2 is
produced from SMR or glycerol as a by-product of the biodiesel production.
According to their calculations, the operation of the HRS produces mainly CO2-
Equiv.-emissions the electricity demand of the compressors to reach the high
pressure for the refuelling process (over 80 MP in the case they studied). As for the
production process by electrolysis from green electricity, where the compression
electricity from renewable sources of energy was also used, it was concluded that
almost no emissions are caused by this procedure. In fact, the electricity demand of
the compressors is responsible for 6.5% of the overall emissions of the electrolysis
production with the use of electricity from the grid. The use of electricity from
renewable resources lowers the emissions from 1.97 to 0.13 kgCO2-Equiv./ kgH2
(0.0011 kgCO2-Equiv./ MJ).
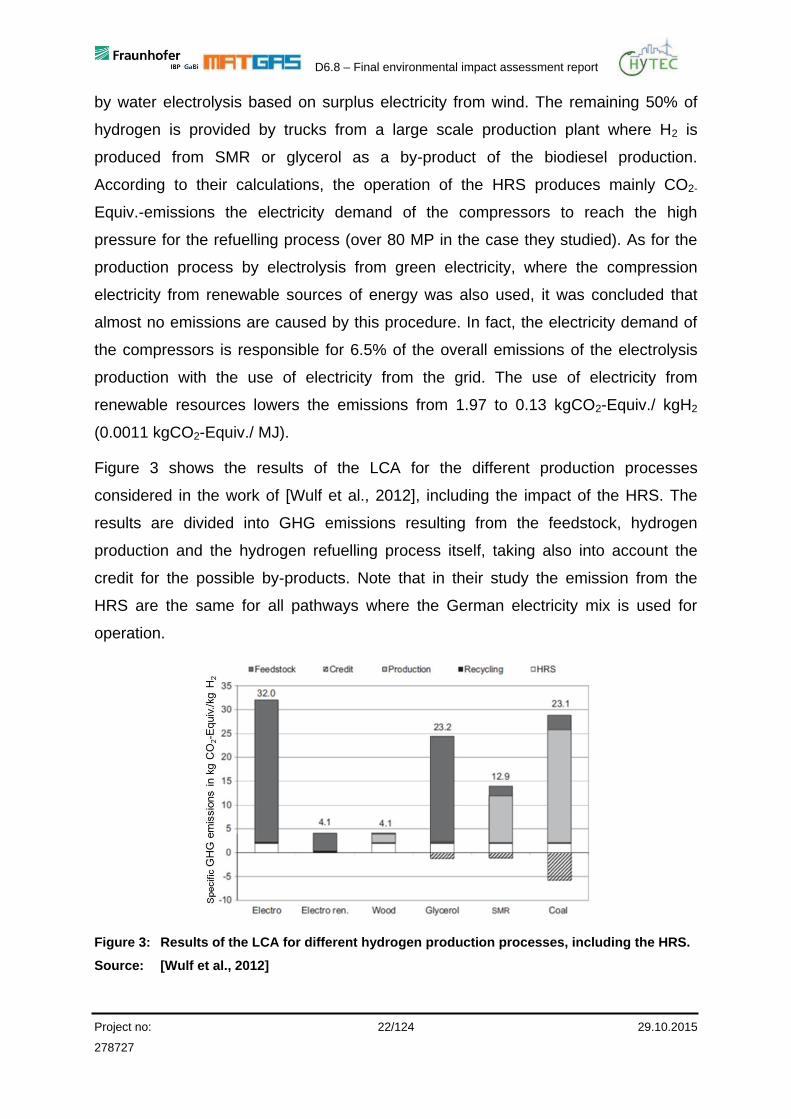
Figure 3 shows the results of the LCA for the different production processes
considered in the work of [Wulf et al., 2012], including the impact of the HRS. The
results are divided into GHG emissions resulting from the feedstock, hydrogen
production and the hydrogen refuelling process itself, taking also into account the
credit for the possible by-products. Note that in their study the emission from the
HRS are the same for all pathways where the German electricity mix is used for
operation.
Figure 3: Results of the LCA for different hydrogen production processes, including the HRS.
Source: [Wulf et al., 2012]
D6.8 – Final environmental impact assessment report
Project no: 23/124 29.10.2015
278727
As observed in the figure, the lowest GWP can be achieved by hydrogen provided
via electrolysis with renewable energy and via biomass gasification.
2.1.5 Conclusions
We have summarized here published results on LCA studies of i) hydrogen
production processes and ii) the HRS. The main conclusions are:
- Hydrogen produced by electrolysis using renewable energy has a lower
environmental impact (in terms of GWP) than hydrogen produced by SMR.
The impact of electrolysis with current grid (UCTE 2010) is the highest
compared with to other evaluated technologies. Moreover, electrolysis
techniques have a GWP lower or equivalent to that of petrol and diesel,
depending on the production technology.
- For the HRSs, the lowest GWP can be achieved by hydrogen obtained via
electrolysis with renewable energy and via biomass gasification (see Figure
3).
2.2 Previous studies on Life Cycle Assessment of FC vehicles
Fuel cell vehicles (FCVs) have emerged from prototypes in the 1990s to fully
developed and commercially available products in recent years. This evolution has
been part of the global need for sustainable solutions in the ever growing transport
sector. Consistently, most major car manufacturers have been dedicating programs
for FCV research and development in several aspects i.e. efficiency, performance,
consumption, fuel cells, etc.
2.2.1 LCA studies on vehicles
LCA on vehicles is a well-covered topic in literature. LCA studies focused on one
vehicle part at a time in the 1990s, they can now analyse entire vehicles by
integrating new aspects into already existing, adjustable models. LCA has become a
regularly used tool by researchers and car manufacturers like Daimler and
Volkswagen [Daimler AG, 2015; Volkswagen AG, 2015]. These two companies
provide a full LCA for all their new vehicles entering the market, creating a wide
knowledge base on various conventional vehicles.
D6.8 – Final environmental impact assessment report
Project no: 24/124 29.10.2015
278727
Regular vehicles and FCVs share a basic structure but the main differences are the
FC system, a traction battery (fuel cell vehicles generally employ a hybrid
architecture) and the accompanying power electronic components. A list of
necessary changes is available in chapter 5.2.1. These electric components need
special attention when being implemented into the LCA model as they may lead to
additional impacts to the environment.
2.2.2 LCA studies on fuel cells and FC vehicles
Only few LCA studies on FCVs providing detailed information about the FC system
can be found in published literature. Even if extensive studies have been conducted
and evaluated, the data is often not clearly shown due to confidentiality reasons. The
most cited studies in this context are those by [Pehnt, 2001; Pehnt, 2002a; Pehnt,
2002b; Pehnt, 2003a; Pehnt, 2003b; Pehnt, 2003c] who used industrial data to
analyse the environmental impacts of Solid Oxide Fuel Cells (SOFC) in stationary
and Polymer Exchange Membrane Fuel Cells (PEMFC) in automotive applications.
These studies were among the first and most relevant. However, FC technology is
fast evolving and therefore newer industrial data has to be taken into consideration.
One example for this fast evolving technology is given by Toyota comparing their
2008 FC stack with the new Mirai FC stack. The new Mirai FC stack has 114 kW
output at 56 kg versus the 2008 FC stack had 90 kW output at 108 kg [Tanaka,
2015].
The studies that were published in the following years after Pehnt often used little
accessible data for their investigations. An example is the preliminary LCA by
[Hussain et al., 2007] who assessed the energy consumption and GHG emissions of
conventional ICE vehicles compared to FCVs for the fuel and vehicle cycles.
Similarly, [Granovskii et al., 2006] also compared these types of vehicles and
additionally a hybrid and battery electric vehicle economically and environmentally
taking the production and use phase into account. In a more recent paper, Garraín
points out that Pehnt still provides the most detailed data as more recent studies do
not show the underlying data to be able to compare them with own data [Garraín and
Lechón, 2014]. Their study is not usable as it is about a three-wheel assisted-
pedalling vehicle with a FC. One of the most acknowledged studies in the field of
hydrogen mobility is from [McKinsey & Company, 2010], which shows graphs about
D6.8 – Final environmental impact assessment report
Project no: 25/124 29.10.2015
278727
the well-to-tank and well-to-wheel emissions. However, they cannot be used for
comparison purposes, since important parameters such as emissions for production
of the FC vehicle, platinum load and consumption are not mentioned.
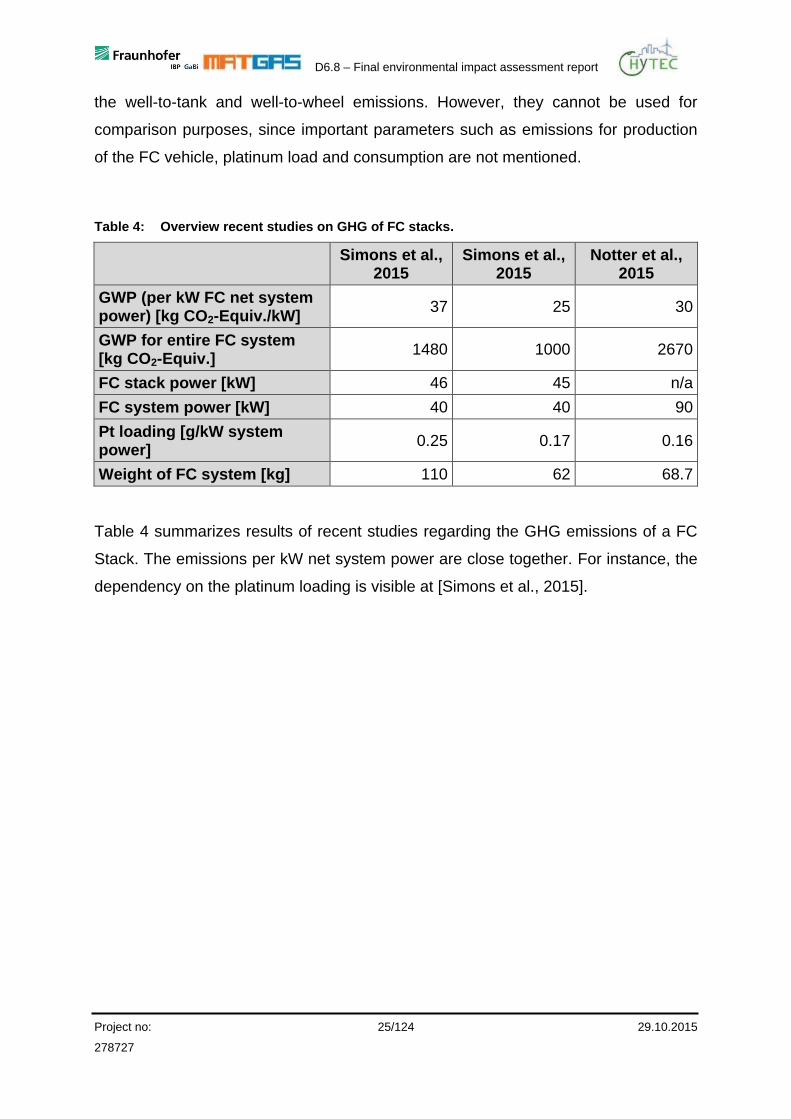
Table 4: Overview recent studies on GHG of FC stacks.
Simons et al., 2015
Simons et al., 2015
Notter et al., 2015
GWP (per kW FC net system power) [kg CO2-Equiv./kW]
37 25 30
GWP for entire FC system [kg CO2-Equiv.]
1480 1000 2670
FC stack power [kW] 46 45 n/a
FC system power [kW] 40 40 90
Pt loading [g/kW system power]
0.25 0.17 0.16
Weight of FC system [kg] 110 62 68.7
Table 4 summarizes results of recent studies regarding the GHG emissions of a FC
Stack. The emissions per kW net system power are close together. For instance, the
dependency on the platinum loading is visible at [Simons et al., 2015].
D6.8 – Final environmental impact assessment report
Project no: 26/124 29.10.2015
278727
Table 5: Overview LCA results of studies on FC vehicles.
Simons et al., 2015
Simons et al., 2015
Gao et al., 2012
Notter et al., 2015
Hussain et al., 2007
GWP vehicle [kg CO2-Equiv./km]
Total life cycle 0.296 0.274 0.183 0.313 0.104
Production of vehicle
0.107 0.089 0.042 0.052 0.018
GWP total [kg CO2-Equiv.]
Total life cycle 44,400 41,100 46,848 46,905 31,130
Production of vehicle (total)
16,050 13,350 10,752 7,800 5,390
Production of vehicle body without FC system
14,570 12,350 n/a 5,130 n/a
Other Para-meters
km driven 150,000 150,000 256,000 150,000 300,000
Drive cycle n/a n/a n/a NEDC n/a
Type of vehicle
generic mid-size (VW Golf class)
Honda Clarity
generic mid-size (VW Golf
class)
mid-size family
passenger car
Weight of vehicle [kg]
1,500 1,447 1,626 n/a n/a
Consumption [kg H2/100 km]
1.03 1.01 1.05 0.85 0.54
Hydrogen pro-duction
Hydrogen production route
natural gas SMR (other production
routes have also been evaluated)
natural gas SMR
electrolysis with EU mix
(other electricity
sources have also been evaluated)
natural gas SMR
GWP [kg CO2-Equiv./km]
0.170 0.165 0.140 0.246 0.086
Table 5 shows results of LCA studies in various ways including total values, values
per kilometre, separated by vehicle production and complete lifecycle. All of these
values are directly derived from the studies mentioned or calculated with values
given in the corresponding studies.
D6.8 – Final environmental impact assessment report
Project no: 27/124 29.10.2015
278727
3 Goal of the Life Cycle Assessment
3.1 Intended application
The intended application is to provide a comprehensive evaluation of the
environmental performance of FCEV (taxi and passenger car) considering car
production, different hydrogen production pathways (SMR and water electrolysis),
hydrogen consumption during their use phase as well as the vehicles’ end of life. The
environmental impacts of the whole life cycle of the FC vehicles are compared to
current petrol, diesel and plug-in hybrid as well as battery electric vehicles. A special
focus is set on the environmental comparison of the energy supply pathways (well-to-
tank analysis) additionally considering the impacts of petrol and diesel refuelling
stations as well as electric charging stations.
In addition to the environmental footprint concerning Global Warming Potential as the
main environmental impact factor, the Acidification Potential, the Eutrophication
Potential and the Photochemical Ozone Creation Potential were also analysed in the
framework of the LCAs.
3.2 Reasons for carrying out the study
This study has been performed in order to quantify the environmental benefits of
taxis and passenger cars refuelled by different HRS technologies in terms of several
environmental impact categories with a main focus on greenhouse gas emissions.
The reason to evaluate the performance of the London and Copenhagen zero-
tailpipe emission urban fleets is to obtain a better understanding of their advantages
and disadvantages from an environmental point of view.
3.3 Target audience
The target audience of this study are the partners of the HyTEC project and the FCH
JU, the technical experts and the stakeholders and decision makers. Moreover, this
deliverable will be public, so it will be available for any person interested in the
hydrogen cars and hydrogen economy.
D6.8 – Final environmental impact assessment report
Project no: 28/124 29.10.2015
278727
3.4 Comparisons
In this study the corresponding HRSs, dispensing H2 produced by SMR for London
and electrolysis for Copenhagen, are compared to electric charging stations, as well
as petrol and diesel stations. Besides, a forecast of the electricity grid mix has been
created to compare the current scenario with several other possibilities.
The FC taxi for London is compared to a conventional diesel taxi with internal
combustion engine. The fuel cell SUV is compared to equivalent petrol and diesel
vehicles as well as plug-in hybrid and battery electric vehicles.
3.5 Commissioner of the study
This project is funded by the FCH JU within the 7th Framework Programme. Other
involved actors are the city authorities of London and Copenhagen operating the
vehicles, the vehicle and FC producers, as well as the H2 producer companies.
D6.8 – Final environmental impact assessment report
Project no: 29/124 29.10.2015
278727
4 Scope of the Life Cycle Assessment
4.1 Method, assumptions and impact limitations
The LCAs were carried out following ISO 14040 and 14044 [ISO, 2006a, ISO,
2006b]. Two different software packages were used: SimaPro V 8.03.14 using the
Ecoinvent database v 3.1 for the LCAs of the refuelling stations by MATGAS, and
GaBi 6 using the GaBi database Service Pack 27 for the vehicle LCAs by
Fraunhofer.
Due to the use of two software and database systems, an interface between both
parts of the LCA had to be developed. It is important to note that, generally, different
LCA databases can create different environmental impacts. Especially in the case of
AP, POCP and EP (chapter 4.6) results can vary when using different databases.
However, when the GWP is assessed, results vary much less than for the other three
categories.
4.2 Functional unit / Reference flow
The Functional Unit (FU) in a LCA as the basis for comparison allows a physical
measurement of the function provided by the system [Baumann and Tillman 2004].
As proposed by [Lozanovski et al. 2013], in the case of hydrogen production, the
values of purity, pressure and temperature can vary according to the system
evaluated and they should be stated, therefore the functional unit was defined as:
“Dispensing 1 MJ of energetic content (hydrogen) at 25ºC, 350 bar, 99.9995%
purity”. This unit was also selected in order to simplify the comparison with other
fuels, as of petrol, diesel and electricity. Therefore, all inputs and outputs of the LCA
of the refuelling stations are referred to a functional unit of “1 MJ of energetic
content”.
To cover the function of transporting passengers the chosen functional unit for the
vehicle LCA is “1 km of driving operation”. The reference flow depends on the
assessed vehicle type.

D6.8 – Final environmental impact assessment report
Project no: 30/124 29.10.2015
278727
4.3 Multi-functionality
There is no multi-functionality occurring as the vehicles perform only the function of
transporting people.
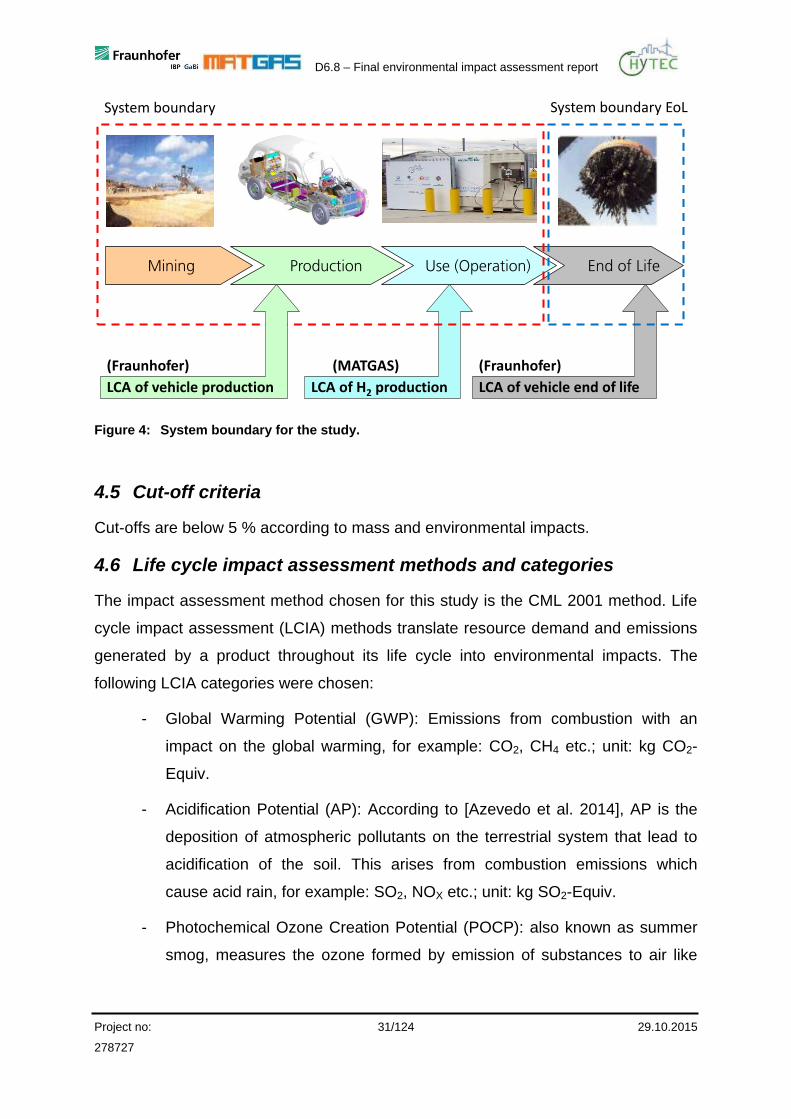
4.4 System boundary
The system boundaries of the present work were defined consistently with the
purpose of the study. The vehicles LCAs include the life cycle stages production, use
phase and end of life. Actual assessments on the environmental impact of the end of
life can only base on estimations due to currently limited available recycling
technologies of FC and batteries. For this reason, the vehicle end of life is assessed
separately from production and use phase and only considering the GWP. The
production of the vehicles includes the upstream processes for the provision of the
used materials and the required energy. The use phase is mainly influenced by the
fuel or electricity consumption and, therefore, by the LCAs of the HRS. The LCAs of
the refuelling stations include: (i) extraction of raw materials, production and transport
of components of machinery, (ii) production and consumption of energy sources, (iii)
transport and delivery of machinery to the customer’s site, (iv) production, transport
and delivery of the fuel and (v) dispensing process. Dismantling the different stations
was assessed but excluded from the boundary, because the impact is under the cut-
off criteria.
Figure 4 shows the defined system boundary.
D6.8 – Final environmental impact assessment report
Project no: 31/124 29.10.2015
278727
Mining Use (Operation) End of LifeProduction
LCA of H2 production
(MATGAS)
System boundary
LCA of vehicle production
(Fraunhofer)
LCA of vehicle end of life
(Fraunhofer)
System boundary EoL
Figure 4: System boundary for the study.
4.5 Cut-off criteria
Cut-offs are below 5 % according to mass and environmental impacts.
4.6 Life cycle impact assessment methods and categories
The impact assessment method chosen for this study is the CML 2001 method. Life
cycle impact assessment (LCIA) methods translate resource demand and emissions
generated by a product throughout its life cycle into environmental impacts. The
following LCIA categories were chosen:
- Global Warming Potential (GWP): Emissions from combustion with an
impact on the global warming, for example: CO2, CH4 etc.; unit: kg CO2-
Equiv.
- Acidification Potential (AP): According to [Azevedo et al. 2014], AP is the
deposition of atmospheric pollutants on the terrestrial system that lead to
acidification of the soil. This arises from combustion emissions which
cause acid rain, for example: SO2, NOX etc.; unit: kg SO2-Equiv.
- Photochemical Ozone Creation Potential (POCP): also known as summer
smog, measures the ozone formed by emission of substances to air like
D6.8 – Final environmental impact assessment report
Project no: 32/124 29.10.2015
278727
Volatile Organic Compounds (VOCs), for example: NOX, HC, CO, SO2 etc.;
unit: kg Ethene-Equiv.
- Eutrophication Potential (EP): measures the contribution of the emissions
to the accumulation of nutrients in the aquatic and terrestrial environment,
responsible for the oxygen depletion, generated by the discharge of treated
or partially treated effluents [Meneses et al., 2010], for example: NOX, N2O,
NH3, phosphate etc.; unit: kg Phosphate-Equiv.
Results are mainly presented and discussed in terms of GWP with less emphasis on
the other three categories (added in the annex).
4.7 Type, quality and sources of required data and information
If possible, the assessments were performed based on primary data from the project
partners. If primary data was not available, calculations were based on literature
research.
Data for the LCAs of the refuelling stations is calculated mainly from primary data
provided by Air Products for SMRs and from Hydrogen Link for the electrolysers. The
data for the electricity is obtained from the government of London and Copenhagen,
and from bibliography for the other stations. The background data of the fuel and
energy supply during the use phase (LCA of refuelling stations) is based on SimaPro
8.03.14 using the Ecoinvent v 3.1 database [PRé Consultants, 2015].
Data for the vehicle LCAs is based on primary data from [Intelligent Energy Ltd.,
2015; The London Taxi Company, 2010]. Hyundai provided limited technology
specifications of the Hyundai ix35, as power rating of the engine, FC power, battery
size and hydrogen storage. Cenex provided measured fuel consumptions of the
operated FC vehicles in the HyTEC project. The secondary data is based on a
literature research. IE developed and produced the fuel cell system of the FC taxi,
provided extensive primary data within a bill of material (BoM). LTI Vehicles provided
a BoM of a conventional taxi as well as detailed information on the parts to be
removed for the FC propulsion modifications. The upstream and background data of
the production and end of life is based on GaBi 6 using the GaBi database Service
Pack 27 [thinkstep AG, 1992-2015].
D6.8 – Final environmental impact assessment report
Project no: 33/124 29.10.2015
278727
4.8 Comparisons between systems
As explained already within the goal of the LCA in chapter 3.1, the environmental
impacts of the FC vehicles are compared to current petrol, diesel and plug-in hybrid
and battery electric vehicles. A secondary focus is set also on the environmental
comparison of the energy supply pathways considering also the impacts of petrol and
diesel refuelling stations as well as electric charging stations.
4.9 Identification of critical review needs
According to ISO 14040 and 14044, a critical review would be mandatory but it is not
in scope in the current project [ISO, 2006a, ISO, 2006b].
D6.8 – Final environmental impact assessment report
Project no: 34/124 29.10.2015
278727
5 Life Cycle Inventory Analysis – London
Results concerning the LCIA for London and Copenhagen are presented in chapters
5 and 6, respectively. In the LCIA the following defined tasks were performed: first,
as a basis for the LCA studies, all required processes during production, operation
and end of life of the refuelling stations (HRS based on SMR and on-site electrolysis
as well as diesel refuelling station) and of the assessed vehicles (FC and diesel taxi)
were identified. Afterwards, the data collection for all life cycle phases was finalised.
Based on the data collection, LCA models for the assessed technologies were
developed to analyse their environmental impacts. The work content for the
described tasks within the life cycle phases is summarized in the following chapters
of this report.
5.1 Refuelling stations
The inventory analysis identifies and quantifies energy, water and materials usage
and environmental releases. The capital goods and the electricity required to build
the stations, as well as the outputs of each process are included in the hydrogen
production pathway.
As a rule for this study, all the data concerning the production and specifications of
the technology under study were requested to the partners, in this case, Air Products
for London and Hydrogen Link for Copenhagen. In addition, a literature research was
conducted for the data which could not be provided by the project partners, in order
to analyse the best choice for every defined process.
HRS, such as the ones used in this project, are dependent on the hydrogen delivery
technology, i.e. the processes needed to produce and transport hydrogen from a
central or semi-central production facility to the final point of use, the storage option
and the hydrogen refuelling of a FC vehicle. A brief explanation of the studied
processes in the HyTEC project is provided below, in order to describe the different
processes and their reference flow included in the LCI (see Table 6). This chapter is
organized following the chronological phases needed to dispense hydrogen in a
HRS, namely:
1. Hydrogen production.
D6.8 – Final environmental impact assessment report
Project no: 35/124 29.10.2015
278727
2. Hydrogen transportation.
3. Hydrogen fuelling stations, including production and operation.
5.1.1 Hydrogen Production
The SMR process can be used to produce hydrogen either centrally or on-site. Air
Products, the partner providing the fuelling station for HyTEC in London, owns and
operates several SMR plants to centrally produce hydrogen with steam and/or power
as by-products. The plant used for this project is located in Rotterdam.
In a hydrogen production process by SMR, the hydrocarbons such as methane from
NG catalytically react with steam at high temperature (700°C-1000°C) and pressure
(3-25 bar) to produce syngas (CO and H2).). The carbon monoxide in the syngas is
further oxidized using steam via water-gas shift reaction to produce carbon dioxide
and hydrogen. The overall SMR and water gas shift reactions are given as:
CH4 + H2O → CO + 3H2 (5.1)
CO + H2O → CO2 + H2 (5.2)
The obtained hydrogen is then purified to remove unreacted hydrocarbons, carbon
monoxide, carbon dioxide and other impurities to obtain the hydrogen product with
the required specifications.
Electricity is used for the production of hydrogen irrespective of the chosen
production technology. It is also used to liquefy or compress the hydrogen for
distribution (when produced centrally) for fuelling the tank of vehicles.
Activities such as producing, liquefying and compressing the hydrogen to be
transported, are expected to happen in Rotterdam; therefore, the electricity mix used
for this part of the study was chosen from the Netherlands. Whereas, compressing
and dispensing the hydrogen takes place in London and, consequently, we have
used the UK electricity mix for this part of the study.
SimaPro processes were used for each power generation source with these
electricity mixes, which allows consideration of the life cycle resource and emission
profile for the power generation till supplied to the point of use.
D6.8 – Final environmental impact assessment report
Project no: 36/124 29.10.2015
278727
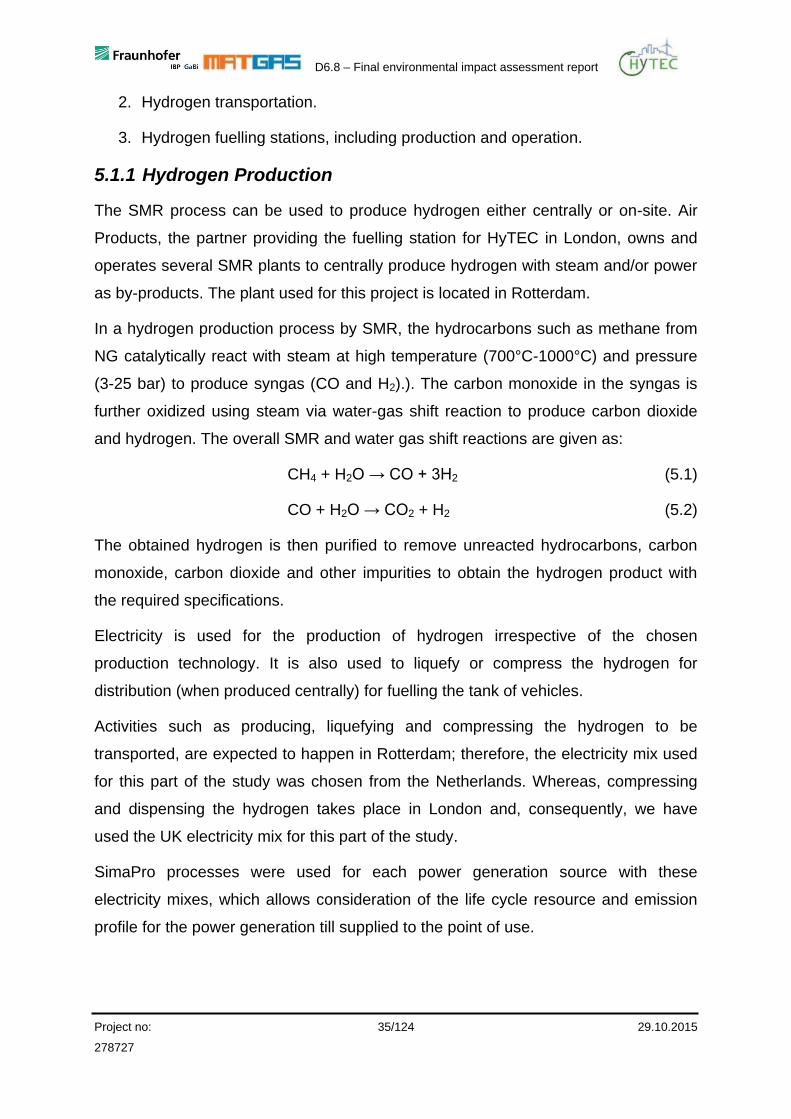
The waste heat from reforming at high temperature and from combustion in the
furnace (to provide energy for reforming) is often used to generate steam in a SMR
process. This steam then is used in the reforming process with excess potentially
sold as by-product or converted to power as by-product. Figure 5 graphically
summarizes this process with a layout of a centralized SMR plant.
Figure 5: Centralized SMR plant layout and process schematic view (courtesy of Air Products).
Similarly, water is one of the primary resources used by each technology. SimaPro
processes for water were used to account for the impacts from water consumption.
The water usage data was obtained from internal operation/design data, knowledge
of the SMR process and literature data. For the SMR technology, water is primarily
used as steam for in-process, steam sold as by-product and steam drum blowdown
losses.
Steam by-product data for the LCA was provided from the operating data at the Air
Products SMRs in Rotterdam. The steam used for in-process was estimated based
on the amount of hydrogen produced assuming 1% hydrogen recycle, 88.5% PSA
recovery and 40wt% of hydrogen being derived from water molecules. The blowdown
losses are estimated using 2.8 Steam-TO-Carbon ratio (STOC) and the steam use
for in-process estimate.
D6.8 – Final environmental impact assessment report
Project no: 37/124 29.10.2015
278727
Process steam = % H2 from water * total H2 produced * (molecular weight of
water/molecular weight of H2)
(5.3)
Blowdown losses = (Steam byproduct + STOC* Process steam) * %Blowdown
(5.4)
Total Make-up water = Steam byproduct + Process steam + Blowdown losses
(5.5)
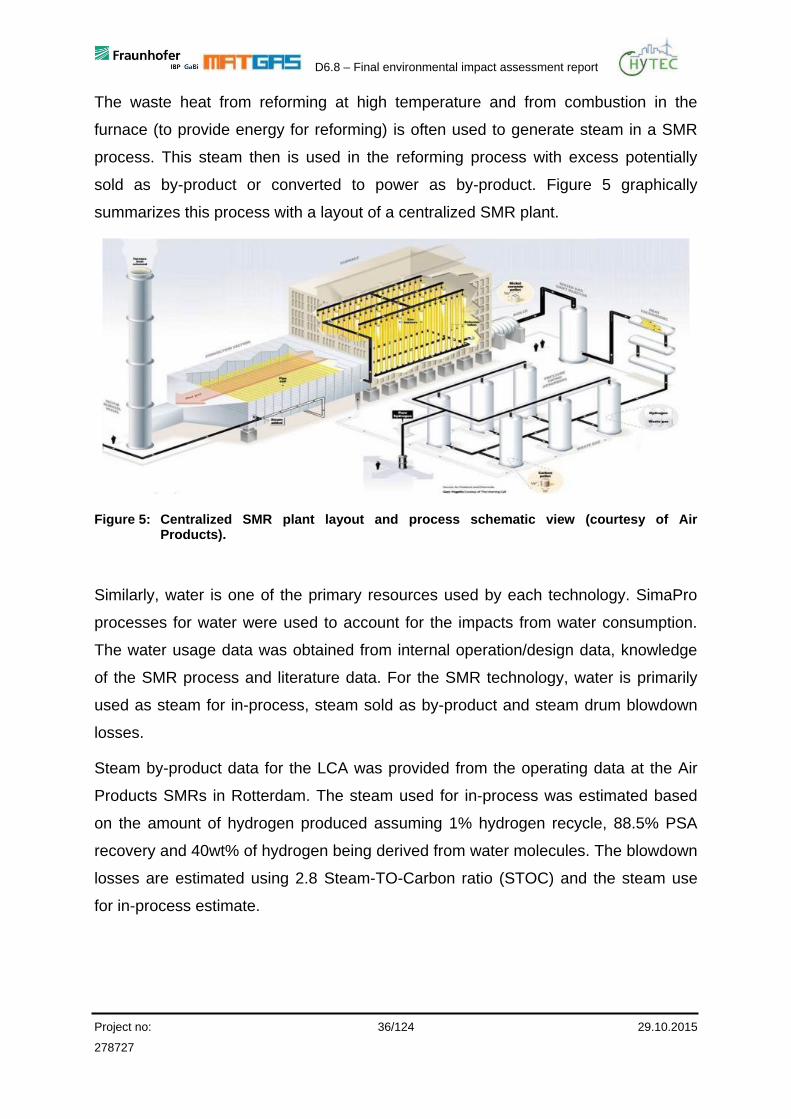
5.1.2 Hydrogen Transportation
The basic hydrogen transport pathway employed in this study involves two steps. In
the first step, hydrogen is transported from Rotterdam in a Hydra truck, with a
capacity of 3.2 tons of liquid hydrogen, (-252 ºC and 600 mbar), by sea. Then, it is
transported to Didcot (UK) and it is transferred, using an internal pump to compress
and introduce it to a High Pressure Tube Trailer (HPTT) carrier, capable of
transporting 875 kg of gaseous hydrogen at 500 bar at 15 ºC (Figure 6).
In this case, Hydra travels to Didcot in UK approximately once a month, fills the
HPTT with compressed hydrogen which is dropped-off at the fuelling station and
used as on-site storage. Delivery includes picking-up an empty trailer and replacing it
with a full trailer. The hydrogen is left at the station that includes a compressor to
boost some of the product to 1000 bar. Vehicles are refuelled combining both 500
and 1000 bar storage banks.
Figure 6: Basic hydrogen transport pathway selected for the LCA study: tube trailer transport of gaseous H2.
D6.8 – Final environmental impact assessment report
Project no: 38/124 29.10.2015
278727
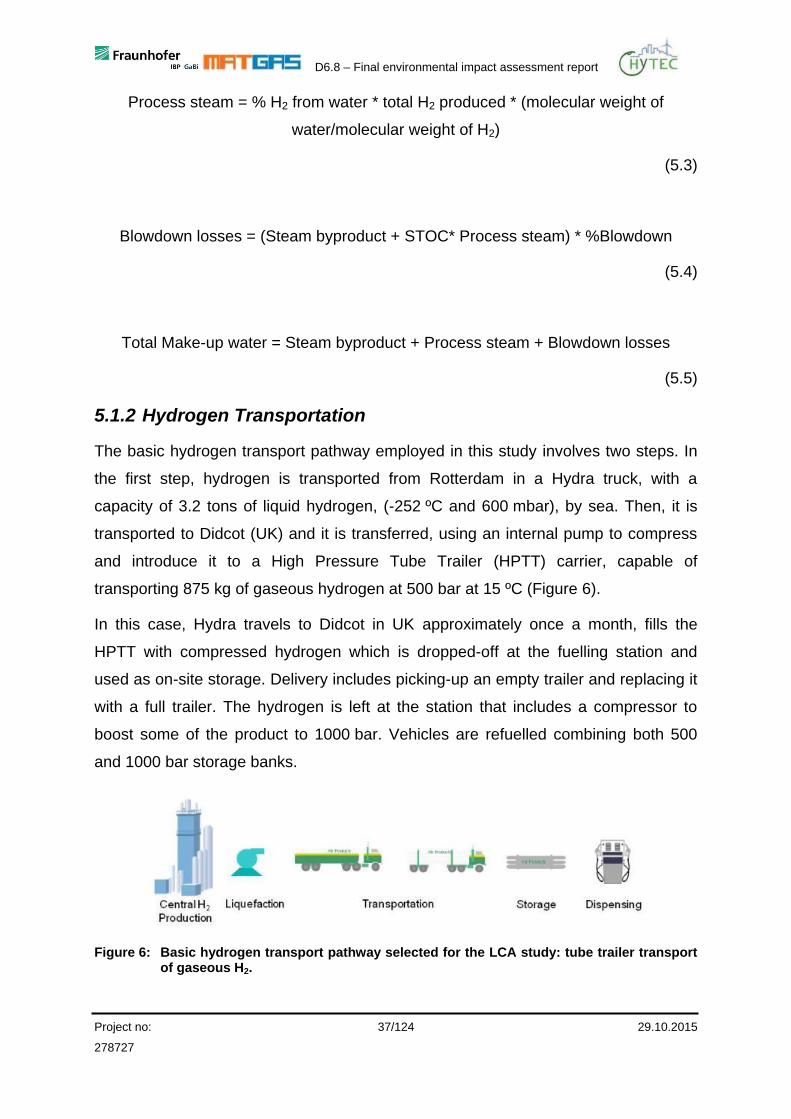
5.1.3 Hydrogen Fuelling Stations
The HRS modelled within this analysis is a new station opened in Heathrow, London
in the framework of the HyTEC project. Unlike other hydrogen stations, this one only
refuels hydrogen and is not designed as an add-on to an existing fossil fuel filling
station.
The fuelling station is composed of different machinery. The most important ones are
the compressor, the dispenser and the storage unit (either in low-pressure vessels or
as components of cascade charging system). For this study, the selected technology
is the Air Products Series 125 fuelling station (see Figure 7).
This HRS offers two different pressure levels for vehicles (i.e. 350 bar for the fuel cell
taxis used in HyTEC and 700 bar for passenger cars). The new standard pressure for
passenger cars was added because it enables the driver to carry more hydrogen in
the car, covering a larger distance with a full tank. The fuelling operation procedures
involve the dispensed gaseous hydrogen, at a dispensing pressure, by means of a
nozzle that is connected to the vehicles.
Figure 7: Heathrow HRS, Air Products Series 125
Source: [Air Products, 2015]
D6.8 – Final environmental impact assessment report
Project no: 39/124 29.10.2015
278727
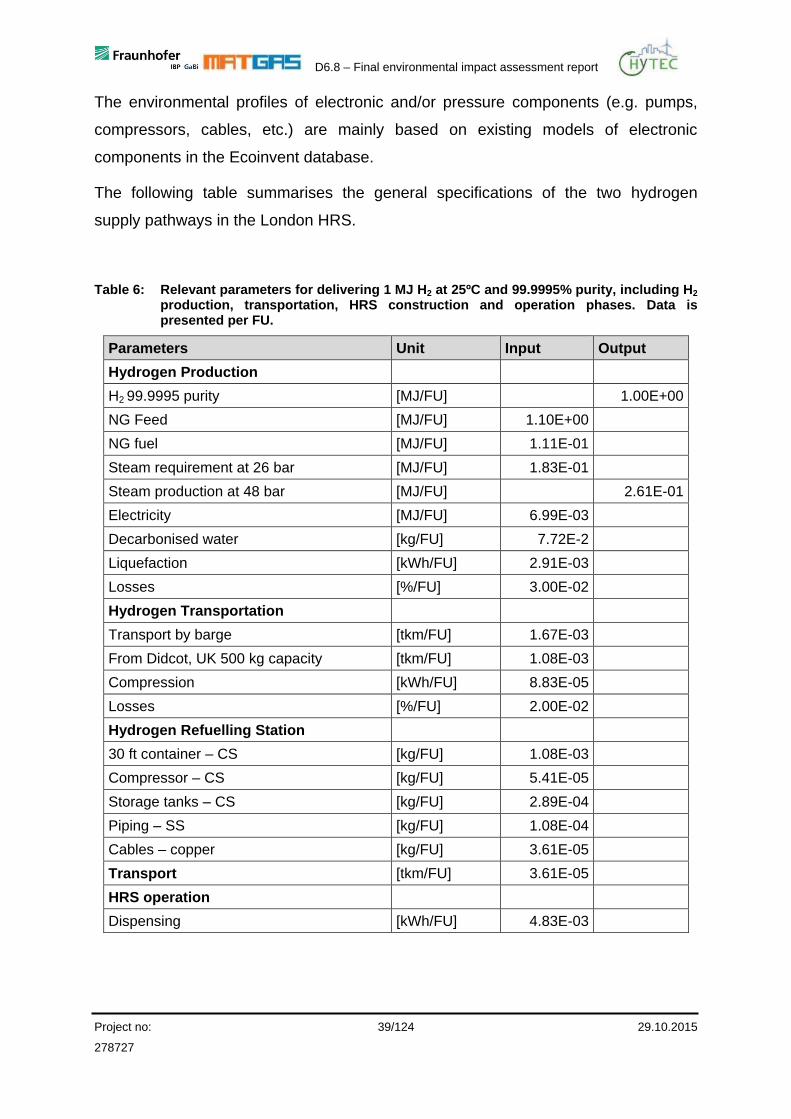
The environmental profiles of electronic and/or pressure components (e.g. pumps,
compressors, cables, etc.) are mainly based on existing models of electronic
components in the Ecoinvent database.
The following table summarises the general specifications of the two hydrogen
supply pathways in the London HRS.
Table 6: Relevant parameters for delivering 1 MJ H2 at 25ºC and 99.9995% purity, including H2 production, transportation, HRS construction and operation phases. Data is presented per FU.
Parameters Unit Input Output
Hydrogen Production
H2 99.9995 purity [MJ/FU]
1.00E+00
NG Feed [MJ/FU] 1.10E+00
NG fuel [MJ/FU] 1.11E-01
Steam requirement at 26 bar [MJ/FU] 1.83E-01
Steam production at 48 bar [MJ/FU]
2.61E-01
Electricity [MJ/FU] 6.99E-03
Decarbonised water [kg/FU] 7.72E-2
Liquefaction [kWh/FU] 2.91E-03
Losses [%/FU] 3.00E-02
Hydrogen Transportation
Transport by barge [tkm/FU] 1.67E-03
From Didcot, UK 500 kg capacity [tkm/FU] 1.08E-03
Compression [kWh/FU] 8.83E-05
Losses [%/FU] 2.00E-02
Hydrogen Refuelling Station
30 ft container – CS [kg/FU] 1.08E-03
Compressor – CS [kg/FU] 5.41E-05
Storage tanks – CS [kg/FU] 2.89E-04
Piping – SS [kg/FU] 1.08E-04
Cables – copper [kg/FU] 3.61E-05
Transport [tkm/FU] 3.61E-05
HRS operation
Dispensing [kWh/FU] 4.83E-03
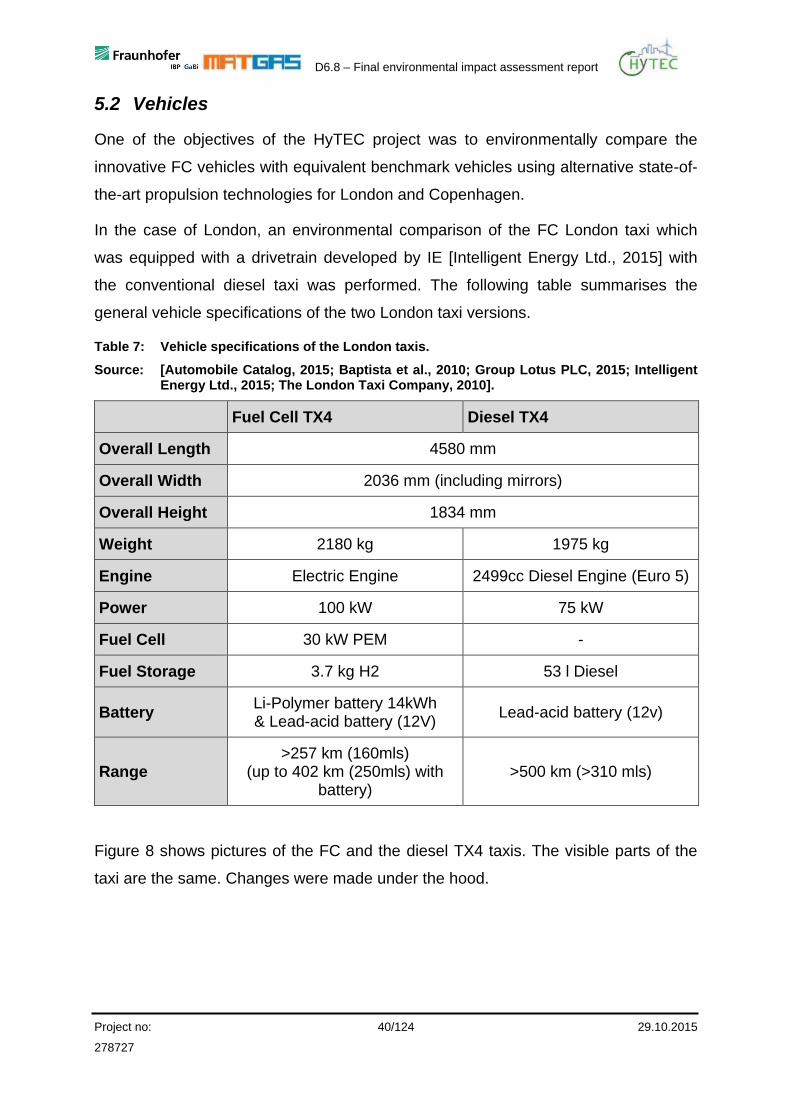
D6.8 – Final environmental impact assessment report
Project no: 40/124 29.10.2015
278727
5.2 Vehicles
One of the objectives of the HyTEC project was to environmentally compare the
innovative FC vehicles with equivalent benchmark vehicles using alternative state-of-
the-art propulsion technologies for London and Copenhagen.
In the case of London, an environmental comparison of the FC London taxi which
was equipped with a drivetrain developed by IE [Intelligent Energy Ltd., 2015] with
the conventional diesel taxi was performed. The following table summarises the
general vehicle specifications of the two London taxi versions.
Table 7: Vehicle specifications of the London taxis.
Source: [Automobile Catalog, 2015; Baptista et al., 2010; Group Lotus PLC, 2015; Intelligent Energy Ltd., 2015; The London Taxi Company, 2010].
Fuel Cell TX4 Diesel TX4
Overall Length 4580 mm
Overall Width 2036 mm (including mirrors)
Overall Height 1834 mm
Weight 2180 kg 1975 kg
Engine Electric Engine 2499cc Diesel Engine (Euro 5)
Power 100 kW 75 kW
Fuel Cell 30 kW PEM -
Fuel Storage 3.7 kg H2 53 l Diesel
Battery Li-Polymer battery 14kWh & Lead-acid battery (12V)
Lead-acid battery (12v)
Range >257 km (160mls)
(up to 402 km (250mls) with battery)
>500 km (>310 mls)
Figure 8 shows pictures of the FC and the diesel TX4 taxis. The visible parts of the
taxi are the same. Changes were made under the hood.
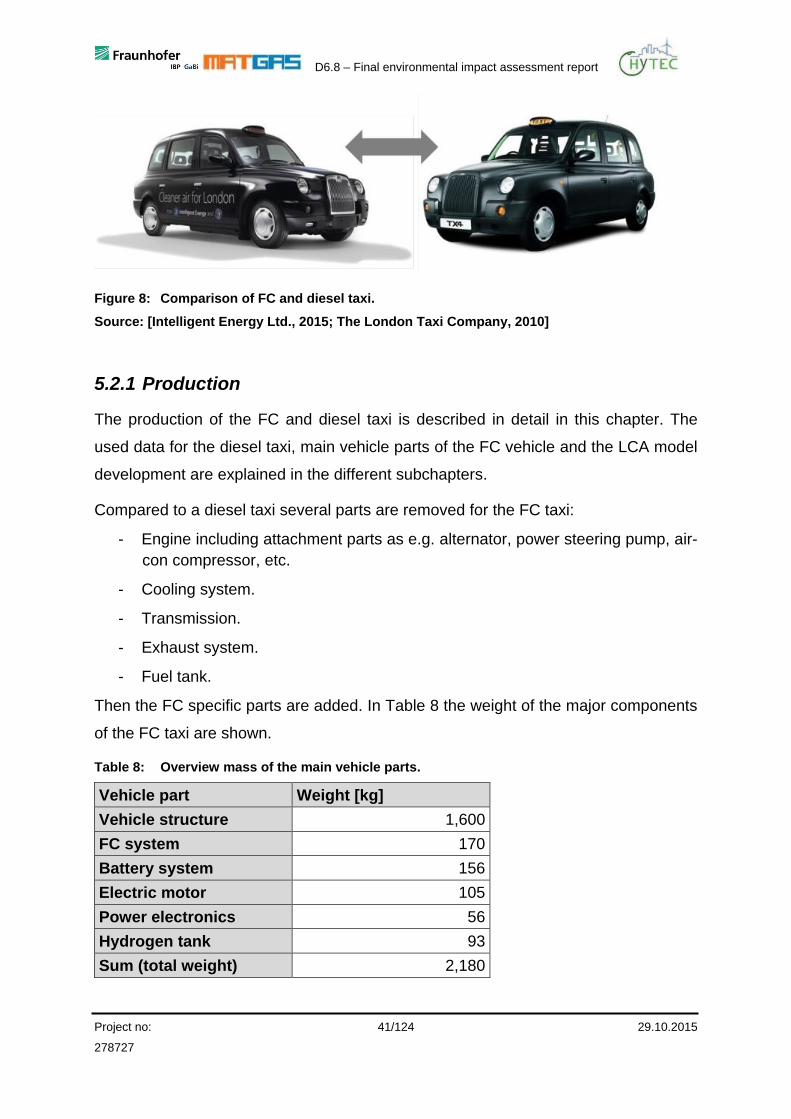
D6.8 – Final environmental impact assessment report
Project no: 41/124 29.10.2015
278727
Figure 8: Comparison of FC and diesel taxi.
Source: [Intelligent Energy Ltd., 2015; The London Taxi Company, 2010]
5.2.1 Production
The production of the FC and diesel taxi is described in detail in this chapter. The
used data for the diesel taxi, main vehicle parts of the FC vehicle and the LCA model
development are explained in the different subchapters.
Compared to a diesel taxi several parts are removed for the FC taxi:
- Engine including attachment parts as e.g. alternator, power steering pump, air-
con compressor, etc.
- Cooling system.
- Transmission.
- Exhaust system.
- Fuel tank.
Then the FC specific parts are added. In Table 8 the weight of the major components
of the FC taxi are shown.
Table 8: Overview mass of the main vehicle parts.
Vehicle part Weight [kg]
Vehicle structure 1,600
FC system 170
Battery system 156
Electric motor 105
Power electronics 56
Hydrogen tank 93
Sum (total weight) 2,180
D6.8 – Final environmental impact assessment report
Project no: 42/124 29.10.2015
278727
The following paragraphs are about the major components in detail, sorted by their
importance and impact on the FC vehicle. The most important processes for the LCA
model of the production phase of the FC vehicles are:
1. Production of the FC system.
2. Production of the vehicle structure.
3. Production of the battery system.
4. Production of the electric motor.
5. Production of the power electronics.
6. Production of the hydrogen tank.
5.2.1.1 Diesel taxi
The environmental profile of the diesel taxi production is based on data for a
standard vehicle structure which are similar for most passenger vehicles. The data
are based on public available “Environmental Certificates” [Daimler AG, 2015] and
“Environmental Commendations” [Volkswagen AG, 2015] of vehicle manufacturers.
Daimler and Volkswagen provide a full LCA for all new models on the market. Hence
this creates a large data basis of conventional vehicles LCAs which can be scaled
according to the diesel taxi structure and mass. This existing data was additionally
enhanced with existing experience and internally available production data.
5.2.1.2 Fuel cell system
The FC system of the taxi is developed and produced by IE [Intelligent Energy Ltd.,
2015]. IE has extensive knowledge of the material demand for producing a FC and
provided a BoM. Figure 9 shows the material mix of the FC system.
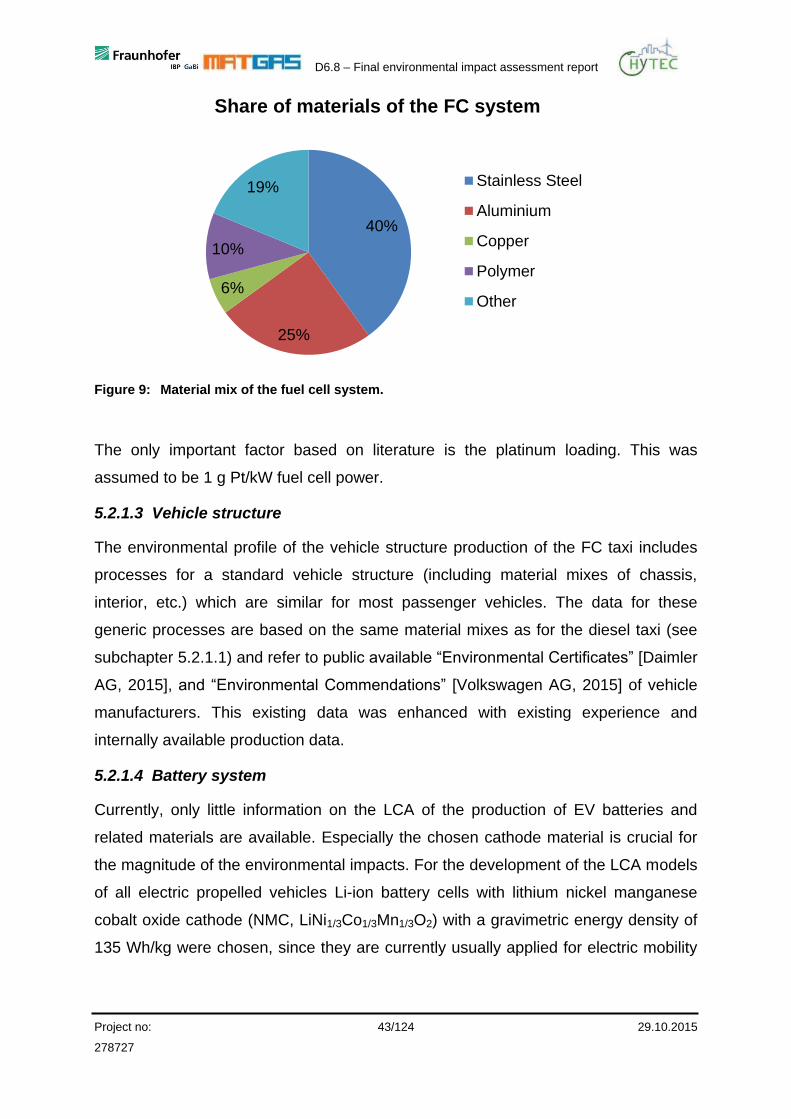
D6.8 – Final environmental impact assessment report
Project no: 43/124 29.10.2015
278727
40%
25%
6%
10%
19%
Share of materials of the FC system
Stainless Steel
Aluminium
Copper
Polymer
Other
Figure 9: Material mix of the fuel cell system.
The only important factor based on literature is the platinum loading. This was
assumed to be 1 g Pt/kW fuel cell power.
5.2.1.3 Vehicle structure
The environmental profile of the vehicle structure production of the FC taxi includes
processes for a standard vehicle structure (including material mixes of chassis,
interior, etc.) which are similar for most passenger vehicles. The data for these
generic processes are based on the same material mixes as for the diesel taxi (see
subchapter 5.2.1.1) and refer to public available “Environmental Certificates” [Daimler
AG, 2015], and “Environmental Commendations” [Volkswagen AG, 2015] of vehicle
manufacturers. This existing data was enhanced with existing experience and
internally available production data.
5.2.1.4 Battery system
Currently, only little information on the LCA of the production of EV batteries and
related materials are available. Especially the chosen cathode material is crucial for
the magnitude of the environmental impacts. For the development of the LCA models
of all electric propelled vehicles Li-ion battery cells with lithium nickel manganese
cobalt oxide cathode (NMC, LiNi1/3Co1/3Mn1/3O2) with a gravimetric energy density of
135 Wh/kg were chosen, since they are currently usually applied for electric mobility

D6.8 – Final environmental impact assessment report
Project no: 44/124 29.10.2015
278727
purposes, e.g. in the Volkswagen e-Golf and BMW i3 [Schäfer, 2009] [Schöttle,
2014].
The total weight of all battery cells is calculated based on the battery capacity of the
FC taxi (see Table 7) and the gravimetric energy density of 135 Wh/kg. Therefore,
the single weights of all other components are based on the difference of the total
battery weight and the total weight of all battery cells. Figure 10 exemplarily shows
the resulting weight distribution of the battery of the FC taxi.
104 kg8 kg
26 kg
18 kg
Weight distribution of the 14kWh battery
Battery cells
Battery management unitand cooling system
Housing
Other mechanical parts
Total weight: 156 kg
Figure 10: Weight distribution of the 14 kWh battery in the FC taxi.
Since the material mix of battery cells with NMC cathode can be very different, an
average material mix for NMC battery cells was determined based on previous
studies on Li-NMC battery cells, e.g. [Anderman, 2012; Gaines et al., 2000; Ishihara
et al., 1999; Gaines et al., 2012] and material safety data sheets (MSDS)
[International Battery Inc., 2010; Kokam Co., 2005]. Table 9 shows the assumed
material mix of the NMC battery cell.
Table 9: Assumed material mix of NMC battery cell.
Component Percent by weight
LiNi1/3Co1/3Mn1/3O2 (cathode) 33%
Aluminium foil (cathode) 8%
Acetylene black (cathode) 1%
Graphite (anode) 18%
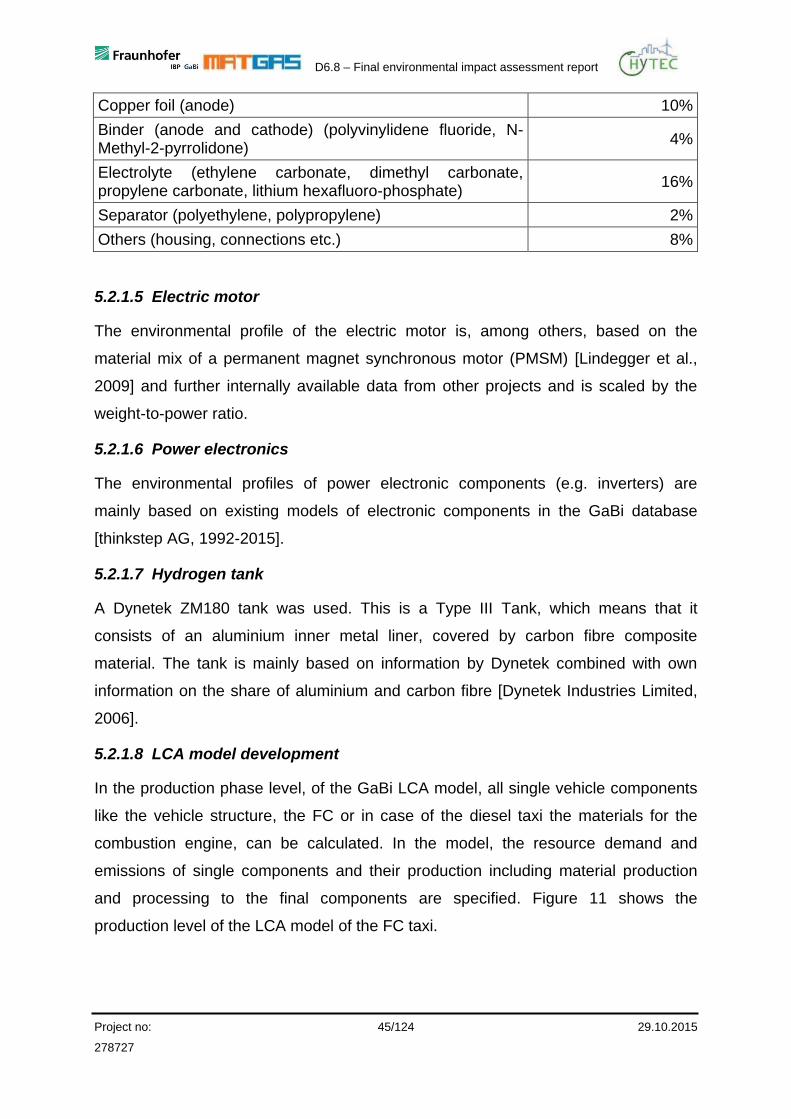
D6.8 – Final environmental impact assessment report
Project no: 45/124 29.10.2015
278727
Copper foil (anode) 10%
Binder (anode and cathode) (polyvinylidene fluoride, N-Methyl-2-pyrrolidone)
4%
Electrolyte (ethylene carbonate, dimethyl carbonate, propylene carbonate, lithium hexafluoro-phosphate)
16%
Separator (polyethylene, polypropylene) 2%
Others (housing, connections etc.) 8%
5.2.1.5 Electric motor
The environmental profile of the electric motor is, among others, based on the
material mix of a permanent magnet synchronous motor (PMSM) [Lindegger et al.,
2009] and further internally available data from other projects and is scaled by the
weight-to-power ratio.
5.2.1.6 Power electronics
The environmental profiles of power electronic components (e.g. inverters) are
mainly based on existing models of electronic components in the GaBi database
[thinkstep AG, 1992-2015].
5.2.1.7 Hydrogen tank
A Dynetek ZM180 tank was used. This is a Type III Tank, which means that it
consists of an aluminium inner metal liner, covered by carbon fibre composite
material. The tank is mainly based on information by Dynetek combined with own
information on the share of aluminium and carbon fibre [Dynetek Industries Limited,
2006].
5.2.1.8 LCA model development
In the production phase level, of the GaBi LCA model, all single vehicle components
like the vehicle structure, the FC or in case of the diesel taxi the materials for the
combustion engine, can be calculated. In the model, the resource demand and
emissions of single components and their production including material production
and processing to the final components are specified. Figure 11 shows the
production level of the LCA model of the FC taxi.
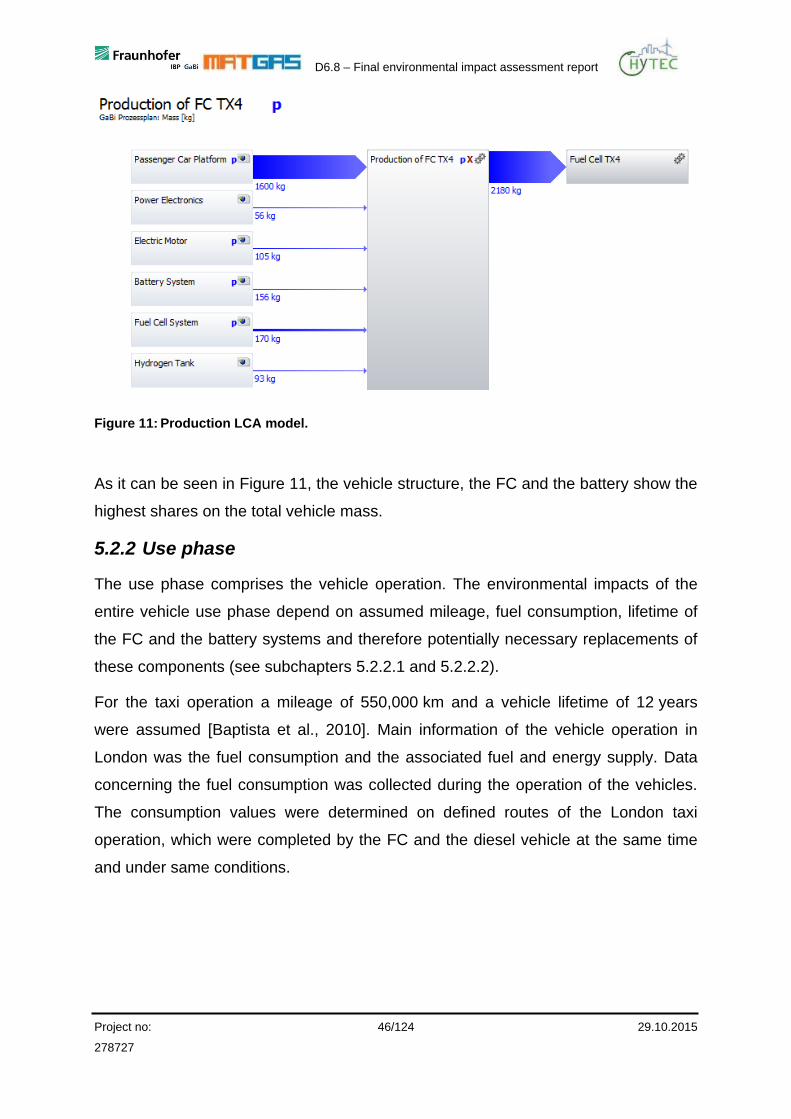
D6.8 – Final environmental impact assessment report
Project no: 46/124 29.10.2015
278727
Figure 11: Production LCA model.
As it can be seen in Figure 11, the vehicle structure, the FC and the battery show the
highest shares on the total vehicle mass.
5.2.2 Use phase
The use phase comprises the vehicle operation. The environmental impacts of the
entire vehicle use phase depend on assumed mileage, fuel consumption, lifetime of
the FC and the battery systems and therefore potentially necessary replacements of
these components (see subchapters 5.2.2.1 and 5.2.2.2).
For the taxi operation a mileage of 550,000 km and a vehicle lifetime of 12 years
were assumed [Baptista et al., 2010]. Main information of the vehicle operation in
London was the fuel consumption and the associated fuel and energy supply. Data
concerning the fuel consumption was collected during the operation of the vehicles.
The consumption values were determined on defined routes of the London taxi
operation, which were completed by the FC and the diesel vehicle at the same time
and under same conditions.
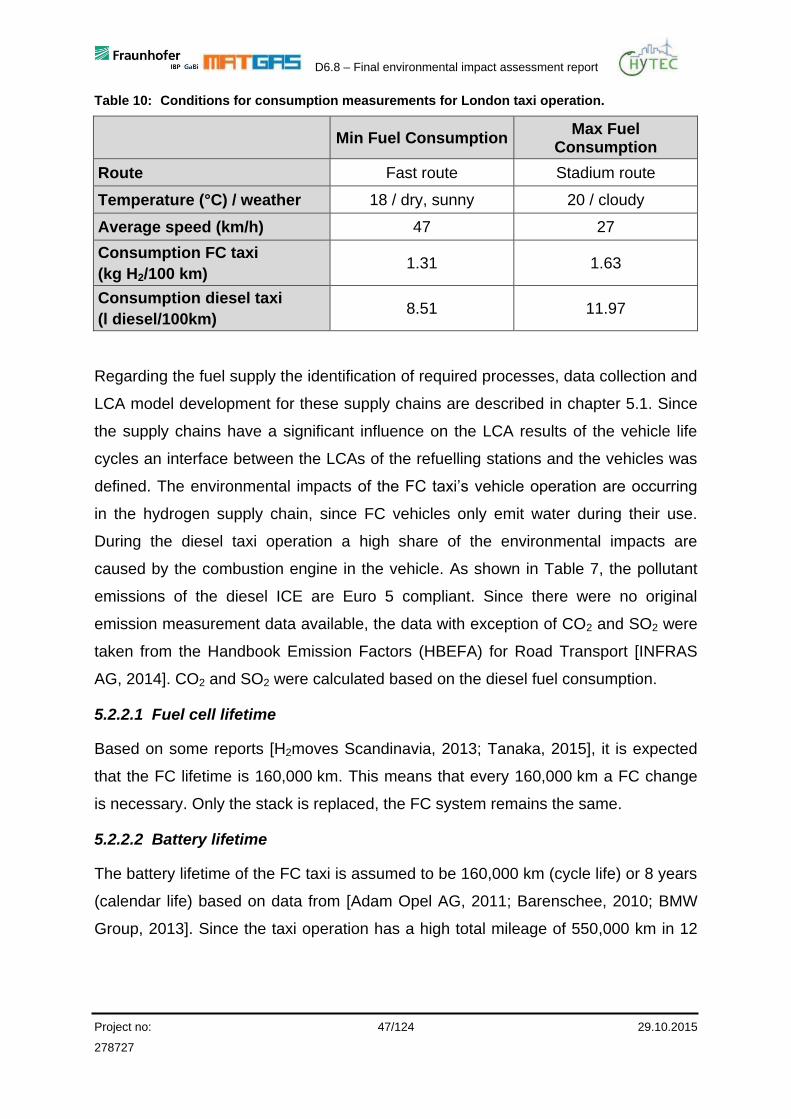
D6.8 – Final environmental impact assessment report
Project no: 47/124 29.10.2015
278727
Table 10: Conditions for consumption measurements for London taxi operation.
Min Fuel Consumption
Max Fuel Consumption
Route Fast route Stadium route
Temperature (°C) / weather 18 / dry, sunny 20 / cloudy
Average speed (km/h) 47 27
Consumption FC taxi
(kg H2/100 km) 1.31 1.63
Consumption diesel taxi
(l diesel/100km) 8.51 11.97
Regarding the fuel supply the identification of required processes, data collection and
LCA model development for these supply chains are described in chapter 5.1. Since
the supply chains have a significant influence on the LCA results of the vehicle life
cycles an interface between the LCAs of the refuelling stations and the vehicles was
defined. The environmental impacts of the FC taxi’s vehicle operation are occurring
in the hydrogen supply chain, since FC vehicles only emit water during their use.
During the diesel taxi operation a high share of the environmental impacts are
caused by the combustion engine in the vehicle. As shown in Table 7, the pollutant
emissions of the diesel ICE are Euro 5 compliant. Since there were no original
emission measurement data available, the data with exception of CO2 and SO2 were
taken from the Handbook Emission Factors (HBEFA) for Road Transport [INFRAS
AG, 2014]. CO2 and SO2 were calculated based on the diesel fuel consumption.
5.2.2.1 Fuel cell lifetime
Based on some reports [H2moves Scandinavia, 2013; Tanaka, 2015], it is expected
that the FC lifetime is 160,000 km. This means that every 160,000 km a FC change
is necessary. Only the stack is replaced, the FC system remains the same.
5.2.2.2 Battery lifetime
The battery lifetime of the FC taxi is assumed to be 160,000 km (cycle life) or 8 years
(calendar life) based on data from [Adam Opel AG, 2011; Barenschee, 2010; BMW
Group, 2013]. Since the taxi operation has a high total mileage of 550,000 km in 12
D6.8 – Final environmental impact assessment report
Project no: 48/124 29.10.2015
278727
years, the cycle life is the reached earlier than the calendar life. For this reason a
battery system exchange every 160,000 km is necessary.
5.2.2.3 LCA model development
In the use phase, vehicle mileage, fuel consumption, fuel cell and battery lifetime and
the emissions from the diesel combustion engine need to be part of the vehicle LCA
models. The use phase of the LCA models was designed flexible to be able to vary
fuel consumption values and mileages during the vehicle operation.
5.2.3 End of life
For the assessment of the end of life of the vehicles all in- and outgoing material and
energy flows for the recycling and disposal of the vehicles are considered.
The environmental benefit of energy or material recycling is considered by credits
which quantify the avoided environmental impacts (e.g. by the substitution of primary
materials). A precondition for applying environmental credits is that the recycling
material can be used for the production of the same product and shows the same
quality like the substituted primary product. Credits for the energy recycling (e.g.
combustion of plastics in a waste incineration plant) are calculated based on the
substituted energy production rates.
The assessment of the vehicles is performed according to EU Directive 2000/53/EC
in which is determined that “the reuse and recovery have to be minimum 85 % by an
average weight per vehicle” [European Community, 2000]. This has to be applied for
all vehicles registered after January the 1st, 2006. In addition, the recycling of battery
systems is regulated by the EU Directive 2006/66/EC on batteries and accumulators
and waste batteries and accumulators [European Community, 2006]. The current
models of the end of life of electric propelled vehicles and their components can only
be based on estimations due to the currently insufficient available data.
An important process for the end of life LCA model of both the FC and diesel vehicle
is the end of life of the vehicle structure (and conventional components). Moreover,
further end of life processes need to be considered for the FC taxi:
1. End of life of the FC system.
2. End of life of the battery system.
D6.8 – Final environmental impact assessment report
Project no: 49/124 29.10.2015
278727
3. End of life of the electric motor.
4. End of life of the power electronics.
5. End of life of the hydrogen tank.
5.2.3.1 Vehicle structure (and conventional components)
Following on the removal of dangerous substances and operating materials as well
as the drainage of the vehicle, the disassembly of the vehicle and the components is
conducted. Components which can’t be disassembled are shredded and segregated
in fractions during the following sorting processes. The goal is to achieve an unmixed
segregation of materials to either return them to the material pool or recycle them
alternatively (e.g. an energy recycling of plastic materials).
5.2.3.2 Fuel cell
The platinum is recycled, assuming similar recycling processes like for other precious
metals. Efforts for the recovery and losses during recycling are calculated. About
98% of the platinum is assumed to be recovered for possible reuse.
5.2.3.3 Battery system
Depending on the state and degradation of performance of the battery system, there
are different options available for the treatment, which however can’t be assessed
today, since it is currently not clear which recycling strategies for battery systems will
be performed in future.
In order to take into account the battery recycling for LCA, an estimation based on
published data of the Lithorec project was considered [Buchert et al., 2011]. Since
the applied inventory data are only available aggregated, the LCA results of the
following recycling strategy for battery systems, shown later on in this report, have to
be regarded as provisional and may change as future recycling strategies are
developed. The recycling method according to [Buchert et al., 2011] includes the
following recycling steps:
- Discharging of the battery system.
- Disassembly of battery system and modules.
- Disassembly of battery cells.
D6.8 – Final environmental impact assessment report
Project no: 50/124 29.10.2015
278727
- Hydrometallurgical processing.
5.2.3.4 Electric motor
The electric motor is almost wear-free and can be reused after a technical test and, if
necessary, a regeneration. If regeneration is not applicable the magnets are removed
and passed on to a recycling process to recover the rare earth materials. Residual
components are recycled depending on their materials.
5.2.3.5 Power electronics
For the recycling and disposal of power electronic components the recycling and
disposal processes of electronic scrap is applied. The following processing steps are
considered:
- Manual disassembly of the electronic product.
- Material specific recycling of metal components.
- Thermal recycling of plastic components.
- Disassembly and recycling of equipped circuit board.
- Shredding of circuit board.
- Recycling of shredded circuit boards, recovery of precious metals.
- Disposal of inert waste.
5.2.3.6 Hydrogen tank
The hydrogen tank mainly consists of aluminium and carbon fibre composite
material. The aluminium recycling is state-of-the-art technology [European Aluminium
Association, 2013].
Regarding the carbon fibre composite material, thermal recycling in a waste
incineration plant is chosen. There is a credit from the local grid mix given for the
recovered energy.
5.2.3.7 LCA model development
Referring to the explanations at the beginning of chapter 5.2.3, it has to be stated
that the quality of results of the developed end of life part of the LCA models is lower
than for production and use phase. As described before, estimations were made,
D6.8 – Final environmental impact assessment report
Project no: 51/124 29.10.2015
278727
since it is currently not clear which recycling strategies for components of electric
drivetrains will be established. For this reason, the later following results of end of life
will be shown separately to the production and use phase results which will be shown
together in the same graphs.
The end of life phase level of the GaBi LCA models is connected to the production
level of the LCA models through parameters. Changes of material mix and
component selection are automatically transferred to the end of life phase level of the
LCA models.
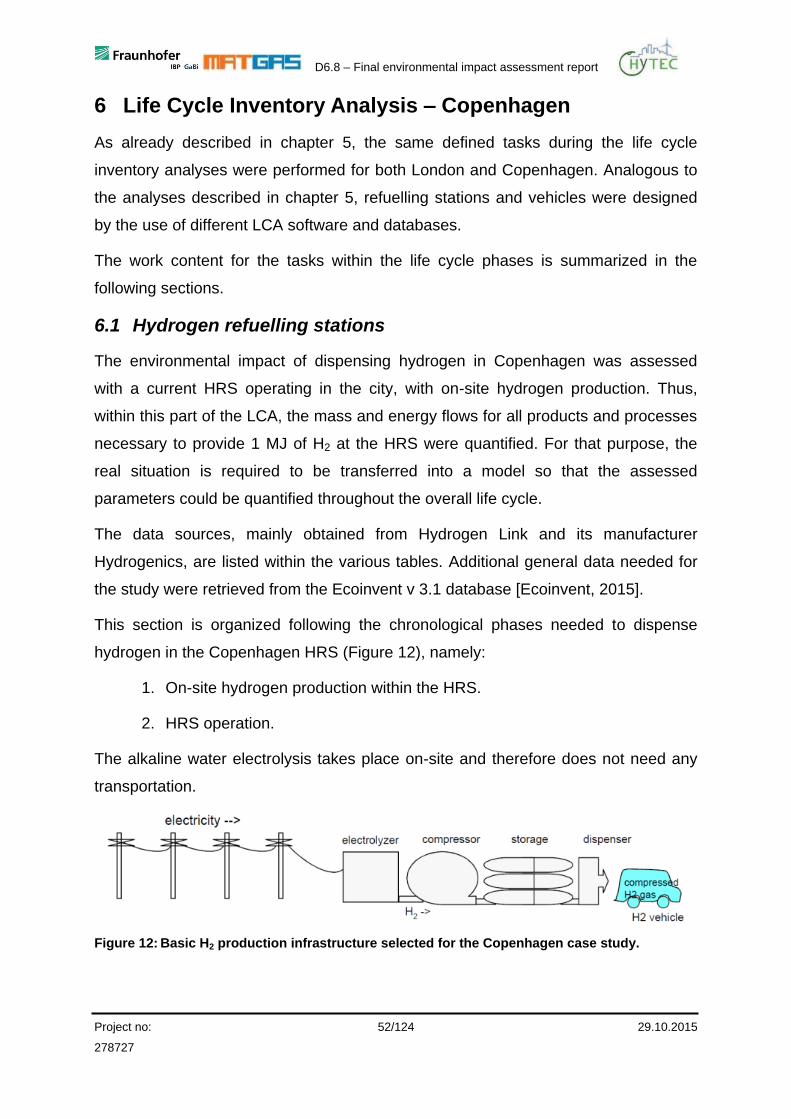
D6.8 – Final environmental impact assessment report
Project no: 52/124 29.10.2015
278727
6 Life Cycle Inventory Analysis – Copenhagen
As already described in chapter 5, the same defined tasks during the life cycle
inventory analyses were performed for both London and Copenhagen. Analogous to
the analyses described in chapter 5, refuelling stations and vehicles were designed
by the use of different LCA software and databases.
The work content for the tasks within the life cycle phases is summarized in the
following sections.
6.1 Hydrogen refuelling stations
The environmental impact of dispensing hydrogen in Copenhagen was assessed
with a current HRS operating in the city, with on-site hydrogen production. Thus,
within this part of the LCA, the mass and energy flows for all products and processes
necessary to provide 1 MJ of H2 at the HRS were quantified. For that purpose, the
real situation is required to be transferred into a model so that the assessed
parameters could be quantified throughout the overall life cycle.
The data sources, mainly obtained from Hydrogen Link and its manufacturer
Hydrogenics, are listed within the various tables. Additional general data needed for
the study were retrieved from the Ecoinvent v 3.1 database [Ecoinvent, 2015].
This section is organized following the chronological phases needed to dispense
hydrogen in the Copenhagen HRS (Figure 12), namely:
1. On-site hydrogen production within the HRS.
2. HRS operation.
The alkaline water electrolysis takes place on-site and therefore does not need any
transportation.
Figure 12: Basic H2 production infrastructure selected for the Copenhagen case study.
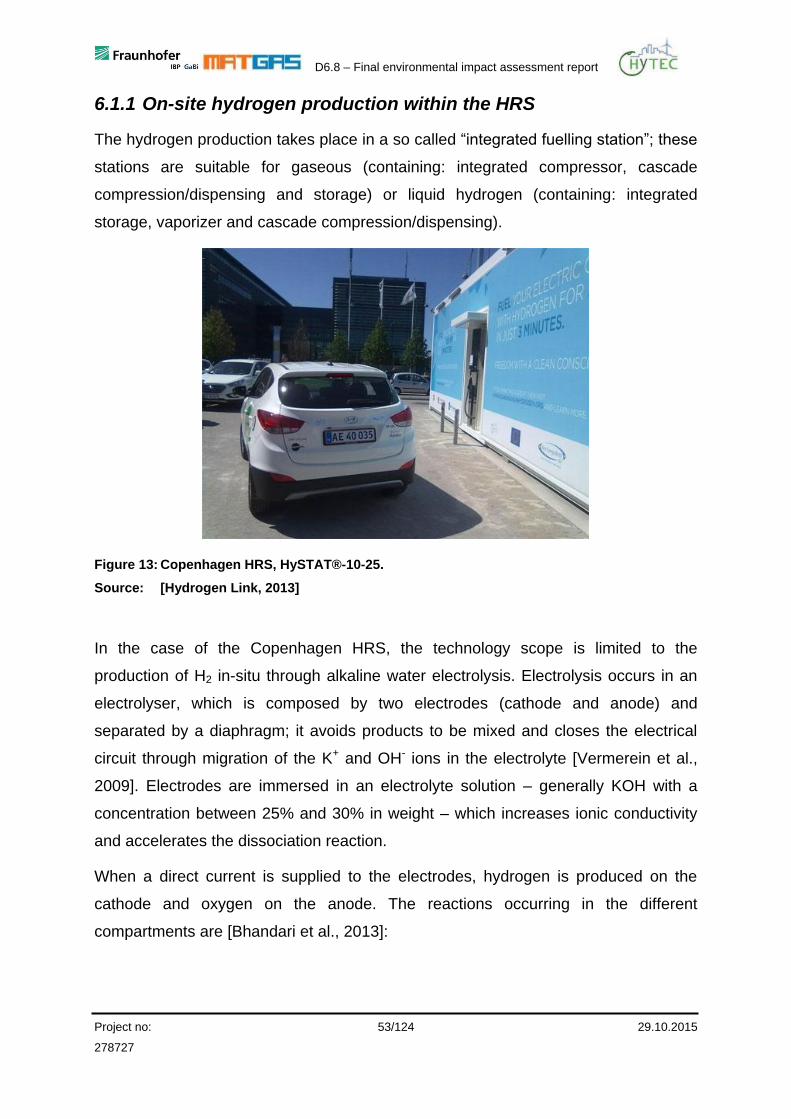
D6.8 – Final environmental impact assessment report
Project no: 53/124 29.10.2015
278727
6.1.1 On-site hydrogen production within the HRS
The hydrogen production takes place in a so called “integrated fuelling station”; these
stations are suitable for gaseous (containing: integrated compressor, cascade
compression/dispensing and storage) or liquid hydrogen (containing: integrated
storage, vaporizer and cascade compression/dispensing).
Figure 13: Copenhagen HRS, HySTAT®-10-25.
Source: [Hydrogen Link, 2013]
In the case of the Copenhagen HRS, the technology scope is limited to the
production of H2 in-situ through alkaline water electrolysis. Electrolysis occurs in an
electrolyser, which is composed by two electrodes (cathode and anode) and
separated by a diaphragm; it avoids products to be mixed and closes the electrical
circuit through migration of the K+ and OH- ions in the electrolyte [Vermerein et al.,
2009]. Electrodes are immersed in an electrolyte solution – generally KOH with a
concentration between 25% and 30% in weight – which increases ionic conductivity
and accelerates the dissociation reaction.
When a direct current is supplied to the electrodes, hydrogen is produced on the
cathode and oxygen on the anode. The reactions occurring in the different
compartments are [Bhandari et al., 2013]:
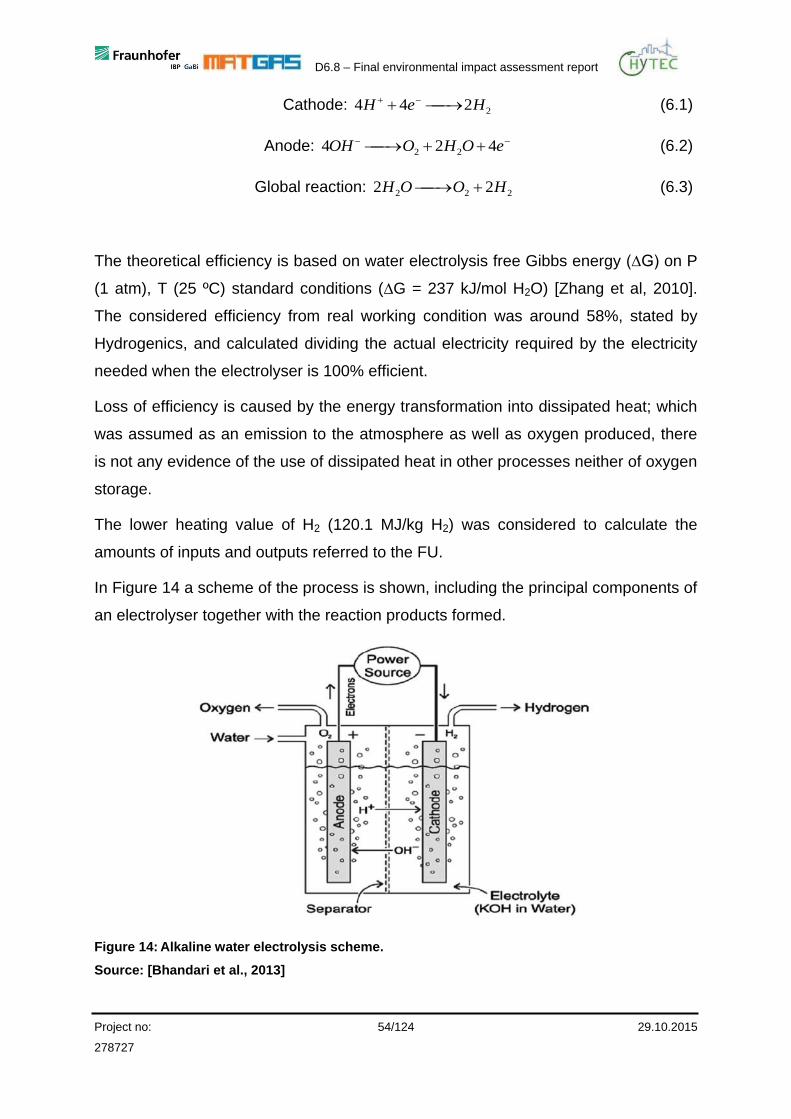
D6.8 – Final environmental impact assessment report
Project no: 54/124 29.10.2015
278727
Cathode: 2244 HeH (6.1)
Anode: eOHOOH 424 22 (6.2)
Global reaction: 222 22 HOOH (6.3)
The theoretical efficiency is based on water electrolysis free Gibbs energy (∆G) on P
(1 atm), T (25 ºC) standard conditions (∆G = 237 kJ/mol H2O) [Zhang et al, 2010].
The considered efficiency from real working condition was around 58%, stated by
Hydrogenics, and calculated dividing the actual electricity required by the electricity
needed when the electrolyser is 100% efficient.
Loss of efficiency is caused by the energy transformation into dissipated heat; which
was assumed as an emission to the atmosphere as well as oxygen produced, there
is not any evidence of the use of dissipated heat in other processes neither of oxygen
storage.
The lower heating value of H2 (120.1 MJ/kg H2) was considered to calculate the
amounts of inputs and outputs referred to the FU.
In Figure 14 a scheme of the process is shown, including the principal components of
an electrolyser together with the reaction products formed.
Figure 14: Alkaline water electrolysis scheme.
Source: [Bhandari et al., 2013]
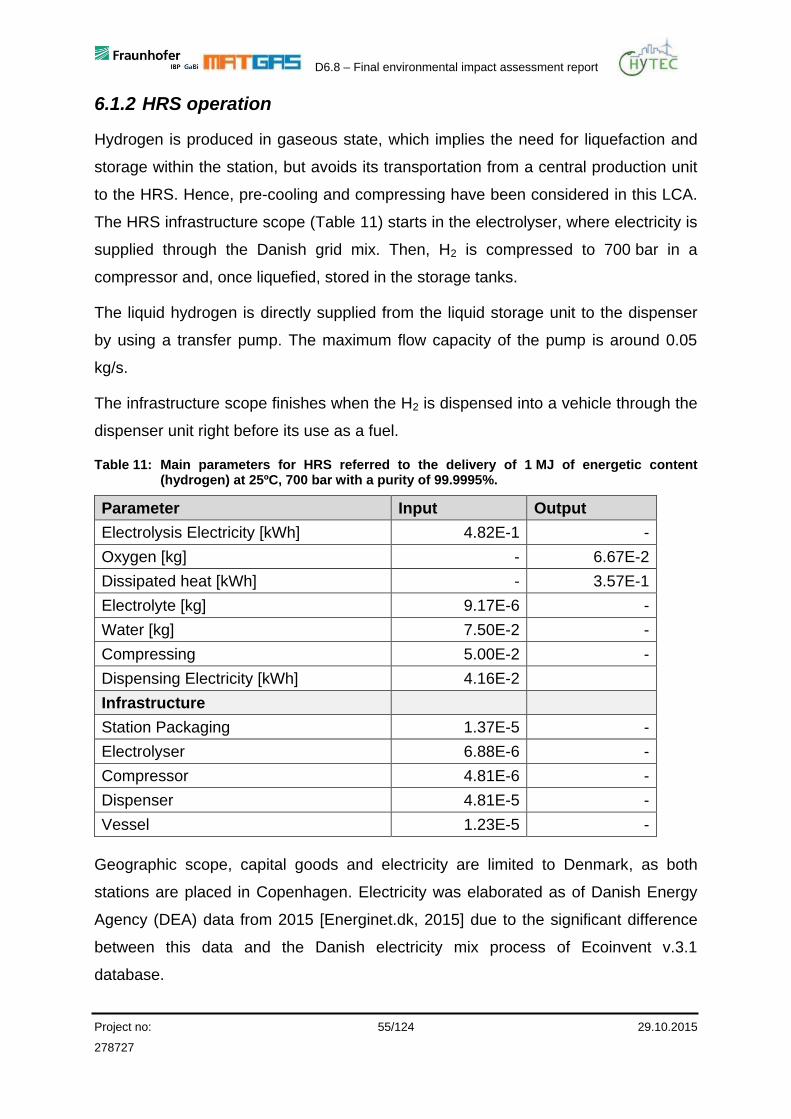
D6.8 – Final environmental impact assessment report
Project no: 55/124 29.10.2015
278727
6.1.2 HRS operation
Hydrogen is produced in gaseous state, which implies the need for liquefaction and
storage within the station, but avoids its transportation from a central production unit
to the HRS. Hence, pre-cooling and compressing have been considered in this LCA.
The HRS infrastructure scope (Table 11) starts in the electrolyser, where electricity is
supplied through the Danish grid mix. Then, H2 is compressed to 700 bar in a
compressor and, once liquefied, stored in the storage tanks.
The liquid hydrogen is directly supplied from the liquid storage unit to the dispenser
by using a transfer pump. The maximum flow capacity of the pump is around 0.05
kg/s.
The infrastructure scope finishes when the H2 is dispensed into a vehicle through the
dispenser unit right before its use as a fuel.
Table 11: Main parameters for HRS referred to the delivery of 1 MJ of energetic content (hydrogen) at 25ºC, 700 bar with a purity of 99.9995%.
Parameter Input Output
Electrolysis Electricity [kWh] 4.82E-1 -
Oxygen [kg] - 6.67E-2
Dissipated heat [kWh] - 3.57E-1
Electrolyte [kg] 9.17E-6 -
Water [kg] 7.50E-2 -
Compressing 5.00E-2 -
Dispensing Electricity [kWh] 4.16E-2
Infrastructure
Station Packaging 1.37E-5 -
Electrolyser 6.88E-6 -
Compressor 4.81E-6 -
Dispenser 4.81E-5 -
Vessel 1.23E-5 -
Geographic scope, capital goods and electricity are limited to Denmark, as both
stations are placed in Copenhagen. Electricity was elaborated as of Danish Energy
Agency (DEA) data from 2015 [Energinet.dk, 2015] due to the significant difference
between this data and the Danish electricity mix process of Ecoinvent v.3.1
database.
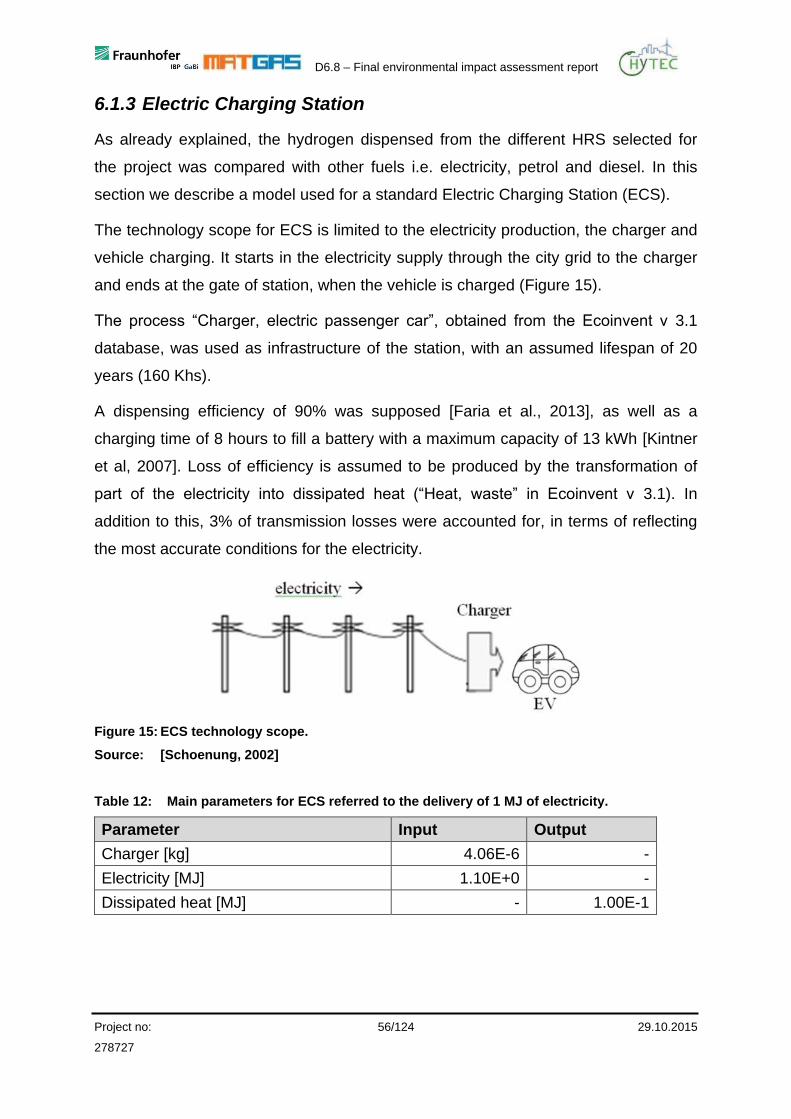
D6.8 – Final environmental impact assessment report
Project no: 56/124 29.10.2015
278727
6.1.3 Electric Charging Station
As already explained, the hydrogen dispensed from the different HRS selected for
the project was compared with other fuels i.e. electricity, petrol and diesel. In this
section we describe a model used for a standard Electric Charging Station (ECS).
The technology scope for ECS is limited to the electricity production, the charger and
vehicle charging. It starts in the electricity supply through the city grid to the charger
and ends at the gate of station, when the vehicle is charged (Figure 15).
The process “Charger, electric passenger car”, obtained from the Ecoinvent v 3.1
database, was used as infrastructure of the station, with an assumed lifespan of 20
years (160 Khs).
A dispensing efficiency of 90% was supposed [Faria et al., 2013], as well as a
charging time of 8 hours to fill a battery with a maximum capacity of 13 kWh [Kintner
et al, 2007]. Loss of efficiency is assumed to be produced by the transformation of
part of the electricity into dissipated heat (“Heat, waste” in Ecoinvent v 3.1). In
addition to this, 3% of transmission losses were accounted for, in terms of reflecting
the most accurate conditions for the electricity.
Figure 15: ECS technology scope.
Source: [Schoenung, 2002]
Table 12: Main parameters for ECS referred to the delivery of 1 MJ of electricity.
Parameter Input Output
Charger [kg] 4.06E-6 -
Electricity [MJ] 1.10E+0 -
Dissipated heat [MJ] - 1.00E-1
D6.8 – Final environmental impact assessment report
Project no: 57/124 29.10.2015
278727
The electricity used in electrolysis and dispensing steps in the HRS, as well as in the
ECS, comes from a mix of different energy sources used in Denmark, known as
Danish electricity mix [Energinet.dk, 2015].
6.1.4 Electricity mixes
Since independently of the source, hydrogen production requires electricity and the
ECS’s environmental impact is also directly related to the electricity generation
sources, several scenarios for the actual and future Danish grid mix were considered
in this work, based on the renewable (RE), nuclear and fossil fuel shares.
The electricity mix generally dominates the use phase of BEV and FCV and its
overall impacts. However, for an electricity mix with a large contribution from REs, the
production of the car could lead the impact. Therefore, in order to evaluate this
influence, several scenarios of electricity used in this project, were based on actual
data from 2014, since it was the most recent available data. The sum of national
production and imports from other countries were not taken into account.
The process “Electricity, high voltage {DK}, market” was used as a basis, modifying
the fractions of every source in the Ecoinvent v 3.1 dataset.
The share of the different energy sources used to produce electricity in Denmark in
the different scenarios “Base Case: 2014”, “Case 1: Only Renewables – certified
(RE)” and “Case 2: Go green” are shown in Table 13.
Table 13: Share of energy sources in Danish electricity mix according to the three scenarios studied.
Energy Source [%] 2014 RE (Certified) Go green
Fossil Energy Sources
Oil 0.41 - 0.00
Natural Gas 7.14 - 0.00
Coal 32.95 - 0.00
Waste incineration 4.70 - 0.00
Renewable Energy
Solar 1.95 3.17 2.94
Wind offshore 1-3 MW 16.87 26.71 18.92
D6.8 – Final environmental impact assessment report
Project no: 58/124 29.10.2015
278727
Energy Source [%] 2014 RE (Certified) Go green
Wind offshore 1-3 MW 25.84 41.58 44.15
Hydro/run-of-river 0.05 0.09 0.4
Biogas co-generation 10.05 19.77 29.9
Waste incineration 0.00 8.66 2.8
6.2 Vehicles
For Copenhagen an environmental comparison of compact passenger cars with
different drivetrains is performed. In Copenhagen 15 Hyundai ix35 FCVs were
operated. Literature data available was retrieved from specific sources, in order to
define overall vehicle specifications (Table 14). Since there was only little primary
data on FC specific vehicle components available, most of the data used is based on
literature. Hence, for vehicle comparisons further in the report the generic term “SUV
FC” is used. An overview of the FC, petrol and diesel vehicles is given in the
following table. The background data for the values for car production and operation
are explained in detail in the subchapters 6.2.1 and 6.2.2.
Table 14: Vehicle specifications of the FC, petrol and diesel compact SUV.
Sources: [Hyundai Motor Deutschland GmbH, 2013a; Hyundai Motor Deutschland GmbH, 2013b].
Hyundai ix35 FC
(SUV FC)
Hyundai ix35 1.6 2WD
(SUV petrol)
Hyundai ix35 2.0 CRDi
(SUV diesel)
Weight [kg] 1850 1380 1533
Engine Electric motor 1591cc Petrol engine
(Euro 5) 1995cc Diesel engine
(Euro 5)
Power [kW] 100 99 100
Fuel Storage 5.6 kg H2 58 l Petrol 58 l Diesel
Battery Li-Polymer battery 1.4 kWh & Lead-
acid battery Lead-acid battery Lead-acid battery
Battery life 8 years
(160,000 km) - -
Range NEDC 594 km >800 km >900 km
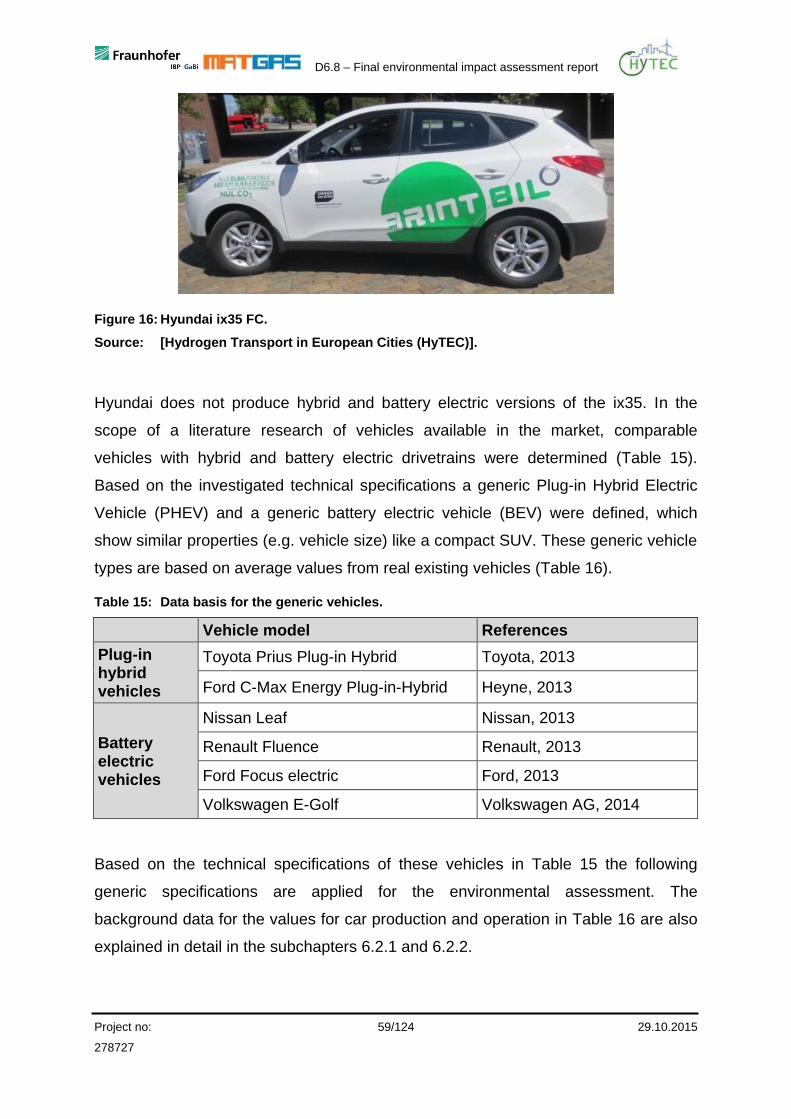
D6.8 – Final environmental impact assessment report
Project no: 59/124 29.10.2015
278727
Figure 16: Hyundai ix35 FC.
Source: [Hydrogen Transport in European Cities (HyTEC)].
Hyundai does not produce hybrid and battery electric versions of the ix35. In the
scope of a literature research of vehicles available in the market, comparable
vehicles with hybrid and battery electric drivetrains were determined (Table 15).
Based on the investigated technical specifications a generic Plug-in Hybrid Electric
Vehicle (PHEV) and a generic battery electric vehicle (BEV) were defined, which
show similar properties (e.g. vehicle size) like a compact SUV. These generic vehicle
types are based on average values from real existing vehicles (Table 16).
Table 15: Data basis for the generic vehicles.
Vehicle model References
Plug-in hybrid vehicles
Toyota Prius Plug-in Hybrid Toyota, 2013
Ford C-Max Energy Plug-in-Hybrid Heyne, 2013
Battery electric vehicles
Nissan Leaf Nissan, 2013
Renault Fluence Renault, 2013
Ford Focus electric Ford, 2013
Volkswagen E-Golf Volkswagen AG, 2014
Based on the technical specifications of these vehicles in Table 15 the following
generic specifications are applied for the environmental assessment. The
background data for the values for car production and operation in Table 16 are also
explained in detail in the subchapters 6.2.1 and 6.2.2.
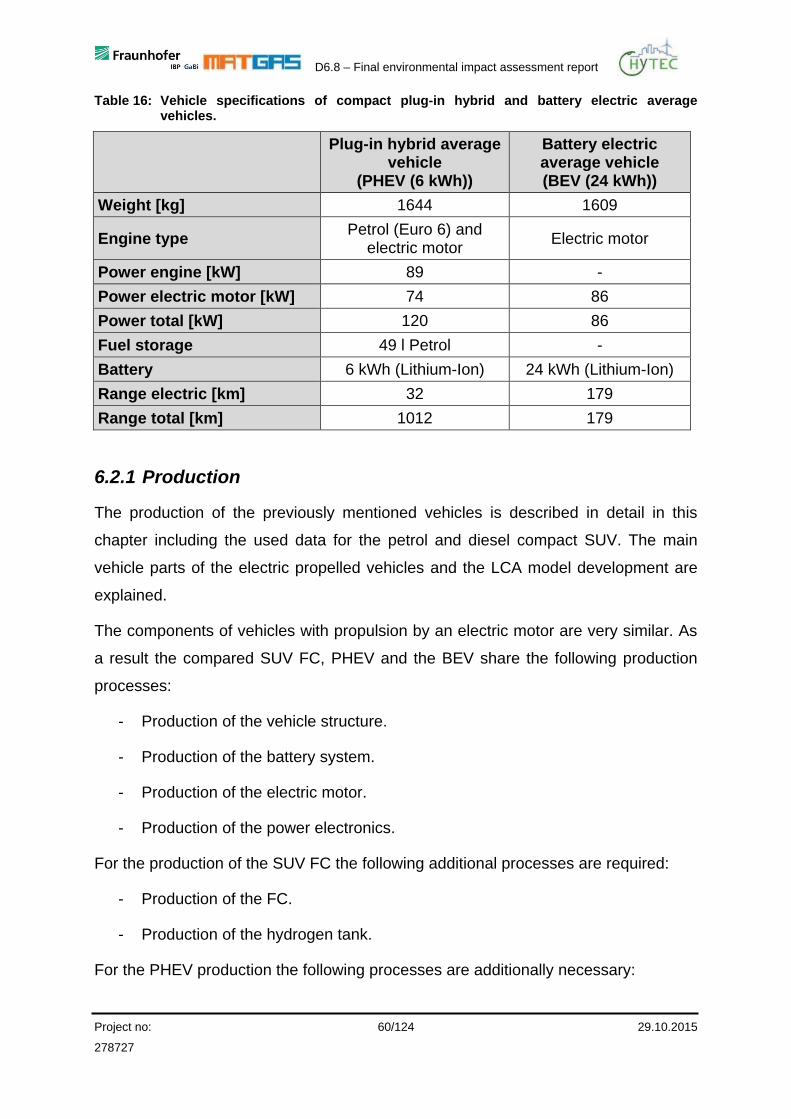
D6.8 – Final environmental impact assessment report
Project no: 60/124 29.10.2015
278727
Table 16: Vehicle specifications of compact plug-in hybrid and battery electric average vehicles.
Plug-in hybrid average
vehicle (PHEV (6 kWh))
Battery electric average vehicle (BEV (24 kWh))
Weight [kg] 1644 1609
Engine type Petrol (Euro 6) and
electric motor Electric motor
Power engine [kW] 89 -
Power electric motor [kW] 74 86
Power total [kW] 120 86
Fuel storage 49 l Petrol -
Battery 6 kWh (Lithium-Ion) 24 kWh (Lithium-Ion)
Range electric [km] 32 179
Range total [km] 1012 179
6.2.1 Production
The production of the previously mentioned vehicles is described in detail in this
chapter including the used data for the petrol and diesel compact SUV. The main
vehicle parts of the electric propelled vehicles and the LCA model development are
explained.
The components of vehicles with propulsion by an electric motor are very similar. As
a result the compared SUV FC, PHEV and the BEV share the following production
processes:
- Production of the vehicle structure.
- Production of the battery system.
- Production of the electric motor.
- Production of the power electronics.
For the production of the SUV FC the following additional processes are required:
- Production of the FC.
- Production of the hydrogen tank.
For the PHEV production the following processes are additionally necessary:

D6.8 – Final environmental impact assessment report
Project no: 61/124 29.10.2015
278727
- Production of the internal combustion engine.
- Production of generator.
- Production of the fuel tank.
Many parts of the vehicles assessed in London and Copenhagen are the same or
similar. Hence the detailed description here would be the same as in chapter 5.2.1.
Therefore the descriptions of same parts like the descriptions of the Life Cycle
Inventory of petrol and diesel vehicles, vehicle structure, battery system, electric
motor, power electronics, combustion engine and also the LCA model development
are not repeated here.
6.2.1.1 Fuel cell system
Only limited primary data was available for the assessment of the SUV FC. Hyundai
delivered technology specifications of their vehicle as power rating of the engine,
battery size and hydrogen storage. FC specific information provided by Hyundai are
e.g. power output rate, number of modules and some details regarding the material
composition. This information covered the specific points needed for the assessment,
as they are crucial points of a FC LCA study. This information was combined with the
available primary FC data obtained from IE. The platinum content of automotive
state-of-the art FC was assumed to be 1 g Pt/kW FC power.
6.2.1.2 Hydrogen tank
The hydrogen tank is also a type III tank as the FC taxi (chapter 5.2.1.7). So the
modelling was done in the same manner. Only difference is that the Hyundai has two
tanks with a total capacity of 5.6 kg H2.
6.2.1.3 Generator
Both generators and electric motors are electric machines with an identic layout. For
this reason the same material mix can be assumed. The material mix of a permanent
magnet synchronous motor (PMSM) [Lindegger et al., 2009] and further internally
available data from other projects are used and scaled by the weight-to-power ratio.
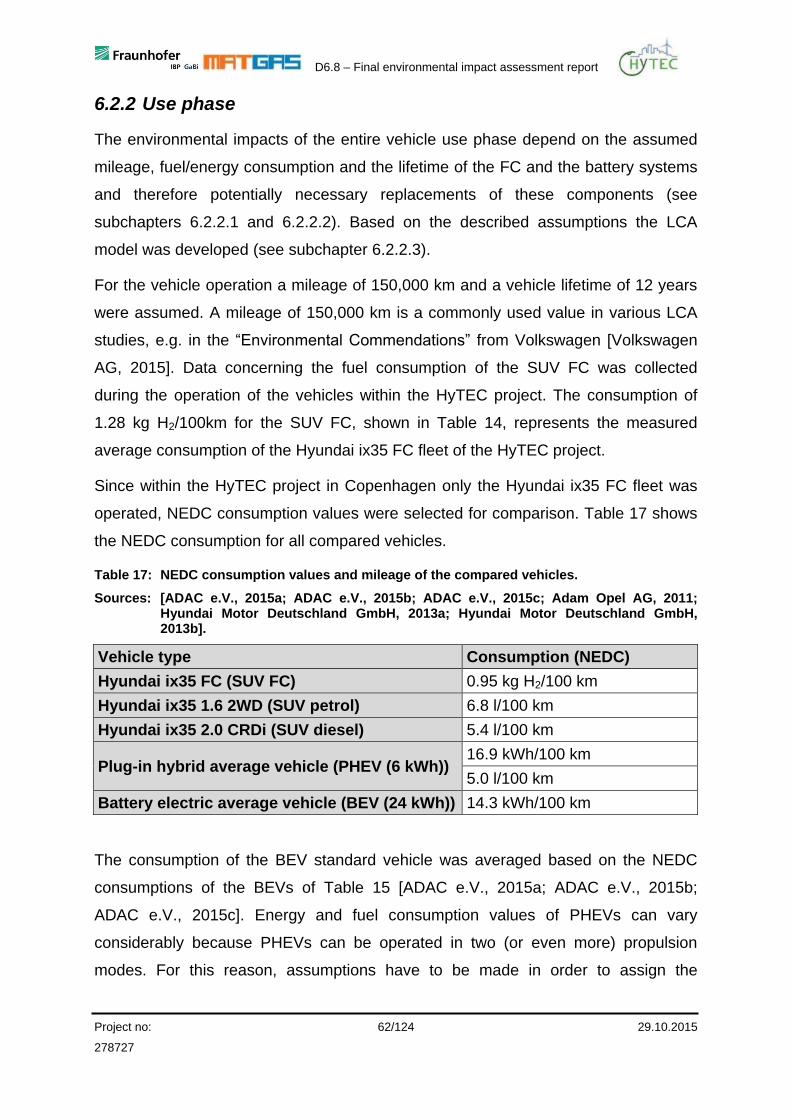
D6.8 – Final environmental impact assessment report
Project no: 62/124 29.10.2015
278727
6.2.2 Use phase
The environmental impacts of the entire vehicle use phase depend on the assumed
mileage, fuel/energy consumption and the lifetime of the FC and the battery systems
and therefore potentially necessary replacements of these components (see
subchapters 6.2.2.1 and 6.2.2.2). Based on the described assumptions the LCA
model was developed (see subchapter 6.2.2.3).
For the vehicle operation a mileage of 150,000 km and a vehicle lifetime of 12 years
were assumed. A mileage of 150,000 km is a commonly used value in various LCA
studies, e.g. in the “Environmental Commendations” from Volkswagen [Volkswagen
AG, 2015]. Data concerning the fuel consumption of the SUV FC was collected
during the operation of the vehicles within the HyTEC project. The consumption of
1.28 kg H2/100km for the SUV FC, shown in Table 14, represents the measured
average consumption of the Hyundai ix35 FC fleet of the HyTEC project.
Since within the HyTEC project in Copenhagen only the Hyundai ix35 FC fleet was
operated, NEDC consumption values were selected for comparison. Table 17 shows
the NEDC consumption for all compared vehicles.
Table 17: NEDC consumption values and mileage of the compared vehicles.
Sources: [ADAC e.V., 2015a; ADAC e.V., 2015b; ADAC e.V., 2015c; Adam Opel AG, 2011; Hyundai Motor Deutschland GmbH, 2013a; Hyundai Motor Deutschland GmbH, 2013b].
Vehicle type Consumption (NEDC)
Hyundai ix35 FC (SUV FC) 0.95 kg H2/100 km
Hyundai ix35 1.6 2WD (SUV petrol) 6.8 l/100 km
Hyundai ix35 2.0 CRDi (SUV diesel) 5.4 l/100 km
Plug-in hybrid average vehicle (PHEV (6 kWh)) 16.9 kWh/100 km
5.0 l/100 km
Battery electric average vehicle (BEV (24 kWh)) 14.3 kWh/100 km
The consumption of the BEV standard vehicle was averaged based on the NEDC
consumptions of the BEVs of Table 15 [ADAC e.V., 2015a; ADAC e.V., 2015b;
ADAC e.V., 2015c]. Energy and fuel consumption values of PHEVs can vary
considerably because PHEVs can be operated in two (or even more) propulsion
modes. For this reason, assumptions have to be made in order to assign the

D6.8 – Final environmental impact assessment report
Project no: 63/124 29.10.2015
278727
operation shares of EV mode (use of electricity) and hybrid mode (use of petrol).
There is little consumption data of PHEVs available which describes the
consumption in the different propulsion modes. The official NEDC values only
describe the average fuel consumption related to 100 km, without specifying the
share and the consumption of the different propulsion modes. Because of this lack of
data, the consumption values of the Opel Ampera were used for the LCA of the plug-
in hybrid vehicle, considering they are available for both the EV mode and the hybrid
mode [Adam Opel AG, 2011]. Based on the energy consumption value of the Opel
Ampera, an electric range for the 6 kWh battery was calculated considering the
charging losses of power electronics and battery. Referring to an average daily
mileage, the shares of EV mode and hybrid mode were determined. Table 18
summarizes the assumed consumption values as well as the calculation of the
propulsion mode shares.
Table 18: Assumptions on driving operation of the plug-in hybrid average vehicle.
Source: [Adam Opel AG, 2011].
Parameter Assumption
Energy consumption EV mode 16.9 kWh/100 km
Fuel consumption hybrid mode 5.0 l petrol/100 km
Average daily mileage 54 km (230 working days per year, total mileage: 150.000 km)
EV mode range 32 km (6 kWh battery)
Share EV mode 58%
Share hybrid mode 42%
The fuel supply for the vehicle operation depends on the different drivetrain
technologies. Chapter 6.1 describes the identification of required processes, data
collection and LCA model development for these supply chains. For all drivetrain
technologies the supply chains have a significant influence on the LCA results of the
vehicle life cycles. The environmental impacts of the SUV FC and the BEV operation
are linked to the hydrogen and the electricity supply chain, since FC vehicles only
emit water and BEVs don’t produce emissions during their use. During the operation
of the SUV petrol, SUV diesel and PHEV all or part of the environmental impacts are
caused by the combustion engine in the vehicles, being a substantial aspect of the
D6.8 – Final environmental impact assessment report
Project no: 64/124 29.10.2015
278727
vehicle LCA. As shown in Table 14 and Table 16, the pollutant emissions of the SUV
petrol and SUV diesel are Euro 5 compliant, those of the PHEV are Euro 6 compliant.
Since there were no original emission measurement data available, the emission
data with exception of CO2 and SO2 were taken from the HBEFA [INFRAS AG,
2014]. CO2 and SO2 were calculated based on the vehicle specific petrol and diesel
fuel consumption.
6.2.2.1 Fuel cell lifetime
The fuel cell lifetime was assumed to be 160,000 km, based on evaluations in the H2
Moves Scandinavia project using an Hyundai ix35FC and guarantees given by
Toyota for the Mirai [H2moves Scandinavia, 2013; Tanaka, 2015]. As the total vehicle
lifetime of 150,000 km is lower than the fuel cell lifetime, no fuel cell exchange is
necessary during the SUV FC operation.
6.2.2.2 Battery lifetime
The battery lifetime of all vehicles is assumed to be 160,000 km (cycle life) or 8 years
(calendar life) based on data from [Adam Opel AG, 2011; Barenschee, 2010; BMW
Group, 2013]. Due to the total vehicle mileage of 150,000 km in 12 years which is
lower than the battery cycle life of 160,000 km, a battery exchange after 8 years of
operation is necessary.
6.2.2.3 LCA model development
As explained before in this subchapter, only vehicle mileage, fuel consumption and
emissions from the internal combustion engines need to be part of the vehicle LCA
models. The use phase levels of the LCA models were designed flexible to be able to
vary fuel consumption values and mileages during the vehicle operation.
6.2.3 End of life
For the end of life assessment of all Copenhagen vehicles the same data and
assumptions like for the London assessment were chosen. For this reason, the data
and assumptions are only explained briefly within this chapter, a detailed description
is available in chapter 5.2.3.
All in- and outgoing material and energy flows for the recycling and disposal of the
vehicles are considered and the environmental benefit of energy or material recycling
D6.8 – Final environmental impact assessment report
Project no: 65/124 29.10.2015
278727
is considered by credits which quantify the avoided environmental impacts. The
assessment of the vehicles was performed according to EU Directive 2000/53/EC
[European Community, 2000]. The recycling of battery systems is regulated by EU
Directive 2006/66/EC [European Community, 2006]. For the end of life assessment,
a separated treatment of the specific components of the electric drivetrain is
assumed. The current models of the end of life of electric propelled vehicles and their
components are based on estimations due to insufficient available data at present.
An important process for the end of life LCA model of the of the SUV FC and
equivalent vehicles is the end of life of the vehicle structure (and conventional
components).
However, further end of life processes need to be considered for the SUV FC and the
electric propelled vehicles only:
1. End of life of the FC system.
2. End of life of the battery system.
3. End of life of the electric motor.
4. End of life of the power electronics.
5. End of life of the hydrogen tank.
6. End of life of the generator.
As most of the processes and hence the descriptions are the same as in chapter
5.2.3 the detailed breakdown it is not repeated here.
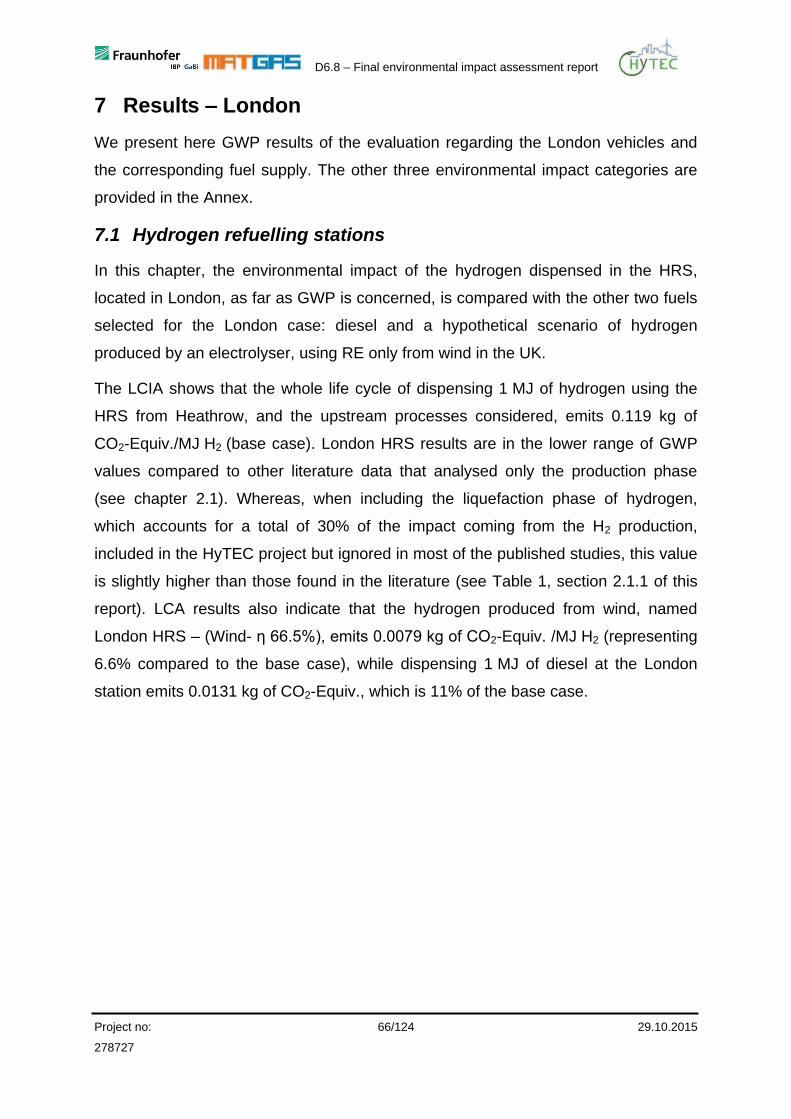
D6.8 – Final environmental impact assessment report
Project no: 66/124 29.10.2015
278727
7 Results – London
We present here GWP results of the evaluation regarding the London vehicles and
the corresponding fuel supply. The other three environmental impact categories are
provided in the Annex.
7.1 Hydrogen refuelling stations
In this chapter, the environmental impact of the hydrogen dispensed in the HRS,
located in London, as far as GWP is concerned, is compared with the other two fuels
selected for the London case: diesel and a hypothetical scenario of hydrogen
produced by an electrolyser, using RE only from wind in the UK.
The LCIA shows that the whole life cycle of dispensing 1 MJ of hydrogen using the
HRS from Heathrow, and the upstream processes considered, emits 0.119 kg of
CO2-Equiv./MJ H2 (base case). London HRS results are in the lower range of GWP
values compared to other literature data that analysed only the production phase
(see chapter 2.1). Whereas, when including the liquefaction phase of hydrogen,
which accounts for a total of 30% of the impact coming from the H2 production,
included in the HyTEC project but ignored in most of the published studies, this value
is slightly higher than those found in the literature (see Table 1, section 2.1.1 of this
report). LCA results also indicate that the hydrogen produced from wind, named
London HRS – (Wind- η 66.5%), emits 0.0079 kg of CO2-Equiv. /MJ H2 (representing
6.6% compared to the base case), while dispensing 1 MJ of diesel at the London
station emits 0.0131 kg of CO2-Equiv., which is 11% of the base case.

D6.8 – Final environmental impact assessment report
Project no: 67/124 29.10.2015
278727
0
0.02
0.04
0.06
0.08
0.1
0.12
0.14
HR
S
HR
S(o
nly
win
d)
Die
se
lS
tatio
n
Glo
bal W
arm
ing
Po
ten
tia
l [k
g C
O2
-Eq
uiv
./M
J]
Global Warming Potential London
Transportation
Delivery
Station
Compression
Production
Figure 17: Contributions of the different phases of fuel production for the London case to the GWP, measured in kg of CO2-Equiv. / MJ of energy.
It is well known that processes consuming large amounts of electricity and/or fuels
present a high impact in the Climate Change Category. The most important
substances accounting for the GWP are CO2, CH4, N2O, and the halogenated
hydrocarbons. Therefore, as it can be confirmed from Figure 17, the production of the
fuels, a very energy intensive process, represents the highest environmental impact
in the whole life cycle of the selected fuels.
As expected, the hydrogen production represents 93.7% of the CO2-Equiv.
emissions, followed by the compression, the production of the station itself and
delivery, which are responsible for 3.9%, 2.2% and 0.2%, respectively. Within the
hydrogen production, the operation of the SMR contributes the most to the GWP,
around 57.1%. Electricity used to liquefaction accounts for 30% and the natural gas
supplied as fuel with 3.2%. A credit of 6.6% of the emissions is obtained from the
steam produced from the process.
The LCA of dispensing diesel and a H2 from a hypothetical HRS (based on the
Copenhagen electrolyser case) operating in London were performed for comparative
purposes. Dispensing 1 MJ of diesel emits 0.0131 kg of CO2-Equiv.; from this the
production, transportation, station and delivery are responsible for 90.7%, 8.9%,
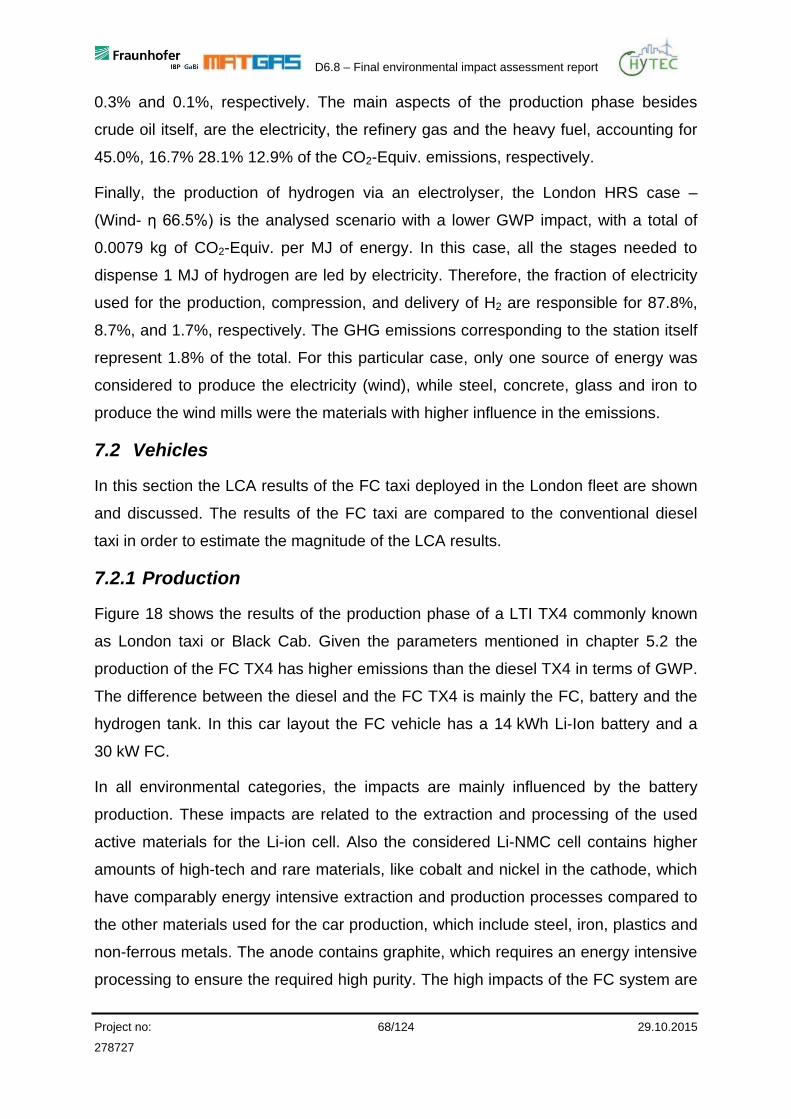
D6.8 – Final environmental impact assessment report
Project no: 68/124 29.10.2015
278727
0.3% and 0.1%, respectively. The main aspects of the production phase besides
crude oil itself, are the electricity, the refinery gas and the heavy fuel, accounting for
45.0%, 16.7% 28.1% 12.9% of the CO2-Equiv. emissions, respectively.
Finally, the production of hydrogen via an electrolyser, the London HRS case –
(Wind- η 66.5%) is the analysed scenario with a lower GWP impact, with a total of
0.0079 kg of CO2-Equiv. per MJ of energy. In this case, all the stages needed to
dispense 1 MJ of hydrogen are led by electricity. Therefore, the fraction of electricity
used for the production, compression, and delivery of H2 are responsible for 87.8%,
8.7%, and 1.7%, respectively. The GHG emissions corresponding to the station itself
represent 1.8% of the total. For this particular case, only one source of energy was
considered to produce the electricity (wind), while steel, concrete, glass and iron to
produce the wind mills were the materials with higher influence in the emissions.
7.2 Vehicles
In this section the LCA results of the FC taxi deployed in the London fleet are shown
and discussed. The results of the FC taxi are compared to the conventional diesel
taxi in order to estimate the magnitude of the LCA results.
7.2.1 Production
Figure 18 shows the results of the production phase of a LTI TX4 commonly known
as London taxi or Black Cab. Given the parameters mentioned in chapter 5.2 the
production of the FC TX4 has higher emissions than the diesel TX4 in terms of GWP.
The difference between the diesel and the FC TX4 is mainly the FC, battery and the
hydrogen tank. In this car layout the FC vehicle has a 14 kWh Li-Ion battery and a
30 kW FC.
In all environmental categories, the impacts are mainly influenced by the battery
production. These impacts are related to the extraction and processing of the used
active materials for the Li-ion cell. Also the considered Li-NMC cell contains higher
amounts of high-tech and rare materials, like cobalt and nickel in the cathode, which
have comparably energy intensive extraction and production processes compared to
the other materials used for the car production, which include steel, iron, plastics and
non-ferrous metals. The anode contains graphite, which requires an energy intensive
processing to ensure the required high purity. The high impacts of the FC system are
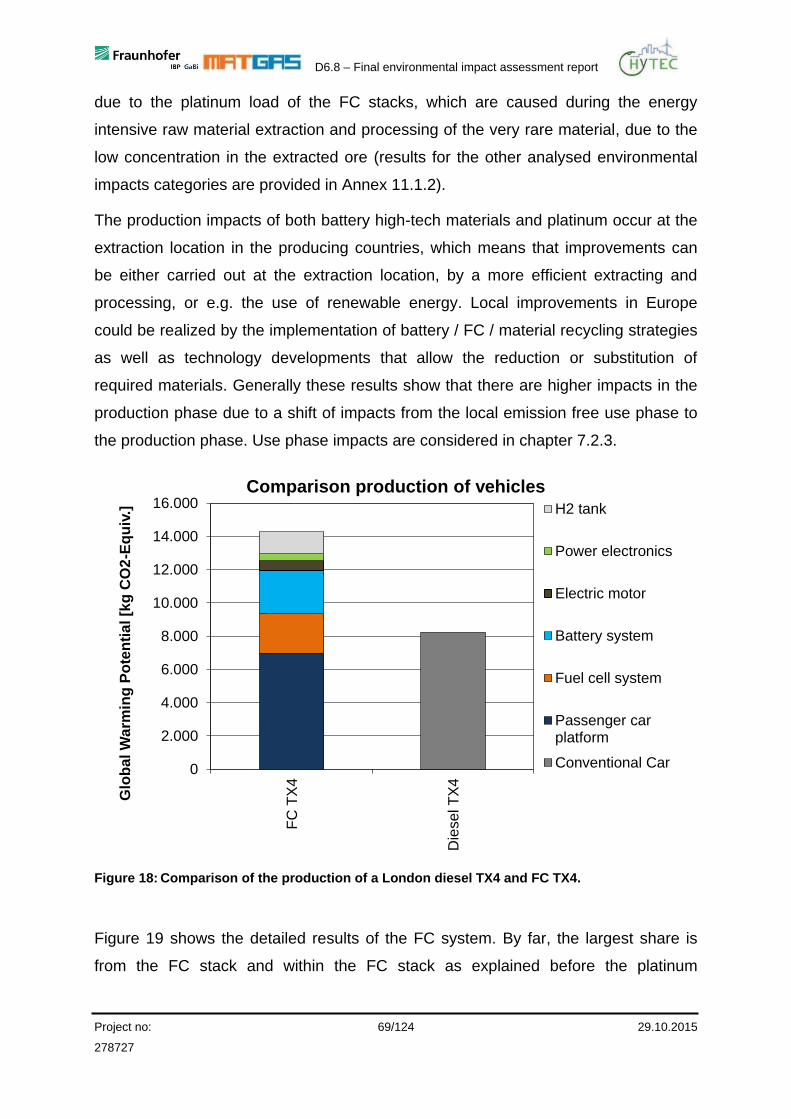
D6.8 – Final environmental impact assessment report
Project no: 69/124 29.10.2015
278727
due to the platinum load of the FC stacks, which are caused during the energy
intensive raw material extraction and processing of the very rare material, due to the
low concentration in the extracted ore (results for the other analysed environmental
impacts categories are provided in Annex 11.1.2).
The production impacts of both battery high-tech materials and platinum occur at the
extraction location in the producing countries, which means that improvements can
be either carried out at the extraction location, by a more efficient extracting and
processing, or e.g. the use of renewable energy. Local improvements in Europe
could be realized by the implementation of battery / FC / material recycling strategies
as well as technology developments that allow the reduction or substitution of
required materials. Generally these results show that there are higher impacts in the
production phase due to a shift of impacts from the local emission free use phase to
the production phase. Use phase impacts are considered in chapter 7.2.3.
0
2.000
4.000
6.000
8.000
10.000
12.000
14.000
16.000
FC
TX
4
Die
se
l T
X4
Glo
bal W
arm
ing
Po
ten
tia
l [k
g C
O2
-Eq
uiv
.]
Comparison production of vehicles
H2 tank
Power electronics
Electric motor
Battery system
Fuel cell system
Passenger carplatform
Conventional Car
Figure 18: Comparison of the production of a London diesel TX4 and FC TX4.
Figure 19 shows the detailed results of the FC system. By far, the largest share is
from the FC stack and within the FC stack as explained before the platinum
D6.8 – Final environmental impact assessment report
Project no: 70/124 29.10.2015
278727
requirement. Hence, the production of a FC is determined by the platinum demand in
terms of GWP.
3%
72%
4%
3%
3%
3% 10%
1%
Fuel cell system with 1 g Pt/kW (2349 kg CO2-Equiv. total)
Air Module
Fuel Cell Stack Module
HV Module
Hydrogen and ExhaustModuleLV Control Module
Primary Coolant Module
Thermal Module
Various COTS components
Figure 19: Results of the detailed evaluation of the FC system.
7.2.2 Sensitivity analysis – Pt loading of fuel cell
This chapter includes an analysis regarding the different platinum loadings in the
production of the vehicle.
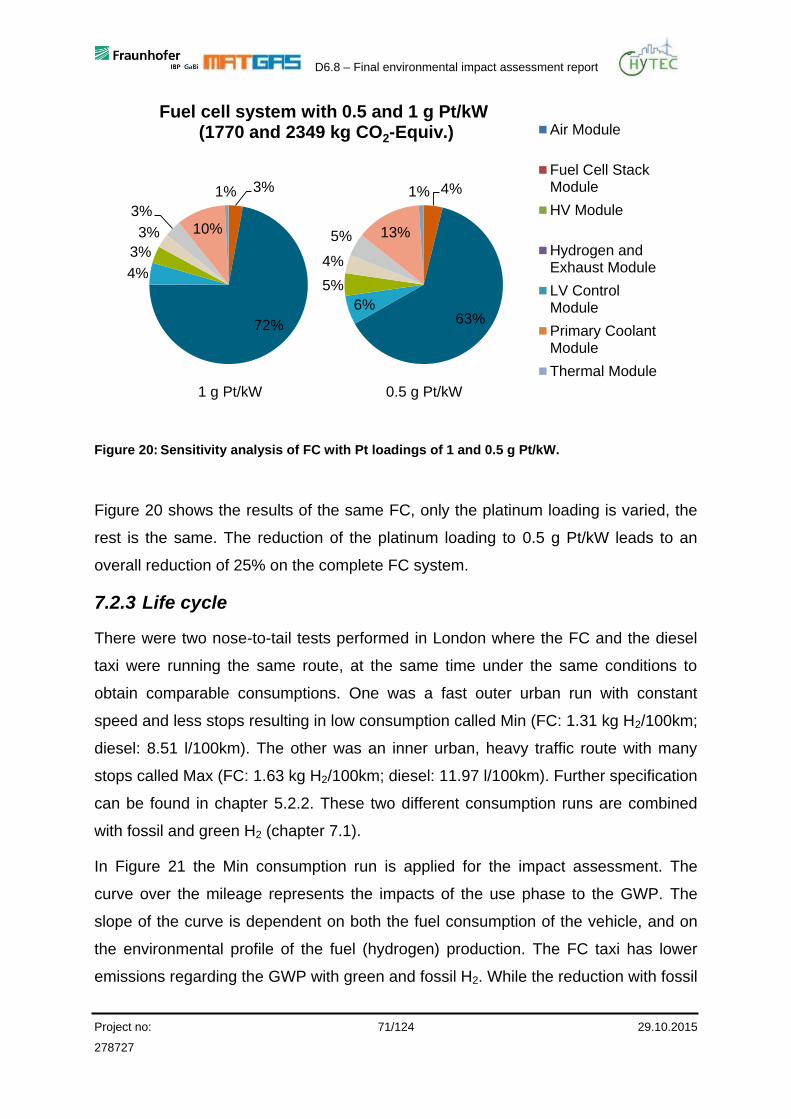
D6.8 – Final environmental impact assessment report
Project no: 71/124 29.10.2015
278727
Air Module
Fuel Cell StackModule
HV Module
Hydrogen andExhaust Module
LV ControlModule
Primary CoolantModule
Thermal Module
3%
72%
4%
3%
3%
3%
10%
1%
1.0 g Pt/kW 2,349 kg CO2-eq.
4%
63%6%
5%
4%
5% 13%
1%
0.5 g Pt/kW 1,770 kg CO2-eq.
Fuel cell system with 0.5 and 1 g Pt/kW (1770 and 2349 kg CO2-Equiv.)
0.5 g Pt/kW1 g Pt/kW
Figure 20: Sensitivity analysis of FC with Pt loadings of 1 and 0.5 g Pt/kW.
Figure 20 shows the results of the same FC, only the platinum loading is varied, the
rest is the same. The reduction of the platinum loading to 0.5 g Pt/kW leads to an
overall reduction of 25% on the complete FC system.
7.2.3 Life cycle
There were two nose-to-tail tests performed in London where the FC and the diesel
taxi were running the same route, at the same time under the same conditions to
obtain comparable consumptions. One was a fast outer urban run with constant
speed and less stops resulting in low consumption called Min (FC: 1.31 kg H2/100km;
diesel: 8.51 l/100km). The other was an inner urban, heavy traffic route with many
stops called Max (FC: 1.63 kg H2/100km; diesel: 11.97 l/100km). Further specification
can be found in chapter 5.2.2. These two different consumption runs are combined
with fossil and green H2 (chapter 7.1).
In Figure 21 the Min consumption run is applied for the impact assessment. The
curve over the mileage represents the impacts of the use phase to the GWP. The
slope of the curve is dependent on both the fuel consumption of the vehicle, and on
the environmental profile of the fuel (hydrogen) production. The FC taxi has lower
emissions regarding the GWP with green and fossil H2. While the reduction with fossil
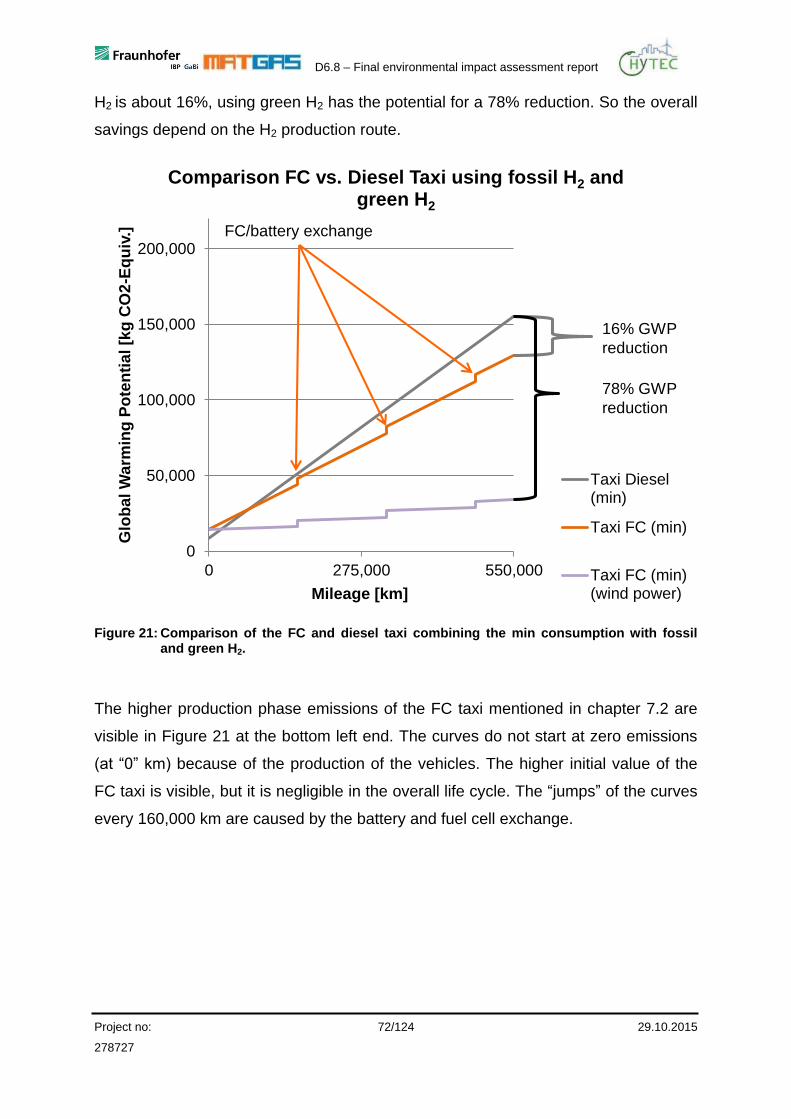
D6.8 – Final environmental impact assessment report
Project no: 72/124 29.10.2015
278727
H2 is about 16%, using green H2 has the potential for a 78% reduction. So the overall
savings depend on the H2 production route.
0
50,000
100,000
150,000
200,000
0 275,000 550,000
Glo
ba
l W
arm
ing
Po
ten
tia
l [k
g C
O2
-Eq
uiv
.]
Mileage [km]
Comparison FC vs. Diesel Taxi using fossil H2 and green H2
Taxi Diesel(min)
Taxi FC (min)
Taxi FC (min)(wind power)
16% GWP
reduction
78% GWP
reduction
FC/battery exchange
Figure 21: Comparison of the FC and diesel taxi combining the min consumption with fossil and green H2.
The higher production phase emissions of the FC taxi mentioned in chapter 7.2 are
visible in Figure 21 at the bottom left end. The curves do not start at zero emissions
(at “0” km) because of the production of the vehicles. The higher initial value of the
FC taxi is visible, but it is negligible in the overall life cycle. The “jumps” of the curves
every 160,000 km are caused by the battery and fuel cell exchange.
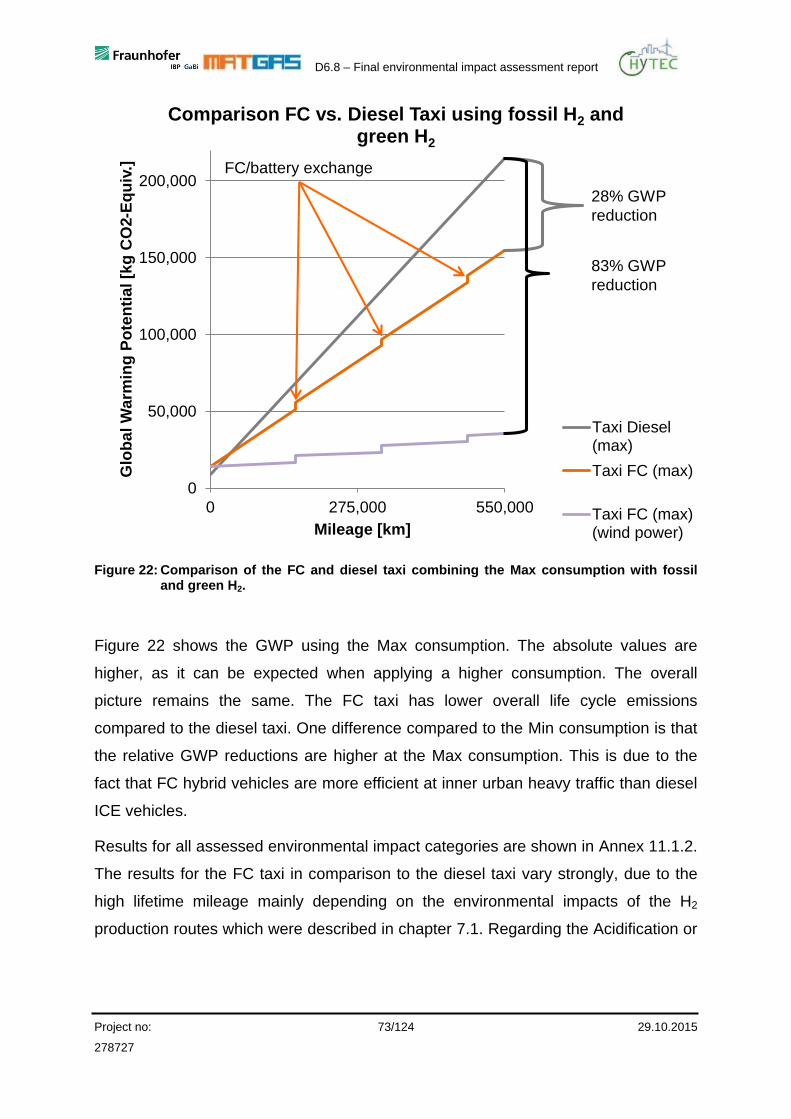
D6.8 – Final environmental impact assessment report
Project no: 73/124 29.10.2015
278727
0
50,000
100,000
150,000
200,000
0 275,000 550,000
Glo
ba
l W
arm
ing
Po
ten
tia
l [k
g C
O2-E
qu
iv.]
Mileage [km]
Comparison FC vs. Diesel Taxi using fossil H2 and green H2
Taxi Diesel(max)
Taxi FC (max)
Taxi FC (max)(wind power)
28% GWP
reduction
83% GWP
reduction
FC/battery exchange
Figure 22: Comparison of the FC and diesel taxi combining the Max consumption with fossil and green H2.
Figure 22 shows the GWP using the Max consumption. The absolute values are
higher, as it can be expected when applying a higher consumption. The overall
picture remains the same. The FC taxi has lower overall life cycle emissions
compared to the diesel taxi. One difference compared to the Min consumption is that
the relative GWP reductions are higher at the Max consumption. This is due to the
fact that FC hybrid vehicles are more efficient at inner urban heavy traffic than diesel
ICE vehicles.
Results for all assessed environmental impact categories are shown in Annex 11.1.2.
The results for the FC taxi in comparison to the diesel taxi vary strongly, due to the
high lifetime mileage mainly depending on the environmental impacts of the H2
production routes which were described in chapter 7.1. Regarding the Acidification or
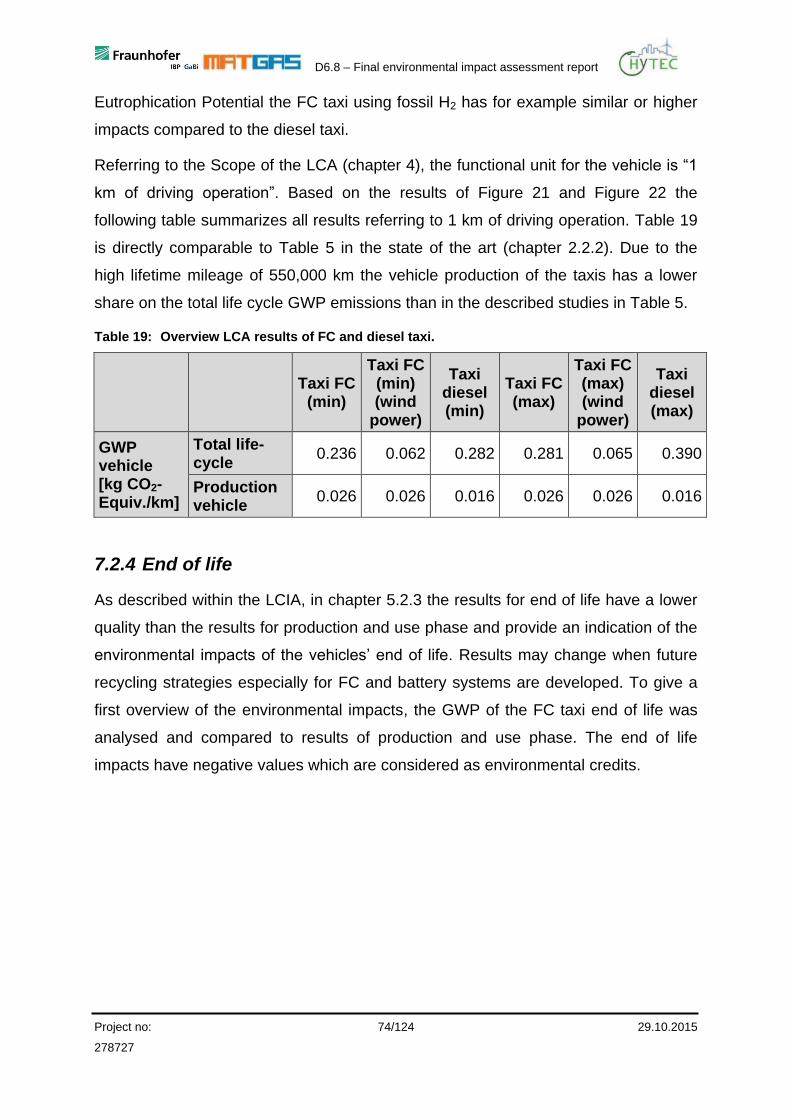
D6.8 – Final environmental impact assessment report
Project no: 74/124 29.10.2015
278727
Eutrophication Potential the FC taxi using fossil H2 has for example similar or higher
impacts compared to the diesel taxi.
Referring to the Scope of the LCA (chapter 4), the functional unit for the vehicle is “1
km of driving operation”. Based on the results of Figure 21 and Figure 22 the
following table summarizes all results referring to 1 km of driving operation. Table 19
is directly comparable to Table 5 in the state of the art (chapter 2.2.2). Due to the
high lifetime mileage of 550,000 km the vehicle production of the taxis has a lower
share on the total life cycle GWP emissions than in the described studies in Table 5.
Table 19: Overview LCA results of FC and diesel taxi.
Taxi FC (min)
Taxi FC (min) (wind
power)
Taxi diesel (min)
Taxi FC (max)
Taxi FC (max) (wind
power)
Taxi diesel (max)
GWP vehicle [kg CO2-Equiv./km]
Total life-cycle
0.236 0.062 0.282 0.281 0.065 0.390
Production vehicle
0.026 0.026 0.016 0.026 0.026 0.016
7.2.4 End of life
As described within the LCIA, in chapter 5.2.3 the results for end of life have a lower
quality than the results for production and use phase and provide an indication of the
environmental impacts of the vehicles’ end of life. Results may change when future
recycling strategies especially for FC and battery systems are developed. To give a
first overview of the environmental impacts, the GWP of the FC taxi end of life was
analysed and compared to results of production and use phase. The end of life
impacts have negative values which are considered as environmental credits.
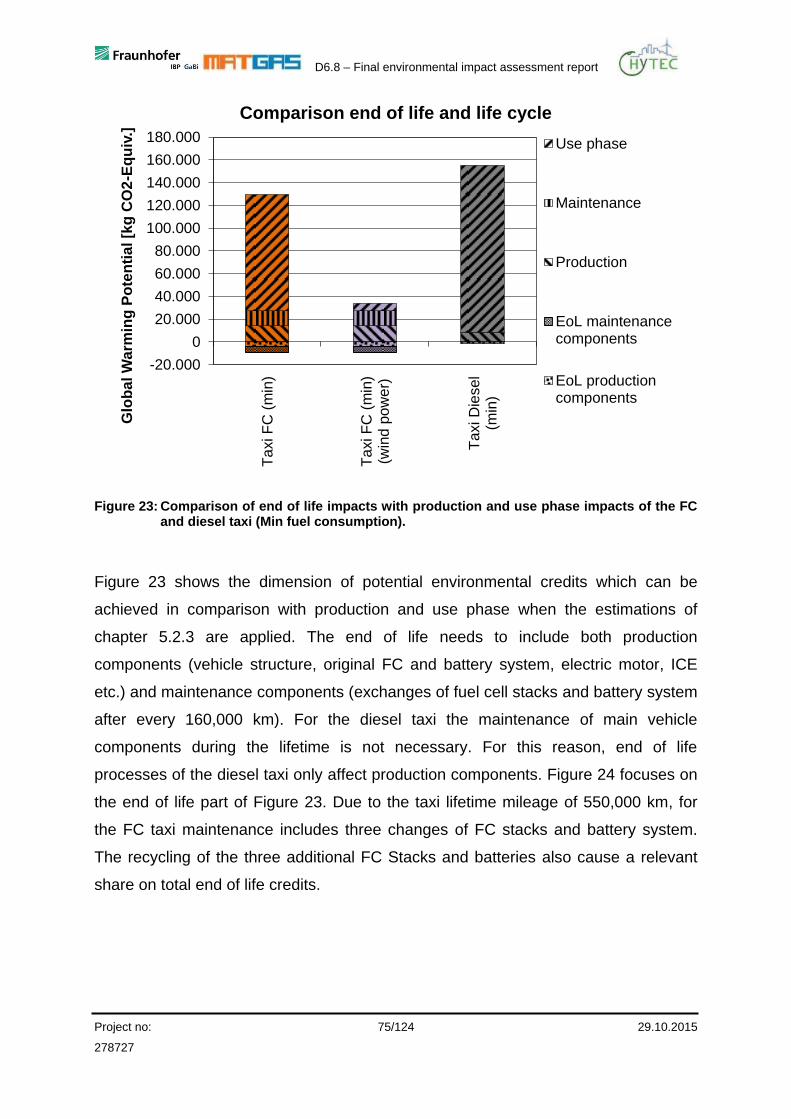
D6.8 – Final environmental impact assessment report
Project no: 75/124 29.10.2015
278727
-20.000
0
20.000
40.000
60.000
80.000
100.000
120.000
140.000
160.000
180.000
Ta
xi F
C (
min
)
Ta
xi F
C (
min
)(w
ind
po
we
r)
Ta
xi D
iesel
(min
)
Glo
bal W
arm
ing
Po
ten
tia
l [k
g C
O2
-Eq
uiv
.]Comparison end of life and life cycle
Use phase
Maintenance
Production
EoL maintenancecomponents
EoL productioncomponents
Figure 23: Comparison of end of life impacts with production and use phase impacts of the FC and diesel taxi (Min fuel consumption).
Figure 23 shows the dimension of potential environmental credits which can be
achieved in comparison with production and use phase when the estimations of
chapter 5.2.3 are applied. The end of life needs to include both production
components (vehicle structure, original FC and battery system, electric motor, ICE
etc.) and maintenance components (exchanges of fuel cell stacks and battery system
after every 160,000 km). For the diesel taxi the maintenance of main vehicle
components during the lifetime is not necessary. For this reason, end of life
processes of the diesel taxi only affect production components. Figure 24 focuses on
the end of life part of Figure 23. Due to the taxi lifetime mileage of 550,000 km, for
the FC taxi maintenance includes three changes of FC stacks and battery system.
The recycling of the three additional FC Stacks and batteries also cause a relevant
share on total end of life credits.
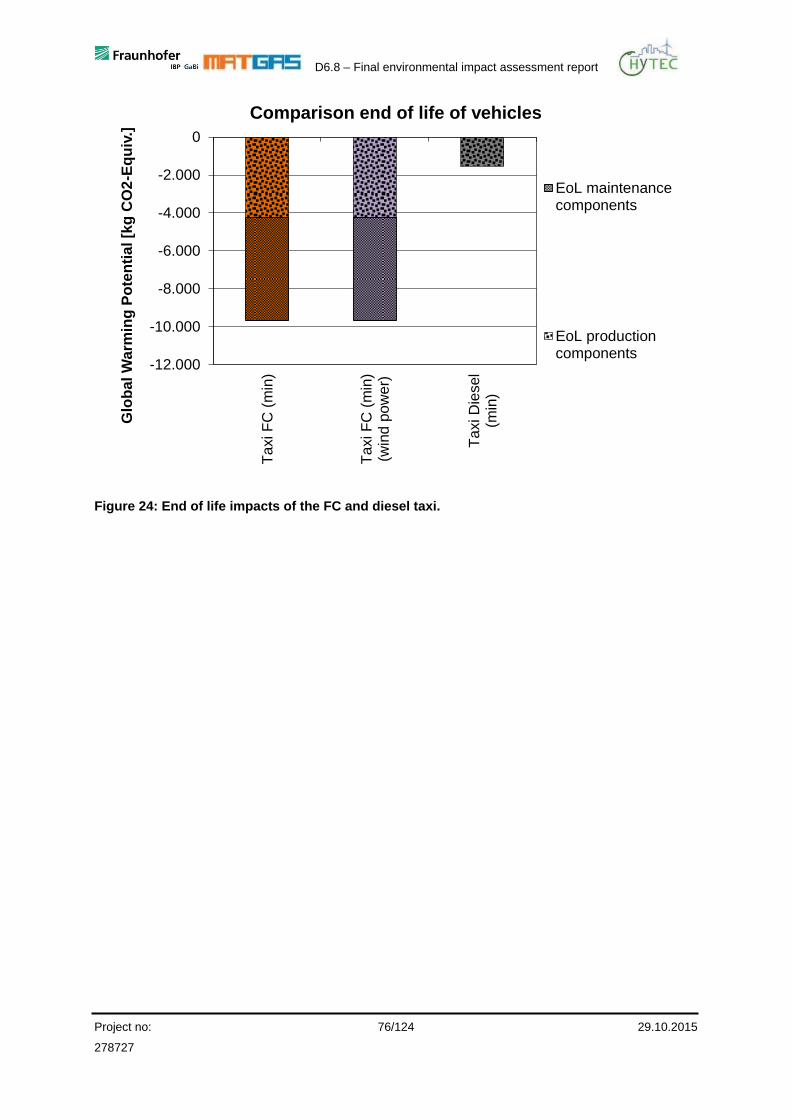
D6.8 – Final environmental impact assessment report
Project no: 76/124 29.10.2015
278727
-12.000
-10.000
-8.000
-6.000
-4.000
-2.000
0
Ta
xi F
C (
min
)
Ta
xi F
C (
min
)(w
ind
po
we
r)
Ta
xi D
iesel
(min
)
Glo
bal W
arm
ing
Po
ten
tia
l [k
g C
O2
-Eq
uiv
.]Comparison end of life of vehicles
EoL maintenancecomponents
EoL productioncomponents
Figure 24: End of life impacts of the FC and diesel taxi.
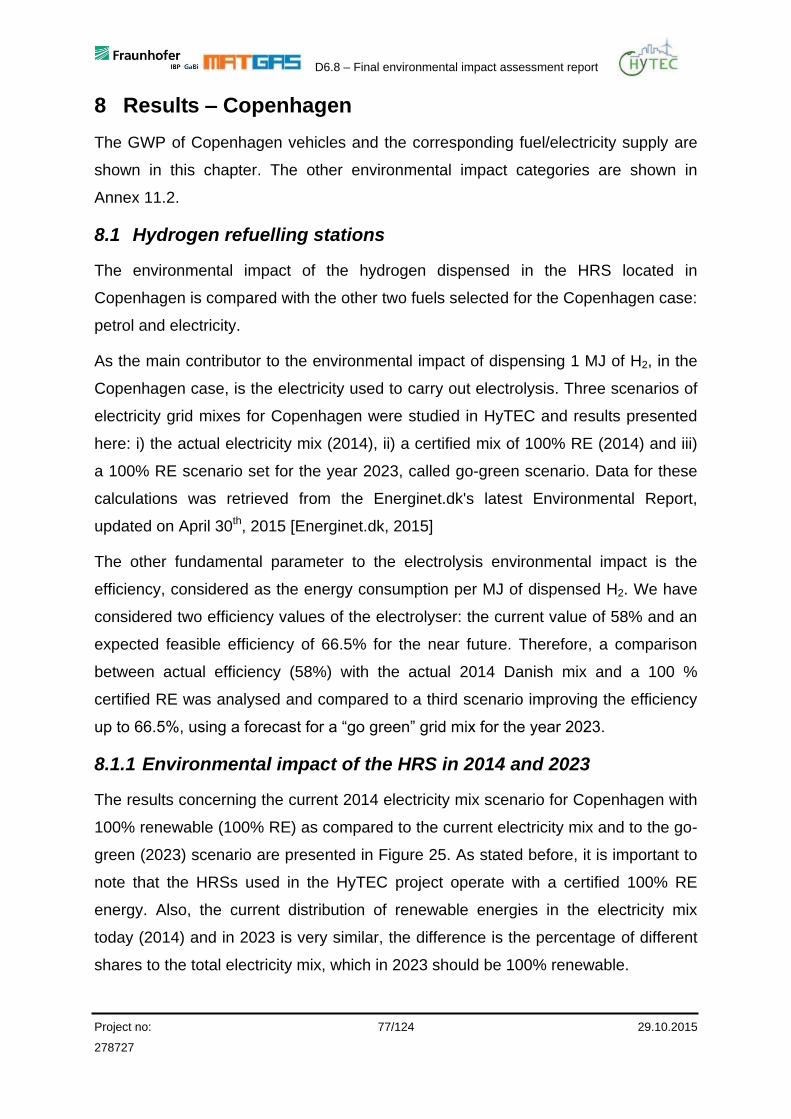
D6.8 – Final environmental impact assessment report
Project no: 77/124 29.10.2015
278727
8 Results – Copenhagen
The GWP of Copenhagen vehicles and the corresponding fuel/electricity supply are
shown in this chapter. The other environmental impact categories are shown in
Annex 11.2.
8.1 Hydrogen refuelling stations
The environmental impact of the hydrogen dispensed in the HRS located in
Copenhagen is compared with the other two fuels selected for the Copenhagen case:
petrol and electricity.
As the main contributor to the environmental impact of dispensing 1 MJ of H2, in the
Copenhagen case, is the electricity used to carry out electrolysis. Three scenarios of
electricity grid mixes for Copenhagen were studied in HyTEC and results presented
here: i) the actual electricity mix (2014), ii) a certified mix of 100% RE (2014) and iii)
a 100% RE scenario set for the year 2023, called go-green scenario. Data for these
calculations was retrieved from the Energinet.dk's latest Environmental Report,
updated on April 30th, 2015 [Energinet.dk, 2015]
The other fundamental parameter to the electrolysis environmental impact is the
efficiency, considered as the energy consumption per MJ of dispensed H2. We have
considered two efficiency values of the electrolyser: the current value of 58% and an
expected feasible efficiency of 66.5% for the near future. Therefore, a comparison
between actual efficiency (58%) with the actual 2014 Danish mix and a 100 %
certified RE was analysed and compared to a third scenario improving the efficiency
up to 66.5%, using a forecast for a “go green” grid mix for the year 2023.
8.1.1 Environmental impact of the HRS in 2014 and 2023
The results concerning the current 2014 electricity mix scenario for Copenhagen with
100% renewable (100% RE) as compared to the current electricity mix and to the go-
green (2023) scenario are presented in Figure 25. As stated before, it is important to
note that the HRSs used in the HyTEC project operate with a certified 100% RE
energy. Also, the current distribution of renewable energies in the electricity mix
today (2014) and in 2023 is very similar, the difference is the percentage of different
shares to the total electricity mix, which in 2023 should be 100% renewable.
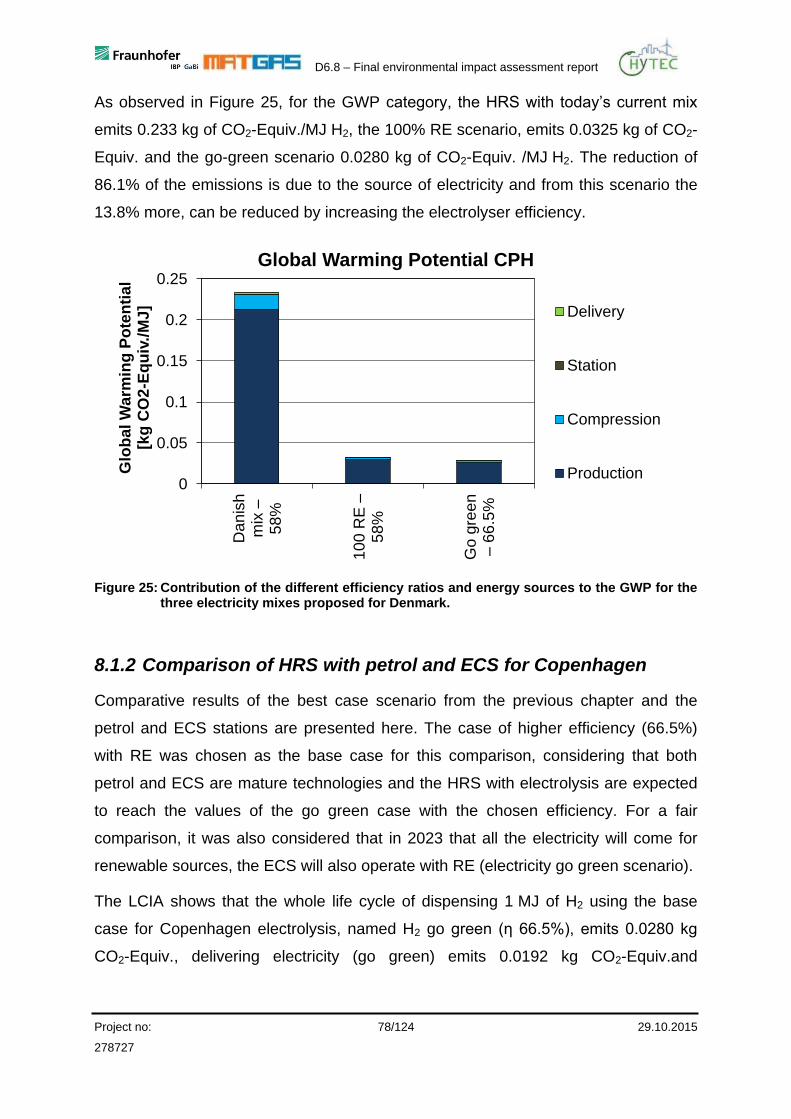
D6.8 – Final environmental impact assessment report
Project no: 78/124 29.10.2015
278727
As observed in Figure 25, for the GWP category, the HRS with today’s current mix
emits 0.233 kg of CO2-Equiv./MJ H2, the 100% RE scenario, emits 0.0325 kg of CO2-
Equiv. and the go-green scenario 0.0280 kg of CO2-Equiv. /MJ H2. The reduction of
86.1% of the emissions is due to the source of electricity and from this scenario the
13.8% more, can be reduced by increasing the electrolyser efficiency.
0
0.05
0.1
0.15
0.2
0.25
Dan
ish
mix
–5
8%
10
0 R
E –
58
%
Go
gre
en
–
66
.5%
Glo
bal W
arm
ing
Po
ten
tia
l [k
g C
O2
-Eq
uiv
./M
J]
Global Warming Potential CPH
Delivery
Station
Compression
Production
Figure 25: Contribution of the different efficiency ratios and energy sources to the GWP for the three electricity mixes proposed for Denmark.
8.1.2 Comparison of HRS with petrol and ECS for Copenhagen
Comparative results of the best case scenario from the previous chapter and the
petrol and ECS stations are presented here. The case of higher efficiency (66.5%)
with RE was chosen as the base case for this comparison, considering that both
petrol and ECS are mature technologies and the HRS with electrolysis are expected
to reach the values of the go green case with the chosen efficiency. For a fair
comparison, it was also considered that in 2023 that all the electricity will come for
renewable sources, the ECS will also operate with RE (electricity go green scenario).
The LCIA shows that the whole life cycle of dispensing 1 MJ of H2 using the base
case for Copenhagen electrolysis, named H2 go green (η 66.5%), emits 0.0280 kg
CO2-Equiv., delivering electricity (go green) emits 0.0192 kg CO2-Equiv.and

D6.8 – Final environmental impact assessment report
Project no: 79/124 29.10.2015
278727
delivering 1 MJ of petrol emits 0.0177 kg CO2-Equiv., representing 68.5% and 63.2%,
respectively, compared to the base case (Figure 26).
In the case of the HRS, the production of the hydrogen, the compression, the
production of the station itself and the delivery are responsible for 89.0%, 8.8%, 0.4%
and 1.8%, respectively. For the petrol case, production accounts for 96.2% of the
total value, transportation for 3.5%, while station and delivery are responsible for
0.1% and 0.2%, respectively. Finally, when delivering 1 MJ of electricity using the go
green grid mix forecasted for Denmark, the production, transmission and station
itself, are responsible for 88.0%, 2.6%, 0.6%, respectively. As it is expected, the
other most important aspect is the charging loss, contributing to the 8.8% of the CO2-
Equiv.emissions.
0
0.005
0.01
0.015
0.02
0.025
0.03
0.035
Petr
ol
Ele
ctr
icity
- G
og
reen
H2
Go
gre
en
–6
6.5
%
Glo
ba
l W
arm
ing
Po
ten
tia
l [k
g C
O2
-Eq
uiv
./M
J]
Global Warming Potential CPH
Transportation
Delivery
Station
Compression
Production
Figure 26: Contributions of the different phases of fuel production for the Copenhagen case, to the GWP category, measured in kg of CO2-Equiv. /MJ of energy.
8.2 Vehicles
The LCA results of the SUV FC, deployed in the Copenhagen fleet are presented
and discussed here. The chapter includes the relevant factors of each life cycle stage
and puts them into relation to the whole vehicle life cycle. In addition the results of
the SUV FC are compared to conventional vehicles and other electric vehicle

D6.8 – Final environmental impact assessment report
Project no: 80/124 29.10.2015
278727
concepts (BEV, PHEV). However, it has to be mentioned that the assessed BEV has
a limited range, which is defined by the sizing of the storage capacity of the battery
system. Hence, the BEV is not directly comparable to the SUV FC, PHEV and
conventional vehicles, especially when it comes to use cases where the electric
driving range cannot be provided due to the battery sizing, e.g. long distance trips.
8.2.1 Production
Figure 27 presents the LCIA results of the production phase of the SUV FC in
comparison to the other vehicle concepts. The LCIA results are calculated on the
basis of the generic LCA model which is adjusted according to the vehicle specific
technical values describes in chapter 6.2, like vehicle mass, battery technology and
dimensioning, etc. The results show that the production of electric propelled vehicles
has significantly higher contributions to the GWP compared to the production of
conventional cars with an internal combustion engine.
0
2.000
4.000
6.000
8.000
10.000
12.000
14.000
16.000
SU
V F
C
BE
V(2
4 k
Wh)
SU
V P
etr
ol
SU
V D
iese
l
PH
EV
(6 k
Wh
)
Glo
ba
l W
arm
ing
Po
ten
tia
l [k
g C
O2
-Eq
uiv
.]
Comparison production of vehicles
H2 tank
Power electronics
Electric motor /generator
Battery system
Fuel cell system
Passenger carplatform
Conventional Car
Figure 27: Comparison of the production of the SUV FC and equivalent vehicles.
Main drivers are in the production of the power train components, the FC system and
the battery system, which cause more than the 50% of the impact of the production
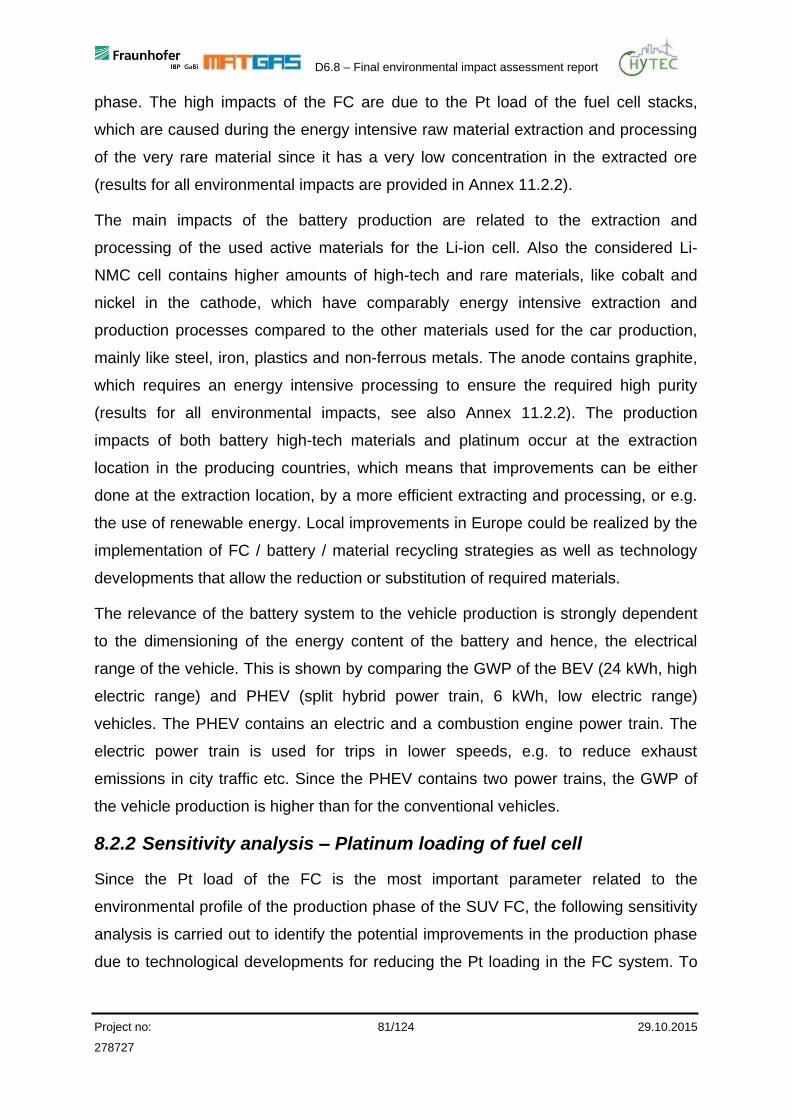
D6.8 – Final environmental impact assessment report
Project no: 81/124 29.10.2015
278727
phase. The high impacts of the FC are due to the Pt load of the fuel cell stacks,
which are caused during the energy intensive raw material extraction and processing
of the very rare material since it has a very low concentration in the extracted ore
(results for all environmental impacts are provided in Annex 11.2.2).
The main impacts of the battery production are related to the extraction and
processing of the used active materials for the Li-ion cell. Also the considered Li-
NMC cell contains higher amounts of high-tech and rare materials, like cobalt and
nickel in the cathode, which have comparably energy intensive extraction and
production processes compared to the other materials used for the car production,
mainly like steel, iron, plastics and non-ferrous metals. The anode contains graphite,
which requires an energy intensive processing to ensure the required high purity
(results for all environmental impacts, see also Annex 11.2.2). The production
impacts of both battery high-tech materials and platinum occur at the extraction
location in the producing countries, which means that improvements can be either
done at the extraction location, by a more efficient extracting and processing, or e.g.
the use of renewable energy. Local improvements in Europe could be realized by the
implementation of FC / battery / material recycling strategies as well as technology
developments that allow the reduction or substitution of required materials.
The relevance of the battery system to the vehicle production is strongly dependent
to the dimensioning of the energy content of the battery and hence, the electrical
range of the vehicle. This is shown by comparing the GWP of the BEV (24 kWh, high
electric range) and PHEV (split hybrid power train, 6 kWh, low electric range)
vehicles. The PHEV contains an electric and a combustion engine power train. The
electric power train is used for trips in lower speeds, e.g. to reduce exhaust
emissions in city traffic etc. Since the PHEV contains two power trains, the GWP of
the vehicle production is higher than for the conventional vehicles.
8.2.2 Sensitivity analysis – Platinum loading of fuel cell
Since the Pt load of the FC is the most important parameter related to the
environmental profile of the production phase of the SUV FC, the following sensitivity
analysis is carried out to identify the potential improvements in the production phase
due to technological developments for reducing the Pt loading in the FC system. To
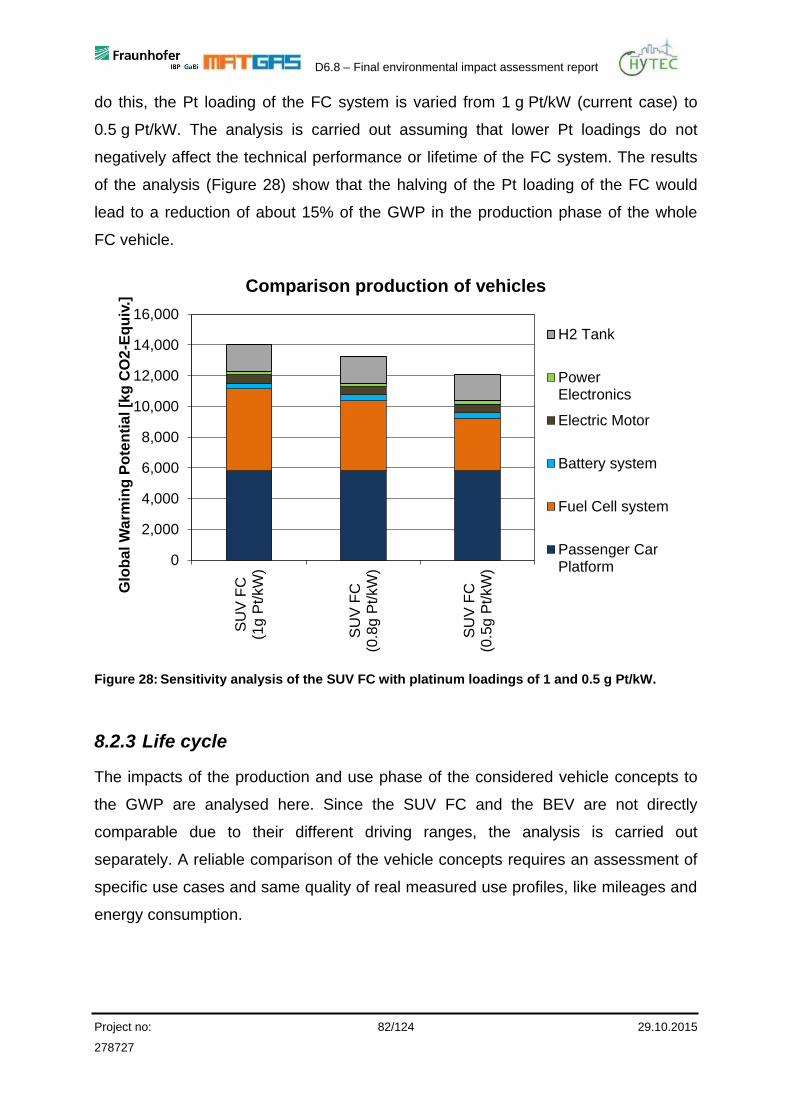
D6.8 – Final environmental impact assessment report
Project no: 82/124 29.10.2015
278727
do this, the Pt loading of the FC system is varied from 1 g Pt/kW (current case) to
0.5 g Pt/kW. The analysis is carried out assuming that lower Pt loadings do not
negatively affect the technical performance or lifetime of the FC system. The results
of the analysis (Figure 28) show that the halving of the Pt loading of the FC would
lead to a reduction of about 15% of the GWP in the production phase of the whole
FC vehicle.
0
2,000
4,000
6,000
8,000
10,000
12,000
14,000
16,000
SU
V F
C(1
g P
t/kW
)
SU
V F
C(0
.8g
Pt/
kW
)
SU
V F
C(0
.5g
Pt/
kW
)
Glo
bal W
arm
ing
Po
ten
tia
l [k
g C
O2
-Eq
uiv
.]
Comparison production of vehicles
H2 Tank
PowerElectronics
Electric Motor
Battery system
Fuel Cell system
Passenger CarPlatform
Figure 28: Sensitivity analysis of the SUV FC with platinum loadings of 1 and 0.5 g Pt/kW.
8.2.3 Life cycle
The impacts of the production and use phase of the considered vehicle concepts to
the GWP are analysed here. Since the SUV FC and the BEV are not directly
comparable due to their different driving ranges, the analysis is carried out
separately. A reliable comparison of the vehicle concepts requires an assessment of
specific use cases and same quality of real measured use profiles, like mileages and
energy consumption.
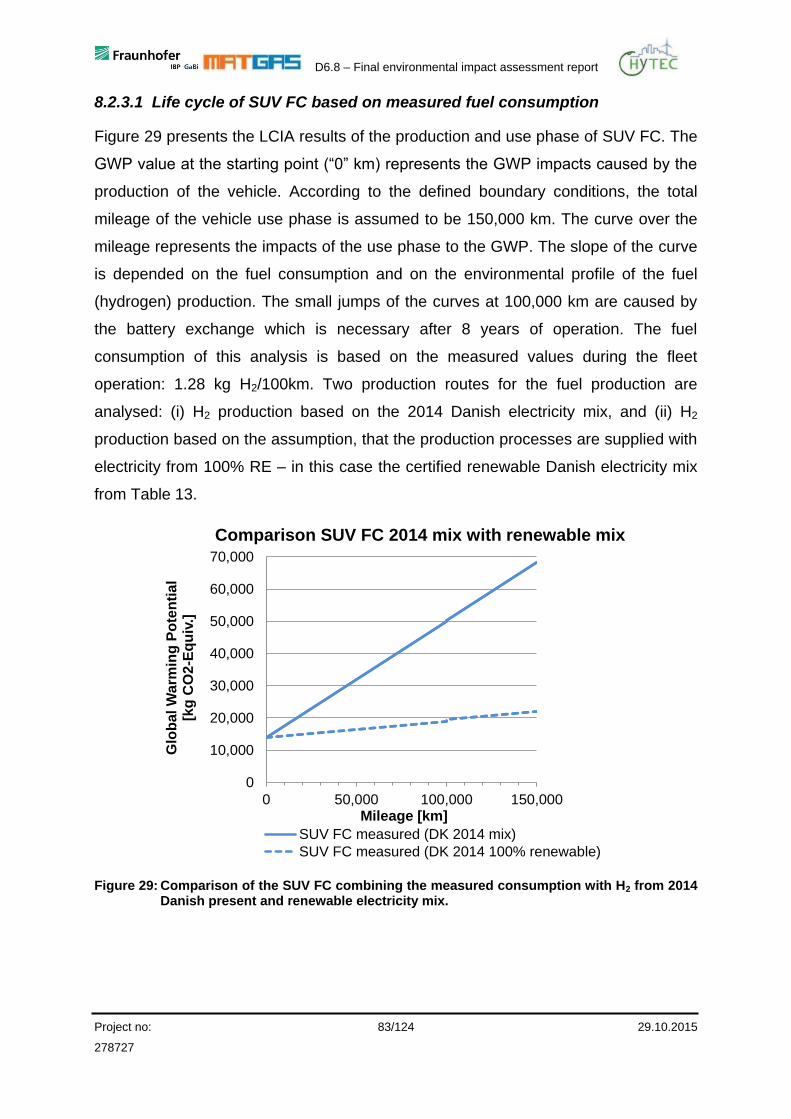
D6.8 – Final environmental impact assessment report
Project no: 83/124 29.10.2015
278727
8.2.3.1 Life cycle of SUV FC based on measured fuel consumption
Figure 29 presents the LCIA results of the production and use phase of SUV FC. The
GWP value at the starting point (“0” km) represents the GWP impacts caused by the
production of the vehicle. According to the defined boundary conditions, the total
mileage of the vehicle use phase is assumed to be 150,000 km. The curve over the
mileage represents the impacts of the use phase to the GWP. The slope of the curve
is depended on the fuel consumption and on the environmental profile of the fuel
(hydrogen) production. The small jumps of the curves at 100,000 km are caused by
the battery exchange which is necessary after 8 years of operation. The fuel
consumption of this analysis is based on the measured values during the fleet
operation: 1.28 kg H2/100km. Two production routes for the fuel production are
analysed: (i) H2 production based on the 2014 Danish electricity mix, and (ii) H2
production based on the assumption, that the production processes are supplied with
electricity from 100% RE – in this case the certified renewable Danish electricity mix
from Table 13.
0
10,000
20,000
30,000
40,000
50,000
60,000
70,000
0 50,000 100,000 150,000
Glo
ba
l W
arm
ing
Po
ten
tia
l[k
g C
O2
-Eq
uiv
.]
Mileage [km]
Comparison SUV FC 2014 mix with renewable mix
SUV FC measured (DK 2014 mix)
SUV FC measured (DK 2014 100% renewable)
Figure 29: Comparison of the SUV FC combining the measured consumption with H2 from 2014 Danish present and renewable electricity mix.

D6.8 – Final environmental impact assessment report
Project no: 84/124 29.10.2015
278727
The results in Figure 29 show that the impact of the use phase to the GWP can be
significantly reduced by using H2 produced from 100% RE. Over the total mileage,
the GWP can be reduced by around 46 tons CO2-Equiv. when using renewable
produced H2-fuel instead of the current production mix. These results show that the
environmental profile of the used fuel and hence the production route of H2 is an
important lever for the environmental profile of a FC vehicle life cycle.
8.2.3.2 Scenario: Increased efficiency of electrolyser
Figure 30 presents the results of the LCA analysis of the combined electricity and H2
production scenario according to 8.1.1. This scenario assumes that the future H2
production for FC vehicles will use 100% RE in the production processes as well as
raising process efficiency for the electrolyser from 58% up to 66.5%. The fuel
consumption of this analysis is based on the measured values during the fleet
operation of 1.28 kg H2/100km.
Based on these assumptions, the results of the GWP show an improvement in the H2
production. In terms of the life cycle of the SUV FC there are only minor noticeable
improvements in the GWP, when REs are used in the H2 production. However, the
increase of the process efficiency leads to a better yield in terms of H2 produced per
energy unit and has therefore a positive impact on the use of RE and the long term
supply of H2.
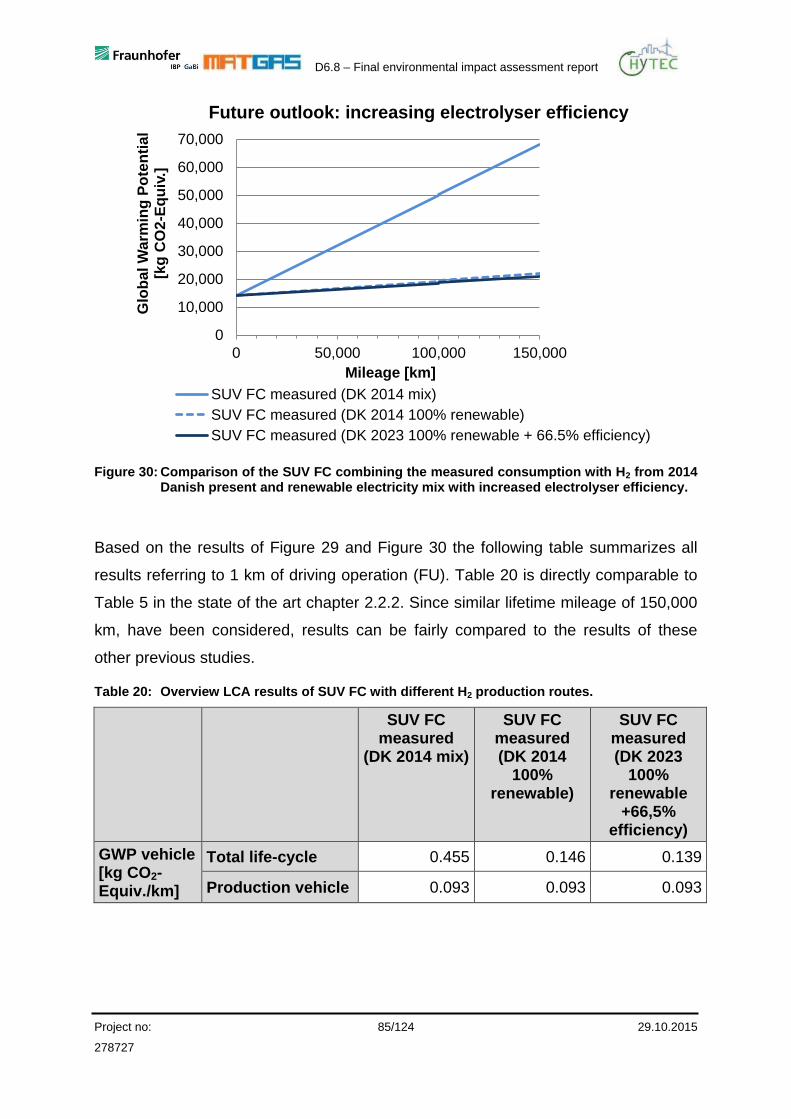
D6.8 – Final environmental impact assessment report
Project no: 85/124 29.10.2015
278727
0
10,000
20,000
30,000
40,000
50,000
60,000
70,000
0 50,000 100,000 150,000
Glo
bal W
arm
ing
Po
ten
tial
[kg
CO
2-E
qu
iv.]
Mileage [km]
Future outlook: increasing electrolyser efficiency
SUV FC measured (DK 2014 mix)
SUV FC measured (DK 2014 100% renewable)
SUV FC measured (DK 2023 100% renewable + 66.5% efficiency)
Figure 30: Comparison of the SUV FC combining the measured consumption with H2 from 2014 Danish present and renewable electricity mix with increased electrolyser efficiency.
Based on the results of Figure 29 and Figure 30 the following table summarizes all
results referring to 1 km of driving operation (FU). Table 20 is directly comparable to
Table 5 in the state of the art chapter 2.2.2. Since similar lifetime mileage of 150,000
km, have been considered, results can be fairly compared to the results of these
other previous studies.
Table 20: Overview LCA results of SUV FC with different H2 production routes.
SUV FC measured
(DK 2014 mix)
SUV FC measured (DK 2014
100% renewable)
SUV FC measured (DK 2023
100% renewable
+66,5% efficiency)
GWP vehicle [kg CO2-Equiv./km]
Total life-cycle 0.455 0.146 0.139
Production vehicle 0.093 0.093 0.093

D6.8 – Final environmental impact assessment report
Project no: 86/124 29.10.2015
278727
8.2.3.3 Life Cycle SUV FC: Comparison measured fuel consumption to NEDC values
The comparison of the measured fuel consumption values to those based on the
NEDC cycle show that the fuel consumption of the SUV FC under real conditions is
around 35% higher than the determined NEDC values. In accordance to chapter
6.2.2, the measured value during the fleet operation is 1.28 kg H2/100km whereas
the NEDC value is 0.95 kg H2/100km. Since the main impacts to the GWP are
caused by the use phase, Figure 31 shows the life cycle results based on the
measured fuel consumption values compared to the NEDC values.
To analyse the effect of the fuel consumption on the life cycle results, results are
presented for H2 produced via the present route and for a production route using
100% RE.
0
10,000
20,000
30,000
40,000
50,000
60,000
70,000
0 50,000 100,000 150,000
Glo
ba
l W
arm
ing
Po
ten
tia
l[k
g C
O2
-Eq
uiv
.]
Mileage [km]
Comparison SUV FC measured and NEDC consumption
SUV FC measured (DK 2014 mix)SUV FC NEDC (DK 2014 mix)SUV FC measured (DK 2014 100% renewable)SUV FC NEDC (DK 100% renewable)
Figure 31: Comparison of the SUV FC combining measured and the NEDC consumption with H2 from 2014 Danish current and renewable electricity mix.
Based on the measured consumption values and by assuming the present Danish
hydrogen production mix, the calculated life cycle results of the GWP are around 14
tons CO2-Equiv. higher than the results based on the NEDC. Hence, the fuel
consumption under real driving conditions and under the specific boundary conditions
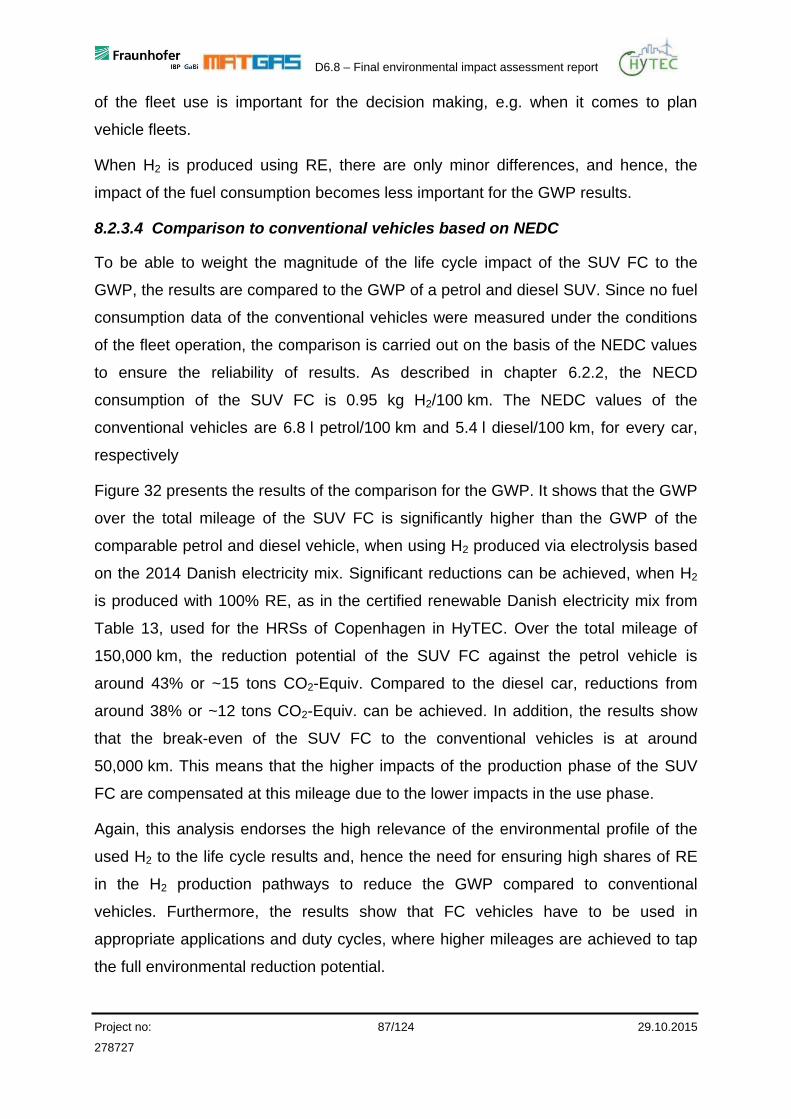
D6.8 – Final environmental impact assessment report
Project no: 87/124 29.10.2015
278727
of the fleet use is important for the decision making, e.g. when it comes to plan
vehicle fleets.
When H2 is produced using RE, there are only minor differences, and hence, the
impact of the fuel consumption becomes less important for the GWP results.
8.2.3.4 Comparison to conventional vehicles based on NEDC
To be able to weight the magnitude of the life cycle impact of the SUV FC to the
GWP, the results are compared to the GWP of a petrol and diesel SUV. Since no fuel
consumption data of the conventional vehicles were measured under the conditions
of the fleet operation, the comparison is carried out on the basis of the NEDC values
to ensure the reliability of results. As described in chapter 6.2.2, the NECD
consumption of the SUV FC is 0.95 kg H2/100 km. The NEDC values of the
conventional vehicles are 6.8 l petrol/100 km and 5.4 l diesel/100 km, for every car,
respectively
Figure 32 presents the results of the comparison for the GWP. It shows that the GWP
over the total mileage of the SUV FC is significantly higher than the GWP of the
comparable petrol and diesel vehicle, when using H2 produced via electrolysis based
on the 2014 Danish electricity mix. Significant reductions can be achieved, when H2
is produced with 100% RE, as in the certified renewable Danish electricity mix from
Table 13, used for the HRSs of Copenhagen in HyTEC. Over the total mileage of
150,000 km, the reduction potential of the SUV FC against the petrol vehicle is
around 43% or ~15 tons CO2-Equiv. Compared to the diesel car, reductions from
around 38% or ~12 tons CO2-Equiv. can be achieved. In addition, the results show
that the break-even of the SUV FC to the conventional vehicles is at around
50,000 km. This means that the higher impacts of the production phase of the SUV
FC are compensated at this mileage due to the lower impacts in the use phase.
Again, this analysis endorses the high relevance of the environmental profile of the
used H2 to the life cycle results and, hence the need for ensuring high shares of RE
in the H2 production pathways to reduce the GWP compared to conventional
vehicles. Furthermore, the results show that FC vehicles have to be used in
appropriate applications and duty cycles, where higher mileages are achieved to tap
the full environmental reduction potential.
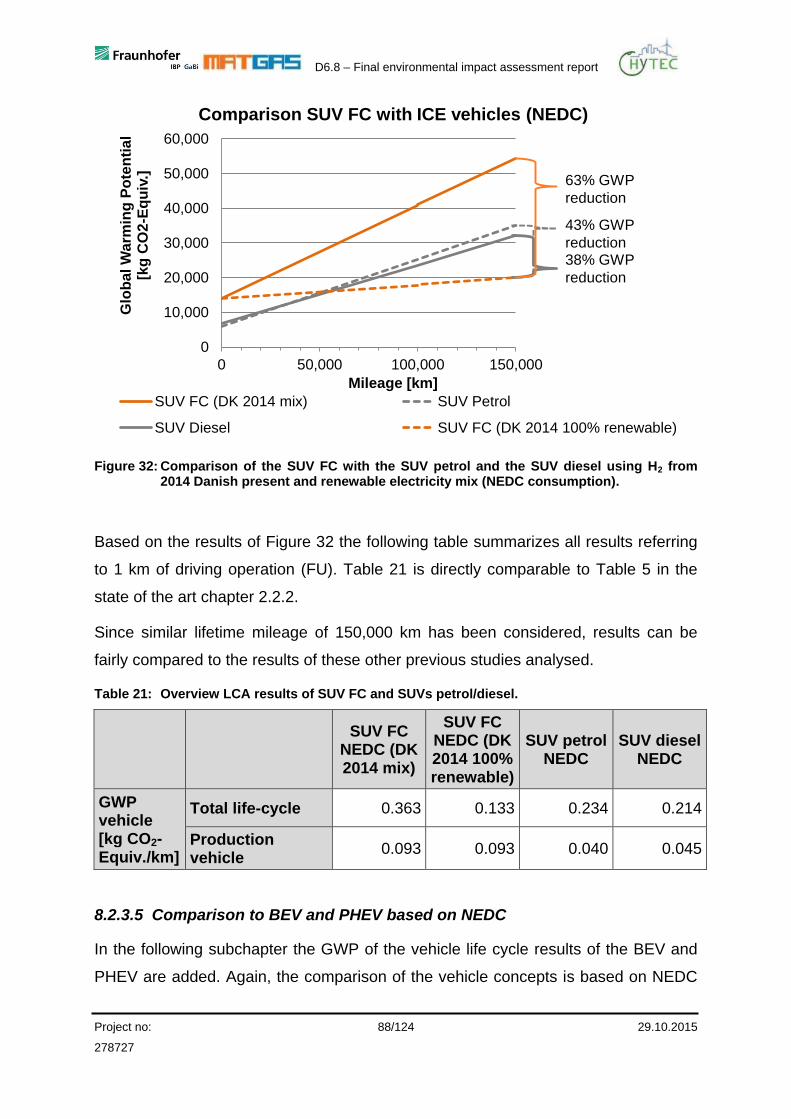
D6.8 – Final environmental impact assessment report
Project no: 88/124 29.10.2015
278727
0
10,000
20,000
30,000
40,000
50,000
60,000
0 50,000 100,000 150,000
Glo
ba
l W
arm
ing
Po
ten
tia
l[k
g C
O2
-Eq
uiv
.]
Mileage [km]
Comparison SUV FC with ICE vehicles (NEDC)
SUV FC (DK 2014 mix) SUV Petrol
SUV Diesel SUV FC (DK 2014 100% renewable)
63% GWP
reduction
43% GWP
reduction38% GWP
reduction
Figure 32: Comparison of the SUV FC with the SUV petrol and the SUV diesel using H2 from 2014 Danish present and renewable electricity mix (NEDC consumption).
Based on the results of Figure 32 the following table summarizes all results referring
to 1 km of driving operation (FU). Table 21 is directly comparable to Table 5 in the
state of the art chapter 2.2.2.
Since similar lifetime mileage of 150,000 km has been considered, results can be
fairly compared to the results of these other previous studies analysed.
Table 21: Overview LCA results of SUV FC and SUVs petrol/diesel.
SUV FC NEDC (DK 2014 mix)
SUV FC NEDC (DK 2014 100% renewable)
SUV petrol NEDC
SUV diesel NEDC
GWP vehicle [kg CO2-Equiv./km]
Total life-cycle 0.363 0.133 0.234 0.214
Production vehicle
0.093 0.093 0.040 0.045
8.2.3.5 Comparison to BEV and PHEV based on NEDC
In the following subchapter the GWP of the vehicle life cycle results of the BEV and
PHEV are added. Again, the comparison of the vehicle concepts is based on NEDC

D6.8 – Final environmental impact assessment report
Project no: 89/124 29.10.2015
278727
consumption values to ensure the comparability. The energy consumption of the BEV
is 14.3 kWh/100 km, the NEDC values of the PHEV are 16.9 kWh/100 km in the EV
mode and 5 l petrol/100 km in the hybrid mode (see chapter 6.2.2). As also described
in chapter 6.2.2, the allocation of the propulsion modes of the PHEV is 58% electric
and 42% hybrid.
26% GWP
reduction
19% GWP
reduction
0
10,000
20,000
30,000
40,000
50,000
60,000
70,000
0 50,000 100,000 150,000
Glo
bal W
arm
ing
Po
ten
tia
l[k
g C
O2
-Eq
uiv
.]
Mileage [km]
Comparison of all vehicles (NEDC)
SUV FC (DK 2014 mix) SUV Petrol
SUV Diesel PHEV (6 kWh) (DK 2014 mix)
BEV (24 kWh) (DK 2014 mix)
Figure 33: Comparison of the SUV FC with all equivalent vehicles using H2 and electricity from 2014 Danish present electricity mix (NEDC consumption).
Figure 33 presents the results of the GWP based on the current H2 production
conditions using the 2014 Danish electricity grid mix. In this case, the SUV FC has
the highest GWP. The steeper slope of the SUV FC curve compared to the BEV and
PHEV is mainly due to the efficiency of the electrolyser, explained by the conversion
losses in the H2 production. The comparison of the BEV and PHEV to the other
vehicles shows that these vehicles have lower contributions to the GWP. The jumps
of the curves at 100,000 km represent the additional impacts related to an exchange
of the battery system. Under the defined boundary conditions, the GWP of the BEV
and PHEV are in a comparable range. The reduction of GWP of the BEV and PHEV
is around 26% compared to the petrol car and around 19% to the diesel car. The
break-even of the BEV and PHEV to the conventional vehicles is at around
D6.8 – Final environmental impact assessment report
Project no: 90/124 29.10.2015
278727
40,000 km. Since the allocation of the operating modes of the PHEV can strongly
vary depending on the specific fields of use and utilization profiles (e.g. city and
urban use vs. long distance trips, driving behaviour etc.), also the resulting
environmental profile of the use phase of the PHEV can strongly vary. Thus, the
assessment of the environmental benefits of PHEVs requires case specific analysis
of investigated fields of use and the consideration of real driving and utilization
profiles to allow reliable conclusions.
Figure 34 shows the results of the investigated vehicles based on the assumption,
that the H2 for the FC-vehicle and the electricity for the BEV and PHEV are produced
with 100% RE (certified renewable Danish electricity mix from Table 13).
0
10,000
20,000
30,000
40,000
50,000
60,000
0 50,000 100,000 150,000
Glo
bal W
arm
ing
Po
ten
tia
l[k
g C
O2
-Eq
uiv
.]
Mileage [km]
Comparison of all vehicles (NEDC) (100% renewable)
SUV Petrol SUV Diesel
SUV FC (DK 2014 100% renewable) PHEV (6kWh) (DK 2014 100% renewable)
BEV (24kWh) (DK 2014 100% renewable)
Figure 34: Comparison of the SUV FC with all equivalent vehicles using H2 and electricity from 2014 Danish renewable electricity mix (NEDC consumption).
In this case, all electric propelled vehicles show reductions of the GWP from around
12-15 tons CO2-Equiv. compared to the diesel vehicle. The GWP of the PHEV and
SUV FC over the mileage of 150,000 km is almost equal; the GWP of the BEV is
slightly lower (but also having a lower total range than the SUV FC and PHEV). The
break-even of the BEV and PHEV is at around 25,000 km, the break-even of the FC
SUV to the conventional vehicles is at around 50,000 km.
D6.8 – Final environmental impact assessment report
Project no: 91/124 29.10.2015
278727
It has to be mentioned that the dimensioning of current available models of BEVs and
PHEVs vary in the sizing of drivetrain components (e.g. energy content of battery
systems), energy consumption and in case of the PHEVs also in the management of
propulsion modes. Therefore the results presented here are intended to show the
magnitudes of the GWP of the vehicle concepts.
The results for all assessed environmental impact categories are shown in the Annex
11.2.2. These results vary strongly mainly depending on the environmental impacts
of the fuel cell and the battery (see chapter 7.2.1) as well as the H2 production
pathways described in chapter 7.1.
Based on the results of Figure 33 and Figure 34 the following table summarizes all
results referring to 1 km of driving operation. Table 22 is directly comparable to Table
5 in the state of the art chapter 2.2.2. The lifetime mileage of 150,000 km considered
in this study allows a direct comparison with the studies summarised in chapter 2.2.
Table 22: Overview LCA results of SUV FC, BEV and PHEV (different electricity mixes).
SUV FC NEDC (DK 2014 mix)
SUV FC NEDC (DK 2014 100%
renew.)
BEV (24kWh) NEDC (DK 2014 mix)
BEV (24kWh)
(DK 2014 100%
renew.)
PHEV (6kWh) NEDC (DK 2014 mix)
PHEV (6kWh)
(DK 2014 100%
renew.)
GWP vehicle [kg CO2-Equiv./km]
Total life-cycle
0.363 0.133 0.172 0.111 0.173 0.130
Production vehicle
0.093 0.093 0.070 0.070 0.055 0.055
8.2.4 End of life
Results presented here should be taken with caution as they may change when
future recycling strategies especially for fuel cells and battery systems are
developed. Like for the London vehicle assessment nevertheless a first overview of
the GWP of the end of life of the SUV FC and the equivalent vehicles is given.
Environmental credits quantify the avoided environmental impacts through material
and energy recycling.
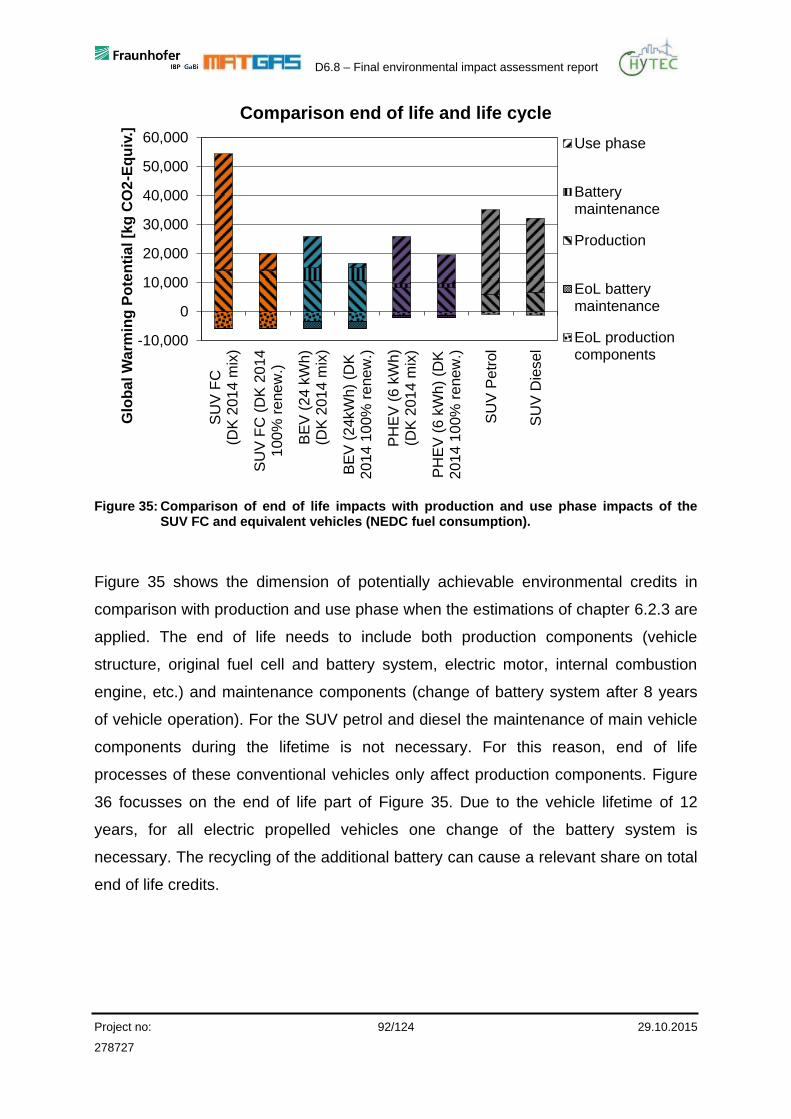
D6.8 – Final environmental impact assessment report
Project no: 92/124 29.10.2015
278727
-10,000
0
10,000
20,000
30,000
40,000
50,000
60,000
SU
V F
C(D
K 2
01
4 m
ix)
SU
V F
C (
DK
20
14
100
% r
ene
w.)
BE
V (
24 k
Wh)
(DK
201
4 m
ix)
BE
V (
24kW
h)
(DK
201
4 1
00%
re
ne
w.)
PH
EV
(6
kW
h)
(DK
201
4 m
ix)
PH
EV
(6
kW
h)
(DK
201
4 1
00%
re
ne
w.)
SU
V P
etr
ol
SU
V D
iese
l
Glo
bal W
arm
ing
Po
ten
tia
l [k
g C
O2
-Eq
uiv
.]Comparison end of life and life cycle
Use phase
Batterymaintenance
Production
EoL batterymaintenance
EoL productioncomponents
Figure 35: Comparison of end of life impacts with production and use phase impacts of the SUV FC and equivalent vehicles (NEDC fuel consumption).
Figure 35 shows the dimension of potentially achievable environmental credits in
comparison with production and use phase when the estimations of chapter 6.2.3 are
applied. The end of life needs to include both production components (vehicle
structure, original fuel cell and battery system, electric motor, internal combustion
engine, etc.) and maintenance components (change of battery system after 8 years
of vehicle operation). For the SUV petrol and diesel the maintenance of main vehicle
components during the lifetime is not necessary. For this reason, end of life
processes of these conventional vehicles only affect production components. Figure
36 focusses on the end of life part of Figure 35. Due to the vehicle lifetime of 12
years, for all electric propelled vehicles one change of the battery system is
necessary. The recycling of the additional battery can cause a relevant share on total
end of life credits.
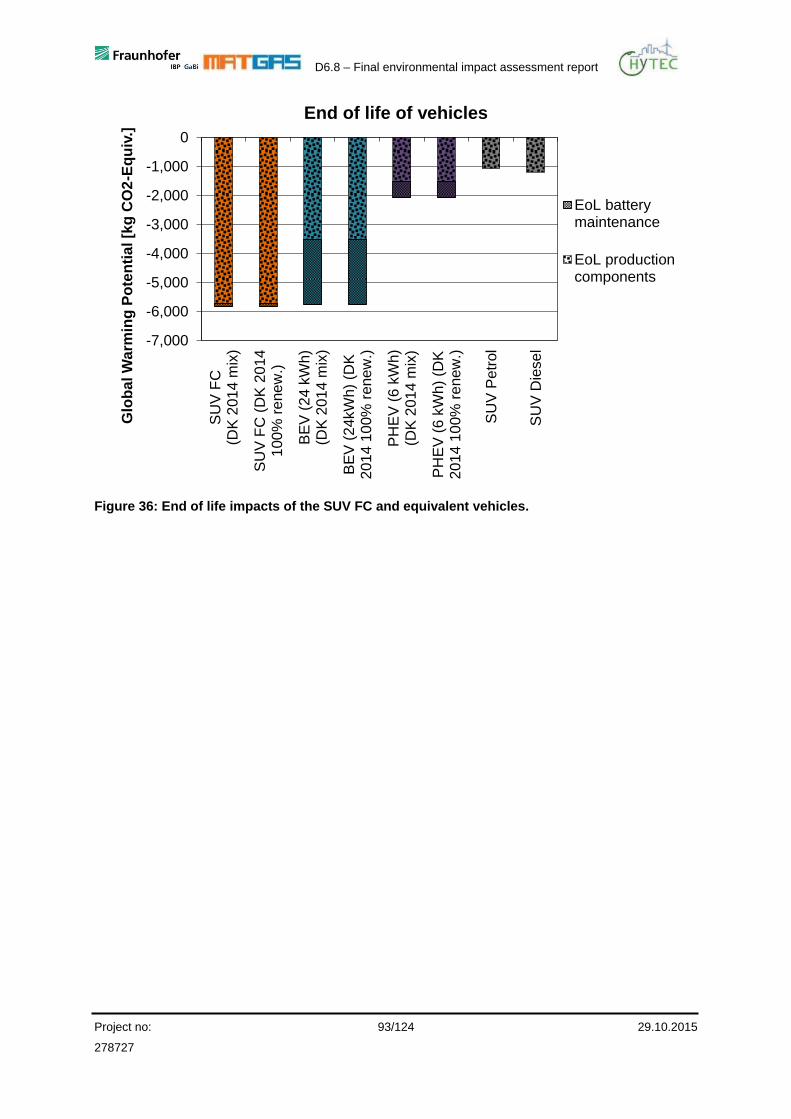
D6.8 – Final environmental impact assessment report
Project no: 93/124 29.10.2015
278727
-7,000
-6,000
-5,000
-4,000
-3,000
-2,000
-1,000
0
SU
V F
C(D
K 2
01
4 m
ix)
SU
V F
C (
DK
20
14
100
% r
ene
w.)
BE
V (
24 k
Wh)
(DK
201
4 m
ix)
BE
V (
24kW
h)
(DK
201
4 1
00%
rene
w.)
PH
EV
(6
kW
h)
(DK
201
4 m
ix)
PH
EV
(6
kW
h)
(DK
201
4 1
00%
re
ne
w.)
SU
V P
etr
ol
SU
V D
iese
l
Glo
bal W
arm
ing
Po
ten
tia
l [k
g C
O2
-Eq
uiv
.]End of life of vehicles
EoL batterymaintenance
EoL productioncomponents
Figure 36: End of life impacts of the SUV FC and equivalent vehicles.

D6.8 – Final environmental impact assessment report
Project no: 94/124 29.10.2015
278727
9 Conclusions
This report (Deliverable 6.8 of the HyTEC Project) summarizes results concerning
the quantitative assessment on the environmental impact of the hydrogen refuelling
infrastructures and the vehicles involved in the project. A comprehensive Life Cycle
Assessment of the use of hydrogen vehicles in urban fleets, compared with other fuel
and driving options was conducted along the project. This included a cradle-to-grave
assessment of the project vehicles and related infrastructure. Data concerning the
production and specifications of the vehicles and infrastructure were provided by the
corresponding partners of the project and complemented with literature data and
available databases, when needed. Comparison with published data on similar
Hydrogen Refuelling Stations (HRS) and vehicles has been made, when possible.
Although only Global Warming Potential (GWP) has been discussed in the core of
the report, the assessment of three more environmental impact categories has been
provided in an annex to complement the study.
Conclusions on the main results are provided separated by the cities.
9.1 London
9.1.1 Hydrogen refuelling station
For the London case two different H2 production routes were assessed: H2 produced
in a central Steam Methane Reformer (SMR) and shipped to London called “base
case” and a hypothetical electrolyser station using Renewable Electricity (RE) called
“wind power”.
The results show that the whole life cycle of dispensing 1 MJ of H2 using the HRS
from Heathrow (London base case), and the upstream processes considered, emits
0.119 kg of CO2-Equiv. These results are in the lower range of GWP values
compared to other literature data, which focused only on the production phase. The
H2 production represents 93.7% of the CO2-Equiv. emissions, followed by the
compression, the production of the station itself and delivery, responsible for 3.9%,
2.2% and 0.2%, respectively. Within the hydrogen production, the operation of the
SMR contributes the most to the GWP, around 57.1%. Electricity used to liquefaction
accounts for 30% and the natural gas supplied as fuel with 3.2%. Note that in the
D6.8 – Final environmental impact assessment report
Project no: 95/124 29.10.2015
278727
published studies the liquefaction phase has been ignored. A credit of 6.6% of the
emissions is obtained from the steam produced from the process.
These results were compared to a diesel and a hypothetical electrolyser station
utilising only wind at an electrolyser efficiency of 66.5% (wind power). Dispensing 1
MJ of diesel emits 0.0131 kg of CO2-Equiv. (11% of the base case), while the H2
produced from wind power, emits 0.0079 kg of CO2-Equiv. (representing 6.6%
compared to the base case).
From this comparison it can be inferred that the environmental performance of HRS
will be superior to diesel, provided the electricity mix comes from RE and the
technology for H2 is also optimized.
9.1.2 Vehicle production
Both assessed project vehicles in London were London taxis, the so-called Black
Cabs. One is equipped with a traditional diesel internal combustion engine; the other
one is converted to be FC propelled. The FC taxi modelling for the LCA is based on a
bill of materials provided by Intelligent Energy which designed the drivetrain of the FC
taxi. In terms of the vehicle production the FC taxi shows higher impacts in the GWP
which is mainly due to the FC system, the battery and to a smaller extent by the H2
tank and the power electronics. The FC system is dominated by the platinum load
which is assumed to be 1 g/kW. Platinum has a high impact due to an energy
intensive raw material extraction and processing of the very rare material due to the
low concentration in the extracted ore. The battery is a lithium nickel manganese
cobalt oxide battery which contains high amounts of high-tech and rare materials.
Similar to platinum, these materials are produced by the use of more energy
intensive extraction and production processes compared to other materials used for
the production of conventional vehicles, such as steel, iron, plastics and non-ferrous
metals.
The production impacts of both battery high-tech materials and platinum occur at
their extraction locations in the respective producing countries. Consequently,
improvements can be carried out at the extraction locations, by more efficient
extracting and processing, or e.g. the use of renewable energy. Local improvements
in Europe could be realized by the implementation of FC / battery / material recycling
D6.8 – Final environmental impact assessment report
Project no: 96/124 29.10.2015
278727
strategies as well as technology developments that allow the reduction or substitution
of required materials. Generally these results show that there are higher impacts in
the production phase and a shift of burden from the locally emission free use phase
to the production phase.
9.1.3 Life cycle
The evaluation of the life cycle including the production and the use phase of the
vehicles, as well as the production of the fuel shows that the largest share in GWP
occurs during the use phase given the 550,000 km lifetime of a taxi. In general, the
impact of the use phase of the FC taxi depends on the amount of fuel used
(consumption) and the fuel supply. The consumption was determined by two
consumption runs where the FC and the diesel taxi were running the same route at
the same time under the same conditions to obtain comparable consumption values.
One route was a fast outer urban run with constant speed and few stops resulting in
a comparably low consumption referred to in this report as “Min” (FC:
1.31 kg H2/100km; diesel: 8.51 l/100km). The other was an inner urban, heavy traffic
route with many stops referred to in this report as “Max” (FC: 1.63 kg H2/100km;
diesel: 11.97 l/100km). The FC taxi had lower emissions compared to the diesel taxi
regarding the GWP in both runs no matter which H2 production route was chosen.
With the Min run the FC taxi emitted 0.236 kg CO2-Equiv./km using the London base
case scenario for H2 production. This results in a 16% reduction compared to the
diesel taxi (0.282 kg CO2-Equiv./km). Using the wind power scenario for the FC taxi
(0.062 kg CO2-Equiv./km) a 78% reduction is possible.
On the one hand, the absolute values for GWP are higher with the Max consumption,
as it can be expected when applying a higher consumption. On the other hand, the
relative GWP reductions compared to the conventional diesel taxi are larger at the
Max consumption as well. This is due to the fact that FC hybrid vehicles are more
efficient at inner urban heavy traffic than diesel ICE vehicles. With the London base
case (0.281 kg CO2-Equiv./km) a GWP reduction of 28% compared to the diesel taxi
(0.390 kg CO2-Equiv./km) is possible. Furthermore, this reduction can be increased
to 83% when using wind power for the hydrogen production (0.065 kg CO2-
Equiv./km).
D6.8 – Final environmental impact assessment report
Project no: 97/124 29.10.2015
278727
Most of the emissions of the diesel taxi are at tail pipe at the location of usage, while
the FC taxi emits only water. The emissions of the FC taxi occur either at the location
the H2 is produced in case of a SMR or at the place the electricity for the electrolyser
is produced. This emission free use phase is especially important for cities like
London which suffer from a high local pollution.
9.2 Copenhagen
9.2.1 Hydrogen refuelling station
The H2 is produced via on-site electrolysis at the HRS in Copenhagen. In this case
the impact mainly depends on the electricity grid mix. Three scenarios of electricity
grid mix were studied in HyTEC for Copenhagen: the current electricity mix (2014), a
certified mix of 100% RE (2014) and a 100% RE scenario set for the year 2023 (go-
green scenario). Two efficiency values of the electrolyser were also considered (58%
and 65%).
Regarding the GWP, the HRS with today’s current mix emits 0.233 kg of CO2-Equiv.,
the 100% RE scenario (current HRS), emits 0.0325 kg of CO2-Equiv. and the go-
green scenario 0.0280 kg of CO2-Equiv. The reduction of 86.1% of the emissions is
due to the source of electricity, while additional 13.8% reduction of the go-green
compared with the 100% RE scenario can be obtained by increasing the electrolyser
efficiency.
The HRS of Copenhagen (go-green scenario) was compared to an electrical charge
station (with RE) and a (optimized and mature technology) petrol station. The results
show that dispensing 1 MJ of H2 using the base case for Copenhagen (go green, η
66.5%), emits 0.0280 kg CO2-Equiv., while delivering electricity (go green) emits
0.0192 kg CO2-Equiv.and delivering 1 MJ of petrol emits 0.0177 kg CO2-Equiv.,
representing 68.5% and 63.2%, respectively, compared to the base case.
9.2.2 Vehicle production
In Copenhagen several vehicles are assessed. The SUV FC is compared to the SUV
diesel and the SUV petrol, a BEV and a PHEV. In terms of the production of the
vehicles the SUV FC has the highest impacts regarding the GWP, followed by the
BEV and the PHEV. This is mainly due to the FC (platinum) and the battery of the
D6.8 – Final environmental impact assessment report
Project no: 98/124 29.10.2015
278727
BEV and PHEV. The conventional vehicles have the lowest impacts in the production
phase. Again the more intensive production phase shifts burden from the locally
emission free use phase to the production phase.
9.2.3 Life cycle
The life cycle includes the production phase of the vehicles, the fuel supply and the
use phase. In Copenhagen only consumption measurements for the SUV FC are
available, which are at 1.28 kg H2/100 km. As there are no measurements for the
other vehicles, the NEDC values are used for comparison reasons, which are
0.95 kg H2/100 km for the SUV FC, 6.8 l/100 km for the SUV petrol, 5.4 l/100 km for
the SUV diesel, 16.9 kWh/100 km and 5.0 l/100 km for the PHEV and
14.3 kWh/100 km for the BEV.
When the SUV FC is compared with the SUV diesel and petrol using H2 produced
with today’s Danish electricity mix the SUV FC shows higher impacts regarding the
GWP than the conventional vehicles. When the H2 is produced with 100% RE the
SUV FC (0.133 kg CO2-Equiv./km) has savings of 43% compared to the SUV petrol
(0.234 kg CO2-Equiv./km) and 38% compared to SUV diesel (0.214 kg CO2-
Equiv./km) over a lifetime of 150,000 km. The break-even point of the SUV FC for
this scenario is around 50,000 km. This means that here the higher impacts of the
production phase are compensated because of the lower impacts in the use phase.
The comparison with the BEV (0.111 kg CO2-Equiv./km) and the PHEV
(0.130 kg CO2-Equiv./km) was carried out using the 100% RE mix. In this case all
electric propelled vehicles are in the same range with the BEV at the lowest. It has to
be mentioned that the dimensioning of currently available models of BEVs and
PHEVs vary in the sizing of drivetrain components (e.g. energy content of battery
systems), energy consumption and in the case of the PHEVs also in the
management of propulsion modes. Therefore, the results presented here are
intended to show the magnitudes of the GWP of the vehicle concepts. Furthermore,
the SUV FC and the BEV are not directly comparable due to the limited driving range
of the BEV. A reliable comparison of the vehicle concepts requires an assessment of
specific use cases and same quality of real measured use profiles, like mileages and
energy consumption.
D6.8 – Final environmental impact assessment report
Project no: 99/124 29.10.2015
278727
9.3 Summary
Generally the FC vehicles show a clearly better environmental performance than
conventional vehicles when using green H2. Using H2 from wind power, a GWP
reduction of up to 83% is possible for a FC taxi compared to a diesel taxi. When H2 is
produced with 100% renewables energy, the SUV FC has savings of up to 43%
compared to conventional powertrains. With fossil based H2 produced in a SMR they
might be better, depending on the actual boundaries, driving conditions and
comparison vehicles. The comparison with the BEV and the PHEV can only be
answered clearly if the use profiles and mileages are clarified. The environmental
profile of the PHEV for example depends on the share of electric drive which
depends on the use profile. The BEV depends also on the use profile. If it is used for
urban areas only with limited mileage and less use time it has less environmental
impact compared to a FC vehicle. However, a London taxi for example may be driven
24/7 by 3 drivers in shifts. This situation is something a BEV is not capable of.
Another advantage of the FC vehicles is the locally emission free use phase. This is
especially important for heavily polluted metropolitan areas like London. However,
there is a shift of burden from the use phase to the production of the vehicles and the
H2 production, which has to be examined further in detail.
D6.8 – Final environmental impact assessment report
Project no: 100/124 29.10.2015
278727
10 References
ADAC e.V. (2015a). Autodatenbank - Ford Focus Electric.
https://www.adac.de/infotestrat/autodatenbank/detail.aspx?KFZID=238074&info=
Ford+Focus+Electric+. Accessed 02 Sep 2015
ADAC e.V. (2015b). Autodatenbank - Renault Fluence Z.E.
https://www.adac.de/infotestrat/autodatenbank/detail.aspx?KFZID=226349&info=
Renault+Fluence+Z.E.+Expression+%2812+-+13%29. Accessed 02 Sep 2015
ADAC e.V. (2015c). Autodatenbank - VW e-Golf.
https://www.adac.de/infotestrat/autodatenbank/detail.aspx?KFZID=240387&info=
VW+e-Golf+. Accessed 02 Sep 2015
Adam Opel AG (2011). Opel Ampera, Rüsselsheim, Germany.
Air Products (2015). SmartFuel® hydrogen supply options.
http://www.airproducts.com/industries/Energy/Hydrogen-
Energy/Transportation.aspx
Anderman, M. (2012). Battery Technologies.
Automobile Catalog (2015). 2010 LTI TX4 performance analysis (up to middle 2010
for Europe ). http://www.automobile-catalog.com/car/2010/338750/lti_tx4.html.
Accessed 24 Aug 2015
Azevedo, L.; Pierre-Olivier, R.; Margnib, M.; Van Zelm, R.; Deschênesb, L.; Mark, A.
and Huijbregtsa, J. (2014). Endpoint characterization factors for terrestrial
acidification, LC-IMPACT.
Baptista, P.; Ribau, J.; Bravo, J.; Silva, C.; Adcock, P.; Kells, A. (2010). Fuel Cell
Hybrid Taxi Well to Wheel Life Cycle Analysis. World Electric Vehicle Journal Vol.
4:798–803.
Barenschee, E. P. (2010). Wie baut man Li-Ionen- batterien? Welche
Herausforderungen sind noch zu lösen?, Munich, Germany.
Baumann, H. & Tillman, A., (2004). The Hitchhiker’s Guide to LCA: An orientation in
Life Cycle Assessment Methodology and Application. Studentlitteratur Sweden.
Bhandari, R.; Trudewind, C. A.; Zapp, P. (2013). Life cycle assessment of hydrogen
production via electrolysis - a review. Journal of Cleaner Production, 85, 151-163.
BMW Group (2013). BMW i3.

D6.8 – Final environmental impact assessment report
Project no: 101/124 29.10.2015
278727
Buchert, M.; Jenseit, W.; Merz, C.; Schüler, D. (2011). Ökobilanz zum „Recycling von
Lithium-Ionen-Batterien“ (LithoRec), Freiburg, Germany.
Cetinkaya, E.; Dincer, I.; Naterer. G.F. (2012). Life cycle assessment of various
hydrogen production Methods. International Journal of Hydrogen Energy 37,
2071-2080.
Daimler AG (2015). Mercedes-Benz models with environmental certificates.
http://www.daimler.com/dccom/0-5-1312394-1-1312442-1-0-0-0-0-0-8-0-0-0-0-0-
0-0-0.html. Accessed 12 March 2014
Dufour, J.; Serrano, D. P.; Gálvez, J. L.; González, A.; Soria, E.; Fierro, J.L.G.
(2012). Life-cycle performance of indirect biomass gasification as a green
alternative to steam methane reforming for hydrogen production. International
Journal of Hydrogen Energy 37, 1173-1183.
Dufour, J.; Serrabim, D.P.; Gálvez, J. L.; Moreno, J.; García, C. (2009). Life Cycle
assessment of process for hydrogen production. Environmental feasibility and
reduction of greenhouse gases emissions. International Journal of Hydrogen
Energy, 34, 1370-1376.
Dynetek Industries Limited (2006). H2 Tanks Dynetek – Specifications, Alberta,
Canada.
Ecoinvent Database (2015). Swiss Centre for Life-Cycle Inventories. Dübendorf,
Switzerland. http://www.ecoinvent.org.
Edwards, R.; Larivé, J.-F.; Beziat, J.-C. (2011). Well-to-wheels Analysis of Future
Automotive Fuels and Powertrains in the European Context, Well-to-Tank Report
Version 3c, European Commission, Joint Research Centre, Institute for Energy
and Transport.
Energinet.dk (2015). RE generation. Electricity generation from wind turbines is the
largest source of renewable energy in the Danish electricity supply.
http://energinet.dk/EN/KLIMA-OG-MILJOE/Miljoerapportering/VE-
produktion/Sider/default.aspx. Accessed 24 Aug 2015
Eriksson M.; Ahlgren, S. (2013). LCAs of petrol and diesel a literature review. Report
2013:058 ISSN 1654-9406, Uppsala, Sweden.
European Aluminium Association (2013). Aluminium Recycling in LCA, Brussels,
Belgium.
D6.8 – Final environmental impact assessment report
Project no: 102/124 29.10.2015
278727
European Community (2000). Directive 2000/53/EC of the European Parliament and
of the Council of 18 September 2000 on end-of life vehicles. DIRECTIVE
2000/53/EC
European Community (2006). DIRECTIVE 2006/66/EC OF THE EUROPEAN
PARLIAMENT AND OF THE COUNCIL of 6 September 2006 on batteries and
accumulators and waste batteries and accumulators and repealing Directive
91/157/EEC. Directive 2006/66/EC
Faria, R.; Marques, P.; Moura, P.; Freire, F.; Delgado, J. and de Almeida, A. T. 2013.
Impact of the electricity mix and use profile in the life-cycle assessment of electric
vehicles. Renewable and Sustainable Energy Reviews 24(0):271–287.
Ford (2013). Ford Focus Electric, Brentwood, Essex, England.
Gaines, L.; Cuenca, R. (2000). Costs of Lithium-Ion Batteries for Vehicles, Argonne,
Illinois, USA.
Gaines, L.; Dunn J. (2012). Comparison of Li-Ion Battery Recycling Processes by
Life-Cycle Analysis, Baltimore, Maryland, USA.
Gao, L.; Winfield, Z. C. (2012). Life Cycle Assessment of Environmental and
Economic Impacts of Advanced Vehicles. Energies 5(12):605–620.
doi: 10.3390/en5030605
Garraín, D.; Lechón, Y. (2014). Exploratory environmental impact assessment of the
manufacturing and disposal stages of a new PEM fuel cell. International Journal
of Hydrogen Energy 39(4):1769–1774. doi: 10.1016/j.ijhydene.2013.11.095
Granovskii, M.; Dincer, I.; Rosen, M. A. (2006). Economic and environmental
comparison of conventional, hybrid, electric and hydrogen fuel cell vehicles.
Journal of Power Sources 159(2):1186–1193.
doi: 10.1016/j.jpowsour.2005.11.086
Group Lotus PLC (2015). Case Study: Hydrogen Fuel Cell Taxi. Zero emission fuel
cell taxi. http://www.lotuscars.com/gb/engineering/case-study-hydrogen-fuel-cell-
taxi. Accessed 24 Aug 2015
H2moves Scandinavia (2013). FINAL TECHNICAL REPORTING. 5th and last
reporting period.
D6.8 – Final environmental impact assessment report
Project no: 103/124 29.10.2015
278727
Heyne, D. (2013). Ford C-Max Plug-in-Hybrid im Fahrbericht. http://www.auto-motor-
und-sport.de/fahrberichte/ford-c-max-plug-in-hybrid-ueberzeugend-auch-mit-
doppelherz-7483297.html. Accessed 26 Sep 2013
Hussain, M. M.; Dincer, I.; Li, X. (2007). A preliminary life cycle assessment of PEM
fuel cell powered automobiles. Applied Thermal Engineering 27(13):2294–2299.
doi: 10.1016/j.applthermaleng.2007.01.015
Hydrogen Link Denmark (2013). National Network for Advancing Hydrogen
Transportation. http://www.hydrogenlink.net/eng/
Hydrogen Transport in European Cities (HyTEC) Website. www.hy-tec.eu. Accessed
10 March 2014
Hyundai Motor Deutschland GmbH (2013a). Hyundai ix35, Offenbach, Germany.
Hyundai Motor Deutschland GmbH (2013b). ix35 FCEV. Wasserstoffbetriebenes
Brennstoffzellenfahrzeug, Offenbach, Germany.
INFRAS AG (2014). HBEFA - Handbook Emission Factors for Road Transport, Bern,
Switzerland.
Intelligent Energy Ltd. (2015). Intelligent Energy. http://www.intelligent-energy.com/.
Accessed 24 Aug 2015
International Battery Inc. (2010). Lithium Nickel Cobalt Manganese Oxide. Material
Safety Data Sheet, Allentown, Pennsylvania, USA.
Ishihara, K.; Kihira, N.; Terada, N.; Iwahori, T. (1999). Environmental burdens of
Large Lithium-Ion Batteries Developed in a Japanese National Project, Tokyo,
Japan.
ISO (2006a). Environmental management - life cycle assessment - Principles and
framework(14040). Accessed 19 Feb 2014
ISO (2006b). Environmental management - life cycle assessment - Requirements
and guidelines(14044). Accessed 05 Dec 2013
Keesom, B.; Blieszner, J.; Unnasch, S. (2012). EU Pathway Study: Life Cycle
Assessment of Crude Oils in a European Context, Executive Summary, Jacobs
Consultancy, Calgary, Canada.
Kintner-Meyer, M.; Schneider, K. and Pratt, R. 2007. Impacts assessment of plug-in
hybrid vehicles on electric utilities and regional U.S. power grids – Part 1:
D6.8 – Final environmental impact assessment report
Project no: 104/124 29.10.2015
278727
Technical analysis. Available at:
http://energyenvironment.pnnl.gov/ei/pdf/PHEV_Feasibility_Analysis_Part1.pdf
Kokam Co., L. (2005). Material Safety Data Sheet. Superior Lithium Polymer Battery,
Gayagok-myeon, South Korea.
Koroneos, C.; Dompros, A.; Roumbas, G.; Moussiopoulos, N. (2004). Life cycle
assessment of hydrogen fuel production processes. International Journal of
Hydrogen Energy 29, 1443-1450.
Lindegger, M.; Biner, H.-P.; Evéquoz, B.; Salathé, D. (2009). Economic viability,
applications and limits of efficient permanent magnet motors, Gümlingen,
Switzerland.
Lozanovski, A.; Schuller, O.; Faltenbacher, M. (2011). FC-HyGuide - Guidance
Document for performing LCAs on Fuel Cells and H2 Technologies.
Manish, S.; Banerjee, R. (2008). Comparison of biohydrogen production processes
International Journal of Hydrogen Energy 33, 279 – 286.
McKinsey & Company (2010). A portfolio of power-trains for Europe: a fact-based
analysis. The role of Battery Electric Vehicles, Plug-In Hybrids and Fuel Cell
Electric Vehicles.
Meneses, M.; Pasqualino, J. C. and Castells, F. (2010). Environmental assessment
of urban wastewater reuse: Treatment alternatives and applications.
Chemosphere 81: 266–272
Merino Azcárraga, J.M. (ed.) (2006). Hidrógeno y energias renovables: Nuevas
tecnologías para la sostenibilidad. Parque Tecnológico de Bizkaia: Tecnalia,
ISBN 84-609-8899-6.
Nissan (2013). Der neue Nissan LEAF. http://www.nissan.de/DE/de/vehicle/electric-
vehicles/leaf/prices-and-equipment/prices-and-specifications/model-
details.106541_105000_105302.html. Accessed 26 Sep 2013
Notter, D. A.; Kouravelou, K.; Karachalios, T.; Daletou, M. K.; Haberland, N. T.
(2015). Life cycle assessment of PEM FC applications: electric mobility and μ-
CHP. Energy Environ. Sci. 8(7):1969–1985. doi: 10.1039/c5ee01082a
Pehnt, M. (2001). Life-cycle assessment of fuel cell stacks. International Journal of
Hydrogen Energy(26):91–101.
D6.8 – Final environmental impact assessment report
Project no: 105/124 29.10.2015
278727
Pehnt, M. (2002a). Energierevolution Brennstoffzelle? Perspektiven, Fakten,
Anwendungen. Erlebnis Wissenschaft, Wiley-VCH, Weinheim, Germany.
Pehnt, M. (2002b). Ganzheitliche Bilanzierung von Brennstoffzellen in der Energie-
und Verkehrstechnik, Als Ms. gedr. Energietechnik, vol 476. VDI-Verl.,
Düsseldorf, Germany.
Pehnt, M. (2003a). Assessing future energy and transport systems: the case of fuel
cells. Part I: Methodological Aspects. The International Journal of Life Cycle
Assessment (8(5)).
Pehnt, M. (2003b). Assessing future energy and transport systems: the case of fuel
cells. Part II: Environmental Performance. The International Journal of Life Cycle
Assessment (8(6)):365–378.
Pehnt, M. (2003c). Life-cycle analysis of fuel cell system components. In: Vielstich W
(ed) Handbook of Fuel Cells. Fundamentals, Technology and Applications, vol 4.
John Wiley and Sons, Chichester, pp 1293–1317.
Perimenis, A.; Majer, S.; Zech, K.; Holland, M.; Müller-Langer, F. (2010). Lifecycle
Assessment of Transportation Fuels, Deliverable D5 (WP 4 report), German
Biomass Research Centre, Leipzig, Germany.
PRé Consultants. 2015. B.V., Amersfoort, The Netherlands. http://www.pre-
sustainability.com/simapro.
Renault (2013). Renault Fluence Z.E. http://www.renault-
preislisten.de/fileadmin/user_upload/Broschuere_Fluence_ZE.pdf. Accessed 26
Sep 2013
Ruiz, P.; Vega, L.F.; Jiménez, C.; Arxer, M.M.; Rausa, A. (2015). Hydrogen:
applications and safety considerations, 200 pages. ISBN: 978-84-606-5978-5,
L.D: B 4702-2015.
Schäfer, T. (2009). Li-Tec Battery - made in Germany! Large scale Li-ion batteries for
industrial and automotive applications.
Schoenung S. 2002. Hydrogen technical analysis on matters being considered by the
international energy agency – Transportation infrastructure” Proceedings of the
2002 U.S. DOE Hydrogen Program Review, NREL/CP-610-32405. Available at:
http://www1.eere.energy.gov/hydrogenandfuelcells/pdfs/32405b13.pdf.
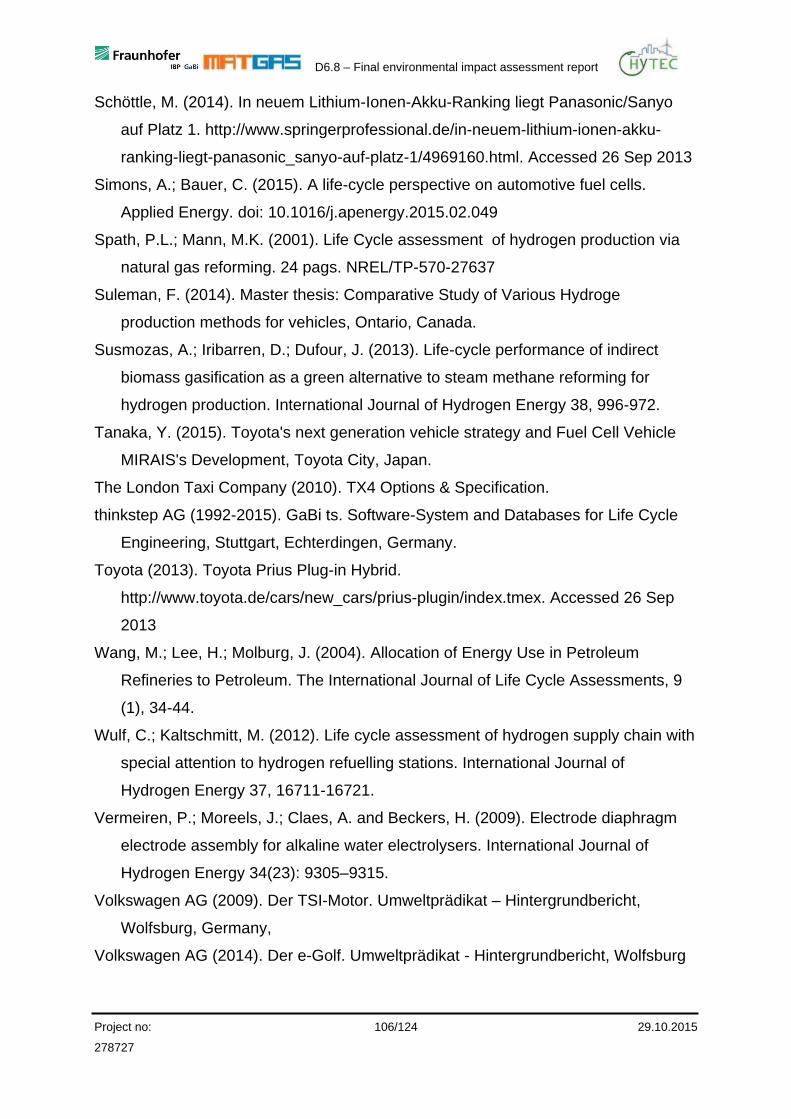
D6.8 – Final environmental impact assessment report
Project no: 106/124 29.10.2015
278727
Schöttle, M. (2014). In neuem Lithium-Ionen-Akku-Ranking liegt Panasonic/Sanyo
auf Platz 1. http://www.springerprofessional.de/in-neuem-lithium-ionen-akku-
ranking-liegt-panasonic_sanyo-auf-platz-1/4969160.html. Accessed 26 Sep 2013
Simons, A.; Bauer, C. (2015). A life-cycle perspective on automotive fuel cells.
Applied Energy. doi: 10.1016/j.apenergy.2015.02.049
Spath, P.L.; Mann, M.K. (2001). Life Cycle assessment of hydrogen production via
natural gas reforming. 24 pags. NREL/TP-570-27637
Suleman, F. (2014). Master thesis: Comparative Study of Various Hydroge
production methods for vehicles, Ontario, Canada.
Susmozas, A.; Iribarren, D.; Dufour, J. (2013). Life-cycle performance of indirect
biomass gasification as a green alternative to steam methane reforming for
hydrogen production. International Journal of Hydrogen Energy 38, 996-972.
Tanaka, Y. (2015). Toyota's next generation vehicle strategy and Fuel Cell Vehicle
MIRAIS's Development, Toyota City, Japan.
The London Taxi Company (2010). TX4 Options & Specification.
thinkstep AG (1992-2015). GaBi ts. Software-System and Databases for Life Cycle
Engineering, Stuttgart, Echterdingen, Germany.
Toyota (2013). Toyota Prius Plug-in Hybrid.
http://www.toyota.de/cars/new_cars/prius-plugin/index.tmex. Accessed 26 Sep
2013
Wang, M.; Lee, H.; Molburg, J. (2004). Allocation of Energy Use in Petroleum
Refineries to Petroleum. The International Journal of Life Cycle Assessments, 9
(1), 34-44.
Wulf, C.; Kaltschmitt, M. (2012). Life cycle assessment of hydrogen supply chain with
special attention to hydrogen refuelling stations. International Journal of
Hydrogen Energy 37, 16711-16721.
Vermeiren, P.; Moreels, J.; Claes, A. and Beckers, H. (2009). Electrode diaphragm
electrode assembly for alkaline water electrolysers. International Journal of
Hydrogen Energy 34(23): 9305–9315.
Volkswagen AG (2009). Der TSI-Motor. Umweltprädikat – Hintergrundbericht,
Wolfsburg, Germany,
Volkswagen AG (2014). Der e-Golf. Umweltprädikat - Hintergrundbericht, Wolfsburg

D6.8 – Final environmental impact assessment report
Project no: 107/124 29.10.2015
278727
Volkswagen AG (2015). Environmental Commendations.
http://en.volkswagen.com/en/company/responsibility/environmental_commendati
ons.html. Accessed 21 Aug 2015
D6.8 – Final environmental impact assessment report
Project no: 108/124 29.10.2015
278727
11 Annex
11.1 London results
11.1.1 Hydrogen refuelling stations
11.1.1.1 Acidification Potential
Figure 37 shows the contribution to the acidification potential category, of different
phases of the energy dispensed using the HRS, HRS (Only wind) and diesel Station.
0
0.05
0.1
0.15
0.2
0.25
0.3
HR
S
HR
S (
On
lyW
ind
)
Die
se
l
Ac
idif
ica
tio
n P
ote
nti
al
[kg
SO
2-E
qu
iv./
MJ
]
Acidification London
Transport
Delivery
Station
Compression
Production
Figure 37: Contributions of the different phases of fuel production for the London case, to the Acidification Category, measured in kg of SO2-Equiv../ MJ of energy.
The LCIA shows that the whole life cycle of dispensing 1MJ of hydrogen using the
London HRS emits 0.00025 kg of SO2-Equiv.. Compared to the diesel and HRS -
(only wind) station, corresponding to 59% and 21% of the emissions of the base case
scenario, respectively.
In the case of the HRS, the H2 production is responsible of the 86.8%, the transport
0.52% the station itself 6.39%, and the delivery 6.27% In the case of the HRS – Only
wind; emissions are also directly associated to the fraction of the electricity used for
the stages, with the 80.7%, 7.90%, 9.84% and 1.58% corresponding to the
production, compression, station and delivery, respectively. In the case of the diesel
D6.8 – Final environmental impact assessment report
Project no: 109/124 29.10.2015
278727
station, 95% of the emissions are associated to the production, 4.87% to the
transportation 2.68% to the station itself and 0.089% to the delivery of the fuel.
11.1.1.2 Eutrophication Potential
Figure 38 shows the contribution to EP category, of different phases of the energy
dispensed using the HRS, HRS (only wind) and diesel Station.
The LCIA shows that the whole life cycle of dispensing 1MJ of hydrogen using the
London HRS emits 0.00015 kg of PO4-Equiv. Compared to the diesel and HRS -
(only wind) station, corresponding to 14.64% and 11.92% of the emissions of the
base case scenario, respectively.
In the case of the HRS, the production is responsible of the 90%, the transport
0.23%, the station itself 6.31%, and the delivery 3.46%. The EP is also heavily
influenced by the electricity used in operation and liquefaction phase of the hydrogen,
accounting for 0.00015 kg of PO4-Equiv./MJ of H2, from this 13% is associated to the
electricity used in the plant and the other 85%, to the energy used for liquefaction.
In the case of the HRS – Only wind; emissions are also directly associated to the
fraction of the electricity used for the stages, with the 87.8%, 8.64%, 1.84 % and
1.73% corresponding to the production, compression, station and delivery,
respectively. Finally, in the case of the diesel station, 91.10% of the emissions are
associated to the production, mainly influenced by the oil, heavy fuel, electricity and
naphta, 8.51% to the transportation 1.52% to the station itself and 0.19% to the
delivery of the fuel.

D6.8 – Final environmental impact assessment report
Project no: 110/124 29.10.2015
278727
0
0.02
0.04
0.06
0.08
0.1
0.12
0.14
0.16
0.18
Petr
ol
Ele
ctr
icity -
Go g
reen
H2
Go
gre
en –
66
.5%
Eu
tro
ph
ica
tio
n P
ote
nti
al
[g P
ho
sp
ha
te-E
qu
iv./
MJ
]
Eutrophication London
Transport
Delivery
Station
Compression
Production
Figure 38: Contributions of the different phases of fuel production for the London case, to the EP Category, measured in kg of PO4-Equiv./ MJ of energy.
11.1.1.3 Photochemical Ozone Creation Potential
Figure 39 depicts the contribution to POCP, of the different phases of the energy
dispensed using the HRS, HRS (Only wind) and diesel Station.
The LCIA shows that the whole life cycle of dispensing 1MJ of hydrogen using the
London HRS emits 0.000011 kg of Ethene-Equiv. compared to the diesel and HRS -
(only wind) station, corresponding to 76.69% and 27.98% of the emissions of the
base case scenario,respectively).
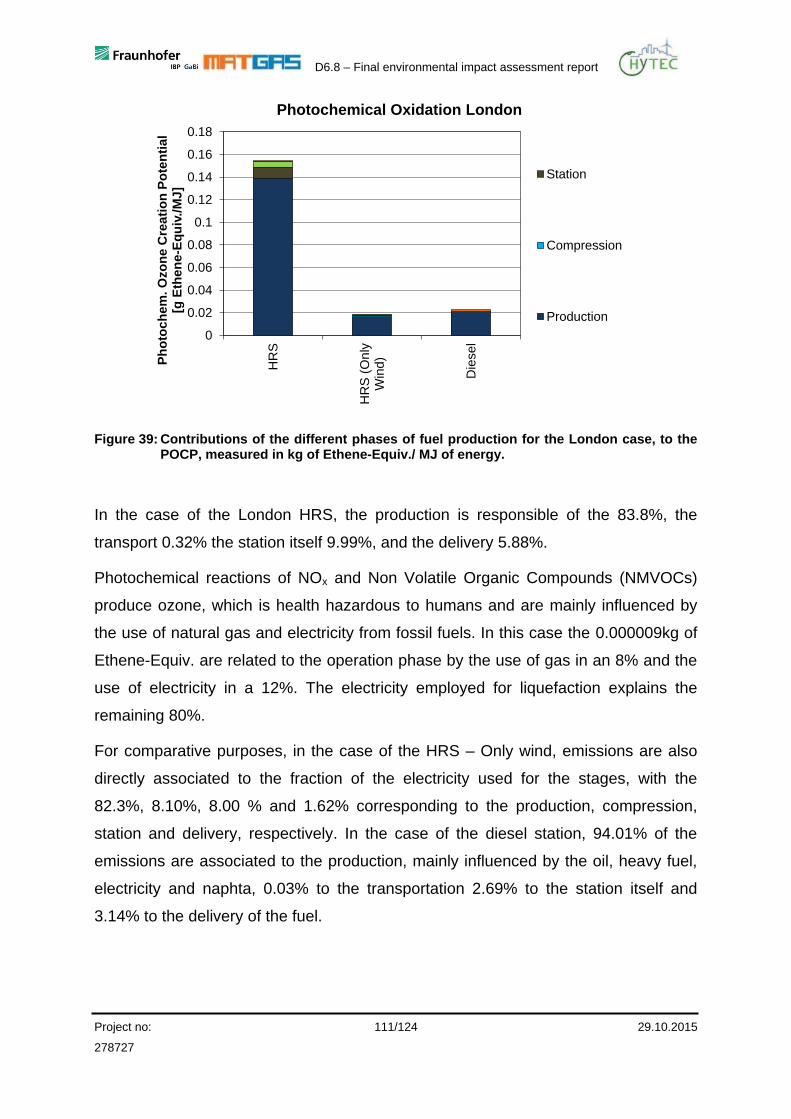
D6.8 – Final environmental impact assessment report
Project no: 111/124 29.10.2015
278727
0
0.02
0.04
0.06
0.08
0.1
0.12
0.14
0.16
0.18
HR
S
HR
S (
On
lyW
ind
)
Die
sel
Ph
oto
ch
em
. O
zo
ne
Cre
ati
on
Po
ten
tia
l [g
Eth
en
e-E
qu
iv./
MJ
]
Photochemical Oxidation London
Station
Compression
Production
Figure 39: Contributions of the different phases of fuel production for the London case, to the POCP, measured in kg of Ethene-Equiv./ MJ of energy.
In the case of the London HRS, the production is responsible of the 83.8%, the
transport 0.32% the station itself 9.99%, and the delivery 5.88%.
Photochemical reactions of NOx and Non Volatile Organic Compounds (NMVOCs)
produce ozone, which is health hazardous to humans and are mainly influenced by
the use of natural gas and electricity from fossil fuels. In this case the 0.000009kg of
Ethene-Equiv. are related to the operation phase by the use of gas in an 8% and the
use of electricity in a 12%. The electricity employed for liquefaction explains the
remaining 80%.
For comparative purposes, in the case of the HRS – Only wind, emissions are also
directly associated to the fraction of the electricity used for the stages, with the
82.3%, 8.10%, 8.00 % and 1.62% corresponding to the production, compression,
station and delivery, respectively. In the case of the diesel station, 94.01% of the
emissions are associated to the production, mainly influenced by the oil, heavy fuel,
electricity and naphta, 0.03% to the transportation 2.69% to the station itself and
3.14% to the delivery of the fuel.
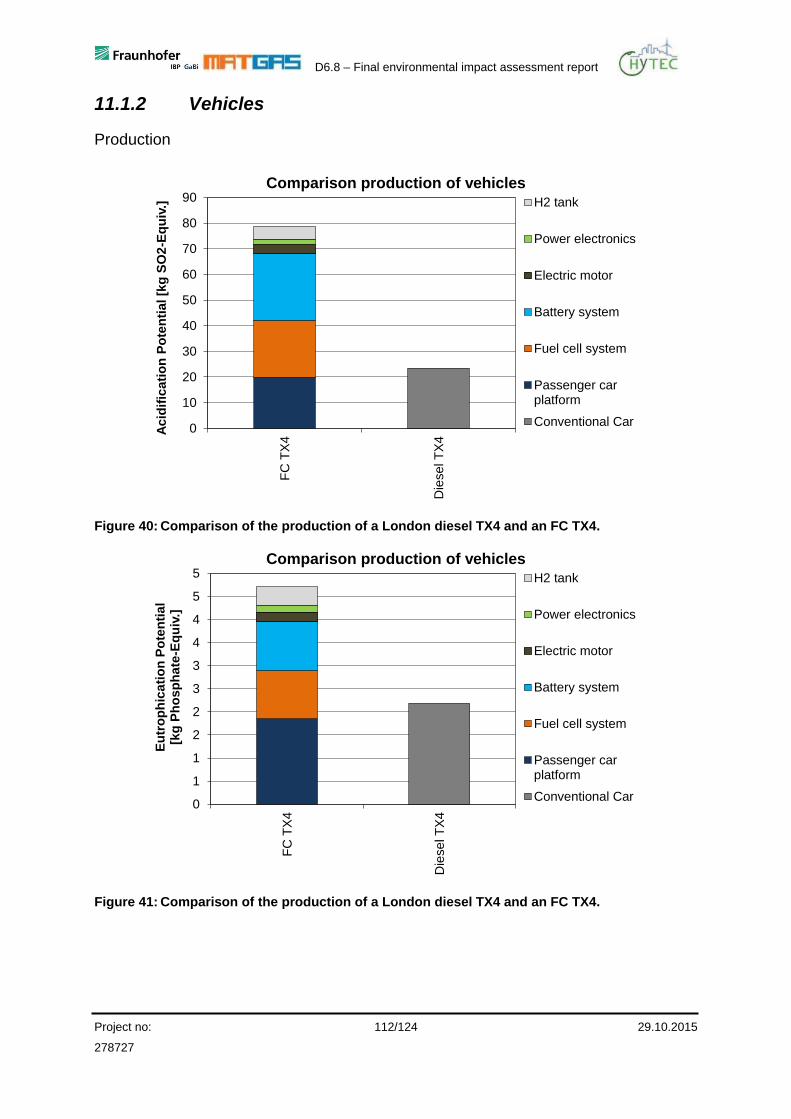
D6.8 – Final environmental impact assessment report
Project no: 112/124 29.10.2015
278727
11.1.2 Vehicles
Production
0
10
20
30
40
50
60
70
80
90
FC
TX
4
Die
se
l T
X4
Acid
ific
ati
on
Po
ten
tial [k
g S
O2
-Eq
uiv
.]
Comparison production of vehicles
H2 tank
Power electronics
Electric motor
Battery system
Fuel cell system
Passenger carplatform
Conventional Car
Figure 40: Comparison of the production of a London diesel TX4 and an FC TX4.
0
1
1
2
2
3
3
4
4
5
5
FC
TX
4
Die
se
l T
X4
Eu
tro
ph
ica
tio
n P
ote
nti
al
[kg
Ph
os
ph
ate
-Eq
uiv
.]
Comparison production of vehicles
H2 tank
Power electronics
Electric motor
Battery system
Fuel cell system
Passenger carplatform
Conventional Car
Figure 41: Comparison of the production of a London diesel TX4 and an FC TX4.
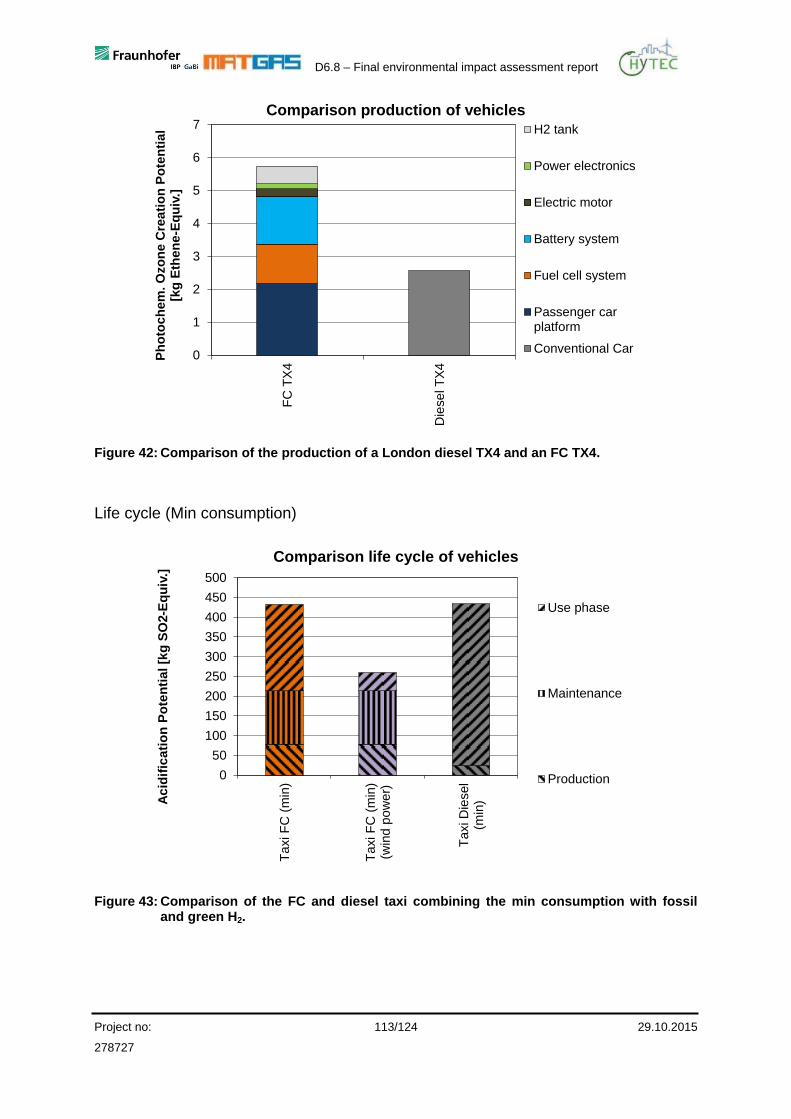
D6.8 – Final environmental impact assessment report
Project no: 113/124 29.10.2015
278727
0
1
2
3
4
5
6
7
FC
TX
4
Die
se
l T
X4
Ph
oto
ch
em
. O
zo
ne
Cre
ati
on
Po
ten
tia
l [k
g E
the
ne
-Eq
uiv
.]
Comparison production of vehicles
H2 tank
Power electronics
Electric motor
Battery system
Fuel cell system
Passenger carplatform
Conventional Car
Figure 42: Comparison of the production of a London diesel TX4 and an FC TX4.
Life cycle (Min consumption)
0
50
100
150
200
250
300
350
400
450
500
Ta
xi F
C (
min
)
Ta
xi F
C (
min
)(w
ind
po
we
r)
Ta
xi D
iesel
(min
)Ac
idif
ica
tio
n P
ote
nti
al [k
g S
O2-E
qu
iv.]
Comparison life cycle of vehicles
Use phase
Maintenance
Production
Figure 43: Comparison of the FC and diesel taxi combining the min consumption with fossil and green H2.
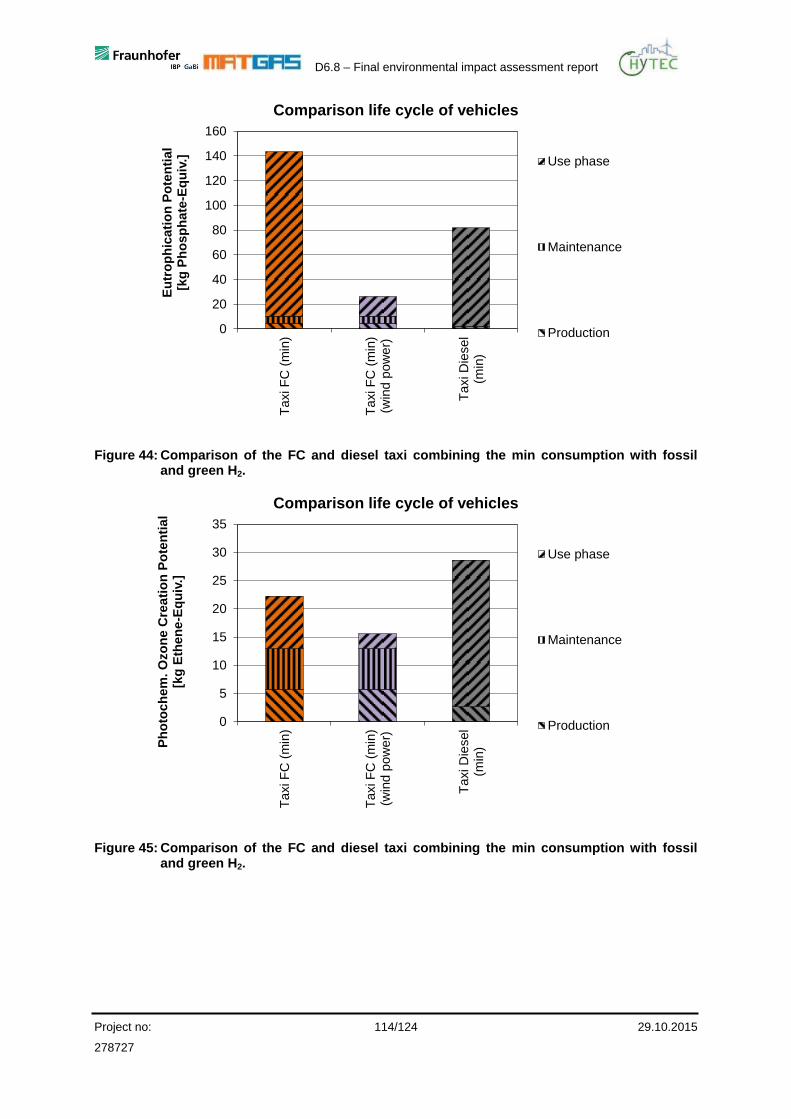
D6.8 – Final environmental impact assessment report
Project no: 114/124 29.10.2015
278727
0
20
40
60
80
100
120
140
160
Ta
xi F
C (
min
)
Ta
xi F
C (
min
)(w
ind
po
we
r)
Ta
xi D
iesel
(min
)
Eu
tro
ph
ica
tio
n P
ote
nti
al
[kg
Ph
os
ph
ate
-Eq
uiv
.]
Comparison life cycle of vehicles
Use phase
Maintenance
Production
Figure 44: Comparison of the FC and diesel taxi combining the min consumption with fossil and green H2.
0
5
10
15
20
25
30
35
Ta
xi F
C (
min
)
Ta
xi F
C (
min
)(w
ind
po
we
r)
Ta
xi D
iesel
(min
)Ph
oto
ch
em
. O
zo
ne
Cre
ati
on
Po
ten
tia
l[k
g E
the
ne
-Eq
uiv
.]
Comparison life cycle of vehicles
Use phase
Maintenance
Production
Figure 45: Comparison of the FC and diesel taxi combining the min consumption with fossil and green H2.
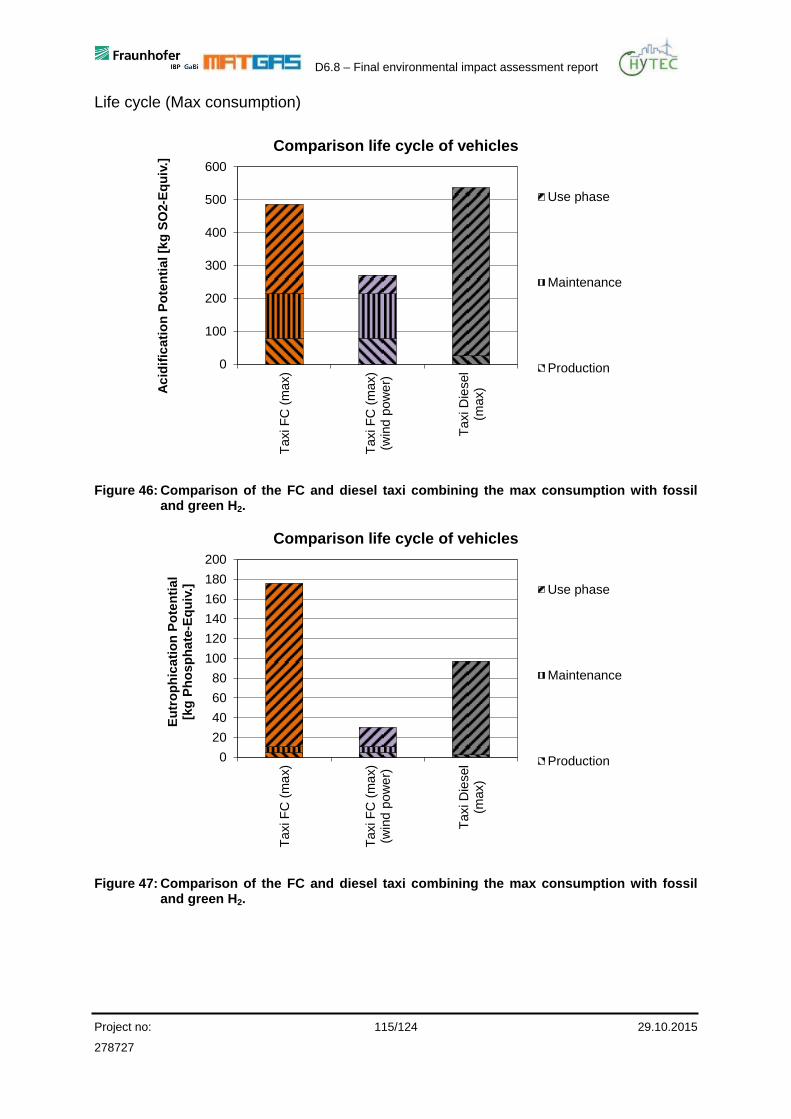
D6.8 – Final environmental impact assessment report
Project no: 115/124 29.10.2015
278727
Life cycle (Max consumption)
0
100
200
300
400
500
600
Ta
xi F
C (
ma
x)
Ta
xi F
C (
ma
x)
(win
d p
ow
er)
Ta
xi D
iesel
(max)Ac
idif
ica
tio
n P
ote
nti
al [k
g S
O2-E
qu
iv.]
Comparison life cycle of vehicles
Use phase
Maintenance
Production
Figure 46: Comparison of the FC and diesel taxi combining the max consumption with fossil and green H2.
0
20
40
60
80
100
120
140
160
180
200
Ta
xi F
C (
ma
x)
Ta
xi F
C (
ma
x)
(win
d p
ow
er)
Ta
xi D
iesel
(max)
Eu
tro
ph
ica
tio
n P
ote
nti
al
[kg
Ph
os
ph
ate
-Eq
uiv
.]
Comparison life cycle of vehicles
Use phase
Maintenance
Production
Figure 47: Comparison of the FC and diesel taxi combining the max consumption with fossil and green H2.
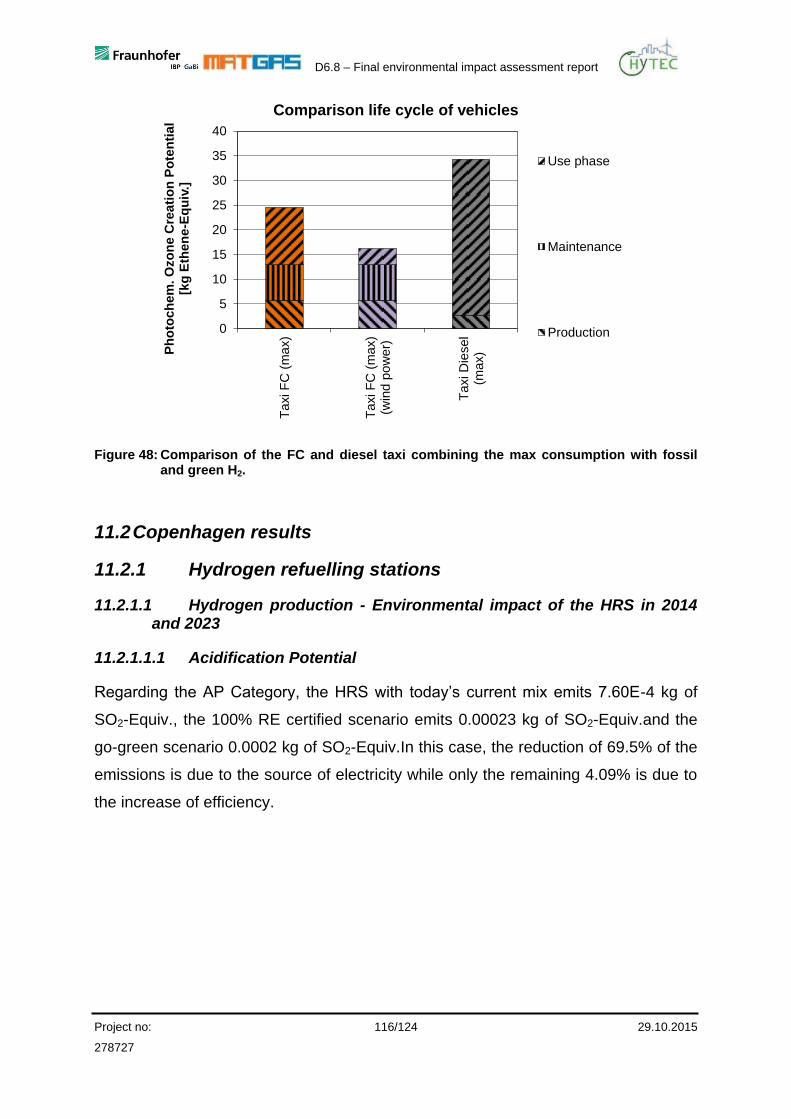
D6.8 – Final environmental impact assessment report
Project no: 116/124 29.10.2015
278727
0
5
10
15
20
25
30
35
40
Ta
xi F
C (
ma
x)
Ta
xi F
C (
ma
x)
(win
d p
ow
er)
Ta
xi D
iesel
(max)P
ho
toc
he
m. O
zo
ne
Cre
ati
on
Po
ten
tia
l [k
g E
the
ne
-Eq
uiv
.]
Comparison life cycle of vehicles
Use phase
Maintenance
Production
Figure 48: Comparison of the FC and diesel taxi combining the max consumption with fossil and green H2.
11.2 Copenhagen results
11.2.1 Hydrogen refuelling stations
11.2.1.1 Hydrogen production - Environmental impact of the HRS in 2014 and 2023
11.2.1.1.1 Acidification Potential
Regarding the AP Category, the HRS with today’s current mix emits 7.60E-4 kg of
SO2-Equiv., the 100% RE certified scenario emits 0.00023 kg of SO2-Equiv.and the
go-green scenario 0.0002 kg of SO2-Equiv.In this case, the reduction of 69.5% of the
emissions is due to the source of electricity while only the remaining 4.09% is due to
the increase of efficiency.
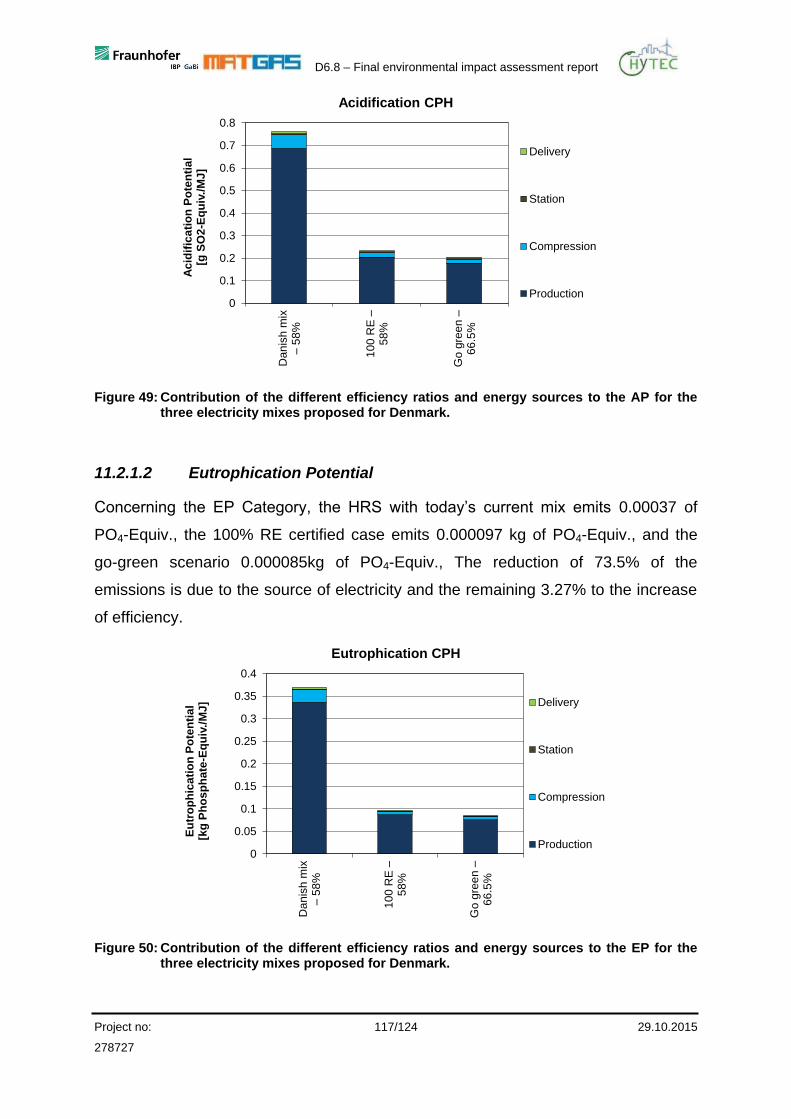
D6.8 – Final environmental impact assessment report
Project no: 117/124 29.10.2015
278727
0
0.1
0.2
0.3
0.4
0.5
0.6
0.7
0.8
Da
nis
h m
ix
–5
8%
10
0 R
E –
58
%
Go
gre
en
–66
.5%
Ac
idif
ica
tio
n P
ote
nti
al
[g S
O2
-Eq
uiv
./M
J]
Acidification CPH
Delivery
Station
Compression
Production
Figure 49: Contribution of the different efficiency ratios and energy sources to the AP for the three electricity mixes proposed for Denmark.
11.2.1.2 Eutrophication Potential
Concerning the EP Category, the HRS with today’s current mix emits 0.00037 of
PO4-Equiv., the 100% RE certified case emits 0.000097 kg of PO4-Equiv., and the
go-green scenario 0.000085kg of PO4-Equiv., The reduction of 73.5% of the
emissions is due to the source of electricity and the remaining 3.27% to the increase
of efficiency.
0
0.05
0.1
0.15
0.2
0.25
0.3
0.35
0.4
Da
nis
h m
ix
–5
8%
10
0 R
E –
58
%
Go
gre
en
–6
6.5
%
Eu
tro
ph
ica
tio
n P
ote
nti
al
[kg
Ph
osp
ha
te-E
qu
iv./
MJ
]
Eutrophication CPH
Delivery
Station
Compression
Production
Figure 50: Contribution of the different efficiency ratios and energy sources to the EP for the three electricity mixes proposed for Denmark.
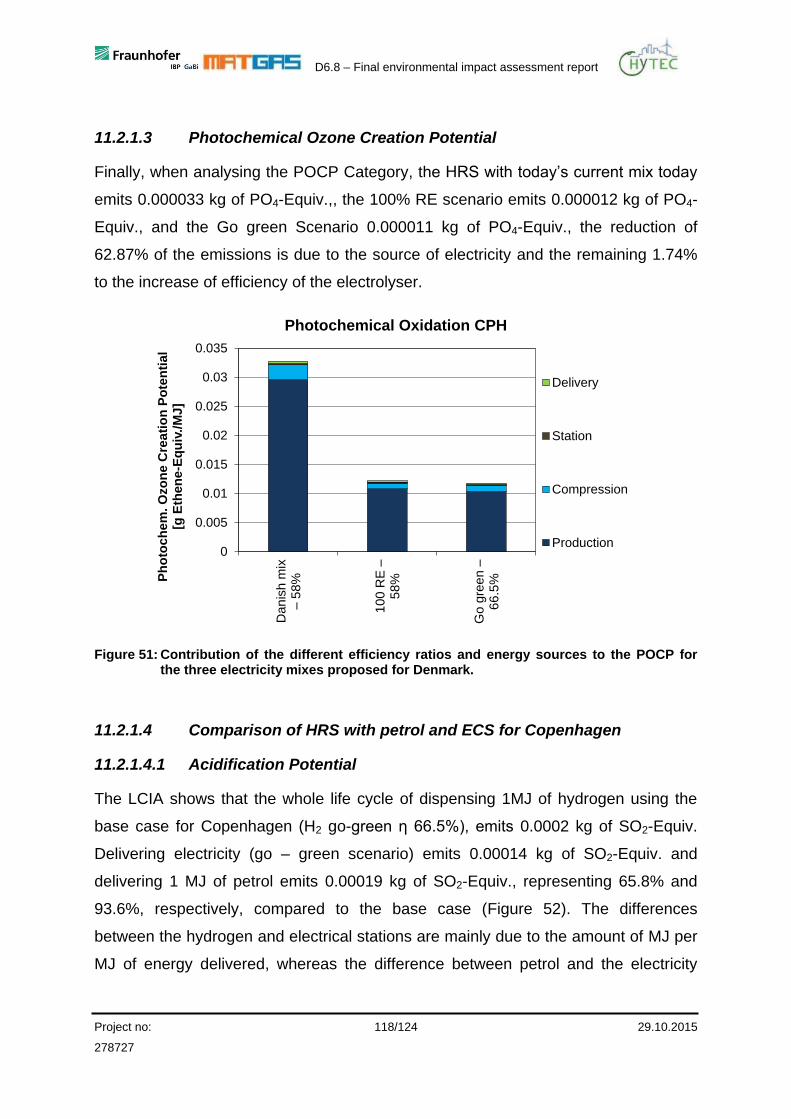
D6.8 – Final environmental impact assessment report
Project no: 118/124 29.10.2015
278727
11.2.1.3 Photochemical Ozone Creation Potential
Finally, when analysing the POCP Category, the HRS with today’s current mix today
emits 0.000033 kg of PO4-Equiv.,, the 100% RE scenario emits 0.000012 kg of PO4-
Equiv., and the Go green Scenario 0.000011 kg of PO4-Equiv., the reduction of
62.87% of the emissions is due to the source of electricity and the remaining 1.74%
to the increase of efficiency of the electrolyser.
0
0.005
0.01
0.015
0.02
0.025
0.03
0.035
Dan
ish m
ix
–5
8%
10
0 R
E –
58
%
Go
gre
en
–6
6.5
%Ph
oto
ch
em
. O
zo
ne
Cre
ati
on
Po
ten
tia
l [g
Eth
en
e-E
qu
iv./
MJ
]
Photochemical Oxidation CPH
Delivery
Station
Compression
Production
Figure 51: Contribution of the different efficiency ratios and energy sources to the POCP for the three electricity mixes proposed for Denmark.
11.2.1.4 Comparison of HRS with petrol and ECS for Copenhagen
11.2.1.4.1 Acidification Potential
The LCIA shows that the whole life cycle of dispensing 1MJ of hydrogen using the
base case for Copenhagen (H2 go-green η 66.5%), emits 0.0002 kg of SO2-Equiv.
Delivering electricity (go – green scenario) emits 0.00014 kg of SO2-Equiv. and
delivering 1 MJ of petrol emits 0.00019 kg of SO2-Equiv., representing 65.8% and
93.6%, respectively, compared to the base case (Figure 52). The differences
between the hydrogen and electrical stations are mainly due to the amount of MJ per
MJ of energy delivered, whereas the difference between petrol and the electricity
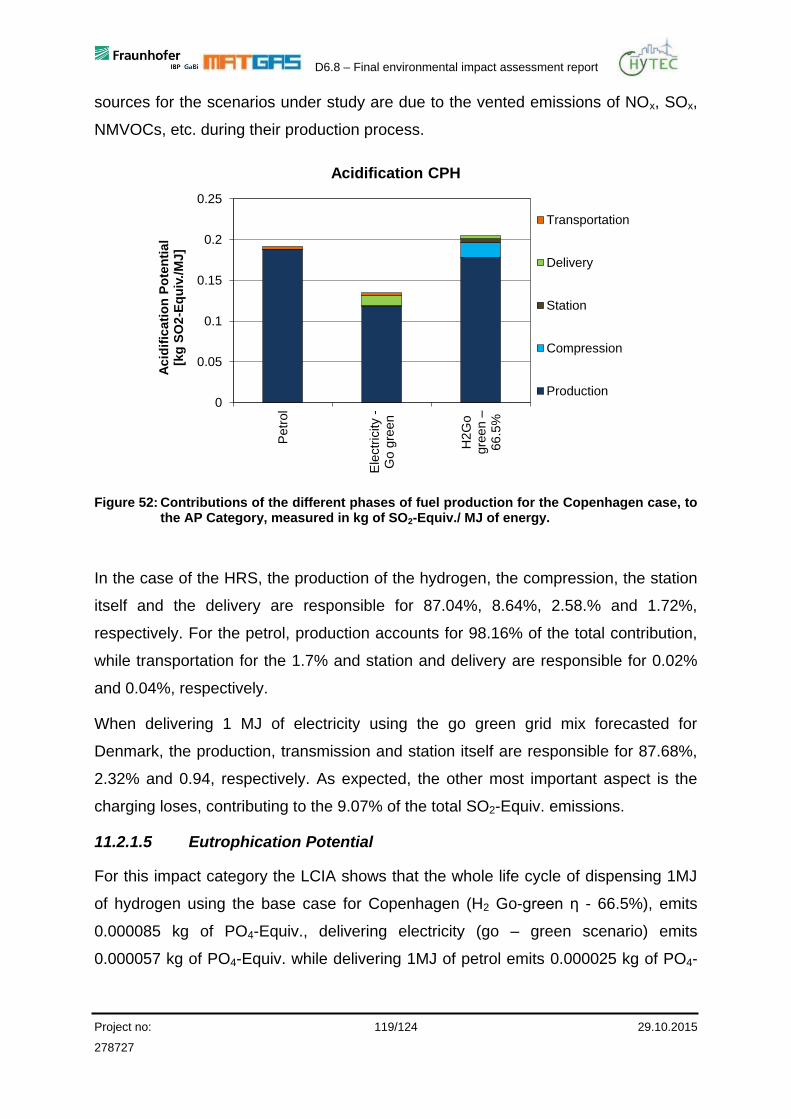
D6.8 – Final environmental impact assessment report
Project no: 119/124 29.10.2015
278727
sources for the scenarios under study are due to the vented emissions of NOx, SOx,
NMVOCs, etc. during their production process.
0
0.05
0.1
0.15
0.2
0.25
Petr
ol
Ele
ctr
icity -
Go g
reen
H2
Go
gre
en
–6
6.5
%
Ac
idif
ica
tio
n P
ote
nti
al
[kg
SO
2-E
qu
iv./
MJ
]Acidification CPH
Transportation
Delivery
Station
Compression
Production
Figure 52: Contributions of the different phases of fuel production for the Copenhagen case, to the AP Category, measured in kg of SO2-Equiv./ MJ of energy.
In the case of the HRS, the production of the hydrogen, the compression, the station
itself and the delivery are responsible for 87.04%, 8.64%, 2.58.% and 1.72%,
respectively. For the petrol, production accounts for 98.16% of the total contribution,
while transportation for the 1.7% and station and delivery are responsible for 0.02%
and 0.04%, respectively.
When delivering 1 MJ of electricity using the go green grid mix forecasted for
Denmark, the production, transmission and station itself are responsible for 87.68%,
2.32% and 0.94, respectively. As expected, the other most important aspect is the
charging loses, contributing to the 9.07% of the total SO2-Equiv. emissions.
11.2.1.5 Eutrophication Potential
For this impact category the LCIA shows that the whole life cycle of dispensing 1MJ
of hydrogen using the base case for Copenhagen (H2 Go-green η - 66.5%), emits
0.000085 kg of PO4-Equiv., delivering electricity (go – green scenario) emits
0.000057 kg of PO4-Equiv. while delivering 1MJ of petrol emits 0.000025 kg of PO4-
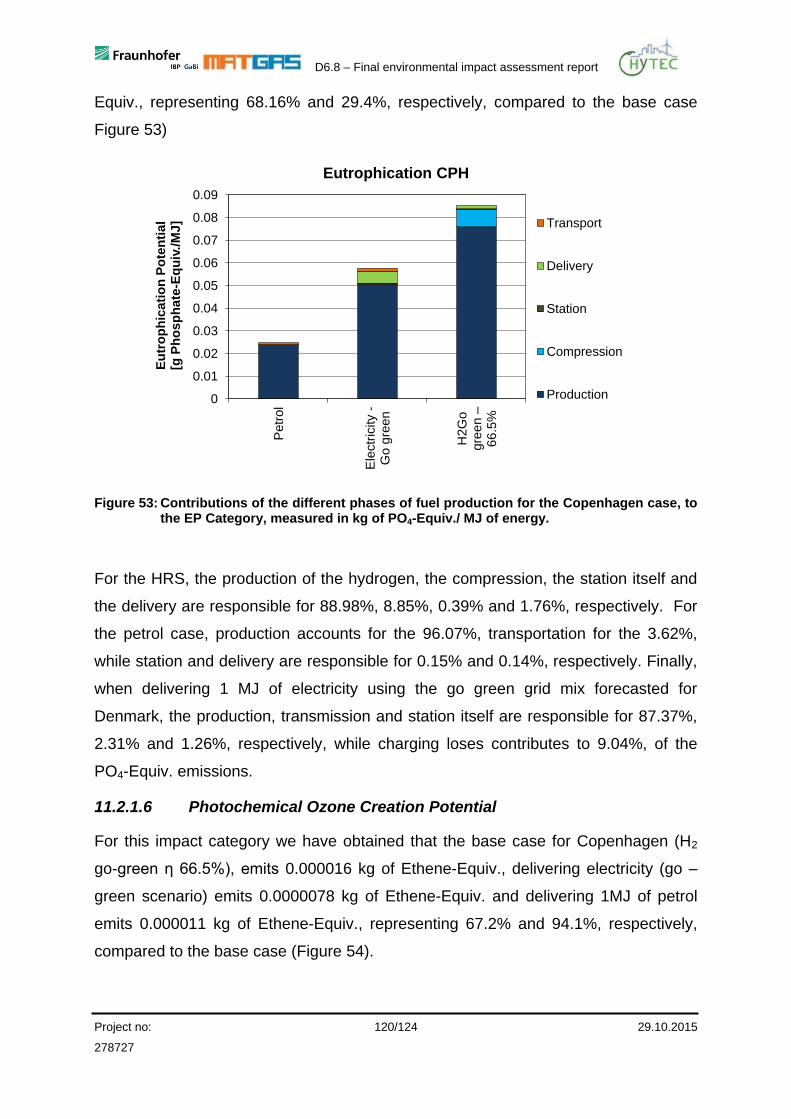
D6.8 – Final environmental impact assessment report
Project no: 120/124 29.10.2015
278727
Equiv., representing 68.16% and 29.4%, respectively, compared to the base case
Figure 53)
0
0.01
0.02
0.03
0.04
0.05
0.06
0.07
0.08
0.09
Petr
ol
Ele
ctr
icity -
Go g
reen
H2G
o
gre
en
–6
6.5
%
Eu
tro
ph
ica
tio
n P
ote
nti
al
[g P
ho
sp
ha
te-E
qu
iv./
MJ
]Eutrophication CPH
Transport
Delivery
Station
Compression
Production
Figure 53: Contributions of the different phases of fuel production for the Copenhagen case, to the EP Category, measured in kg of PO4-Equiv./ MJ of energy.
For the HRS, the production of the hydrogen, the compression, the station itself and
the delivery are responsible for 88.98%, 8.85%, 0.39% and 1.76%, respectively. For
the petrol case, production accounts for the 96.07%, transportation for the 3.62%,
while station and delivery are responsible for 0.15% and 0.14%, respectively. Finally,
when delivering 1 MJ of electricity using the go green grid mix forecasted for
Denmark, the production, transmission and station itself are responsible for 87.37%,
2.31% and 1.26%, respectively, while charging loses contributes to 9.04%, of the
PO4-Equiv. emissions.
11.2.1.6 Photochemical Ozone Creation Potential
For this impact category we have obtained that the base case for Copenhagen (H2
go-green η 66.5%), emits 0.000016 kg of Ethene-Equiv., delivering electricity (go –
green scenario) emits 0.0000078 kg of Ethene-Equiv. and delivering 1MJ of petrol
emits 0.000011 kg of Ethene-Equiv., representing 67.2% and 94.1%, respectively,
compared to the base case (Figure 54).
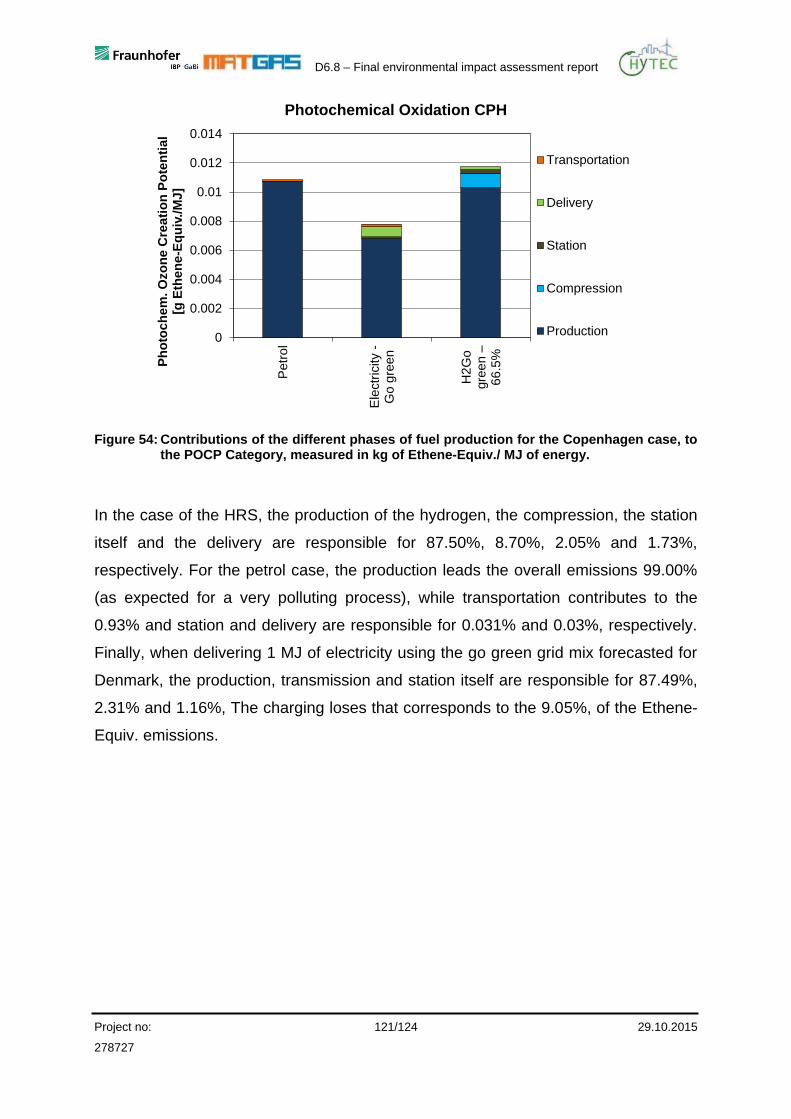
D6.8 – Final environmental impact assessment report
Project no: 121/124 29.10.2015
278727
0
0.002
0.004
0.006
0.008
0.01
0.012
0.014
Petr
ol
Ele
ctr
icity -
Go g
reen
H2
Go
gre
en
–6
6.5
%
Ph
oto
ch
em
. O
zo
ne
Cre
ati
on
Po
ten
tia
l [g
Eth
en
e-E
qu
iv./
MJ
]
Photochemical Oxidation CPH
Transportation
Delivery
Station
Compression
Production
Figure 54: Contributions of the different phases of fuel production for the Copenhagen case, to the POCP Category, measured in kg of Ethene-Equiv./ MJ of energy.
In the case of the HRS, the production of the hydrogen, the compression, the station
itself and the delivery are responsible for 87.50%, 8.70%, 2.05% and 1.73%,
respectively. For the petrol case, the production leads the overall emissions 99.00%
(as expected for a very polluting process), while transportation contributes to the
0.93% and station and delivery are responsible for 0.031% and 0.03%, respectively.
Finally, when delivering 1 MJ of electricity using the go green grid mix forecasted for
Denmark, the production, transmission and station itself are responsible for 87.49%,
2.31% and 1.16%, The charging loses that corresponds to the 9.05%, of the Ethene-
Equiv. emissions.
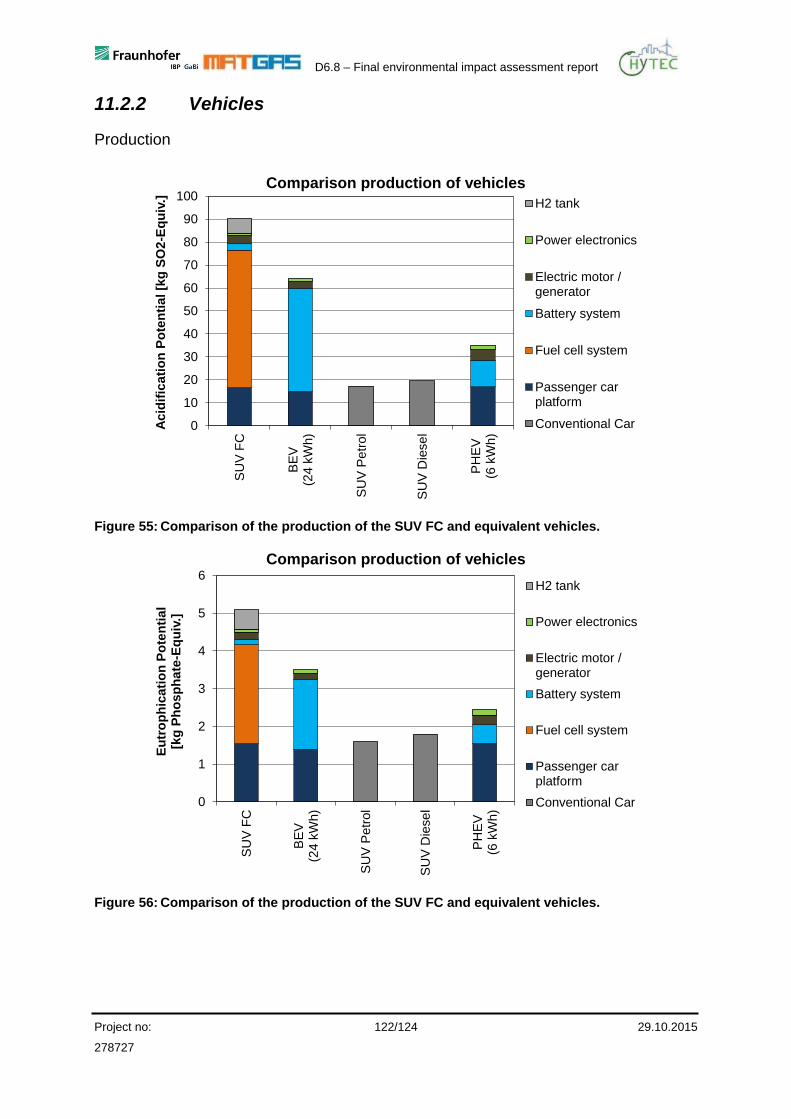
D6.8 – Final environmental impact assessment report
Project no: 122/124 29.10.2015
278727
11.2.2 Vehicles
Production
0
10
20
30
40
50
60
70
80
90
100
SU
V F
C
BE
V(2
4 k
Wh)
SU
V P
etr
ol
SU
V D
iese
l
PH
EV
(6 k
Wh)
Ac
idif
ica
tio
n P
ote
nti
al [k
g S
O2
-Eq
uiv
.]
Comparison production of vehicles
H2 tank
Power electronics
Electric motor /generator
Battery system
Fuel cell system
Passenger carplatform
Conventional Car
Figure 55: Comparison of the production of the SUV FC and equivalent vehicles.
0
1
2
3
4
5
6
SU
V F
C
BE
V(2
4 k
Wh)
SU
V P
etr
ol
SU
V D
iese
l
PH
EV
(6 k
Wh)
Eu
tro
ph
ica
tio
n P
ote
nti
al
[kg
Ph
osp
ha
te-E
qu
iv.]
Comparison production of vehicles
H2 tank
Power electronics
Electric motor /generator
Battery system
Fuel cell system
Passenger carplatform
Conventional Car
Figure 56: Comparison of the production of the SUV FC and equivalent vehicles.
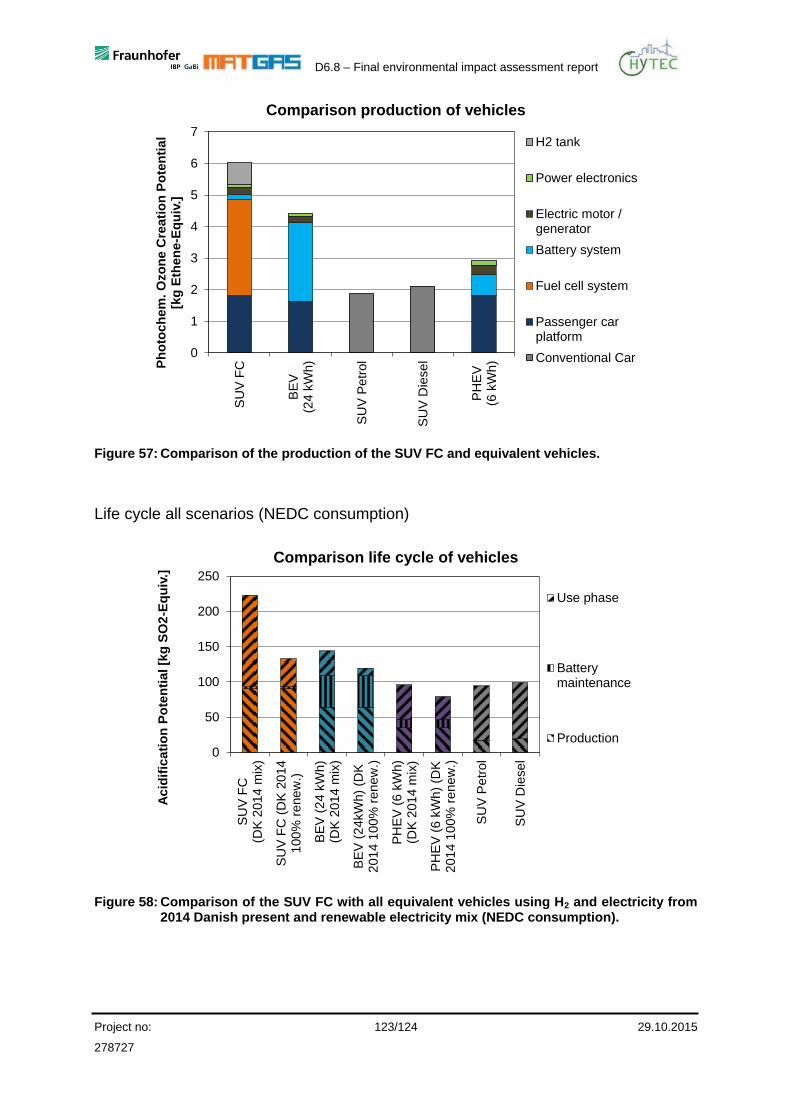
D6.8 – Final environmental impact assessment report
Project no: 123/124 29.10.2015
278727
0
1
2
3
4
5
6
7
SU
V F
C
BE
V(2
4 k
Wh)
SU
V P
etr
ol
SU
V D
iese
l
PH
EV
(6 k
Wh
)Ph
oto
ch
em
. O
zo
ne
Cre
ati
on
Po
ten
tia
l [k
g E
the
ne-E
qu
iv.]
Comparison production of vehicles
H2 tank
Power electronics
Electric motor /generator
Battery system
Fuel cell system
Passenger carplatform
Conventional Car
Figure 57: Comparison of the production of the SUV FC and equivalent vehicles.
Life cycle all scenarios (NEDC consumption)
0
50
100
150
200
250
SU
V F
C(D
K 2
01
4 m
ix)
SU
V F
C (
DK
20
14
100
% r
ene
w.)
BE
V (
24 k
Wh)
(DK
201
4 m
ix)
BE
V (
24kW
h)
(DK
201
4 1
00%
rene
w.)
PH
EV
(6
kW
h)
(DK
201
4 m
ix)
PH
EV
(6
kW
h)
(DK
201
4 1
00%
rene
w.)
SU
V P
etr
ol
SU
V D
iese
l
Ac
idif
ica
tio
n P
ote
nti
al [k
g S
O2
-Eq
uiv
.]
Comparison life cycle of vehicles
Use phase
Batterymaintenance
Production
Figure 58: Comparison of the SUV FC with all equivalent vehicles using H2 and electricity from 2014 Danish present and renewable electricity mix (NEDC consumption).
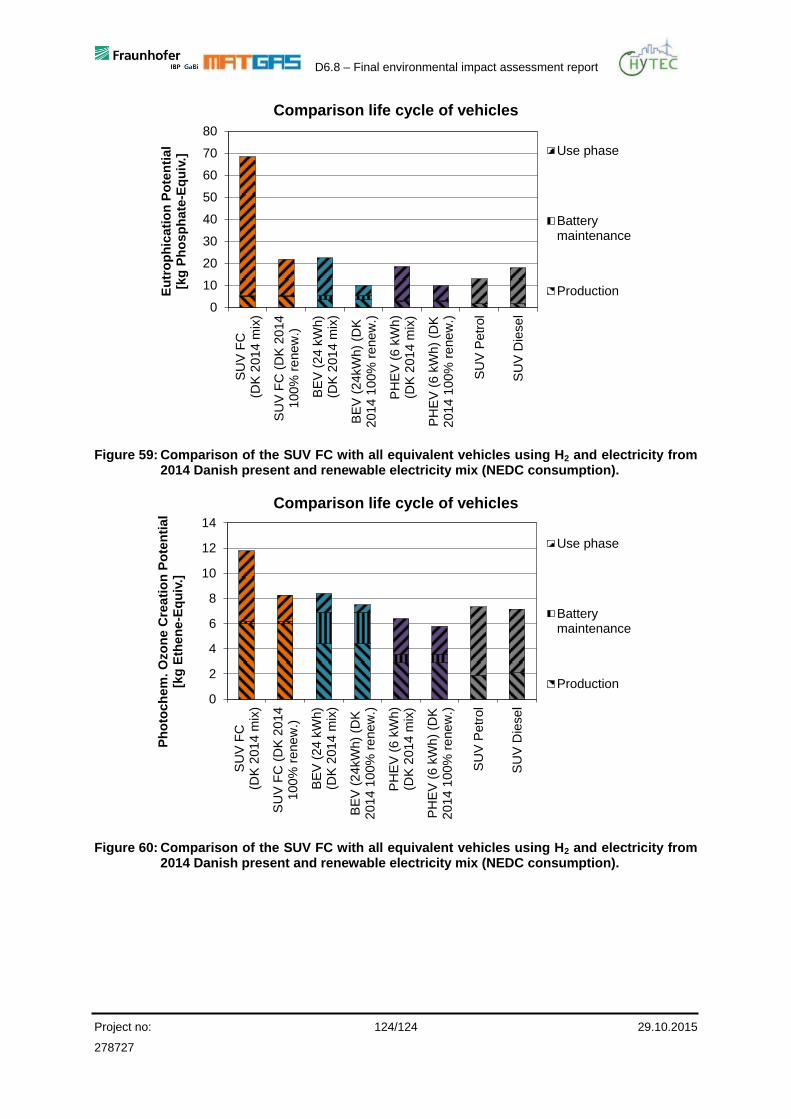
D6.8 – Final environmental impact assessment report
Project no: 124/124 29.10.2015
278727
0
10
20
30
40
50
60
70
80
SU
V F
C(D
K 2
01
4 m
ix)
SU
V F
C (
DK
20
14
100
% r
ene
w.)
BE
V (
24 k
Wh)
(DK
201
4 m
ix)
BE
V (
24kW
h)
(DK
201
4 1
00%
re
ne
w.)
PH
EV
(6
kW
h)
(DK
201
4 m
ix)
PH
EV
(6
kW
h)
(DK
201
4 1
00%
re
ne
w.)
SU
V P
etr
ol
SU
V D
iese
l
Eu
tro
ph
ica
tio
n P
ote
nti
al
[kg
Ph
os
ph
ate
-Eq
uiv
.]
Comparison life cycle of vehicles
Use phase
Batterymaintenance
Production
Figure 59: Comparison of the SUV FC with all equivalent vehicles using H2 and electricity from 2014 Danish present and renewable electricity mix (NEDC consumption).
0
2
4
6
8
10
12
14
SU
V F
C(D
K 2
01
4 m
ix)
SU
V F
C (
DK
20
14
100
% r
ene
w.)
BE
V (
24 k
Wh)
(DK
201
4 m
ix)
BE
V (
24kW
h)
(DK
2014
10
0%
renew
.)
PH
EV
(6
kW
h)
(DK
201
4 m
ix)
PH
EV
(6
kW
h)
(DK
201
4 1
00%
re
ne
w.)
SU
V P
etr
ol
SU
V D
iese
l
Ph
oto
ch
em
. O
zo
ne
Cre
ati
on
Po
ten
tia
l [k
g E
the
ne
-Eq
uiv
.]
Comparison life cycle of vehicles
Use phase
Batterymaintenance
Production
Figure 60: Comparison of the SUV FC with all equivalent vehicles using H2 and electricity from 2014 Danish present and renewable electricity mix (NEDC consumption).