hydrogeologic conceptual model – new bedford- … · 5. description of temescal subbasin related...
TRANSCRIPT

HYDROGEOLOGIC CONCEPTUAL MODEL – NEW BEDFORD-COLDWATER BASIN
The following is a summary of the hydrogeologic conceptual model for the proposed new Bedford-Coldwater Basin.
1. Description of Principal Aquifer Units
The new Bedford-Coldwater Basin is composed of alluvial fan, alluvial valley, axial channel, and wash deposits. These deposits are sourced from the Santa Ana Mountains to the west of the Basin and the Peninsular Ranges to the east of the Basin. The Bedford Canyon Formation (a slightly metamorphosed sedimentary formation composed of interlayered argillite, slate, graywacke, conglomeratic graywacke, impure quartzite, and small masses of limestone and quartz-rich metasandstone) and adjacent granitic rocks are the primary source materials for these alluvial deposits. The alluvial fan deposits in the Coldwater area (Figure 5) extend into the Bedford area and appear to have been disrupted by faulting (Figures 2 and 3). Channel deposits along Temescal Wash and local tributaries define the eastern boundary of the new basin. In the northern Bedford area, a variety of Tertiary sedimentary units crop out including the Silverado (Paleocene), Vaqueros (Miocene), Topanga (Miocene), and Puente (Miocene) formations (Figure 2). As such, the character of the deposits and the groundwater chemistry differ from the alluvial fans to the north in the Temescal Subbasin and those to the south in the Elsinore Groundwater Basin.
Both older and recent alluvial fans have been deposited along the mountain front on the western edge of the new Bedford-Coldwater Basin. These fans have prograded across both the Coldwater and Bedford areas from west to east. Although these deposits are relatively thick, the entire unit is heterogeneous. Sand lenses within the fan deposits collectively form the Alluvial Fan Aquifers. These aquifers range up to over 700 feet in thickness in the Coldwater area (western portion of the new Bedford-Coldwater Basin) (Todd and AKM, 2008).
An analysis of groundwater conditions in the Bedford area was conducted in support of a recycled water feasibility study conducted for Lee Lake Water District (now Temescal Valley Water District, TVWD) (Todd and AKM, 2008 Appendix D). Very few wells in the Bedford area have sufficient groundwater elevation records to examine long term trends. The available data show that groundwater elevations in the Bedford area have fluctuated about 60 feet over the last 50 years, and high groundwater levels are within 10 feet of ground surface (Todd and AKM, 2008). A review of recent water levels (data included in the CASGEM online database) indicates that water levels have fluctuated only about six feet over the last four years for two wells located in the east-central portion of the proposed Bedford-Coldwater Basin.
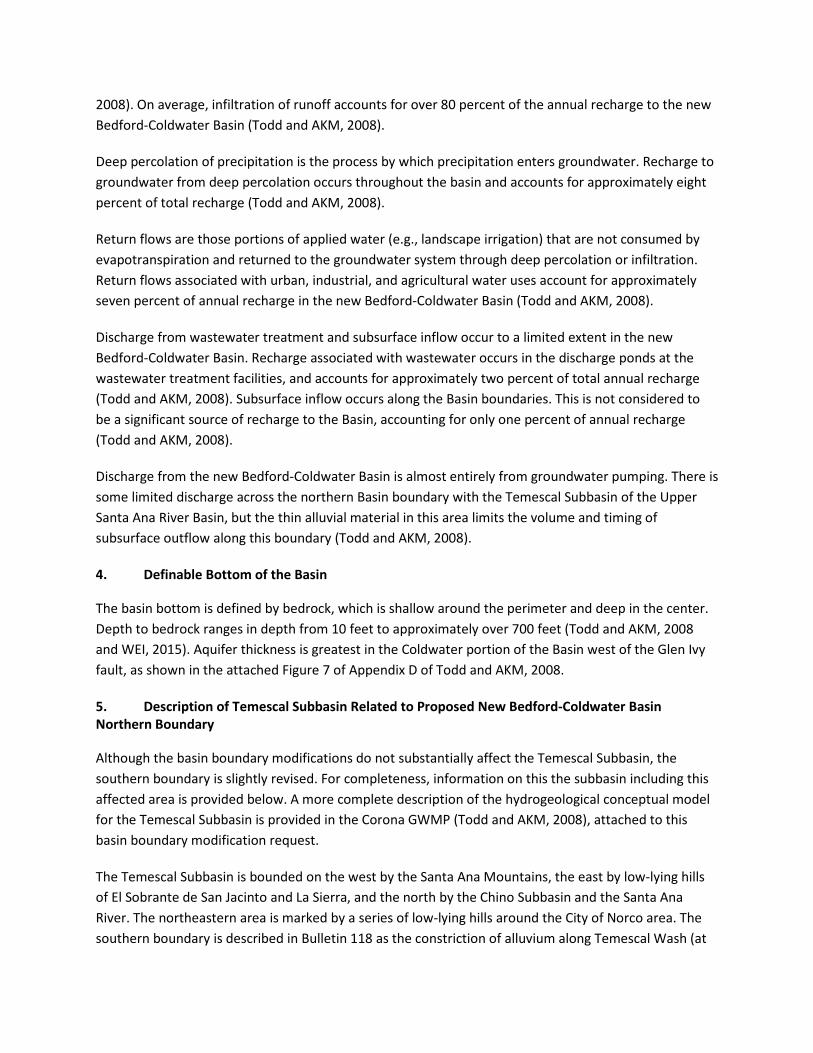
Water levels in the Coldwater area are illustrated by the hydrograph from City Well No. 3 on Figure 7. As shown on the graph, water levels have declined over the last 50 years with significant fluctuations in response to wet and dry cycles. Water levels in Coldwater area have varied more than 350 feet over the

last 50 years, from a high of 1,112 feet above mean sea level (msl) (26 feet below ground surface) in May 1983 to a low of 739 feet msl1 (399 feet below ground surface) in October 2009. Five major cycles of groundwater elevation recovery and decline are illustrated on the hydrograph: from approximately 1964 to 1977, 1977 to 1991, 1991 to 2004, 2004 to 2009, and 2009 to 2015. Several minor cycles of water level fluctuations are evident within these major cycles. Some of the fluctuations (approximately 20 feet between measurements) are also potentially influenced by incomplete recovery of pumping water levels in the well. The wide water level fluctuations over time in the Coldwater area also reflect the relatively small footprint and compartmentalization of the area. The area covers only about 2,000 acres and is surrounded on the west, north, and south by bedrock. In addition, communication with the adjacent Bedford area is impeded in places by the North Glen Ivy fault (Todd and AKM, 2008).
Recent water levels are approximately 800 feet msl (approximately 340 feet below ground surface) and reflect a recovery of approximately 60 feet from the historical low reached approximately six years ago in 2009. This recovery is due, in part, to a 2008 production agreement between Corona and EVMWD for the Coldwater portion of the proposed new Bedford-Coldwater Basin where most of the pumping occurs. Through this legal agreement, groundwater extractions are now tied to a perennial yield for the area. By limiting pumping, water levels are being more effectively managed in the area. This management will continue and will be unaffected by the basin boundary modification request.
2. Description of Lateral Boundaries
2.a. Geologic Features Impeding or Impacting Groundwater Flow
The new Bedford-Coldwater Basin would be defined by the lateral extents of the alluvial material described above. This material is bounded by bedrock in the Santa Ana Mountain on the west and the Peninsular Ranges to the east. The southern and northern boundaries of the Basin are formed by areas of thin alluvial material over shallow bedrock in narrow valleys (Todd and AKM, 2008 and WEI, 2015).
Groundwater flow in the new Bedford-Coldwater Basin is affected by the Glen Ivy fault shown on Figure 3. (Todd and AKM, 2008 and WEI, 2015). The Coldwater area of the Basin is located within a down-dropped block between the Glen Ivy fault and the Santa Ana Mountains. The Glen Ivy fault impedes groundwater flow from the west to the east within the Basin, resulting in limited hydraulic connection between the Coldwater ad Bedford areas. However, these areas appear to be well-connected when groundwater elevations in the Basin are high (Todd and AKM, 2008), indicating more compartmentalization with depth.
2.b. Aquifer Characteristics Significantly Impeding or Impacting Groundwater Flow
The new Bedford-Coldwater Basin is thin in some areas, which impedes groundwater flow. This is especially relevant at the northern and southern boundaries of the Basin, as has been described in other
1 This historic low water level may be influenced by pumping conditions (or incomplete recovery) in this well. A historic low water level that represents a static measurement was recorded in November 2010 at 756 feet msl, 17 feet higher than the previously-recorded measurement.

sections. With the exception of the Glen Ivy fault described above, there are no other known aquifer characteristics impeding or impacting flow in the new basin.
2.c. Significant Geologic and Hydrologic Features of Principle Aquifer Units
The units in the new Bedford-Coldwater Basin are truncated by the Glen Ivy fault that separates the Bedford area from the Coldwater area. The location and effect of the Glen Ivy fault on the units of the Basin are shown on cross sections on Figure 15 of Todd and AKM, 2008 and Figure 3-3c of WEI, 2015. As shown on these cross sections, the Glen Ivy fault offsets the units by approximately 200 to 250 feet. The fault generally impedes groundwater flow, backing up groundwater west of the fault within the Coldwater area and limiting flow into the Bedford area.
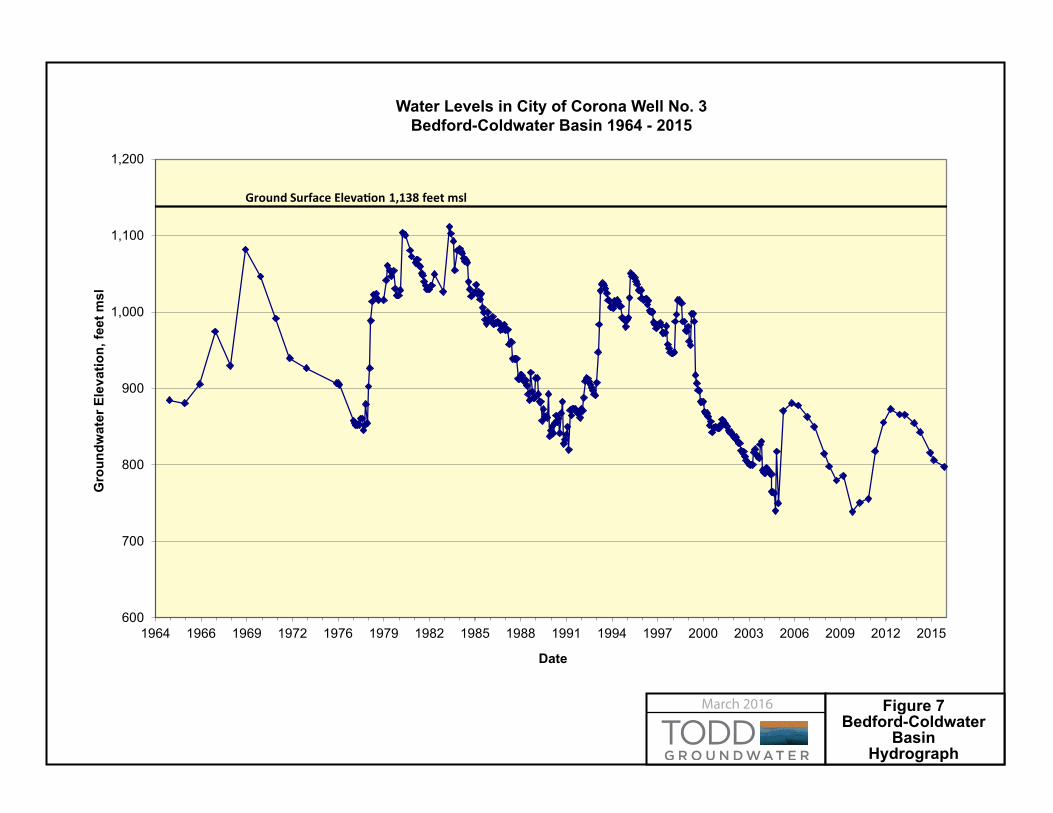
The aquifer is unconfined throughout the new Bedford-Coldwater Basin, and there are no facies changes within the Basin that affect groundwater flow. Groundwater flow in the new Bedford-Coldwater Basin is generally from south to north in the Bedford area and from west to east in the Coldwater area. Groundwater elevations and flow directions in the entire Basin are shown on Figures 26 and 27 of Todd and AKM, 2008. Additional groundwater elevation maps of the Bedford area are shown on Figures 3-5 and 3-6 of WEI 2015.
2.d. Key Surface Water Bodies, Groundwater Divides and Significant Recharge Sources
The key surface water bodies in the new Bedford-Coldwater Basin are Temescal Wash, Bedford Wash, Brown Canyon, Bixby Canyon, Anderson Canyon, Coldwater Canyon, Mayhew Canyon, Dawson Canyon, Olsen Canyon, and several unnamed drainages entering the Basin from the west and east. With the exception of the Temescal Wash, these are all ephemeral drainages. However, they are all fed by relatively large watershed areas in the mountains surrounding the basin and receive large volumes of runoff during precipitation events. As a result, these drainages are important sources of recharge to the new Bedford-Coldwater Basin.
3. Recharge and Discharge Areas
Recharge to the new Bedford-Coldwater Basin occurs primarily from infiltration of runoff, and to a lesser extent from deep percolation of precipitation, urban, agricultural, and industrial return flows, wastewater recharge, and subsurface inflow from outside the Basin.
Most of the basin recharge comes from the infiltration of runoff from precipitation in the Santa Ana Mountains west of the Basin and the Peninsular Ranges east of the Basin. Large amounts of runoff from the mountains flow in unlined channels into and through the Basin. The amount of water available for recharge varies annually with changes in rainfall and runoff. Runoff into the new Bedford-Coldwater Basin is subject to evapotranspiration, infiltration, and continued surface flow to the Temescal Wash. The watersheds contributing to the Basin include multiple drainages, all of which flow across the Basin in generally east-west orientations. Runoff from some of these drainages is captured and diverted to gravel pits or spreading areas for groundwater recharge in the subbasin (Todd and AKM, 2008). Wet years generate large amounts of water that exceeds the recharge capacity of the basin (Todd and AKM,
2008). On average, infiltration of runoff accounts for over 80 percent of the annual recharge to the new Bedford-Coldwater Basin (Todd and AKM, 2008).
Deep percolation of precipitation is the process by which precipitation enters groundwater. Recharge to groundwater from deep percolation occurs throughout the basin and accounts for approximately eight percent of total recharge (Todd and AKM, 2008).
Return flows are those portions of applied water (e.g., landscape irrigation) that are not consumed by evapotranspiration and returned to the groundwater system through deep percolation or infiltration. Return flows associated with urban, industrial, and agricultural water uses account for approximately seven percent of annual recharge in the new Bedford-Coldwater Basin (Todd and AKM, 2008).
Discharge from wastewater treatment and subsurface inflow occur to a limited extent in the new Bedford-Coldwater Basin. Recharge associated with wastewater occurs in the discharge ponds at the wastewater treatment facilities, and accounts for approximately two percent of total annual recharge (Todd and AKM, 2008). Subsurface inflow occurs along the Basin boundaries. This is not considered to be a significant source of recharge to the Basin, accounting for only one percent of annual recharge (Todd and AKM, 2008).
Discharge from the new Bedford-Coldwater Basin is almost entirely from groundwater pumping. There is some limited discharge across the northern Basin boundary with the Temescal Subbasin of the Upper Santa Ana River Basin, but the thin alluvial material in this area limits the volume and timing of subsurface outflow along this boundary (Todd and AKM, 2008).
4. Definable Bottom of the Basin
The basin bottom is defined by bedrock, which is shallow around the perimeter and deep in the center. Depth to bedrock ranges in depth from 10 feet to approximately over 700 feet (Todd and AKM, 2008 and WEI, 2015). Aquifer thickness is greatest in the Coldwater portion of the Basin west of the Glen Ivy fault, as shown in the attached Figure 7 of Appendix D of Todd and AKM, 2008.
5. Description of Temescal Subbasin Related to Proposed New Bedford-Coldwater Basin Northern Boundary
Although the basin boundary modifications do not substantially affect the Temescal Subbasin, the southern boundary is slightly revised. For completeness, information on this the subbasin including this affected area is provided below. A more complete description of the hydrogeological conceptual model for the Temescal Subbasin is provided in the Corona GWMP (Todd and AKM, 2008), attached to this basin boundary modification request.
The Temescal Subbasin is bounded on the west by the Santa Ana Mountains, the east by low-lying hills of El Sobrante de San Jacinto and La Sierra, and the north by the Chino Subbasin and the Santa Ana River. The northeastern area is marked by a series of low-lying hills around the City of Norco area. The southern boundary is described in Bulletin 118 as the constriction of alluvium along Temescal Wash (at

Bedford Canyon). The proposed revisions to this southern boundary do not change this description substantially. The modification moves the boundary to the north (approximately 2,000 feet) to coincide with a small topographic high in the older alluvial deposits. This functions as a local groundwater divide for Bedford Wash and keeps the entire wash within the new Bedford-Coldwater Subbasin.
Aquifers within the Temescal Subbasin include the alluvial fans that are sourced from uplands west of the basin, channel deposits, and other alluvial units. There are some Tertiary-age sandstone units that also provide relatively low yields from groundwater wells. The bottom of the basin is defined by older consolidated units and volcanic and metamorphic bedrock. The depth to bedrock is shown in the GWMP (Figure 10).
In general groundwater flows from south, east, and west toward the basin center and then northwest toward the basin discharge in the Prado Management zone along the Santa Ana River. Subsurface inflow occurs primarily along the western perimeter, beneath the Temescal Wash channel from the south, and through the Arlington Narrows to the east (where the Temescal Subbasin joins the Riverside-Arlington Subbasin). Recharge also occurs from recharge ponds and direct infiltration from precipitation. In addition to subsurface outflow, Corona wells in the northern portion of the subbasin account for most of the groundwater discharge from the basin. A more complete water budget is included in Section 3 of the GWMP (Todd and AKM, 2008).
The revised southern basin boundary occurs within older alluvial deposits with relatively low permeability. There are no known active groundwater wells in the affected area. The revised southern boundary does not affect substantially any of the hydrogeologic information described above.

Path:
T:\Pr
ojects
\Coro
na 46
409\G
IS\M
aps-2
015B
asin
Boun
dary\
Maps
\Figu
res\Fi
gure
2 - G
eolog
y abd
Basin
Bou
ndari
s.mxd
DD
DD
@
@
@
@
@
DDDD
DD
DDDD
DD
DD
DD
DD
DD
DDDD
DD
DD
DD
DD
@@
@
@
+
DD
@@
DD
DD
@
DDDDDD
DD
@
@
DD
DDDD
++
DDDDDD
DDDDDD DDDD
@
DD
DD
DD DD
@
DD
DD
@
@
DD
@
@
@
@
@
DD
DD
@
"
"""
@
@@
"""
"""
@
@
@@
@ @
@
@
@
@
DD
@
@
DDDDDD
( (
DD
( ((
(
(
DD
""
"
"
"
"""
""
"" ""
""
""
"""
""
"" ""
" "
"
"
"
""
""
"
"""
DD
EE
@
1
@
@
11
@
@
@
@
@
@
@
@
@
@
@
@
@
@@
@@
@
@ @ @
EEEE
EE
EEEE
EEEE
EEEEEEEEEEEEEEEE EEEE
@
@
@
@
@
EE
EEEE
EE
EE
EE
EE
EE
EE
EE
EE
EE
EE
EE
EE
EE
EE
EE
EE
EE
EEEE
EE
EEEE
EE
EE
EE
EEEE
EEEE
EE
EE
EE
EE
EE
EE
EE
EEEE
EE
EEEE
EE
EE
EE
EE
EE
EE
EE
EEEEEE
EEEE
EE
EE
EE
EE
EE
EE
EE
EE
EE
EE
EE
EE
EE
EEEE
EE
EE
EE
EE
EE
EE
EE
EE
EE
EE
EEEE
EEEEEE
EE
EE
EE
EE
EE
EE
EE
EEEEEE EE
EE
EE
EE
EE
EE
EE
EE
EEEE
EE
EEEE
EE EEEE
EE
EE
EEEEEE
EE
EE
EE
EEEE
EE
EE EE
EE
EE
EE
EE
EE
EE
EE
EE
EEEE EE
EE
EE
EE
EE
EE
EE
EE
EE
EE
EEEE
EE
EE
EE
EE
EE
EE
EE
EEEEEEEE
EE
EE
EE
EE
EEEE
EE
EE
EE
EE
EE
EE
EE EEEE
EE
EE
EEEE
EE
EE
EEEE
EE
EEEE
EE
EE
EE
EE
EEEE
EE
EE
EE
EEEE
EEEE
EEEE
EE
EEEEEE
EE
EE
EE
EE
EE
EE
EE
EE
EE
EE
EE
EE
EE
EE
EEEEEE
EE
EE
EE
EE
EE
EE
EEEE
EEEE
EEEE
EE
EE
EE
EE
EE
EE
EE
EE
EE
EE
EE
EE
EE
EE
EE
EE
EEEE
EE
EE
EE
EE
EE
EE
EE
EE
EE
EE
EE
EEEEEEEE
EE
EE
EE
EE
EE
EE
EE
EE
EE
EE
EE
EE
EE
EE
EEEE
EE
EE
EE
EE
EE
EEEE
EE
EE
EEEE
EE
EE
EE
EE
EEEE
EE
EE
EE
EEEEEEEE
EE
EE
EE
EE
EE
EE
EE
EE
EEEE
EE
EE
EE
EEEEEE
EEEEEE
EE
EE
EE
EE
EEEE
EE
EE
EEEE
EE
EE
EEEE
EE
EEEEEE
EE
EE
EE
EEEE
EEEE
EE
EEEE
EE
EEEE
EE
EE
EE
EEEEEE
EE
EE
EE
EE
EE
EE
EE
EE
EEEE
EE
EEEE
EE
EEEEEEEEEEEEEEEE
EE
EE
EE
EEEE
EEEE
Current ElsinoreBasin (8-04)
Temecula ValleyBasin (9-05)
TemescalSubbasin of UpperSanta Ana ValleyBasin (8-02.09)
March 2016 Figure 2USGS Geologic Units
Current Elsinore Basin
LegendQafQwQfQcQls
!
!
!
!
!
!!
!
!
!
!
! Ql!Qyw
Qyf!
!
!
!
!!
!!
! !
!
!!!
!
!
! !!
!
!
!
QyaQyv
QylsQofQoaQovQolsQvofQvoaQpsQpfQTws
QTt!
!
!
!
!
! !
! QTnTfTpTlmTcgrTcgTvsrTvepTt
TvsTcgaTsiKlhsKlbc
!
!Ktru
!
!
!! !
!
!
! KtrlKgrKggKgt
KgtfKgtiKghKghtKatgKctoKcgKcgdKctKcgq
KcgbKdvgKgbf
KpvgrKpvpKpvgKpvgbKsmgKguKgd
KtKdKgbKhgKvspKvspiKvemKvrKsvKvs
JbcJbcmTrmuTrmq
TrmgpTrmpTrmsTrmmWater Body
Temescal Subbasin of the Upper Santa Ana ValleyGroundwater Basin (8-02.09)Current Elsinore Groundwater Basin (8-04)Temecula Valley Groundwater Basin (9-05)
Source: Surficial geologic units, USGS Preliminary Digital Geologic Map,30' X 60' Santa Ana Quadrangle, Version 2.0 - 2004 (Open File Report 99-172, http://pubs.usgs.gov/of/1999/of99-172/sanana2cmu.pdf)
(N0 7,0003,500
Scale in Feet

Path:
T:\Pr
ojects
\Coro
na 46
409\G
IS\M
aps-2
015B
asin
Boun
dary\
Maps
\Figu
res\Fi
gure
3 - Al
luvial
vs Be
drock
and B
asin
Boun
daris
.mxd
Current ElsinoreBasin (8-04)
Temecula ValleyBasin (9-05)
TemescalSubbasin of UpperSanta Ana ValleyBasin (8-02.09)
Proposed Elsinore BasinBoundary Modifications
Proposed NewBedford-Coldwater Basin (8-10)
Glen Ivy Fault Glen Ivy Fault
Glen Ivy Fault
Freeway Fault
Sedco Fault
Willard FaultWildomar Fault
Rome Fault
March 2016 Figure 3Alluvial Deposits
and ProposedBoundary Modifications
(N0 7,0003,500
Scale in Feet
LegendFaultsProposed Bedford-Coldwater Basin (8-10)Proposed Elsinore Basin Boundary Modifications (8-04)Alluvial DepositsNon-Alluvial DepositsWater Body
Temescal Subbasin of the Upper Santa Ana ValleyGroundwater Basin (8-02.09)Current Elsinore Groundwater Basin (8-04)Temecula Valley Groundwater Basin (9-05)
Source: Surficial geologic units, USGS Preliminary Digital Geologic Map,30' X 60' Santa Ana Quadrangle, Version 2.0 - 2004 (Open File Report 99-172, http://pubs.usgs.gov/of/1999/of99-172/sanana2cmu.pdf)

Path:
T:\Pr
ojects
\Coro
na 46
409\G
IS\M
aps-2
015B
asin
Boun
dary\
Maps
\Figu
res\Fi
gure
5 - P
ropos
ed El
sinore
Bas
in Ar
eas.m
xd Proposed Elsinore BasinBoundary Modifications
Proposed NewBedford-Coldwater Basin (8-10)
Lee LakeArea
Warm SpringsArea
Lee LakeTemescal Wash
San JacintoRiver
Bedford Wash
Coldwater Area
Bedford Area
CanyonLake
Lake Elsinore
Elsinore Area
March 2016 Figure 5Key Areas within
Proposed ElsinoreBasin Boundary
LegendProposed Bedford-Coldwater Basin (8-10)Proposed Elsinore Basin Boundary Modifications (8-04)
(N0 7,0003,500
Scale in Feet
600
700
800
900
1,000
1,100
1,200
1964 1966 1969 1972 1976 1979 1982 1985 1988 1991 1994 1997 2000 2003 2006 2009 2012 2015
Gro
undw
ater
Ele
vatio
n, fe
et m
sl
Date
Ground Surface Elevation 1,138 feet msl
March 2016 Figure 7Bedford-Coldwater
BasinHydrograph
Water Levels in City of Corona Well No. 3Bedford-Coldwater Basin 1964 - 2015

� � ��
������
�����
�� ��
������
� � ���� �
�
�� ��
�������
�����
����
�
���
���
���
��
����
����
����
����
�� ��
�������
�����
����
�
���
���
���
��
����
����
����
����
��� �
������
�� ���� ������
����� ��������� ������
������ �� ����
����� !���� "�����#��$ �%&� !&��� �%�#���� '
���� (�) *����
(������ ���� (�) *���� �+��)
����& ���� (�) *����
����#�#��� ���,
-���%�����%&��
����
�� !"#
#�$��"
��"�!��%&������'��(
��!#�
����#"
�!���
�����"
.
.
.
.
.
.
.
/����
� *����
..
.
.
.
�� !��
����#�#��� ���,
%��"�! �%&������'���(
&������'��
&������'��
��"�!��%&
����
��'���(
�)"*��+�
��!���
" �#
0����#��*�� 01�#���
0����#��*�� 01�#���
����#�#��� ���,
0����#��*�� 01�#���
����#�#��� ���,
&��,-�� ��..����/ ,���,�..����&��,-�� �..����
�����0����������
��!#�
-2 "��(�""��0���� �3 4��#����#�
5�) ��� 1�2� ���&����� 3�������*������,���*���

���������������
�� �������������������������
���� �� �����������������������
���
���
���
��
!����
!�!��
!����
! �" ! �� ! �� ! �� ! �� ! �" ! �� ! � ! � ���� ���"
����
������������� �������������� �
!�����"��� ��������������������!� �#�$�%�� ����������������&'(�)�**
������������+��� ��������&�&%*������ �

������
���
���
���
������
���
���
��
���
���
���
������������� ��������� �������
���������� �����
����������������������
�
���������
���
��!�
"��#��$�%
��& ����'�( � ��
"����)����� �#*����
$���#�
�
���
�+�+ $������ �!� ������"�#��������#
����$�����������"��%�����& �%
&�" �
���
�
�$� ������� �#
��
������������ ����������������
������������� ��������� �������
��������
��������
����
���
�������������� ����������������
����
��� ���������
��
!��"�
#��$��%�&
!��' ���(�) �����
#����*�� ����$+����
%���$�
,
����
��� ���
���
������
���
���
�������
���
- -!%������ �!� ������"�#��������#
����$�����������"��%�����& �%
&�" �
���
�
�$� ������� �#
��

�����������
� ����
��������������������� ����������
���� ��!�������
��� �����������
�