hydrologic effects of the 1988 galena fire, black hills ...2 hydrologic effects of the 1988 galena...
TRANSCRIPT
Hydrologic Effects of the 1988 Galena Fire,Black Hills Area, South DakotaWater-Resources Investigations Report 03-4323
Prepared in cooperation with the State of South Dakota,West Dakota Water Development District, and theU.S. Department of Agriculture (Forest Service)
U.S. Department of the InteriorU.S. Geological Survey
U.S. Department of the Interior U.S. Geological Survey
Hydrologic Effects of the 1988 Galena Fire, Black Hills Area, South Dakota
By Daniel G. Driscoll and Janet M. Carter, U.S. Geological Survey, and Donald O. Ohlen, SAIC, EROS Data Center, Sioux Falls, South Dakota
Water-Resources Investigations Report 03-4323
Prepared in cooperation with the State of South Dakota, West Dakota Water Development District, and the U.S. Department of Agriculture (Forest Service)

U.S. Department of the Interior
GALE A. NORTON, Secretary
U.S. Geological Survey
Charles G. Groat, Director
The use of firm, trade, and brand names in this report is for identification purposes only and does not constitute endorsement by the U.S. Government.
Rapid City, South Dakota: 2004
For additional information write to:
District Chief U.S. Geological Survey 1608 Mt. View Road Rapid City, SD 57702
Copies of this report can be purchased from:
U.S. Geological Survey Information Services Building 810 Box 25286, Federal Center Denver, CO 80225-0286

CONTENTS
Abstract ................................................................................................................................................................................. 1Introduction .......................................................................................................................................................................... 2
Purpose and Scope ...................................................................................................................................................... 2Acknowledgments ...................................................................................................................................................... 2
Description of Study Area .................................................................................................................................................... 3Climate ........................................................................................................................................................................ 3Hydrogeology ............................................................................................................................................................. 3Land Use ..................................................................................................................................................................... 9Timber Management and Burn Characteristics .......................................................................................................... 11
Timber Management ......................................................................................................................................... 11Burn Characteristics ......................................................................................................................................... 14
Previous Investigations ......................................................................................................................................................... 19Data Sets Considered and Hydrologic Considerations ......................................................................................................... 22
Data Sets Considered .................................................................................................................................................. 22Precipitation Data ............................................................................................................................................. 22Streamflow Data ............................................................................................................................................... 23
Hydrologic Considerations ......................................................................................................................................... 25Hydrologic Effects of the Galena Fire .................................................................................................................................. 27
Effects on Geomorphology and Water Quality ........................................................................................................... 27Effects on Streamflow Characteristics ........................................................................................................................ 30
Effects on Annual-Yield Characteristics .......................................................................................................... 30Effects on Peak-Flow Characteristics ............................................................................................................... 39
Summary ............................................................................................................................................................................... 54References ............................................................................................................................................................................ 56Supplemental Information ..................................................................................................................................................... 59
FIGURES
1. Map showing location of study area......................................................................................................................... 42. Isohyetal map showing distribution of average annual precipitation for the Black Hills area,
water years 1961-90 ................................................................................................................................................. 53. Graphs showing air temperatures at Custer and Mt. Rushmore climatic stations prior to and
during the Galena Fire.............................................................................................................................................. 64. Stratigraphic section for the Black Hills area........................................................................................................... 75. Map showing geology of the study area................................................................................................................... 86. Map showing land ownership in study area ............................................................................................................. 107. Photographs showing increase in pine forest between 1874 and 2000 in the Black Hills ....................................... 128. Aerial photographs showing changes in forest cover near northwestern corner of Custer State Park..................... 159. Landsat image of area burned by Galena Fire.......................................................................................................... 16
10. Map showing timber mortality in Custer State Park following the Galena Fire in 1988 and the Cicero Peak Fire in 1990 .......................................................................................................................................... 17
11. Photograph showing spalling of granite due to intense heat from Galena Fire........................................................ 1812. Photographs showing aftermath of Galena Fire in severely burned areas................................................................ 1913. Photographs showing progression of post-fire vegetation recovery at a site on the northeastern
flank of Mt. Coolidge ............................................................................................................................................... 2014. Map showing location of precipitation gages within study area .............................................................................. 2415. Graph showing relations between annual yield efficiency and precipitation for selected drainage basins.............. 26
Contents III

FIGURES—Continued
16. Graph showing annual precipitation for drainage areas of selected streamflow-gaging stations............................ 2817. Graph showing cumulative departure from long-term average annual precipitation for selected
drainage areas, water years 1977-98........................................................................................................................ 2818. Duration hydrographs for selected streamflow-gaging stations .............................................................................. 29
19-24. Graphs showing:19. Annual yield for French Creek, Battle Creek, and Grace Coolidge Creek ..................................................... 3120. Mass analysis for selected streams in comparison to Grace Coolidge Creek ................................................. 3221. Double mass analysis for selected streams in comparison to Grace Coolidge Creek ..................................... 3322. Relations between annual yield and annual precipitation for Battle Creek and
Grace Coolidge Creek before and after the Galena Fire ................................................................................. 3523. Relations between annual yield for Battle Creek and Grace Coolidge Creek for pre-burn
and post-burn periods ...................................................................................................................................... 3624. Cumulative annual yield and cumulative annual precipitation departure from long-term
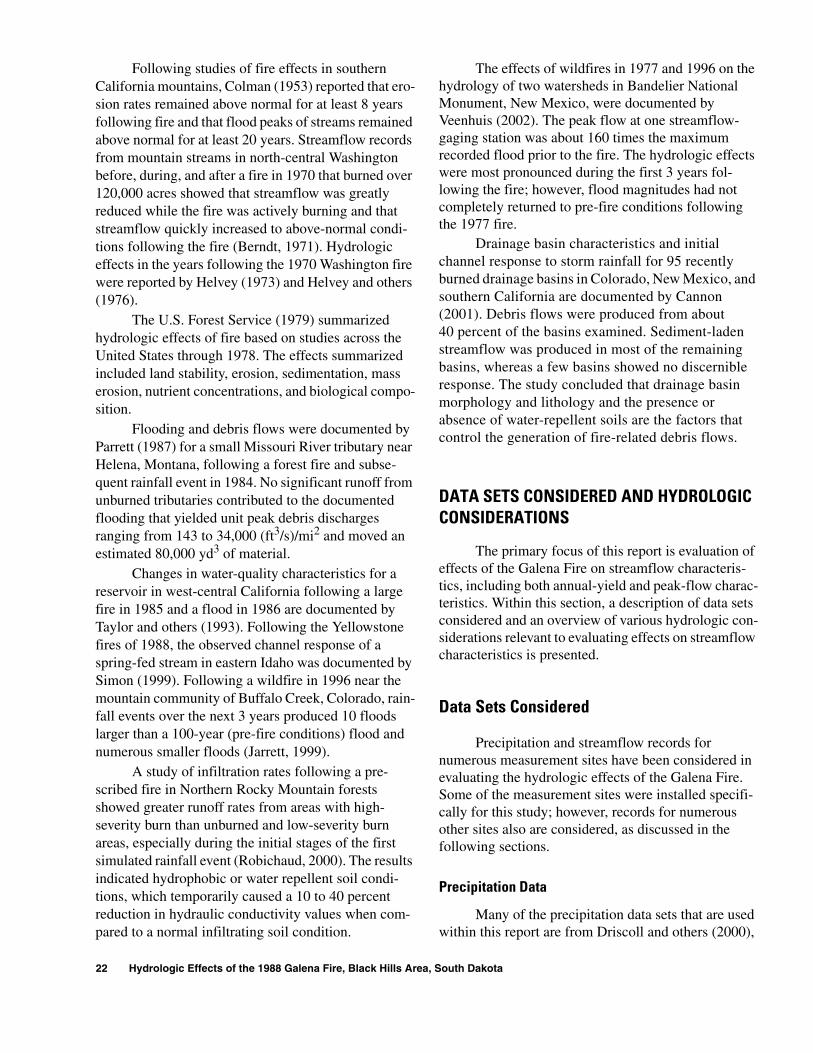
average for Battle Creek near Keystone .......................................................................................................... 3825. Photographs showing that culverts occasionally became clogged with debris following large runoff events ........ 3926. Photographs showing numerous sediment deposits formed as a result of heavy erosion ....................................... 4027. Photographs showing how boulders were deposited following an extreme runoff event........................................ 4128. Graphs showing maximum daily streamflow (April-October) for Battle Creek, Grace Coolidge
Creek, and Bear Gulch............................................................................................................................................. 4229. Boxplots showing peak discharges for Grace Coolidge Creek near Hayward (06404800) and
Bear Gulch near Hayward (06405800) .................................................................................................................... 4530. Boxplots showing ratio of peak discharges per unit area for Bear Gulch near Hayward (06405800)
to Grace Coolidge Creek near Hayward (06404800) .............................................................................................. 4631. Graphs showing cumulative annual peak flows for selected streamflow-gaging stations in
comparison to Grace Coolidge Creek...................................................................................................................... 4832. Map showing burn severity of the Galena Fire determined on the basis of remotely sensed data
from July 3, 1988, and June 20, 1989...................................................................................................................... 5033. Graph showing mean normalized difference vegetation index values for selected areas during or near June ........ 5134. Normalized difference vegetation index images for selected years......................................................................... 5335. Conceptual model of hypothetical peak-flow response for increasing recurrence intervals ................................... 54
TABLES
1. Summary of selected site information for precipitation gages within study area................................................... 232. Selected site information for streamflow-gaging stations used in analyses ........................................................... 253. Summary of precipitation and yield data for selected periods for Battle Creek and Grace Coolidge Creek ......... 344. Estimates of increased annual yield for Grace Coolidge Creek, based on comparison of regression
equations from figure 23......................................................................................................................................... 355. Estimates of increased annual yield for Grace Coolidge Creek, based on comparison of actual
post-burn values with unburned regression equation from figure 23 ..................................................................... 376. Mean normalized difference vegetation index values for selected areas................................................................ 497. Peak-flow frequency estimates for selected recurrence intervals for selected streamflow-gaging stations ........... 528. Annual flow and precipitation data for selected streamflow-gaging stations......................................................... 609. Peak discharges for selected dates for Grace Coolidge Creek and Bear Gulch ..................................................... 62
10. Annual peak flows for selected streamflow-gaging stations, water years 1967-98................................................ 64
IV Contents
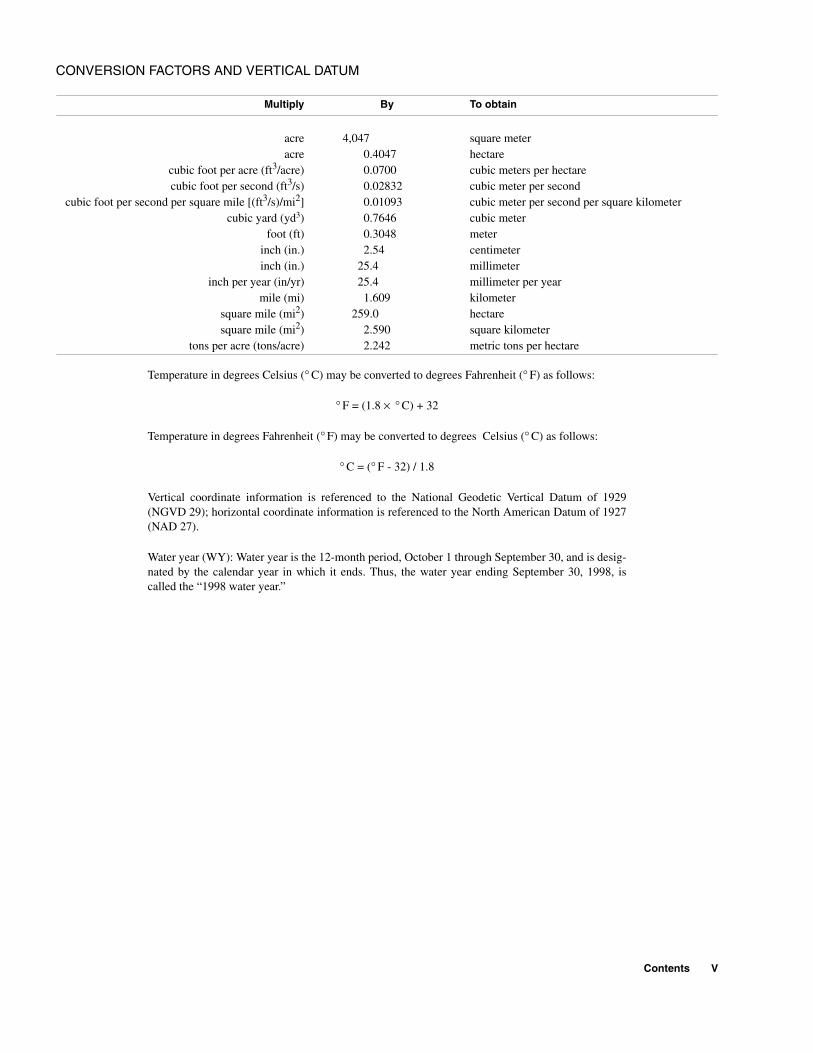
CONVERSION FACTORS AND VERTICAL DATUM
Temperature in degrees Celsius (° C) may be converted to degrees Fahrenheit (° F) as follows:
° F = (1.8 × ° C) + 32
Temperature in degrees Fahrenheit (° F) may be converted to degrees Celsius (° C) as follows:
° C = (° F - 32) / 1.8
Vertical coordinate information is referenced to the National Geodetic Vertical Datum of 1929 (NGVD 29); horizontal coordinate information is referenced to the North American Datum of 1927 (NAD 27).
Water year (WY): Water year is the 12-month period, October 1 through September 30, and is desig-nated by the calendar year in which it ends. Thus, the water year ending September 30, 1998, is called the “1998 water year.”
Multiply By To obtain
acre 4,047 square meteracre 0.4047 hectare
cubic foot per acre (ft3/acre) 0.0700 cubic meters per hectarecubic foot per second (ft3/s) 0.02832 cubic meter per second
cubic foot per second per square mile [(ft3/s)/mi2] 0.01093 cubic meter per second per square kilometercubic yard (yd3) 0.7646 cubic meter
foot (ft) 0.3048 meterinch (in.) 2.54 centimeterinch (in.) 25.4 millimeter
inch per year (in/yr) 25.4 millimeter per yearmile (mi) 1.609 kilometer
square mile (mi2) 259.0 hectaresquare mile (mi2) 2.590 square kilometer
tons per acre (tons/acre) 2.242 metric tons per hectare
Contents V

Hydrologic Effects of the 1988 Galena Fire, Black Hills Area, South DakotaBy Daniel G. Driscoll, Janet M. Carter, and Donald O. Ohlen
ABSTRACT
The Galena Fire burned about 16,788 acres of primarily ponderosa pine forest during July 5-8, 1988, in the Black Hills area of South Dakota. The fire burned primarily within the Grace Coolidge Creek drainage basin and almost entirely within the boundaries of Custer State Park. A U.S. Geological Survey gaging station with streamflow records dating back to 1977 was located along Grace Coolidge Creek within the burned area. About one-half of the gaging station’s 26.8-square-mile drainage area was burned. The drain-age basin for Bear Gulch, which is tributary to Grace Coolidge Creek, was burned particularly severely, with complete deforestation occurring in nearly the entirety of the area upstream from a gaging station that was installed in 1989.
A study to evaluate effects of the Galena Fire on streamflow, geomorphology, and water quality was initiated in 1988. The geomorphologic and water-quality components of the study were completed by 1990 and are summarized in this report. A data-collection network consisting of streamflow- and precipitation-gaging stations was operated through water year 1998 for evaluation of effects on streamflow characteristics, including both annual-yield and peak-flow characteristics, which are the main focus of this report.
Moderately burned areas did not experience a substantial increase in the rate of surface erosion; however, severely burned areas underwent surfi-cial erosion nearly twice that of the unburned areas. The sediment production rate of Bear Gulch estimated 8 to 14 months after the fire was
870 ft3/acre (44 tons/acre). Substantial degrada-tion of stream channels within the severely burned headwater areas of Bear Gulch was documented. Farther downstream, channel aggradation resulted from deposition of sediments transported from the headwater areas.
The most notable water-quality effect was on concentrations of suspended sediment, which were orders of magnitude higher for Bear Gulch than for the unburned control area. Effects on several other water-quality constituents, such as organic carbon and nitrogen and phosphorus nutri-ent constituents, probably were influenced by the large concentrations of suspended matter that were documented in initial post-fire, storm-flow events. The first post-fire stormflow produced the highest measured concentrations of specific conductance, nitrogen, phosphorus, organic carbon, calcium, magnesium, potassium, manganese, and sulfate in the burned areas. For most constituents sampled, differences in concentrations between burned and unburned areas were no longer discernible within about 1 year following the Galena Fire.
The effects of the Galena Fire on annual-yield characteristics of Grace Coolidge Creek were evaluated primarily from comparisons with long-term streamflow records for Battle Creek, which is hydrogeologically similar and is located immediately to the north. Annual yield for Grace Coolidge Creek increased by about 20 percent as a result of the fire. This estimate was based on rela-tions between annual yield for Grace Coolidge Creek and Battle Creek for pre- and post-burn periods. Many of the post-burn data points are well
Abstract 1

beyond the range of the pre-burn data, which is a source of uncertainty for this estimate.
Substantial increases in peak-flow charac-teristics for severely burned drainages were visu-ally apparent from numerous post-fire field observations. Various analyses of streamflow data indicated substantial increases in peak-flow response for burned drainage areas; however, quantification of effects was particularly difficult because peak-flow response diminished quickly and returned to a generally pre-burn condition by about 1991. Field observations of vegetation and analysis of remotely sensed data indicated that establishment of grasses and forbs occurred within a similar timeframe. Comparison of pre-fire peak flows to post-1991 peak flows indicates that these grasses and forbs were equally effective in sup-pressing peak flows as the predominantly ponde-rosa pine forest was prior to the Galena Fire.
Numerous peak-flow events with small recurrence intervals occurred within burned areas through 1990. Peak-flow events for Bear Gulch during this period were about one to two orders of magnitude larger than corresponding peaks for a small control drainage located along Grace Coolidge Creek upstream from the burn area. The small peaks do not provide quantitative informa-tion applicable to estimation of peak-flow magni-tudes for larger events, however. Peak-flow events for Bear Gulch that occurred during 1991-98 were generally similar to those for the control drainage. A short-term increase in peak-flow potential also was documented for the longer-term gaging station located along Grace Coolidge Creek; however, peak-flow response was less pronounced than for Bear Gulch, which had nearly complete deforesta-tion within a much smaller drainage area.
INTRODUCTION
On July 5, 1988, a forest fire was ignited by lightning along Galena Creek, which is a tributary to Grace Coolidge Creek, in the southern Black Hills of southwestern South Dakota. Firefighting efforts ini-tially were largely unsuccessful because of the particu-larly dry conditions of the predominantly ponderosa pine forest; however, the Galena Fire was controlled the
2 Hydrologic Effects of the 1988 Galena Fire, Black Hills Area,
night of July 8 following approximately 0.75 in. of rain. The fire eventually burned about 16,788 acres, primarily within the Grace Coolidge Creek drainage basin and almost entirely within the boundaries of Custer State Park.
A U.S. Geological Survey (USGS) gaging sta-tion with streamflow records dating back to 1977 was located along Grace Coolidge Creek within the burned area. About one-half of the gaging station’s 26.8-mi2 drainage area was burned.
The existence of long-term, pre-burn streamflow data provided a unique opportunity to evaluate the hydrologic effects of forest fire, with potential to obtain additional insights regarding effects of timber harvest on streamflow in the Black Hills area. Numerous studies around the world have addressed the topic of hydrologic influences from silvicultural activities; however, information for the Black Hills area is sparse. In 1988, a study to evaluate effects of the Galena Fire on streamflow, geomorphology, and water quality was initiated by the USGS in cooperation with the South Dakota Department of Environment and Natural Resources and the South Dakota Department of Game, Fish and Parks. The geomorphologic (Whitesides, 1989) and water-quality (Gundarlahalli, 1990) compo-nents of the study were completed by 1990. A data-collection network consisting of streamflow- and pre-cipitation-gaging stations was operated through water year 1998 for evaluation of effects on streamflow char-acteristics. Additional cooperators that have supported this continuing component of the study included the South Dakota Department of Agriculture (Forestry Division), West Dakota Water Development District, and U.S. Department of Agriculture (Forest Service).
Purpose and Scope
The purpose of this report is to describe the hydrologic effects of the 1988 Galena Fire. The main focus is to evaluate effects on streamflow characteris-tics, including both annual-yield and peak-flow charac-teristics. Results from the studies of geomorphology (Whitesides, 1989) and water quality (Gundarlahalli, 1990) also are summarized.
Acknowledgments
The authors acknowledge the various coopera-tors that have provided support throughout the extended duration of this study. Thanks are extended to
South Dakota

staff from the Custer State Park Division of the South Dakota Department of Game, Fish and Parks for assisting with data collection and providing various data sets included in this report. Special thanks are due to Custer State Park Resource Program Manager Ron Walker for continued assistance throughout the dura-tion of this study, including assistance with preparation of this report. The authors also thank Paul Horsted (Dakota Photographic LLC), Rollie Larson (retired Rapid City Central High School ecology teacher), and the Rapid City Journal for providing photographs.
DESCRIPTION OF STUDY AREA
The study area (fig. 1) encompasses the area burned by the Galena Fire. The fire burned about one-half of the drainage area for gaging station 06404998, which is located along Grace Coolidge Creek and has pre-fire records dating back to 1977. The study area also includes French Creek, which is generally south of the burn area, and Battle Creek, which is north of the burn area. Available streamflow records for both of these drainages pre-date the Galena Fire and are used for comparisons with records for station 06404998. Following the Galena Fire, station 06404800 was installed along Grace Coolidge Creek just upstream from the burn area. This station is used for comparisons with station 06405800, which also was installed after the Galena Fire and provides streamflow records for the extensively burned Bear Gulch drainage. Drainages considered for comparisons have general similarities in climate, hydrogeology, and land use, as described in the following sections.
Climate
The climate of southwestern South Dakota is continental, with generally low precipitation amounts, hot summers, cold winters, and extreme variations in both precipitation and temperatures (Johnson, 1933). Climatic conditions in the Black Hills area are influ-enced by orographic effects, with generally lower tem-peratures and higher precipitation at the higher altitudes.
Precipitation patterns are generally similar in all of the drainage basins considered. Mean annual precip-itation for 1961-90 (fig. 2) ranges from about 17 in. in the southeastern part of the study area to more than 20 in. in the higher altitudes. The mean annual
temperature is about 44°F at Custer and 45°F at Mt. Rushmore (National Oceanic and Atmospheric Administration, 1991). Annual evaporation potential generally exceeds annual precipitation throughout the study area. Mean pan evaporation for April through October for two stations located near the study area is about 30 in. at Pactola Reservoir (located north of the study area) and about 50 in. at Oral (located southeast of the study area) (National Oceanic and Atmospheric Administration, 1991).
Conditions in the study area prior to the Galena Fire on July 5, 1988, were hot and dry. Precipitation during May was 0.76 in. below normal at Custer and 0.37 in. below normal at Mt. Rushmore; June precipi-tation at these sites was 1.38 and 1.73 in. below normal, respectively (National Oceanic and Atmo-spheric Administration, 1988). Daily maximum air temperatures during late May and June prior to the Galena Fire generally were 10 to 20°F higher than normal for the Custer and Mt. Rushmore stations (fig. 3), and mean temperatures for June 1988 for these stations were the highest on record (South Dakota State University, 2003). These high tempera-tures coupled with scant precipitation created extreme fire potential.
Hydrogeology
Hydrology within the Black Hills area is greatly influenced by geology (Driscoll and Carter, 2001), which is highly complex. The Black Hills uplift is a northwest-trending, asymmetric, elongate dome, or doubly plunging anticline. Uplift began about 62 mil-lion years ago during the Laramide orogeny and prob-ably continued in the Eocene period (Redden and Lisenbee, 1996). The oldest rocks in the study area are the igneous and metamorphic rocks of Precambrian age (fig. 4), which are exposed in the “crystalline core” of the central Black Hills (fig. 5). A sequence of younger sedimentary rocks is exposed around the periphery of the Black Hills area and includes out-crops of the Cambrian- and Ordovician-age Dead-wood Formation, the Mississippian-age Madison Limestone (also locally known as the Pahasapa Lime-stone), and the Pennsylvanian- and Permian-age Minnelusa Formation. This layered sequence has been erosionally removed from the crystalline core area. The bedrock sedimentary formations typically dip away from the uplifted Black Hills at angles that can approach or exceed 15 to 20 degrees near the outcrops (Carter and others, 2002).
Description of Study Area 3

Figure 1. Location of study area. Locations of streamflow-gaging stations within the study area also are shown.
Red
Canyon
Creek
Beaver
Battle
Spokane
Gulch
Bear
Iron
Flynn
Creek
Cr
Spri
ngC
reek Creek
Creek
French
Lame
Johnny
GraceCoolidge
Creek
Creek
Creek
Creek
Creek
Highland
CenterLake
LegionLake
BismarckLake
StockadeLake
Galena
PENNINGTON COUNTYPENNINGTON COUNTY
CUSTER COUNTYCUSTER COUNTYPENNINGTON COUNTY
CUSTER COUNTY
Custer
Pringle
Hermosa
Fairburn
Keystone
Hayward
Hill City
0640580006405800
06405000064050000640499806404998
0640480006404800
0640400006404000
0640330006403300
06405800
0640500006404998
06404800
06404000
06403300
SOUTH DAKOTABlackHills Missouri
River
Studyarea
CusterCuster
StateState
ParkPark
Custer
State
Park
103º45' 103º30' 103º15'
43º52'30"
43º45'
43º37'30"
0 642 531 MILES
0 642 531 KILOMETERS
Base modified from U.S. Geological Survey digital data, 1:100,000, 1977Fire perimeter from U.S. Forest Service digital data, 1:100,000Universal Transverse Mercator projection, zone 13
X
XMt.
Coolidge
HarneyPeak
EXPLANATIONCUSTER STATE PARK
GALENA FIRE BURN AREA
DRAINAGE BASIN BOUNDARY
STREAMFLOW-GAGING STATION— Number is station number
Wind Cave National Park
Mt. RushmoreNationalMemorial
06405000
4 Hydrologic Effects of the 1988 Galena Fire, Black Hills Area, South Dakota

Figure 2. Isohyetal map showing distribution of average annual precipitation for the Black Hills area, water years 1961-90 (from Driscoll and others, 2000). Locations of streamflow-gaging stations outside the study area also are shown.
Belle FourcheReservoir
FOURCHE
Rhoa
dsFork
Coolidge
AngosturaReservoir
Hell
Canyon
Can
yon
Red
Creek
Crow
SheridanLake
CenterLake
DeerfieldReservoir
PactolaReservoir
OwlCreek
BELLE
RIVER
REDWATER R I VE
R
Cre
ek
Cr
Lit
tle
Spea
rfis
h
Spea
rfis
h
Whi
tewoo
d
Cre
ek
Creek
Bear
Butte
ElkCreek
Creek
Boxelder
Rapid
Rapid
Creek
CreekSpring
Creek
Creek
CreekG
raceCreek
Battle
French
Beaver
Creek
Creek
Cre
ek
Creek
FallR
Hat
Cre
ek
Creek
Horsehead
CHEYENNE
RIVER
Cot
tonw
ood
CreekHay
Bot
tom
False
Creek
Lame
Johnny
Bea
ver
Cre
ek
Cottonwood
Castle
Cas
tleCreek
C reek
Bear Gulch
Creek
Elk
Whitewood
Spearfish
SaintOnge
DEADWOOD
Englewood
Dumont
Lead
BELLE FOURCHE
Newell
STURGIS
Blackhawk
Piedmont
Tilford
Box Elder
RAPID CITY
Hill City
Hermosa
CUSTER
HOT SPRINGS
Edgemont
Tinton
Roubaix
Nemo
Vale
Hayward
Keystone
Deerfield
Moon
Redfern
Rochford
Pringle
Fairburn
Buffalo Gap
Dewey
Provo
Oral
Mystic
Wind CaveNational Park
Jewel CaveNational Monument
Mt. RushmoreNationalMemorial
CUSTER
STATE
PARK
WindCave
HarneyPeak x
TerryPeak
CrooksTowerx
x
BUTTE CO
LAWRENCE CO MEADE CO
PENNINGTON CO
CUSTER CO
FALL RIVER CO
WY
OM
ING
SO
UT
H D
AK
OT
A
104o 45' 103o30'
15' 103o
30'
44o45'
15'
44o
45'
30'
43o15'
1617
1819
2021
29
28
25 27
27
2626
25
24
24
19
23
23
20
22
22
21
20
20 18
19
18
17
17
16
16
3,000
4,000
4,000
3,000
3,000
5,00
0
5,000
3,0006,000
6,000
3,000
7,000
3,000
3,000
5,000
5,000
7,000
7,000
7,0007,000
7,000
5,000
6,000
6,000
4,00
0
6,000
6,0005,000
4,00
0
4,000
4,000
3,000
3,000
4,000
5,000
0643150006431500
0643619006436190
0640250006402500
0642550006425500
0642250006422500
06422500
06431500
06436190
06402500
06425500
06422500
0 10 20
0 10 20 MILES
KILOMETERS
Base modified from U.S. Geological Survey digital data,1:100,000, 1977, 1979, 1981, 1983, 1985Rapid City, Office of City Engineer's map, 1:18,000, 1996Universal Transverse Mercator projection, zone 13
LINE OF EQUAL PRECIPITATION—Number is average annual precipitation in inches
STUDY AREAEXPLANATION
20
LAND-SURFACE CONTOUR—Number is altitude above NGVD 29. Contour interval 1,000 feet
STREAMFLOW-GAGING STATION— Number is station number
SOUTH DAKOTA
Areashown
Missouri
River
Description of Study Area 5

Figure 3. Air temperatures at Custer and Mt. Rushmore climatic stations prior to and during the Galena Fire. Data from South Dakota State University (2003) and National Oceanic and Atmospheric Association (1988).
DATE
40
50
60
70
80
90
100Climatic station at Custer
5/16/1988 5/31/1988 6/15/1988 6/30/1988 7/15/198840
50
60
70
80
90
100
TE
MP
ER
AT
UR
E, I
N D
EG
RE
ES
FA
HR
EN
HE
IT
Climatic station at Mt. Rushmore National Memorial
Normal maximum daily temperature (1971-2000)
Normal maximum daily temperature (1971-2000)
Measured maximum daily temperature
Measured maximum daily temperature
Start ofGalena Fire
Start ofGalena Fire
6 Hydrologic Effects of the 1988 Galena Fire, Black Hills Area, South Dakota

CRIPTION
y.
stone channel fillings and local limestone lenses.
lenses forming teepee buttes.
attered concretions.
asses, forming small teepee buttes.
tions.
shale.
us large concretions and sandy layers.
athers buff.
ith thin Orman Lake limestone at base.
estone concretions.
h scales and thin layers of bentonite.
ite sandstone.
ale.
n to reddish-brown sandstone.
rown massive to thinly bedded sandstone, pebbled claystone. Local fine-grained limestone and coal.
sandstone.ne.
stone lenses.
ndstone near middle.
estone.
tone and siltstone with gypsum and thin limestone layers..-grained, purplish gray laminated limestone.
ndstone, limestone, and anhydrite locally at top.
mestone and sandstone at base.
ne. Dolomite in part. Cavernous in upper part.
locally at base.
o purple sandstone. Greenish glauconitic shale, flaggymestone conglomerate. Sandstone, with conglomerate
kosic grit. Intruded by diorite, metamorphosednite and pegmatite.
partment of Geology and Geological Engineeringand Technology (written commun., January 1994)
te, and phonolite.
tone, dolomite, shale, and anhydrite.
Descrip
tion
of S
tud
y Area
7 Figure 4. Stratigraphic section for the Black Hills area.
GEOLOGIC UNIT DESTHICKNESSIN FEET
ABBREVIATIONFOR
STRATIGRAPHICINTERVAL
SYSTEMERATHEM
QUATERNARY& TERTIARY (?)
UNDIFFERENTIATED ALLUVIUM AND COLLUVIUM 0-50 Sand, gravel, boulder, and cla
1,200-2,700
Light colored clays with sandWHITE RIVER GROUPTw
TERTIARY
QTac
Principal horizon of limestone
Dark-gray shale containing sc
Widely scattered limestone m
Black fissile shale with concre
PIERRE SHALE
NIOBRARA FORMATION 180-300 Impure chalk and calcareous
CARLILE SHALE Turner Sandy Member
Wall Creek Member
1350-750Light-gray shale with numero
Dark-gray shale
GR
AN
ER
OS
GR
OU
P
GREENHORN FORMATION
Kps
225-380Impure slabby limestone. We
Dark-gray calcareous shale, w
BELLE FOURCHE SHALE
MOWRY SHALE
MUDDYSANDSTONE
NEWCASTLESANDSTONE
SKULL CREEK SHALE
150-850Gray shale with scattered lim
Clay spur bentonite at base.
125-230
0-150
Light-gray siliceous shale. Fis
Brown to light-yellow and wh
150-270 Dark-gray to black siliceous sh
CRETACEOUS
FALL RIVER FORMATION
LAK
OT
AFM
INY
AN
KA
RA
GR
OU
P Fuson ShaleMinnewaste LimestoneChilson Member
10-200 Massive to thin-bedded, brow
Yellow, brown, and reddish b conglomerate, siltstone, an
10-190
0-25
25-485
0-220
0-225Green to maroon shale. ThinMassive fine-grained sandsto
250-450
0-45
Greenish-gray shale, thin lime
Glauconitic sandstone; red sa
Red siltstone, gypsum, and lim
MORRISON FORMATION
UNKPAPA SS Redwater MemberLak MemberHulett MemberStockade Beaver Mem.Canyon Spr Member
SUNDANCEFORMATION
GYPSUM SPRING FORMATION
Kik
JuJURASSIC
Goose Egg EquivalentSPEARFISH FORMATIONT PsR
TRIASSIC
MINNEKAHTA LIMESTONEOPECHE SHALEPo
Pmk
375-800
125-65
Red silty shale, soft red sandsGypsum locally near the baseThin to medium-bedded, fineRed shale and sandstone.125-150
1375-1,175
1<200-1,000
30-6010-23510-150
10-500
Yellow to red cross-bedded sa
Red shale with interbedded li
Massive light-colored limesto
Pink to buff limestone. ShaleBuff dolomite and limestone.Green shale with siltstone.Massive to thin-bedded buff t dolomite, and flat-pebble li locally at the base.
Schist, slate, quartzite, and ar to amphibolite, and by gra
PERMIAN
PENNSYLVANIAN
MISSISSIPPIAN
P Pm MINNELUSA FORMATION
MADISON (PAHASAPA) LIMESTONE
ENGLEWOOD FORMATION
MDme
Ou
DEVONIANWHITEWOOD (RED RIVER) FORMATIONWINNIPEG FORMATION
DEADWOOD FORMATION
UNDIFFERENTIATED IGNEOUSAND METAMORPHIC ROCKS
OCd
pCu
ORDOVICIAN
CAMBRIAN
PRECAMBRIAN
PA
LEO
ZO
ICM
ES
OZ
OIC
CE
NO
ZO
IC
Modified from information furnished by the DeSouth Dakota School of Mines
0-300Includes rhyolite, latite, trachyINTRUSIVE IGNEOUS ROCKSTui --
1Modified based on drill-hole data
Interbedded sandstone, limes

Figure 5. Geology of the study area (modified from Strobel and others, 1999).
QTac
Tw
Kps
Ju
TRPs
MDme
Kik
Pmk
Po
PPm
OCd
pCu
PENNINGTON COUNTY
CUSTER COUNTY
Custer
Pringle
Hermosa
Fairburn
Keystone
Hayward
Hill City
Red
Canyon
Creek
Beaver
Battle
Spokane
Gulch
Bear
Iron
Flynn
Creek
Cr
Spri
ngC
reek Creek
Creek
French
Lame
Johnny
GraceCoolidge
Creek
Creek
Creek
Creek
Creek
Highland
CenterLake
LegionLake
BismarckLake
StockadeLake
Galena
X
XMt.
Coolidge
HarneyPeak
Custer
State
Park
103º45' 103º30' 103º15'
43º52'30"
43º45'
43º37'30"
0 642 531 MILES
0 642 531 KILOMETERS
Base modified from U.S. Geological Survey digital data, 1:100,000, 1977Universal Transverse Mercator projection, zone 13
EXPLANATION
Wind Cave National Park
Mt. RushmoreNationalMemorial
FAULT—Bar and ball on downthrown side
ANTICLINE—Showing trace of axial plane and direction of plunge. Dashed where approximated
SYNCLINE—Showing trace of axial plane and direction of plunge. Dashed where approximated
MONOCLINE—Showing trace of axial plane. Dashed where approximated
GEOLOGIC UNITSAlluvium and colluvium, undifferentiatedWhite River GroupPierre Shale to Skull Creek Shale, undifferentiatedInyan Kara GroupMorrison Formation to Sundance Formation, undifferentiatedSpearfish FormationMinnekahta LimestoneOpeche ShaleMinnelusa FormationMadison (Pahasapa) Limestone and Englewood FormationDeadwood FormationUndifferentiated igneous and metamorphic rocks
8 Hydrologic Effects of the 1988 Galena Fire, Black Hills Area, South Dakota

The study area is underlain primarily by Precam-brian igneous and metamorphic rocks that consist mostly of the Harney Peak granite and quartzite, with lesser amounts of granitic pegmatite and schist (DeWitt and others, 1989; Strobel and others, 1999). The Dead-wood, Madison, and Minnelusa Formations underlie a much smaller portion of the burned area than the Pre-cambrian rocks.
Although geology within the study area is com-plex (fig. 5), streamflow records for analyses of annual-yield characteristics for this study are consid-ered only for drainage areas upstream from outcrops of the Madison Limestone. These drainages are dom-inated by outcrops of Precambrian igneous and meta-morphic rocks and are within the “crystalline core” hydrogeologic setting identified by Driscoll and Carter (2001). Streamflow characteristics for this set-ting are typified by relatively small base flow and strong correlations between annual streamflow and precipitation.
Most streams, including Grace Coolidge Creek, generally lose all or part of their flow as they cross the outcrop of the Madison Limestone (Rahn and Gries, 1973; Hortness and Driscoll, 1998). Large streamflow losses also occur in many locations within the outcrop of the Minnelusa Formation, and limited losses prob-ably also occur within the outcrop of the Minnekahta Limestone (Hortness and Driscoll, 1998).
The Precambrian basement rocks generally have low permeability and form the lower confining unit for the series of aquifers in sedimentary rocks in the Black Hills area. Driscoll and others (2002) assumed negli-gible regional ground-water outflow for Precambrian rocks; however, localized aquifers within Precambrian rocks occur in many locations in the crystalline core of the Black Hills, where enhanced secondary perme-ability results from weathering and fracturing. Ground-water discharge from Precambrian rocks provides base flow for streams in the study area, especially at higher altitudes where moisture surpluses result from increased precipitation and reduced evapotranspiration. Base flow can diminish very quickly during particularly dry periods.
Within the Paleozoic rock interval, aquifers in the Deadwood Formation, Madison Limestone, Minnelusa Formation, and the Permian-age Minnekahta Lime-stone are used extensively and are considered to be major aquifers in the Black Hills area. These aquifers receive recharge from infiltration of precipitation on
outcrops, and the Madison and Minnelusa aquifers also receive significant recharge from streamflow losses. These aquifers are collectively confined by the underlying Precambrian rocks and the overlying Spearfish Formation, where present (fig. 5). Individu-ally, these aquifers are separated by minor confining units or by relatively impermeable layers within the individual units. In general, ground-water flow in these aquifers is radially outward from the crystalline core of the Black Hills.
Land Use
Although a wide variety of land ownership exists within the study area (fig. 6), hydrologic differ-ences resulting from differing land uses within the drainages considered probably are relatively minor. Most of the burn area is within Custer State Park (fig. 1). Drainage basins used for comparisons consist of various combinations of land ownership; however, the U.S. Forest Service (USFS) is the majority land-holder in all of the comparison basins. Private land-holdings, which are excluded from the Black Hills National Forest, are common within parts of the com-parison basins. The Battle Creek drainage includes Mt. Rushmore National Memorial, which is adminis-tered by the National Park Service.
Land use and vegetation patterns generally are similar throughout the study area, regardless of land ownership. The predominant tree species throughout the study area is ponderosa pine. Historically, ponde-rosa pine has been the primary species utilized by a timber industry that has existed since the earliest European settlement of the area, which began soon after the Custer Expedition of 1874 when gold was discovered in French Creek. White spruce, which are locally known as Black Hills spruce, occasionally are intermixed with ponderosa pine stands, most com-monly in locations that are particularly damp or well shaded. Various deciduous species exist throughout the study area, most commonly in bottom areas. Bur oak and ironwood typically are found at lower alti-tudes and give way to aspen and paper birch at higher altitudes (Ron Walker, Custer State Park, oral commun., 1989).
Description of Study Area 9

Figure 6. Land ownership in study area.
Red
Canyon
Creek
Beaver
Battle
Spokane
Gulch
Bear
Iron
Flynn
Creek
Cr
Spri
ngC
reek Creek
Creek
French
Lame
Johnny
GraceCoolidge
Creek
Creek
Creek
Creek
Creek
Highland
CenterLake
LegionLake
BismarckLake
StockadeLake
Galena
PENNINGTON COUNTY
CUSTER COUNTY
Custer
Pringle
Hermosa
Fairburn
Keystone
Hayward
Hill City
CusterCuster
StateState
ParkPark
Custer
State
Park
103º45' 103º30' 103º15'
43º52'30"
43º45'
43º37'30"
0 642 531 MILES
0 642 531 KILOMETERS
Base modified from U.S. Geological Survey digital data, 1:100,000, 1977Land ownership data from U.S. Forest Service digital data, 1:100,000, 2003Universal Transverse Mercator projection, zone 13
X
XMt.
Coolidge
HarneyPeak
EXPLANATION
CUSTER STATE PARK
Wind Cave National Park
Mt. RushmoreNationalMemorial
NORBECK WILDLIFE PRESERVE
BLACK ELK WILDERNESS
PRIVATE
BLACK HILLS NATIONAL FOREST
NATIONAL PARK
10 Hydrologic Effects of the 1988 Galena Fire, Black Hills Area, South Dakota

Land use within the study area historically has been dominated by timber harvesting and cattle grazing. One or both of these land uses have occurred to at least some extent throughout most of the study area since shortly after the Custer Expedition, in support of the mining industry. Grazing typically has been concen-trated in the more heavily grassed bottom areas, many of which are in private ownership. Grassed understories within timber stands frequently are utilized during summer months, and private grazing permits are issued for many allotments within the Black Hills National Forest. An important focus of land management within Custer State Park is production of grasses for grazing by buffalo and a variety of big game.
Numerous other land uses have existed within the study area. Initial settlement of the area was during the gold rush, so in addition to mining, other support industries such as railroads and agriculture were common. Current mining activity is minimal, but most private lands exist on former mining claims or along relatively open bottom areas where agricultural activ-ities (including grazing) were feasible. At the higher altitudes, cultivated cropland is uncommon and agri-cultural activities generally are limited to animal hus-bandry and hay production. Tourism has been a stable industry in the area since soon after the horseless carriage was invented. Outdoor recreation, including bicycling, fishing, hiking, and hunting, have become increasingly popular throughout the Black Hills area. During recent years, suburban growth has been increasing around the small communities in the study area. Although there are no urban areas within Custer State Park, tourist accommodations and facilities for Park staff are similar to many suburban areas throughout the study area.
Timber Management and Burn Characteristics
Most studies that have addressed the effects of timber harvest on water yield have utilized various indices of timber stand condition or density. Numerous records undoubtedly exist for various tracts of USFS land within the study area; however, documenting changes in timber stand conditions for numerous tracts of private land in the study area would not be practical. It is useful, however, to provide a general overview of the history of timber management in the area.
Streamflow records considered for this study could potentially be influenced by timber management
dating back many decades. Various photographs taken during the 1874 Custer Expedition have been used to document long-term increases in ponderosa pine den-sity (Progulske, 1974; Grafe and Horsted, 2002), and an example photograph pair is shown in figure 7. Increased density has resulted primarily from imple-mentation of fire suppression since the arrival of European settlers in the area. Many parts of the French Creek drainage upstream from Stockade Lake have particularly large open areas that may result from a combination of fire effects before 1874 and subse-quent human maintenance of open areas. In general, fire suppression can substantially reduce both the gen-eral percentages of open areas and ratios of mature to immature pines in typical stands. Fire suppression also causes reduced species diversity with increased dominance of ponderosa pine (Brown and Sieg, 1996).
Most studies of hydrologic effects of timber harvest have been conducted in small watersheds under highly controlled conditions. Hydrologic effects of timber management may be difficult to discern in large watersheds because timber stand conditions can be quite dynamic. Reduced timber stand density resulting from harvest or widespread mortality in a large watershed can be offset by ongoing timber growth in other parts of the watershed.
Timber Management
In spite of the wide variety in land ownership, timber management practices throughout the study area historically have been similar. Most parts of the study area with merchantable timber stands have been subject to selective-cut harvest practices during the last century and repeated rotational harvests have occurred in many locations. Logging methods in the study area have been largely independent of land own-ership and over time have evolved from hand saws and animal-drawn equipment to complete mechanization, in many cases. Logging practices have evolved from high grading of the most desirable and accessible saw timber to highly controlled timber sales that can include pre-commercial thinning of non-merchantable timber throughout large areas. Large-scale clear cuts have been uncommon in the Black Hills area because of various factors including the particularly prolific germination characteristics of ponderosa pine in the area and propensity towards multi-story stands.
Description of Study Area 11

Figure 7. Photographs showing increase in pine forest between 1874 and 2000 in the Black Hills. (Photo pair is from the book, Exploring with Custer: The 1874 Black Hills Expedition, by Ernest Grafe and Paul Horsted. Published by Golden Valley Press, Custer, South Dakota. Information at www.custertrail.com. Used with permission.)
Wagon train passing through Castle Creek Valley, July 26, 1874
12 Hydrologic Effects of the 1988 Galena Fire, Black Hills Area, South Dakota

Figure 7. Photographs showing increase in pine forest between 1874 and 2000 in the Black Hills. (Photo pair is from the book, Exploring with Custer: The 1874 Black Hills Expedition, by Ernest Grafe and Paul Horsted. Published by Golden Valley Press, Custer, South Dakota. Information at www.custertrail.com. Used with permission.)—Continued
July 2000
Description of Study Area 13

Local logging practices at any given time typi-cally have been heavily influenced by standards estab-lished by the USFS, which administers the majority of forest lands in the study area. The Black Hills Forest Reserve was established in 1897 by President Grover Cleveland and in 1905 was transferred to the USFS, an agency of the U.S. Department of Agriculture, for management of forested lands in the Black Hills (U.S. Forest Service, 1994). It was renamed the Black Hills National Forest in 1907. The first commercial timber sale on Federal forested land in the United States was authorized in 1898 near the town of Nemo in the northern Black Hills (fig. 2).
In 1912, about 50,000 acres in Custer County were designated Custer State Forest, which was estab-lished as Custer State Park in 1919 through efforts by South Dakota Governor Peter Norbeck. Additional lands were acquired in the 1920s and in 1964. Custer State Park now encompasses about 71,000 acres and is one of the largest State parks in the United States.
From 1917 to 1927, approximately 45 million board feet of pine timber were harvested from Custer State Forest/Park (Walker and others, 1995). In 1927, the South Dakota Legislature limited harvesting in Custer State Park to 100,000 board feet per year. There are no records of timber sales from 1927-1951 (Walker and others, 1995).
Extensive non-commercial timber management occurred in Custer State Park during the 1930s through efforts by the Civilian Conservation Corps (CCC). The CCC also made many improvements throughout the park including campgrounds, lodges, roads, and bridges. Additionally, the CCC built the dams that created Stockade, Center, and Legion Lakes.
Timber harvesting in Custer State Park resumed in 1951; however, management activities generally were very limited until the late 1970s when an aggres-sive timber management program was initiated. Exten-sive pre-commercial thinning was performed in the northwestern part of Custer State Park as part of this program. Effects of thinning activities are visible in an aerial photograph from 1978 (fig. 8), in which the western boundary of Custer State Park is clearly apparent because of lower timber density east of the boundary. The boundary also is clearly apparent in an aerial photograph from 2000 (fig. 8), which shows a general reversal of relative timber densities that resulted from timber growth within Custer State Park
14 Hydrologic Effects of the 1988 Galena Fire, Black Hills Area
and decreased density from timber harvest that occurred west of the boundary during the 1990s. Thus, the dynamic nature of timber stand density is well illus-trated by these aerial photographs.
Relatively recent (last few decades) timber man-agement in many parts of the drainages used for com-parisons with Grace Coolidge Creek probably has been fairly similar to that which has occurred in Custer State Park. A general exception is the Norbeck Wildlife Pre-serve, which was established in 1920 by Congress. The preserve includes about 35,000 acres, of which 27,800 acres are managed by the USFS and most of the rest is part of Custer State Park (fig. 6). A relatively long period of logging inactivity in the Norbeck Wild-life Preserve occurred between the Cayauga Timber sale in the 1970s and the Needles 2 Timber sale that began in 2002 (Blaine Cook, U.S. Forest Service, oral commun., 2003) because of environmental challenges. The Norbeck Wildlife Preserve includes the 13,426-acre Black Elk Wilderness Area (fig. 6), which was established in 1980 and in which logging activity is precluded because mechanized equipment is not allowed.
Burn Characteristics
The Galena Fire (figs. 1 and 9), which burned 16,788 acres, stands out as the most notable recent change in forest cover within the study area. About 8,569 acres (13.4 mi2) of the burned area were within the 26.8 mi2 drainage area for gaging station 06404998, which represents about 50 percent of the drainage area. In 1990, the Cicero Peak Fire burned about 14,203 acres along both sides of the western boundary of Custer State Park, from the southwestern edge of the Galena Fire and extending to about 6 mi south of there (fig. 10). The Cicero Peak Fire was pri-marily within the Flynn Creek drainage and other drainages to the south, but also included a small part (about 9 mi2) of the French Creek drainage, which is used for comparisons with burned drainages. Numerous other small fires with little potential for sub-stantial hydrologic influence have occurred during recent decades; however, no documentation or evi-dence of other particularly large fires in the study area has been identified.
, South Dakota

Figure 8. Aerial photographs showing changes in forest cover near northwestern corner of Custer State Park.
Custer
State
Park
Imagearea
SOUTH DAKOTA
Studyarea
Studyarea
Photograph from June 5, 2000Photograph from July 27, 1978
Photographs courtesy of Custer State Park
Description of Study Area 15

16 Hy
Figure 9. Landsat image of area burned by Galena Fire. Custer State Park boundary depicted on 1988 image is generalized.
103º30' 103º25' 103º20'
43º45'
43º50'
43º40'
U.S. Geological Survey/Geography Discipline, EROS Data CenterLANDSAT Thematic Mapper, 7/27/1988Modified from Scene ID: Y4220317055XOUniversal Transverse Mercator projection, zone 13
drologic Effects of the 1988 Galena Fire, Black Hills Area, South Dakota
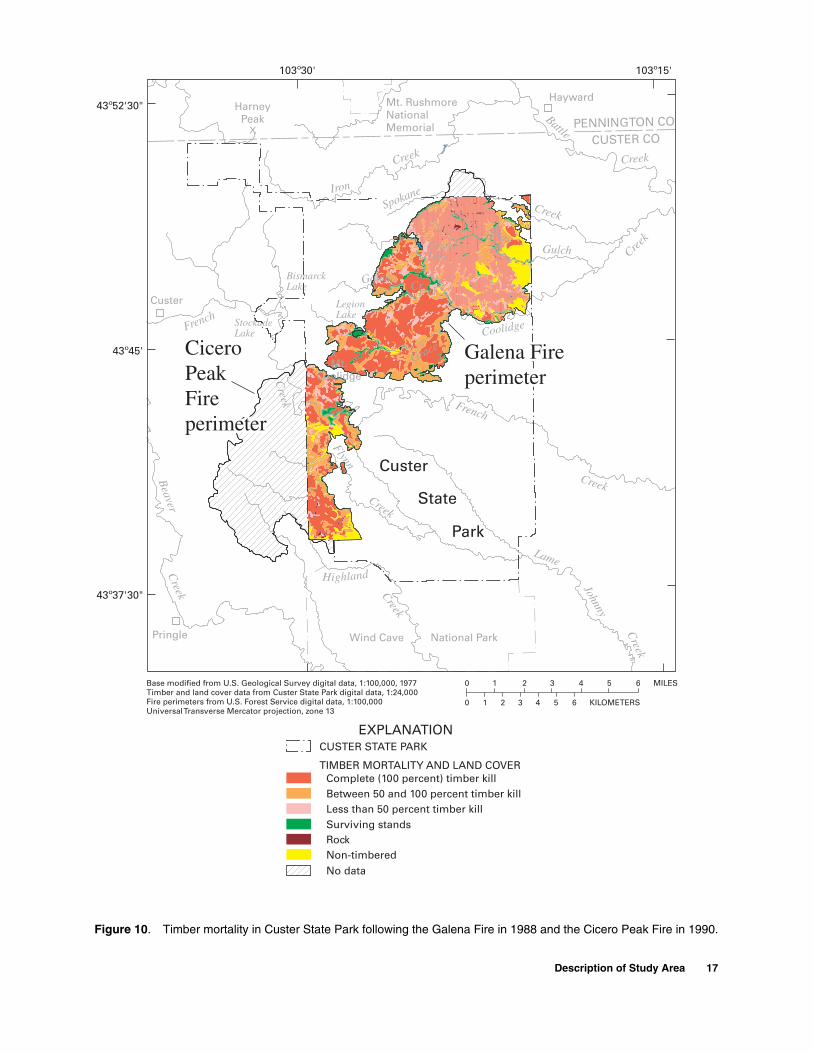
Figure 10. Timber mortality in Custer State Park following the Galena Fire in 1988 and the Cicero Peak Fire in 1990.
TIMBER MORTALITY AND LAND COVERComplete (100 percent) timber kill
Less than 50 percent timber killBetween 50 and 100 percent timber kill
RockNon-timbered
Surviving stands
No data
Creek
Beaver
Battle
Spokane
Gulch
Bear
Iron
Flynn
Creek
Cr
Creek
Creek
Creek
Creek French
French
Lame
Johnny
GraceCoolidge
Creek
Creek
Creek
Creek
Highland
CenterLake
LegionLake
BismarckLake
StockadeLake
Galena
PENNINGTON CO
CUSTER CO
Custer
Pringle
Hayward
Custer
State
Park
0 642 531 MILES
0 642 531 KILOMETERS
Base modified from U.S. Geological Survey digital data, 1:100,000, 1977Timber and land cover data from Custer State Park digital data, 1:24,000Fire perimeters from U.S. Forest Service digital data, 1:100,000Universal Transverse Mercator projection, zone 13
Mt.Coolidge
HarneyPeak
EXPLANATIONCUSTER STATE PARK
Wind Cave National Park
Mt. RushmoreNationalMemorial
103º30' 103º15'
43º52'30"
43º45'
43º37'30"
X
XCiceroCiceroPeakPeakFireFireperimeterperimeter
Galena FireGalena Fireperimeterperimeter
CiceroPeakFireperimeter
Galena Fireperimeter
Description of Study Area 17

As with most forest fires, burn intensities of the Galena Fire varied immensely. A few limited areas suf-fered only partial consumption of surface fuels, usually within valley bottoms. Most hillslopes and hilltops burned much more intensely, however, because of generally drier fuels, better air circulation, and upward convection of massive heat generated. Total crown con-sumption was common in many such areas. Because of extreme fire conditions, particularly large tracts were burned very intensely, with total mortality of timber stands occurring in numerous and widespread areas (fig. 10), accounting for about 54 percent of the area within the fire perimeter. About 29 percent of the area within the fire perimeter had partial timber mortality, and only 7 percent of the area had surviving timber stands initially following the fire. Most of the sparse remaining surviving timber stands have suffered addi-tional mortality from wind throw, breakage, and disease (Walker and others, 1995). About 10 percent of the area within the fire perimeter was non-timbered.
Available fuel in many of the severely burned areas was almost entirely consumed, with the general exception of standing tree boles, which typically do not burn completely. Such areas typically incurred crown consumption; near-total consumption of surface fuels, which include forest floor litter and fuels to a height of about 4 ft; and widespread consumption of ground fuels, which include duff, roots, punky wood, and peat located beneath the floor litter (Walker and others, 1995). Ground-surface temperatures were sufficient to cause spalling of rocks (fig. 11) in many locations.
Figure 11. Spalling of granite due to intense heat from Galena Fire.
Photograph by Dietrich H. Whitesides
18 Hydrologic Effects of the 1988 Galena Fire, Black Hills Area
One possible effect of forest fire is development of water repellent or “hydrophobic” soils (Doerr and others, 2000) that can increase runoff potential because of decreased permeability within the soil horizon. When surface and ground fuels burn, the types of vola-tile organic compounds that are released depend upon the temperature of the fire. Some of the compounds may condense on soil particles below the soil surface where temperatures are relatively cooler than at the soil surface. This process does not necessarily create a uniform hydrophobic layer below the soil surface because the fire-induced hydrophobicity reflects the mosaic distribution of surface and ground fuels that burn and the variable heat impulse from the fire into the soil (DeBano, 2000).
Initial post-fire remediation consisted of various components (South Dakota Department of Environ-ment and Natural Resources, 1991). Logging opera-tions that were performed by private contractors during 1988-89 salvaged virtually all accessible stands of merchantable timber within the burn area. The Soil Conservation Service participated in several watershed stabilization projects in various severely burned loca-tions that were prioritized for erosion control measures. Sediment traps were constructed from straw bales in numerous small channels. Hillside terraces that were anchored with downslope log barriers were constructed using earth-moving equipment in selected locations. Cross-slope felling and slash spreading were imple-mented in some hillside areas, and occasional slash piling was emplaced in small channels. Various agen-cies participated in aerial seeding efforts during 1988, with yellow blossom sweet clover sown over about 5,000 acres of severely burned hillsides and annual rye grass sown over about 500 acres of drainage bottoms.
Additional remediation efforts included limited pine seeding (totaling about 300 acres) and seeding of grass mixes on logging roads (about 140 acres including about 20 acres of landings). Reseeding of grass mixes was done in a 970-acre area in the Bear Gulch drainage after a 1989 survey indicated failure to meet an established target of 20 percent ground cover (South Dakota Department of Environment and Natural Resources, 1991). A 1990 survey indicated exceedance of a 40 percent ground cover target in nearly all areas that were seeded (Walker and others, 1995); thus, no further seeding was performed.
Regeneration of woody vegetation, including ponderosa pine, has been particularly slow in the burned area. Regeneration of species such as bur oak,
, South Dakota

ironwood, aspen, and birch probably has been slow because root stock was entirely consumed in many locations. Regeneration of ponderosa pine has been slow in many locations because of sparsity and remote-ness of seed stock. Pictures showing the aftermath (circa 1988-89) are presented in figure 12. The regrowth of vegetation following the fire is docu-mented in a series of post-fire photographs taken from a site on the northeastern flank of Mt. Coolidge (fig. 13). Particularly heavy growth of yellow blossom sweet clover occurred during 1990. Various grasses and forbs, such as clover and dandelions, also began to re-establish, and vegetation has been dominated by grasses during subsequent years.
PREVIOUS INVESTIGATIONS
Numerous previous investigations have docu-mented hydrologic effects of logging activities. Most of these studies have been in controlled settings and have indicated increased water yield associated with decreased forest cover (Bosch and Hewlett, 1982) because of decreased evapotranspiration potential. Hydrologic changes after logging in Oregon coastal watersheds were presented by Harris (1977) and Beschta (1978). During the 7 years following logging in the watershed, sediment yield increased about 180 percent and annual runoff increased 19 in. (Harris, 1977). More recently, Bowling and others (2000) reported on the hydrologic effects of logging on 23 watersheds in western Washington.
Locally, Anderson (1980) evaluated the effects of selective timber harvest on water yield in the Sturgis Watersheds, which was a small research site operated by the USFS in the northern Black Hills of South Dakota. For 8 years of post-harvest data, measured annual water yield in the harvested water-shed averaged 8.05 in., relative to a predicted yield of 6.12 in., based on regression analysis with annual yield for a control watershed. Thus, annual yield increased 1.93 in., or about 30 percent, relative to pre-harvest conditions. The largest increases generally occurred during the wettest years; however, per-centage increases were largest during dry years. No discernible decrease in yield characteristics occurred during the 8-year post-harvest period for which data were collected.
Various previous investigations also have addressed hydrologic effects of forest fire, which typi-cally can include increased stormflow potential and associated erosion rates from removal of ground cover and development of water-repellent characteristics in the soil horizon. Local investigations are sparse; how-ever, data for 1989-91 for Bear Gulch (within the area of the Galena Fire) were considered by Moody and Martin (2001), who explored post-fire relations between rainfall intensity and peak discharge for three mountainous watersheds in the western United States. This study showed that the change in the unit-area peak discharge for burned drainages is greater for the more frequent, lower intensity rainfall events than for the less frequent, higher intensity rainfall events.
Figure 12. Aftermath of Galena Fire in severely burned areas.
Photographs by Mark T. Anderson
August 1988 May 1989
Previous Investigations 19
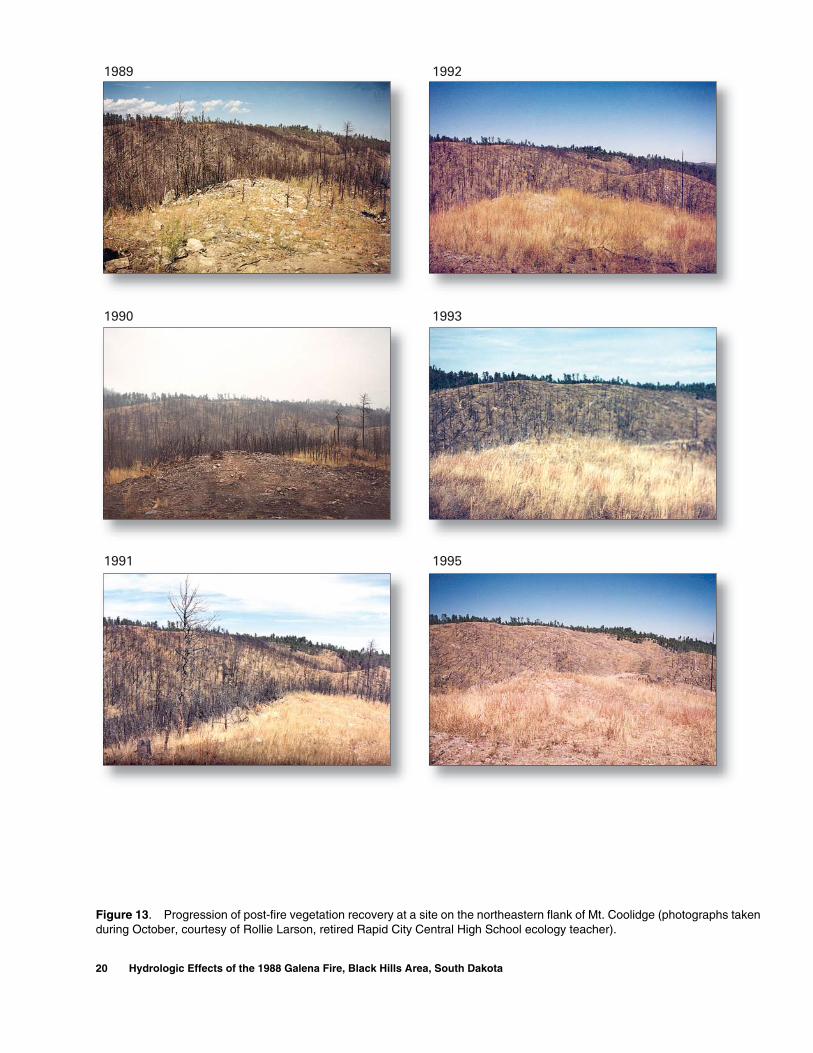
Figure 13. Progression of post-fire vegetation recovery at a site on the northeastern flank of Mt. Coolidge (photographs taken during October, courtesy of Rollie Larson, retired Rapid City Central High School ecology teacher).
1989
1990
1991
1992
1993
1995
20 Hydrologic Effects of the 1988 Galena Fire, Black Hills Area, South Dakota

Figure 13. Progression of post-fire vegetation recovery at a site on the northeastern flank of Mt. Coolidge (photographs taken during October, courtesy of Rollie Larson, retired Rapid City Central High School ecology teacher).—Continued
1996
1998
1999
2001
2002
2003
Previous Investigations 21
Following studies of fire effects in southern California mountains, Colman (1953) reported that ero-sion rates remained above normal for at least 8 years following fire and that flood peaks of streams remained above normal for at least 20 years. Streamflow records from mountain streams in north-central Washington before, during, and after a fire in 1970 that burned over 120,000 acres showed that streamflow was greatly reduced while the fire was actively burning and that streamflow quickly increased to above-normal condi-tions following the fire (Berndt, 1971). Hydrologic effects in the years following the 1970 Washington fire were reported by Helvey (1973) and Helvey and others (1976).
The U.S. Forest Service (1979) summarized hydrologic effects of fire based on studies across the United States through 1978. The effects summarized included land stability, erosion, sedimentation, mass erosion, nutrient concentrations, and biological compo-sition.
Flooding and debris flows were documented by Parrett (1987) for a small Missouri River tributary near Helena, Montana, following a forest fire and subse-quent rainfall event in 1984. No significant runoff from unburned tributaries contributed to the documented flooding that yielded unit peak debris discharges ranging from 143 to 34,000 (ft3/s)/mi2 and moved an estimated 80,000 yd3 of material.
Changes in water-quality characteristics for a reservoir in west-central California following a large fire in 1985 and a flood in 1986 are documented by Taylor and others (1993). Following the Yellowstone fires of 1988, the observed channel response of a spring-fed stream in eastern Idaho was documented by Simon (1999). Following a wildfire in 1996 near the mountain community of Buffalo Creek, Colorado, rain-fall events over the next 3 years produced 10 floods larger than a 100-year (pre-fire conditions) flood and numerous smaller floods (Jarrett, 1999).
A study of infiltration rates following a pre-scribed fire in Northern Rocky Mountain forests showed greater runoff rates from areas with high-severity burn than unburned and low-severity burn areas, especially during the initial stages of the first simulated rainfall event (Robichaud, 2000). The results indicated hydrophobic or water repellent soil condi-tions, which temporarily caused a 10 to 40 percent reduction in hydraulic conductivity values when com-pared to a normal infiltrating soil condition.
22 Hydrologic Effects of the 1988 Galena Fire, Black Hills Area
The effects of wildfires in 1977 and 1996 on the hydrology of two watersheds in Bandelier National Monument, New Mexico, were documented by Veenhuis (2002). The peak flow at one streamflow-gaging station was about 160 times the maximum recorded flood prior to the fire. The hydrologic effects were most pronounced during the first 3 years fol-lowing the fire; however, flood magnitudes had not completely returned to pre-fire conditions following the 1977 fire.
Drainage basin characteristics and initial channel response to storm rainfall for 95 recently burned drainage basins in Colorado, New Mexico, and southern California are documented by Cannon (2001). Debris flows were produced from about 40 percent of the basins examined. Sediment-laden streamflow was produced in most of the remaining basins, whereas a few basins showed no discernible response. The study concluded that drainage basin morphology and lithology and the presence or absence of water-repellent soils are the factors that control the generation of fire-related debris flows.
DATA SETS CONSIDERED AND HYDROLOGIC CONSIDERATIONS
The primary focus of this report is evaluation of effects of the Galena Fire on streamflow characteris-tics, including both annual-yield and peak-flow charac-teristics. Within this section, a description of data sets considered and an overview of various hydrologic con-siderations relevant to evaluating effects on streamflow characteristics is presented.
Data Sets Considered
Precipitation and streamflow records for numerous measurement sites have been considered in evaluating the hydrologic effects of the Galena Fire. Some of the measurement sites were installed specifi-cally for this study; however, records for numerous other sites also are considered, as discussed in the following sections.
Precipitation Data
Many of the precipitation data sets that are used within this report are from Driscoll and others (2000),
, South Dakota

who summarized available precipitation data for water years 1931-98 for the Black Hills area. These investiga-tors compiled monthly precipitation records for 52 long-term precipitation gages operated by National Oceanic and Atmospheric Administration and 42 short-term precipitation gages operated by the USGS. The precipitation gages that are within the study area are shown in figure 14 and selected site information for these gages is presented in table 1. Driscoll and others (2000) used a geographic information system (GIS) to generate spatial distributions of monthly precipitation data for 1,000-by-1,000-meter grid cells for the Black Hills area. Data sets and methods developed by these investigators were used for estimating precipitation amounts over drainage areas for selected streamflow-gaging stations using monthly precipitation distribu-tions that were compiled by water year.
Most of the USGS precipitation gages listed in table 1 were installed and operated specifically for the study of fire effects. Many of these were nonrecording gages operated by observers, who reported daily pre-cipitation totals. A number of recording gages, which can provide information regarding precipitation inten-sity, also were operated.
Streamflow Data
Streamflow-gaging stations used for analyses in this report that are located within the study area are shown in figure 1, and stations outside the study area are shown in figure 2. Selected site information for all gaging stations is presented in table 2. Data for the gaging stations that are used in analyses in this report have been published in USGS annual data reports (U.S. Geological Survey, 1968-99). About one-half of the drainage area for station 06404998 (Grace Coolidge Creek near Game Lodge) is within the burn area, with streamflow records dating back to 1977. Station 06405000 (Grace Coolidge Creek near Custer), which was located a short distance downstream, has records for 1967-76. This station was eventually discontinued and moved upstream to the current location when it was determined that the original station was located within the upstream part of the reach where streamflow losses occur to the Madison Limestone. Thus, low-flow records for the downstream station were not considered for analyses of annual-yield characteristics. High-flow records were used for analyses of peak-flow character-istics, however, because effects of streamflow losses on peak flows are negligible.
Table 1. Summary of selected site information for precipitation gages within study area
[Station type: N, Nonrecording gage (year-round); R, Recording gage (year-round); S, seasonal gage]
Site number(fig. 14)
Station number Station nameStation
typePeriod of record
(water years)
National Oceanic and Atmospheric Administration stations
1 392087 Custer N 1931-98
2 393775 Hermosa 3SSW N 1941-98
3 393868 Hill City N 1955-98
4 394556 Keystone N 1990-97
5 395870 Mt. Rushmore National Memorial N 1962-98
U.S. Geological Survey stations
6 06404000 Battle Creek near Keystone N 1988-98
7 06405800 Bear Gulch near Hayward R 1989-98
8 434002103214500 Racetrack Butte near Fairburn R 1984-98
9 434444103282000 Custer State Park at Mt. Coolidge R 1984-90
10 434534103290500 Mt. Coolidge near Custer R 1990-98
11 434638103253500 Road Camp at Custer State Park N 1989-98
12 434645103240700 Water Treatment Plant at Custer State Park S 1989-98
13 434732103305500 Bismark Lake near Custer S 1989-98
14 434807103235400 Center Lake near Hayward R 1989-98
15 434928103214800 North Farm at Custer State Park S 1989-98
16 434939103272800 Camp Remington near Hayward R 1989-98
17 435355103432800 Medicine Mountain near Custer R1 1989-981Operated as nonrecording gage prior to 1994.
Data Sets Considered and Hydrologic Considerations 23

Figure 14. Location of precipitation gages within study area. Precipitation amounts for a storm on September 7, 1989, also are shown.
CenterLake
Red
Canyon
Creek
Beaver
Battle
Spokane
Gulch
Bear
Iron
Flynn
Creek
Cr
Spri
ngC
reek Creek
Creek
French
Lame
Johnny
GraceCoolidge
Creek
Creek
Creek
Creek
Creek
Highland
LegionLake
BismarckLake
StockadeLake
Galena
PENNINGTON COUNTYPENNINGTON COUNTY
CUSTER COUNTYCUSTER COUNTYPENNINGTON COUNTY
CUSTER COUNTY
Custer
Pringle
Hermosa
Fairburn
Keystone
Hayward
Hill City
50.60
4
30.15
20.55
20.55
81.15
11.38
CusterCuster
StateState
ParkPark
Custer
State
Park
103º45' 103º30' 103º15'
43º52'30"
43º45'
43º37'30"
0 642 531 MILES
0 642 531 KILOMETERS
Base modified from U.S. Geological Survey digital data, 1:100,000, 1977Universal Transverse Mercator projection, zone 13
X
XMt.
Coolidge
HarneyPeak
EXPLANATIONCUSTER STATE PARK
PRECIPITATION GAGE—Upper number is site number in table 1. Lower number is precipitation, in inches, for September 7, 1989, where available (data from National Oceanic and Atmospheric Administration, 1989, and U.S. Geological Survey, 1990)
Operated by National Oceanic and Atmospheric Administration
Operated by U.S. Geological Survey
Wind Cave National Park
Mt. RushmoreNationalMemorial
91.65
81.15
71.84
60.43
170.10
160.43
151.70
141.86
13
121.9011
1.6510
24 Hydrologic Effects of the 1988 Galena Fire, Black Hills Area, South Dakota

Table 2. Selected site information for streamflow-gaging stations used in analyses
[B, burned; U, unburned; AY, annual yield; PF, peak flow]
Stationnumber
Station name
Drainagearea
(squaremiles)
Period of record considered
(water years)
Watershedcondition
Analyticusage
B U AY PF
106402500 Beaver Creek near Buffalo Gap 130 1967-98 X X206403300 French Creek above Fairburn 105 31983-98 X X X206404000 Battle Creek near Keystone 458.5 1967-98 X X X206404800 Grace Coolidge Creek near Hayward 7.48 1990-98 X X206404998 Grace Coolidge Creek near Game Lodge, near Custer 426.8 1977-87 X X X
1989-98 X X
1988-98 X X206405000 Grace Coolidge Creek near Custer 426.9 1967-76 X X206405800 Bear Gulch near Hayward 4.23 1990-98 X X106422500 Boxelder Creek near Nemo 96.0 1973-98 X X106425500 Elk Creek near Elm Springs 540 1967-98 X X106431500 Spearfish Creek at Spearfish 168 1967-98 X X106436190 Whitewood Creek near Whitewood 77.4 1982-98 X X
1Location shown in figure 2.2Location shown in figure 1.3Available partial record in water year 1982 (April-September) used for peak-flow analyses.4Revised values.
Station 06404800 (Grace Coolidge Creek near Hayward) was installed after the fire, just upstream from the burn area (fig. 1). This station provides data for the unburned headwaters of the Grace Coolidge Creek drainage and, as such, serves as a control water-shed for comparative purposes. Another streamflow-gaging station (06405800) was installed after the fire on Bear Gulch, which is tributary to Grace Coolidge Creek several miles downstream from station 06404998. The Bear Gulch drainage was severely burned, with complete deforestation occurring in nearly the entirety of the area upstream from the gaging station.
Several existing streamflow-gaging stations (table 2) also were considered for comparisons with streamflow data for the burned areas (Grace Coolidge Creek and Bear Gulch). Stations along French Creek and Battle Creek (fig. 1, table 2) were considered as control watersheds for analyses of effects on annual-yield characteristics, and various additional stations were considered for analyses of effects on peak-flow characteristics (fig. 2, table 2).
Hydrologic Considerations
Various hydrologic considerations have been important in evaluating effects of the Galena Fire on streamflow characteristics. Selection of appropriate streamflow records for comparisons between burned and unburned areas has required consideration of various factors. For analysis of annual-yield character-istics, pre-fire and post-fire comparisons are possible using records for station 06404998, Grace Coolidge Creek near Game Lodge, of which about one-half of the drainage area was burned (fig. 1). For this station, 11 years of pre-fire data (WY 1977-87) and 10 years of post-fire data (WY 1989-98) are available (table 2). Data for WY 1988, which is when the Galena Fire occurred, are not considered for analysis of annual-yield characteristics. Bear Gulch (station 06405800) is not considered for analysis of annual-yield characteris-tics because pre-fire data are not available.
Unburned drainages considered for analysis of annual-yield characteristics include French Creek and Battle Creek, which are located immediately south and north, respectively, of Grace Coolidge Creek. For the
Data Sets Considered and Hydrologic Considerations 25

French Creek station (06403300), only 5 years of data are available for the pre-fire period (WY1983-87); however, records for Battle Creek (station 06404000) are much longer and pre-date records for Grace Coolidge Creek (table 2). Thus, comparisons with Battle Creek are most useful for analysis of effects of fire on annual-yield characteristics in Grace Coolidge Creek. Furthermore, both of these drainages have very similar hydrogeologic characteristics. Large outcrop areas of the Harney Peak Granite and other similar rocks occur in both drainages (DeWitt and others, 1989). Precipitation patterns also are very similar (fig. 2) and are influenced by a topographic high that is generally centered around Harney Peak and extending from about Mount Coolidge to Mount Rushmore.
A number of drainages are considered for anal-ysis of peak-flow characteristics. Consideration of both pre- and post-fire records are possible for Grace Coolidge Creek near Game Lodge (station 06404998) and comparisons are made with various stations along the eastern flank of the Black Hills (fig. 2) for which
26 Hydrologic Effects of the 1988 Galena Fire, Black Hills Area
pre- and post-fire records are available. Peak-flow characteristics for Bear Gulch (station 06405800) can be considered only for the post-fire period. The size of the severely burned drainage area for this station (table 2) is comparable to that for Grace Coolidge Creek near Hayward (station 06404800), which is upstream from the burn area and also was installed after the fire.
Comparability of precipitation patterns between drainage basins is another important consideration in evaluating streamflow characteristics. Peak-flow events often result from relatively short-term, high-intensity precipitation events, which generally tend to have extremely large spatial variability in precipitation amounts and intensities. Thus, for consideration of peak-flow characteristics, comparability of annual pre-cipitation patterns may not be particularly important. Annual-yield characteristics, however, are highly influ-enced by annual precipitation amounts (Driscoll and Carter, 2001), as shown by relations between annual yield efficiency and precipitation (fig. 15) for the
Figure 15. Relations between annual yield efficiency and precipitation for selected drainage basins.
50 10 15 20 25 30 35
PRECIPITATION, IN INCHES
0
5
10
15
20
25
YIE
LD E
FFIC
IEN
CY,
IN P
ER
CE
NT
French Creek above Fairburn (06403300), water years 1983-98Battle Creek near Keystone (06404000), water years 1962-98
, South Dakota

unburned control watersheds (French Creek and Battle Creek). Data sets for these stations are provided in table 8 in the Supplemental Information section at the back of the report. For these basins, annual yield effi-ciencies (ratios of annual streamflow yield, in inches, to annual precipitation, in inches) have varied by as much as an order of magnitude over the range of measured conditions.
A comparison of annual precipitation amounts for the drainage areas associated with stations 06403300 (French Creek), 06404000 (Battle Creek), and 06404998 (Grace Coolidge Creek near Game Lodge), is presented in figure 16; data considered are provided in table 8. Annual precipitation for periods of overlapping streamflow record are shown for Battle and Grace Coolidge Creeks. For French Creek, annual pre-cipitation is shown for the entire period of available streamflow record. Annual means (WY 1977-98) for Battle and Grace Coolidge Creeks are nearly identical (21.24 and 21.37 in., respectively). The annual mean (WY 1983-98) for French Creek (20.95 in.) is notably lower than for Grace Coolidge Creek for the same period (22.66 in.), which is consistent with the long-term spatial patterns indicated by figure 2.
An important trend in precipitation patterns is shown by the plots of cumulative annual precipitation departures for WY 1977-98 for the Battle and Grace Coolidge Creek drainages (fig. 17). These plots clearly indicate a pattern of generally average to below-average precipitation through WY 1988 and average to above-average precipitation during the post-fire period. Climatic conditions during WY 1995-98 were particu-larly wet, with annual precipitation substantially above average in the French, Battle, and Grace Coolidge Creek drainages (fig. 16).
The above-average precipitation trends during the late 1990s are an extremely important consideration in evaluating the effects of forest fire on streamflow characteristics. Because yield efficiencies generally increase with increasing annual precipitation (fig. 15), distinctions between climatic and fire-related effects are confounded, as illustrated in figure 18, which shows daily duration hydrographs for pre- and post-fire periods for Battle and Grace Coolidge Creeks. Flow characteristics for both drainages are consistently higher for the post-fire period, for all but the largest exceedance percentiles (which represent extreme low-flow characteristics).
Low-flow characteristics are nearly identical for pre- and post-fire periods for Battle Creek, with zero-
flow conditions occurring about 7 percent of the time for both periods (fig. 18). For Grace Coolidge Creek, extreme low-flow conditions are less common than for Battle Creek, with zero-flow conditions occurring only about 0.2 percent of the time during the pre-fire period and 0.8 percent of the time during the post-fire period. The post-fire, low-flow characteristics for both stations are predominantly affected by conditions during WY 1989, near the end of the drought condi-tions during which the Galena Fire occurred. Figure 18 excludes flow records for WY 1988, for which mean annual flow is the lowest year of record for both stations (U.S. Geological Survey, 1999).
HYDROLOGIC EFFECTS OF THE GALENA FIRE
Hydrologic effects of the Galena Fire have included effects on geomorphology, water quality, and streamflow. This section of the report includes a brief summary of effects on geomorphology and water quality, and a detailed description of effects on stream-flow characteristics.
Effects on Geomorphology and Water Quality
The USGS was involved with cursory studies of geomorphologic and water-quality effects imme-diately following the Galena Fire. These studies were performed in conjunction with the South Dakota School of Mines and Technology, and were completed by 1990. Results were described in two unpublished M.S. theses and are summarized within this section.
Whitesides (1989) described geomorphologic effects of the Galena Fire, including effects on erosion and sedimentation. Moderately burned areas did not experience substantial increases in rates of surface erosion. Severely burned areas, however, underwent surficial erosion nearly twice that of the unburned areas, with south-facing slopes experiencing more erosion than north-facing slopes in both severely burned and unburned areas. The increased erosion was caused by a combination of sheet erosion and wind erosion. The sediment production rate of Bear Gulch estimated 8 to 14 months after the fire was 870 ft3/acre (44 tons/acre).
Hydrologic Effects of the Galena Fire 27

28 H
Figure 16. Annual precipitation for drainage areas of selected streamflow-gaging stations.
Figure 17. Cumulative departure from long-term average annual precipitation for selected drainage areas, water years 1977-98.
1975 1980 1985 1990 1995 2000
WATER YEAR
0
10
5
15
20
25
30
35
40
AN
NU
AL
PR
EC
IPIT
AT
ION
, IN
INC
HE
S
French Creek above Fairburn (06403300)Battle Creek near Keystone (06404000)Grace Coolidge Creek near Game Lodge, near Custer (06404998)
1975 1980 1985 1990 1995 2000
WATER YEAR
-40
-30
-35
-25
-20
-15
-10
-5
5
0
PR
EC
IPIT
AT
ION
DE
PAR
TU
RE
, IN
INC
HE
S
Battle Creek near Keystone (06404000) average annual precipitation = 21.24 inchesGrace Coolidge Creek near Game Lodge, near Custer (06404998) average annual precipitation = 21.37 inches
ydrologic Effects of the 1988 Galena Fire, Black Hills Area, South Dakota

Figure 18. Duration hydrographs for selected streamflow-gaging stations.
Before fire (1977-87)
After fire (1989-98)
0.1 1 2 5 30 50 70 80 90 95 98 99 99.8 99.92010
PERCENT OF TIME INDICATED VALUE WAS EQUALED OR EXCEEDED
Grace Coolidge Creek near Game Lodge, near Custer (06404998)
0.01
0.1
1
10
100
10,000
1,000
0.01
0.1
1
10
100
10,000
1,000
DA
ILY
ME
AN
ST
RE
AM
FLO
W, I
N C
UB
IC F
EE
T P
ER
SE
CO
ND
Before fire (1977-87)
After fire (1989-98)
Battle Creek near Keystone (06404000)
Hydrologic Effects of the Galena Fire 29

Whitesides (1989) also described effects of the Galena Fire on stream-channel morphology. Substan-tial degradation of stream channels within the severely burned headwater areas of Bear Gulch was docu-mented. Farther downstream, channel aggradation resulted from deposition of sediments transported from the headwater areas. Movement of large quantities of sediment associated with several high-flow events that occurred soon after the fire also was described by Whitesides (1989).
Gundarlahalli (1990) described effects of the Galena Fire on water quality. Sampling locations (fig. 1) included Grace Coolidge Creek upstream (station 06404800) and downstream (station 06404998) of the burn area and Bear Gulch (station 06405800), which was extensively burned. The most notable effect was on concentrations of suspended sed-iment, which were orders of magnitude higher for Bear Gulch than for the unburned area. Concentrations of suspended sediment were intermediate for the down-stream site on Grace Coolidge Creek, which was con-sidered representative of a moderately burned area.
Effects on several other water-quality constitu-ents, such as organic carbon and nitrogen and phos-phorus nutrient constituents, probably were influenced by the large concentrations of suspended matter that were documented in initial post-fire, stormflow events (Gundarlahalli,1990). The first post-fire stormflow pro-duced the highest measured concentrations of specific conductance, nitrogen, phosphorus, organic carbon, calcium, magnesium, potassium, manganese, and sul-fate in the burned areas. For most constituents sampled, differences in concentrations between burned and unburned areas were no longer discernible within about 1 year following the Galena Fire.
Large sediment loads resulting from the Galena Fire may have influenced streamflow losses to the Madison aquifer that occur along Grace Coolidge Creek downstream from station 06404998 (fig. 1). In an unrelated study, Hortness and Driscoll (1998) reported that calculated loss rates along Grace Coolidge Creek were consistently smaller for water years (WY) 1990-95 than calculated losses during WY 1978 and WY 1996. Deposition of fine-grained sedi-ment within the stream channel following the Galena Fire was hypothesized as the cause for the decrease in the loss rate.
30 Hydrologic Effects of the 1988 Galena Fire, Black Hills Area
Effects on Streamflow Characteristics
Within this section, effects of the Galena Fire on streamflow characteristics are evaluated. Evaluations of effects on both annual-yield and peak-flow charac-teristics are described.
Effects on Annual-Yield Characteristics
Numerous previous studies have indicated increased water yield following timber harvests; thus, increased yields also might be expected from decreased timber density resulting from forest fire, especially in areas with low to moderate burn intensity. Alterna-tively, one might hypothesize that in areas of high-intensity burns, decreased shading from denuding of forest cover could result in increased evaporation. In this section, a variety of approaches are utilized to eval-uate potential changes in annual-yield characteristics for Grace Coolidge Creek.
As discussed in the previous section, potential effects of the 1988 Galena Fire on annual-yield charac-teristics of Grace Coolidge Creek are evaluated using comparisons between station 06404998 (burned area) and stations on French Creek (06403300) and Battle Creek (06404000). Hydrographs showing annual yield (in inches) for these three stations are presented in figure 19. All three hydrographs clearly show trends of substantially increased yields in response to the partic-ularly wet years of the 1990s (fig. 16).
Mass analysis (Linsley and others, 1982) is a simple plotting procedure that can be useful for exami-nation of trend data. Plots of cumulative annual yield versus time are presented in figure 20 for periods of overlapping streamflow record between Grace Coolidge Creek and each of the two comparison basins (French Creek and Battle Creek). Increased trends in annual yield resulting from increased precipitation trends (fig. 16) are clearly indicated for all three basins by inflection points around 1990. Another change in slope reflecting the especially wet conditions during 1995-98 also is apparent for each of the three basins.
Graphs of cumulative annual yield versus cumu-lative annual precipitation (double mass analysis) are presented in figure 21. Close examination of the upper plot in figure 21 indicates that contrary to the long-term regional pattern (fig. 2), cumulative precipitation for the French Creek drainage was slightly, but consis-tently, greater than or equal to cumulative precipitation for the Grace Coolidge Creek drainage for the first few years of overlapping streamflow record. Annual
, South Dakota

precipitation during the pre-burn period (WY 1983-87) averaged 18.46 and 18.21 in. for French Creek and Grace Coolidge Creek, respectively, compared with annual means of 22.91 and 24.67 in. for WY 1989-98. This subtle change in precipitation patterns contributes substantially to the large difference in annual yield pat-terns for the two drainages during these two periods (fig. 21). Thus, potential effects resulting from the Galena Fire cannot be distinguished from climatic effects, and no further comparisons are made between French Creek and Grace Coolidge Creek for analysis of annual-yield characteristics.
The lower plot in figure 21 indicates that subtle changes in precipitation patterns also occurred for the Battle Creek and Grace Coolidge Creek drainages; however, close examination of these data supports a conclusion of increased post-burn water yield for Grace Coolidge Creek. For the pre-burn period (WY 1977-87), cumulative annual precipitation for Grace Coolidge Creek was slightly larger than for Battle Creek (fig. 21). Mean annual precipitation was about 2 percent larger for Grace Coolidge Creek than for Battle Creek during this period (table 3). Mean annual yield and yield efficiency during the pre-burn period also were slightly larger for Grace Coolidge Creek than for Battle Creek (table 3), which is consistent with
larger precipitation (fig. 15). During WY 1989-94, mean annual precipitation for Grace Coolidge Creek was less than 1 percent larger than for Battle Creek (table 3); however, divergence of the cumulative yield plots is much larger than divergence during the pre-burn period (fig. 21). During WY 1995-98, mean annual yields and yield efficiencies for Grace Coolidge Creek were substantially larger than for Battle Creek, in spite of slightly smaller mean annual precipitation (table 3). For the entire post-burn period (WY 1989-98), when most of the divergence in cumulative yield occurred, mean annual precipitation for Grace Coolidge Creek was about 1 percent smaller than for Battle Creek. During the post-burn period, mean yield efficiency for Grace Coolidge Creek was 32 percent larger than for Battle Creek, compared with a 16 percent differential for the pre-burn period.
Standard approaches to evaluation of increased yields typically would include determination of the sta-tistical significance of yield increases. Because the dis-tribution of mean annual precipitation between Grace Coolidge Creek and Battle Creek changed slightly during the pre-burn and post-burn periods, statistical evaluations described in the following paragraphs were performed using comparisons of yield efficiencies, which account for differences in annual precipitation.
Figure 19. Annual yield for French Creek, Battle Creek, and Grace Coolidge Creek.
1975 1980 1985 1990 1995 2000
WATER YEAR
0
2
4
6
8
10
12
AN
NU
AL
YIE
LD, I
N IN
CH
ES
French Creek above Fairburn (06403300)Battle Creek near Keystone (06404000)Grace Coolidge Creek near Game Lodge, near Custer (06404998)
Hydrologic Effects of the Galena Fire 31

32
Figure 20. Mass analysis for selected streams in comparison to Grace Coolidge Creek.
1975 1980 1985 1990 1995 2000
WATER YEAR
0
10
20
30
60
50
40
Battle Creek near Keystone (06404000)
Grace Coolidge Creek near Game Lodge, near Custer (06404998)
0
10
20
30
60
50
40
CU
MU
LAT
IVE
AN
NU
AL
YIE
LD, I
N IN
CH
ES
French Creek above Fairburn (06403300)Grace Coolidge Creek near Game Lodge, near Custer (06404998)
Hydrologic Effects of the 1988 Galena Fire, Black Hills Area, South Dakota

Figure 21. Double mass analysis for selected streams in comparison to Grace Coolidge Creek.
1988
1988
0 10050 200 300 400 500150 250 350 450
CUMULATIVE ANNUAL PRECIPITATION, IN INCHES
Battle Creek near Keystone (06404000), water years 1977-98
Grace Coolidge Creek near Game Lodge, near Custer (06404998), water years 1977-98
0
10
20
30
60
50
40
0
10
20
30
60
50
40
CU
MU
LAT
IVE
AN
NU
AL
YIE
LD, I
N IN
CH
ES
French Creek above Fairburn (06403300), water years 1983-98Grace Coolidge Creek near Game Lodge, near Custer (06404998), water years 1983-98
Hydrologic Effects of the Galena Fire 33

Table 3. Summary of precipitation and yield data for selected periods for Battle Creek and Grace Coolidge Creek
Period(water years)
Battle Creek (06404000) Grace Coolidge Creek (06404998)
Mean annual precipitation
(inches)
Mean annualyield
(inches)
Mean yieldefficiency(percent)
Mean annual precipitation
(inches)
Mean annualyield
(inches)
Mean yieldefficiency(percent)
1977-87 18.67 1.29 6.9 19.10 1.53 8.0
1989-94 21.90 1.92 8.8 22.05 2.57 11.7
1995-98 29.36 4.57 15.6 28.60 5.97 20.9
1989-98 24.89 2.98 12.0 24.67 3.93 15.9
A one-sided comparison of pre- and post-burn yield efficiencies for Grace Coolidge Creek using the Wilcoxon rank-sum test (Helsel and Hirsch, 1992) con-firms that the post-burn increase is statistically signifi-cant (p-value = 0.012), which indicates a 98.8 percent probability that the increase is not a chance occurrence. The same test for Battle Creek indicates that because of increased yield efficiency associated with increased precipitation (fig. 15), yield efficiency for the control watershed also increased during the post-burn period, but at a lower confidence level (p-value = 0.029).
A one-sided comparison of paired post-burn yield efficiencies using the Wilcoxon signed-rank test (Helsel and Hirsch, 1992) provides strongly significant confirmation (p-value = 0.001) that post-burn efficien-cies for Grace Coolidge Creek are larger than for Battle Creek. The same test for the paired pre-burn efficien-cies indicates that pre-burn efficiencies for Grace Coolidge Creek also are significantly larger (p-value = 0.013) than for Battle Creek, which again limits the capability of making a definitive statistical inference that yield efficiencies have increased because of defor-estation.
The preceding discussions indicate that statistical interpretations are not conclusive, but do not neces-sarily indicate that yield efficiencies have not increased because of deforestation. Another perspective is obtained from a somewhat intuitive approach. As dis-cussed previously, mean annual post-burn yield for Grace Coolidge Creek increased substantially relative to yield for Battle Creek, despite a small relative decrease in mean annual precipitation (table 3). A com-parison of annual yield efficiencies (table 8) indicates that yield efficiency for Battle Creek equalled or exceeded that for Grace Coolidge Creek for 3 of 11 pre-burn years (one year was a tie); however, yield efficiency for Grace Coolidge Creek was not exceeded during any of the 10 post-fire years.
34 Hydrologic Effects of the 1988 Galena Fire, Black Hills Area
The sign test (Helsel and Hirsch, 1992), which compares strictly non-zero differences in paired data, is similar to the Wilcoxon signed-rank test, but has less power because magnitudes of differences are not con-sidered. A one-sided sign test comparing post-burn yield efficiencies (p-value = 0.001) indicates a 99.9 percent probability that 10 consecutive exceed-ances of Battle Creek by Grace Coolidge Creek is a non-chance occurrence. The same test for the pre-burn period (p-value = 0.055) indicates only a 94.5 percent probability of non-chance occurrence for the 8 of 10 non-tied exceedances of Battle Creek by Grace Coolidge Creek. This is justification for acceptance of the null hypothesis (no difference in pre-burn yield efficiencies between Grace Coolidge Creek and Battle Creek) and rejection of the one-sided alternative hypothesis (pre-burn efficiency larger for Grace Coolidge Creek than Battle Creek) at a significance level of 0.05 that typically is used for hypothesis testing (Helsel and Hirsch, 1992).
Plots of annual yield versus precipitation for pre- and post-burn periods for both Battle Creek and Grace Coolidge Creek (fig. 22) provide another graphical per-spective on the post-burn change in yield characteristics for Grace Coolidge Creek. The pre-burn regression lines indicate very similar yield characteristics for both drainages, and clearly reflect the slightly higher yield characteristics for Grace Coolidge Creek. The effect of slightly higher pre-burn precipitation for Grace Coolidge Creek is evaluated by substituting the mean pre-burn precipitation value of 18.67 in. for Battle Creek (table 3) into the regression equation for Grace Coolidge Creek. The resulting (calculated) annual yield of 1.49 in. is about 97 percent of the actual mean annual yield of 1.53 in/yr, and also is substantially larger than the actual mean of 1.29 in/yr for Battle Creek. Thus, the effect of slightly larger pre-burn precipitation for Grace Coolidge Creek is considered negligible.
, South Dakota

Complications associated with quantification of post-burn yield characteristics for Grace Coolidge Creek also are well illustrated in figure 22. Divergence of the post-burn regression lines indicates increased post-burn yield for Grace Coolidge Creek, relative to Battle Creek; however, it also is apparent that substan-tial increases in yield have resulted from increased precipitation during the post-burn period for both drain-ages. The absence of high-yield data points during the pre-burn period is another apparent problem.
Relations between annual yield for Grace Coolidge Creek and Battle Creek (fig. 23) are used to quantify increased yield for Grace Coolidge Creek. As discussed, many of the post-burn data points are well beyond the range of the pre-burn data, which requires extrapolation of the pre-burn regression equation to obtain estimates of annual yield for an “unburned” con-dition for Grace Coolidge Creek for the upper range of the yield values.
Estimates of increased yield for Grace Coolidge Creek derived from comparisons between the post-burn and unburned regression equations from figure 23 are presented in table 4. The estimates for both unburned and post-burn conditions for Grace Coolidge Creek are obtained by substituting hypothetical values of annual yield for Battle Creek into the regression equations. For
most of the range of annual yield values, the estimates indicate increased yields of about 20 percent for the post-burn condition, relative to predicted yields for the unburned condition. Estimated increases are some-what less than 20 percent for hypothetical values of annual yield for Battle Creek that are less than about 3.0 in.
Table 4. Estimates of increased annual yield for Grace Coolidge Creek, based on comparison of regression equations from figure 23
Hypothetical yield for
Battle Creek(inches per
year)
Predicted unburned yield
for Grace Coolidge Creek
(inches per year)
Predicted post-burn yield
for Grace Coolidge
Creek(inches per
year)
Predicted yield increase
for Grace Coolidge
Creek(percent)
0.50 0.72 0.80 11.1
1.00 1.24 1.43 15.3
2.00 2.27 2.69 18.5
3.00 3.31 3.96 19.6
4.00 4.35 5.22 20.0
5.00 5.38 6.48 20.4
6.00 6.42 7.75 20.7
7.00 7.46 9.01 20.8
Figure 22. Relations between annual yield and annual precipitation for Battle Creek and Grace Coolidge Creek before and after the Galena Fire.
0 5 10 15 20 25 30 35 40
ANNUAL PRECIPITATION, INCHES
0
2
4
6
8
10
12
AN
NU
AL
YIE
LD, I
N IN
CH
ES
Battle Creek near Keystone (06404000), water years 1977-87Grace Coolidge Creek near Game Lodge, near Custer (06404998), water years 1977-87
Battle Creek near Keystone (06404000), water years 1989-98Grace Coolidge Creek near Game Lodge, near Custer (06404998), water years 1989-98
y = 0.105x - 0.47R2 = 0.29
y = 0.506x - 8.54R2 = 0.90
y = 0.111x - 0.79R2 = 0.43
y = 0.342x - 5.53R2 = 0.87
Hydrologic Effects of the Galena Fire 35

36
Figure 23. Relations between annual yield for Battle Creek and Grace Coolidge Creek for pre-burn and post-burn periods.
0 1 2 3 4 5 6 7
ANNUAL YIELD FOR BATTLE CREEK NEAR KEYSTONE, IN INCHES
0
2
4
6
8
10
12
AN
NU
AL
YIE
LD F
OR
GR
AC
E C
OO
LID
GE
CR
EE
KN
EA
R G
AM
E L
OD
GE
, IN
INC
HE
S
Pre-burn, water years 1977-87Post-burn, water years 1989-98
y = 1.038x + 0.20R2 = 0.86
y = 1.264x + 0.16R2 = 0.93
Estimates of increased yield also can be derived by comparing measured post-burn yields for Grace Coolidge Creek with predicted yields for the unburned condition (table 5), which are obtained by substituting measured post-burn yields for Battle Creek into the unburned regression equation from figure 23. For this analysis, the predicted yield increases (in percent) for individual years demonstrate considerable variability because they reflect the variability of the measured post-burn values for Grace Coolidge Creek about the post-burn regression line.
Another useful perspective is obtained by consid-eration of the mean values that are summarized in table 5. The arithmetic mean increase in yields for the individual years is 23.8 percent; however, the mean increase calculated from the totals for all years is 19.5 percent. An inherent characteristic of the least-squares regression method is that the regression line passes through the mean of the data sets for both the dependent and independent variables. Thus, substitu-tion of the post-burn mean yield of 2.98 in. for Battle Creek (table 5) into the unburned and post-burn regres-sion equations (fig. 23) would result in predicted yields of 3.29 in. and 3.93 in., respectively, which are the
Hydrologic Effects of the 1988 Galena Fire, Black Hills Area
means for the unburned and post-burn conditions for Grace Coolidge Creek (table 5). These are the calcula-tions that were summarized in table 4, and results are very closely approximated by the value of 3.00 in. for Battle Creek that was used as one of the hypothetical input values. Therefore, the mean increase of 19.5 percent truly represents the central tendency for the data sets and provides a better estimate of increased yield than the arithmetic mean of 23.8 percent.
Because annual precipitation is not considered in the “yield versus yield” regression equations (fig. 23), an inherent assumption in the approach is that differ-ences in annual precipitation for Battle Creek and Grace Coolidge Creek are negligible. As discussed pre-viously, mean annual precipitation for Grace Coolidge Creek was slightly larger than for Battle Creek during the pre-burn period, but was slightly smaller during the post-burn period (table 3). Thus, the post-burn increase in annual yield for Grace Coolidge Creek could actu-ally be slightly larger than estimated.
As discussed, many of the post-burn data points are well beyond the range of the pre-burn data, which requires extrapolation of the pre-burn regression equa-tion to obtain estimates of annual yield for the unburned
, South Dakota

condition for Grace Coolidge Creek for the upper range of the yield values (fig. 23). The possibility of substan-tially disproportionate differences in yield characteris-tics (either smaller or larger) between Battle Creek and Grace Coolidge Creek, for a higher range of yield values than what occurred during the pre-burn period, cannot be discounted. This possibility is the largest source of uncertainty in estimating post-burn yield increases for Grace Coolidge Creek. The strong corre-lations between annual yield data for the two basins for both the pre-burn (r2 = 0.86) and post-burn (r2 = 0.93) periods (fig. 23) provide confidence, however, that rea-sonable estimates are obtained by extrapolation of the regression equation for the pre-burn period.
It is possible that estimated yield increases for Grace Coolidge Creek may have been influenced by timber management activities in addition to the Galena Fire. Possible influences could have included increased timber density in the Battle Creek drainage or decreased timber density in the unburned part of the Grace Coolidge Creek drainage. These potential influ-ences are evaluated in the following discussions.
Logging activity in the Norbeck Wilderness Area, which composes much of the Battle Creek drainage area, has been relatively minimal during recent years, as was discussed in the Timber Manage-ment section of this report. Thus, potential has existed for relatively slow, but steady increases in timber den-sity, which could result in decreased water yield over time. This potential is evaluated by examination of figure 24, which shows cumulative annual yield and cumulative annual precipitation departure for the entire period of streamflow record available for the Battle Creek drainage (WY 1962-98). Trend lines for annual yield during three short periods of approximately average precipitation trend have been constructed in figure 24 using an “eyeball” fit. Very slight cumulative precipitation deficits occurred during 1965-70 and 1975-79, and slopes for annual yield are essentially identical during these periods. A slight precipitation surplus occurred during 1990-95, and the slope for the corresponding yield trend is slightly steeper than the slopes for the other two periods. Thus, it is concluded that there is no evidence of measurably declining yield for the Battle Creek drainage.
Table 5. Estimates of increased annual yield for Grace Coolidge Creek, based on comparison of actual post-burn values with unburned regression equation from figure 23
[NA, not applicable]
Water yearMeasured yield for
Battle Creek(inches)
Predicted unburned yield for Grace Coolidge Creek
(inches)
Measured post-burn yield for Grace Coolidge Creek
(inches)
Predicted post-burn yield increasefor Grace Coolidge Creek
(inches) (percent)
1989 0.24 0.45 0.71 0.26 58.9
1990 1.93 2.20 2.44 .24 10.9
1991 3.87 4.21 4.51 .30 7.1
1992 .81 1.04 1.51 .47 45.5
1993 3.51 3.84 4.62 .78 20.4
1994 1.17 1.41 1.65 .24 16.9
1995 6.43 6.87 9.68 2.81 41.0
1996 3.36 3.68 4.02 .34 9.2
1997 5.51 5.91 5.95 .04 .6
1998 3.00 3.31 4.23 .92 27.8
Total 29.83 32.91 39.32 6.40 NA
Mean 2.98 3.29 3.93 .64 119.5
Arithmetic mean of predicted increases for individual years 23.81Mean percent increase based on totals for 10-year period.
Hydrologic Effects of the Galena Fire 37

Figure 24. Cumulative annual yield and cumulative annual precipitation departure from long-term average for Battle Creek near Keystone (06404000). Trends for three periods of generally average precipitation also are shown.
1960 1965 1970 1975 1980 1985 1990 1995 2000
WATER YEAR
0
10
20
30
40
50
60
70
80
90
-40
-30
-20
-10
0
10
20
30
CU
MU
LAT
IVE
AN
NU
AL
YIE
LD, I
N IN
CH
ES
CU
MU
LAT
IVE
AN
NU
AL
PR
EC
IPIT
AT
ION
DE
PAR
TU
RE
, IN
INC
HE
S
Cumulative yieldCumulative precipitation departureTrend for water years 1965-70Trend for water years 1975-79Trend for water years 1990-95
Evaluation of various additional information indicates that the estimated increases in water yield have not been influenced by decreased timber stand density within unburned parts of the Grace Coolidge Creek drainage during the post-burn period. Walker and others (1995) reported timber harvest from 13,618 acres within Custer State Park of 22,541 thousand board feet (MBF) during 1981-87 and 8,383 MBF during 1989-94. Non-commercial thinning consisted of 5,780 acres during 1981-87 and 728 acres during 1989-94. About one-half of the reported timber treat-ment occurred within the Grace Coolidge Creek drainage, most of which was in the unburned part of the drainage in the northwest part of Custer State Park. The reported acreages are for unburned areas; however, the extent of the Galena Fire did include very minor areas where harvest or thinning treatments had previously occurred (Ron Walker, Custer State Park, oral commun., 2003). With the exception of post-fire sal-vage operations, timber management within the Grace Coolidge Creek drainage during 1989-98 has been very minimal (Ron Walker, Custer State Park, oral
38 Hydrologic Effects of the 1988 Galena Fire, Black Hills Area
commun., 2003). Thus, timber stand density within the unburned part of the Grace Coolidge Creek drainage probably did not decrease substantially during the post-burn period, and may in fact have increased, as evidenced by the aerial photographs provided in figure 8.
Evaluation of all available information supports a conclusion of increased annual yield of about 20 percent for Grace Coolidge Creek as a result of the Galena Fire, which is consistent with a preponderance of literature that indicates increased yields associated with deforestation from both timber harvest and fire effects. The fire-induced timber treatment included about one-half of the Grace Coolidge Creek drainage area, and consisted of nearly 100 percent timber removal from about 54 percent of the burn area and about 50 percent removal from about 29 percent of the burn area. About 7 percent of the burn area had pre-dominantly surviving timber stands, and about 10 percent of the area was non-timbered prior to the fire. The resulting overall timber treatment might approximate 20 to 25 percent timber removal from the
, South Dakota

entire basin. Pre-burn timber stand densities in the Grace Coolidge Creek drainage probably were not uni-formly distributed because of extensive timber manage-ment activities in the generally unburned northwest part of Custer State Park during the late 1970s and early to mid 1980s. Thus, the overall net effect of the Galena Fire on timber density cannot necessarily be general-ized.
Effects on Peak-Flow Characteristics
Numerous previous studies have documented increased peak-flow characteristics following forest fire. Various physical factors contribute to the potential for increased stormflows. Increased stormflow volumes could result from several factors, including: (1) reduced interception from removal of pine canopy; (2) reduced interception from removal of ground litter and grasses; and (3) reduced infiltration rates from development of water repellent layers within the soil horizon. Increased antecedent soil-moisture storage resulting from decreased evapotranspiration also could be expected for some percentage of storm events, based on results of the analysis of effects on annual-yield characteristics. In addition, reduced traveltimes from hillslopes to channels resulting from removal of ground cover would be expected to contribute to generally steeper hydrographs with larger peak discharges.
Substantial increases in peak-flow characteristics for severely burned drainages were visually apparent after the Galena Fire from numerous post-fire field observations that were obtained in collecting data for studies of geomorphologic effects (Whitesides, 1989) and water-quality effects (Gundarlahalli, 1990). Evidence of frequent, minor runoff events from burned drainages was readily apparent because stream banks were coated with fine ash mobilized from burned areas. Somewhat larger runoff events also occurred fre-quently, and would mobilize large volumes of woody debris, including pine needles, charred pine bark, and tree limbs. Clogging of culverts occurred frequently, and typically resulted in deposition of large volumes of woody debris upstream from roads (fig. 25). Mobiliza-tion of sediment for large events was apparent from sediment deposits formed in numerous locations (fig. 26). Dramatic evidence of a particularly extreme runoff event from a small, intensively burned drainage was provided by a deposit of boulders emplaced as a small alluvial fan at the base of an extremely steep channel (fig. 27).
Figure 25. Culverts occasionally became clogged with debris following large runoff events.
Photographs by Mark T. Anderson
September 1989
August 1988
Available streamflow records support the evi-dence from visual observations of increased storm-flow potential from burned areas; however, quantification of effects is complicated by various factors. A primary difficulty is an inability to accu-rately account for extremely large variability in pre-cipitation intensities and totals that can occur over very small distances during short-duration, high-intensity storms that often are influential in driving peak-flow events. Effects from differences in ante-cedent precipitation conditions probably are rela-tively minor because of the generally similar trends in longer term precipitation conditions in the prox-imity of drainage basins used for comparisons.
Hydrologic Effects of the Galena Fire 39

Figure 26. Numerous sediment deposits formed as a result of heavy erosion.
Photographs by Dietrich H. Whitesides
September 1989
March 1989
A qualitative perspective regarding effects of the Galena Fire on peak-flow characteristics is pro-vided by a graphical comparison of maximum daily instantaneous streamflow values (April through October during post-fire years) for selected sites (fig. 28). In spite of smaller drainage area (table 2), numerous peaks for Bear Gulch during 1989 are sub-stantially larger than for Grace Coolidge Creek (near Hayward). The steepness of many of these peaks for Bear Gulch is consistent with the anticipated post-fire response, and the relative frequency of occurrence is consistent with the field observations discussed previ-ously. Substantially fewer peaks for Bear Gulch are larger than for Grace Coolidge Creek during 1990,
40 Hydrologic Effects of the 1988 Galena Fire, Black Hills Area
with the number of exceeding peaks generally declining during subsequent years.
Various data for selected peaks from figure 28 for Bear Gulch and Grace Coolidge Creek (near Hayward) are presented in table 9 (in the Supplemental Information section). The selected peaks include all peaks where the maximum daily instantaneous stream-flow equalled or exceeded 10.0 ft3/s for at least one of the sites, and the data set presented includes the max-imum value for associated peaks for both sites. Most of the matched peaks occurred on the same dates; how-ever, several peaks are lagged by one day.
Boxplots showing distributions of peak dis-charges from table 9 are presented in figure 29. These
, South Dakota

boxplots confirm the previous observation that peaks for Bear Gulch routinely exceeded associated peaks for Grace Coolidge Creek (near Hayward) during 1989 and 1990, and that peak-flow potential for Bear Gulch decreased dramatically after 1990. Differences in drainage areas between Grace Coolidge Creek (7.48 mi2) and Bear Gulch (4.23 mi2) are an important consideration in comparing the data in figure 29. Peak-flow estimates for ungaged areas commonly are obtained by factoring estimates for gaged areas by the drainage-area ratio raised to an exponent of 0.5 (Burr and Korkow, 1996). Application of this method would yield a coefficient of 0.75 for estimating peaks for Bear Gulch on the basis of the control watershed (Grace Coolidge Creek). This coefficient closely approximates the ratios between Bear Gulch and Grace Coolidge Creek for both median and mean values for the 46 peaks during 1991-98 period (table 9). This comparison indi-cates general similarities in peak-flow characteristics for the two drainages after 1990.
Peak discharges per unit area for the selected peaks also are presented in table 9, in addition to ratios of the unit-area peak discharges (Bear Gulch to Grace Coolidge Creek). Boxplots of this data set are presented in figure 30. Unit-peak discharges for Bear Gulch would be expected to exceed those for Grace Coolidge Creek (near Hayward) by a factor of about 1.33 (the inverse of 0.75) because of the drainage area consider-ations discussed in the preceding paragraph. The
median of the 46 values for 1991-98 is 1.6, which again indicates similar peak-flow characteristics for the two drainages for this period. The mean value of 4.6 is not representative of the central tendency for the data set because it is heavily skewed by a large outlier for August 5, 1995, with a ratio of 98.24 (table 9). In comparison, mean and median values for 1990 and 1989 are about one and two orders of magnitude larger, respectively, than the median for 1991-98. These ratios are influenced primarily by the numerous, but relatively small, peaks that occurred frequently within the first several years of the fire and are not representative of the magnitude of effects that might occur for larger events.
Comparisons of maximum daily instantaneous streamflow for Grace Coolidge Creek (near Game Lodge) and Battle Creek also are provided in figure 28. Increased peak-flow response for Grace Coolidge Creek is apparent only for 1988-89. The most notable responses are the particularly large peaks in August of 1988 and September of 1989. Minor responses also are apparent for a series of small peaks for Grace Coolidge Creek during September and October of 1989, when corre-sponding responses for Battle Creek were minimal, with the exception of a single large peak during late September that was an order of magnitude larger than the corresponding peak for Grace Coolidge Creek.
Figure 27. Boulders were deposited following an extreme runoff event.
Photographs by C.J. Winter
August 1988 August 1988
Hydrologic Effects of the Galena Fire 41

Figure 28. Maximum daily streamflow (April-October) for Battle Creek, Grace Coolidge Creek, and Bear Gulch. Zero-flow values are plotted as 0.001 cubic feet per second.
DATE
0.001
0.01
0.1
1
10
100
1,000
10,0001988
BATTLE CREEK NEAR KEYSTONE (06404000)
GRACE COOLIDGE CREEK NEAR GAME LODGE, NEAR CUSTER (06404998)
GRACE COOLIDGE CREEK NEAR HAYWARD (06404800)
BEAR GULCH NEAR HAYWARD (06405800)
0.001
0.01
0.1
1
10
100
1,000
10,000
MA
XIM
UM
DA
ILY
INS
TA
NT
AN
EO
US
FLO
W, I
N C
UB
IC F
EE
T P
ER
SE
CO
ND
1989
0.001
0.01
0.1
1
10
100
1,000
10,0001990
APR MAY JUN JUL AUG SEP OCT
DATEAPR MAY JUN JUL AUG SEP OCT
0.001
0.01
0.1
1
10
100
1,000
10,0001991
1989
1990
1991
EXPLANATION
42 Hydrologic Effects of the 1988 Galena Fire, Black Hills Area, South Dakota
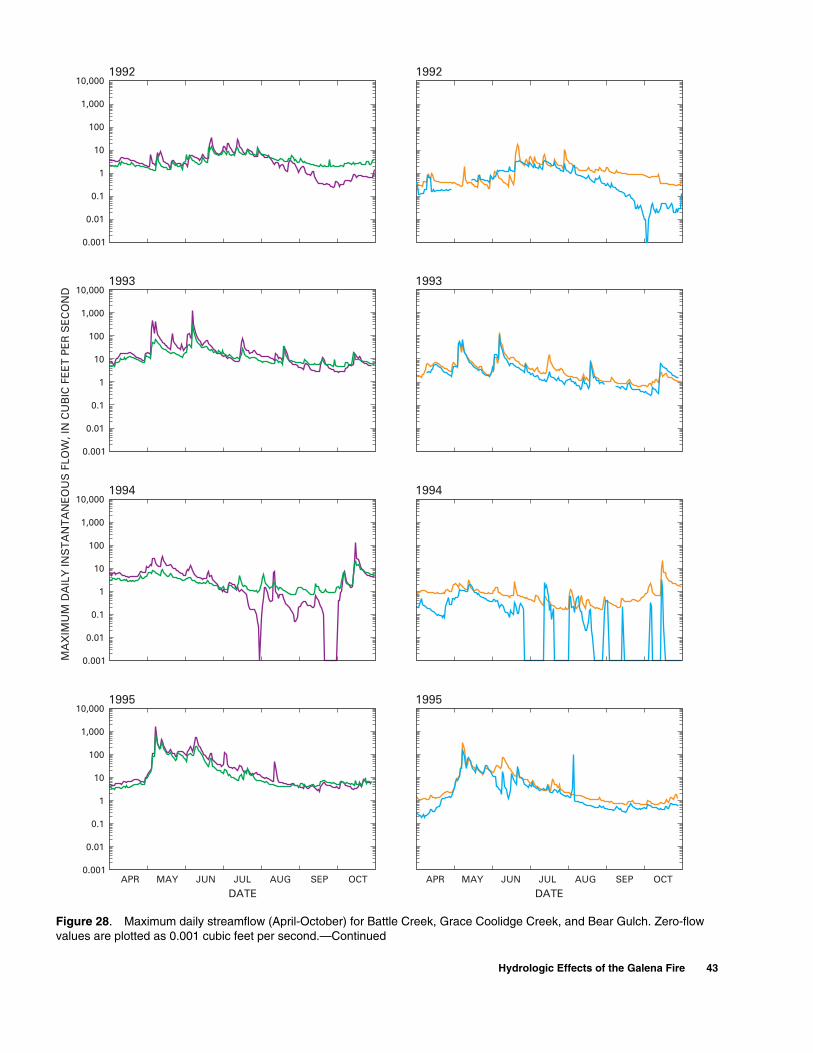
Figure 28. Maximum daily streamflow (April-October) for Battle Creek, Grace Coolidge Creek, and Bear Gulch. Zero-flow values are plotted as 0.001 cubic feet per second.—Continued
DATE
0.001
0.01
0.1
1
10
100
1,000
10,0001992
0.001
0.01
0.1
1
10
100
1,000
10,000
MA
XIM
UM
DA
ILY
INS
TA
NT
AN
EO
US
FLO
W, I
N C
UB
IC F
EE
T P
ER
SE
CO
ND
1993
0.001
0.01
0.1
1
10
100
1,000
10,0001994
APR MAY JUN JUL AUG SEP OCT
DATEAPR MAY JUN JUL AUG SEP OCT
0.001
0.01
0.1
1
10
100
1,000
10,0001995
1993
1994
1995
1992
Hydrologic Effects of the Galena Fire 43

Figure 28. Maximum daily streamflow (April-October) for Battle Creek, Grace Coolidge Creek, and Bear Gulch. Zero-flow values are plotted as 0.001 cubic feet per second.—Continued
DATE
0.001
0.01
0.1
1
10
100
1,000
10,0001996
0.001
0.01
0.1
1
10
100
1,000
10,000
MA
XIM
UM
DA
ILY
INS
TA
NT
AN
EO
US
FLO
W, I
N C
UB
IC F
EE
T P
ER
SE
CO
ND
1997
0.001
0.01
0.1
1
10
100
1,000
10,0001998
APR MAY JUN JUL AUG SEP OCT
DATEAPR MAY JUN JUL AUG SEP OCT
1997
1998
1996
44 Hydrologic Effects of the 1988 Galena Fire, Black Hills Area, South Dakota

Figure 29. Peak discharges for Grace Coolidge Creek near Hayward (06404800) and Bear Gulch near Hayward (06405800).
8EXPLANATION
75th percentile
Number of values
Data value less than or equal to 1.5 times the interquartile range outside the quartile
Median
25th percentile
Outlier data value less than or equal to 3 and more than 1.5 times the interquartile range outside the quartile
Outlier data value greater than 3 times the interquartile range outside the quartile
Interquartilerange
GraceCoolidge
Creek
BearGulch
GraceCoolidge
Creek
BearGulch
GraceCoolidge
Creek
BearGulch
1989 1990 1991-98
0.1
1
10
100
1,000
10,000
PE
AK
DIS
CH
AR
GE
, IN
CU
BIC
FE
ET
PE
R S
EC
ON
D 8 8 46 466 6
Hydrologic Effects of the Galena Fire 45

46 Hyd
Figure 30. Ratio of peak discharges per unit area for Bear Gulch near Hayward (06405800) to Grace Coolidge Creek near Hayward (06404800).
8EXPLANATION
75th percentile
Number of values
Data value less than or equal to 1.5 times the interquartile range outside the quartile
Median
25th percentile
Outlier data value less than or equal to 3 and more than 1.5 times the interquartile range outside the quartile
Outlier data value greater than 3 times the interquartile range outside the quartile
Interquartilerange
1989 1990 1991-980.1
1
10
100
1,000
10,000
RA
TIO
8 466
rologic Effects of the 1988 Galena Fire, Black Hills Area, South Dakota

The preponderance of information considered thus far strongly supports a conclusion of increased stormflow potential in burned areas during the first 2 to 3 years following the Galena Fire, after which peak-flow response decreased substantially. Additional sup-porting evidence is provided by double mass analyses of cumulative annual peak flows for selected long-term streamflow-gaging stations (table 10 in Supplemental Information section). Plots of cumulative annual peaks for Grace Coolidge Creek (near Game Lodge) versus cumulative annual peaks for other selected gages are presented in figure 31. Locations of other gages were shown previously in figures 1 and 2. Gaging stations considered include relatively long-term stations along the eastern flank of the Black Hills that are appropriate for this analysis. Several long-term gages were excluded because of influences such as reservoir regu-lation. Peak-flow records for Grace Coolidge Creek include records for WY 1967-76 for station 06405000 (Grace Coolidge Creek near Custer), as discussed pre-viously in the Streamflow Data section of this report. The resulting, combined period of peak-flow record for Grace Coolidge Creek (WY 1967-98) is used for many of the plots in figure 31. For stations with shorter records, only the period of overlapping record can be considered. Records for WY 1967-72 are excluded for Battle Creek and Boxelder Creek because of the influ-ence of a massive storm that occurred during 1972 and resulted in a flood peak with a recurrence interval in excess of 100 years (U.S. Geological Survey, 1975).
All of the plots in figure 31 indicate large annual peaks for Grace Coolidge Creek during the first several post-fire years (generally WY 1988-89 or 1990), relative to annual peaks for other stations during this period. Plots for several stations (Beaver, French, and Whitewood Creeks) have substantially steeper slopes for subsequent outyears (generally 1991-98) than for the pre-burn period, which could be interpreted as indicative of a longer term increase in stormflow potential, but at a reduced level. For all other stations, however, slopes for the subsequent out-years are similar to or less steep than slopes for the pre-burn period. Thus, it is concluded that stormflow potential for Grace Coolidge Creek increased substan-tially for the first several years after the Galena Fire, but then diminished to a generally pre-burn condition.
Diminishment of peak-flow potential can be explained by vegetation recovery that is documented by remotely sensed imagery available for the study area. LANDSAT Thematic Mapper data contain a wealth of
information about earth features. Each spectral band responds in unique ways to terrain features, which enhances the ability to distinguish the identity and condition of these features, such as vegetation type, structure, and water content.
The normalized difference vegetation index (NDVI), which provides an estimate of vegetation condition (greenness), was used as a means for evalu-ating relative changes in vegetation density over time for the area burned by the Galena Fire. NDVI is a ratio of measured intensities from the visible and near-infrared spectral bands as measured by bands 3 (0.63-0.69 micrometers) and 4 (0.76-0.90 micrometers) on the LANDSAT Thematic Mapper sensor. Healthy veg-etation absorbs most of the visible light and reflects a large portion of the near-infrared light. Unhealthy or sparse vegetation reflects more visible light and less near-infrared light. NDVI is calculated using the fol-lowing formula (from Weier and Herring, 2001):
NDVI = (NIR-VIS)/(NIR+VIS)
whereNIR = near-infrared radiation, andVIS = visible radiation.
NDVI values range between -1 and 1. Very low values of NDVI (less than 0.1) correspond to barren areas; moderate values (0.2 to 0.3) represent shrub and grassland; and high values (0.6 to 0.8) indicate tem-perate and tropical rainforests (Weier and Herring, 2001).
The establishment of grasses and forbs in the burned area occurred much more quickly than regrowth of the ponderosa pine forest, as shown by the succession of photographs in figure 13. Maximum greenness from grasses and forbs generally occurs during June in the Black Hills area. Thus, LANDSAT Thematic Mapper images showing negligible or min-imal cloud cover for the Custer State Park area were acquired for a day in June (or as close to June as pos-sible) for each year from 1988 through 2002 (table 6); adequate (cloud-free) images were not available in 1994, 1995, and 1999. LANDSAT images from 2000-02 are included in analyses to provide additional infor-mation about the Galena Fire beyond the general study period (through water year 1998). Each selected annual image was processed to obtain the NDVI data for the study area.
Hydrologic Effects of the Galena Fire 47
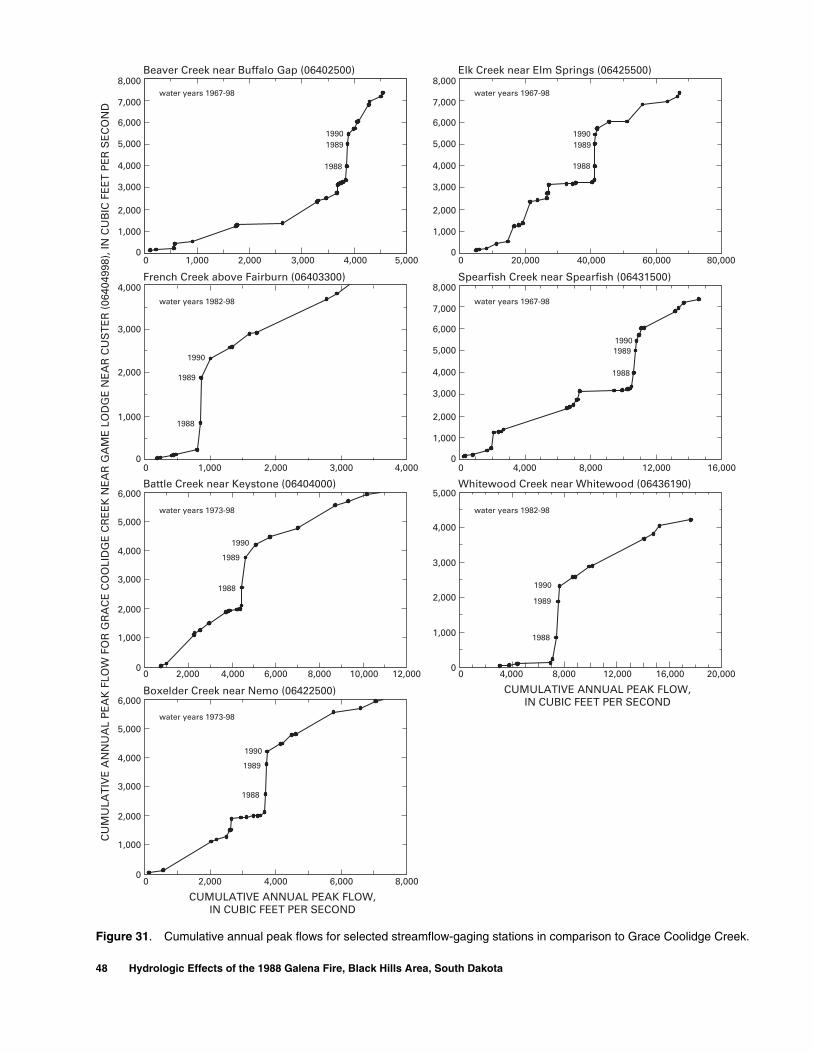
Figure 31. Cumulative annual peak flows for selected streamflow-gaging stations in comparison to Grace Coolidge Creek.
CUMULATIVE ANNUAL PEAK FLOW,IN CUBIC FEET PER SECOND
Beaver Creek near Buffalo Gap (06402500)
CU
MU
LAT
IVE
AN
NU
AL
PE
AK
FLO
W F
OR
GR
AC
E C
OO
LID
GE
CR
EE
K N
EA
R G
AM
E L
OD
GE
NE
AR
CU
ST
ER
(06
4049
98),
IN C
UB
IC F
EE
T P
ER
SE
CO
ND
French Creek above Fairburn (06403300)
Battle Creek near Keystone (06404000)
Boxelder Creek near Nemo (06422500)
8,000
6,000
4,000
2,000
7,000
5,000
3,000
1,000
0
4,000
3,000
2,000
1,000
0
6,000
4,000
2,000
5,000
3,000
1,000
0
0 1,000 2,000 3,000 4,000 5,000
0 1,000 2,000 3,000 4,000
0 2,000 4,000 6,000 8,000 12,00010,000
0 2,000 4,000 6,000 8,000
water years 1967-98
water years 1982-98
water years 1973-98
water years 1973-98
1988
1988
1988
1988
1989
1989
1989
1989
1990
1990
1990
1990
6,000
4,000
2,000
5,000
3,000
1,000
0
CUMULATIVE ANNUAL PEAK FLOW,IN CUBIC FEET PER SECOND
Elk Creek near Elm Springs (06425500)
Spearfish Creek near Spearfish (06431500)
Whitewood Creek near Whitewood (06436190)
8,000
6,000
4,000
2,000
7,000
5,000
3,000
1,000
0
8,000
6,000
4,000
2,000
7,000
5,000
3,000
1,000
0
4,000
2,000
5,000
3,000
1,000
0
0 20,000 40,000 60,000 80,000
0 4,000 8,000 12,000 16,000
0 4,000 8,000 12,000 16,000 20,000
water years 1967-98
water years 1967-98
water years 1982-98
1988
1988
1989
1989
1990
1990
1988
1989
1990
48 Hydrologic Effects of the 1988 Galena Fire, Black Hills Area, South Dakota

Table 6. Mean normalized difference vegetation index values for selected areas
Image date
Areas within perimeter of Galena Fire Control area innorthwest corner of
Custer State Park(fig. 32)
All areasModerate-low to high-
severity burn areas(fig. 32)
Unburned to low-severity burn areas
(fig. 32)
7/3/1988 0.515 0.517 0.511 0.473
6/20/1989 .199 .145 .299 .389
6/23/1990 .391 .367 .434 .454
7/12/1991 .401 .365 .467 .497
6/12/1992 .369 .342 .421 .449
5/14/1993 .281 .250 .339 .403
6/7/1996 .370 .336 .433 .516
6/26/1997 .443 .414 .500 .533
7/15/1998 .478 .454 .522 .553
6/2/2000 .340 .306 .404 .488
6/5/2001 .351 .316 .418 .489
5/31/2002 .268 .227 .346 .437
LANDSAT images also were used to determine the burn severity of areas within the fire perimeter using methods presented by Key and Benson (2003). The methods employ a scaled index that gauges the magnitude of ecological change caused by fire and groups areas within the fire perimeter into the fol-lowing five categories: unburned, low severity, moderate-low severity, moderate-high severity, and high severity. Figure 32 shows the Galena Fire perim-eter and burn severity as determined from comparisons between pre-fire (July 3, 1988) and post-fire (June 29, 1989) images. The data shown in figure 32 were not calibrated with field measurements, but compare reasonably well with the timber mortality and fire perimeter shown in fig. 10. Figure 32 also shows an area in the northwest corner of Custer State Park that was considered to represent an unburned control area within the study area for subsequent NDVI analyses.
Mean NDVI values were calculated for areas with selected burn severities (table 6) using the pro-cessed data for each year for which an adequate image was available. The 1988 image was taken only 2 days before the Galena Fire began and provides a baseline for pre-fire conditions. In 1988, the mean NDVI for all areas within the fire perimeter was 0.515 (table 6), which indicates healthy vegetation prior to the fire. It should be noted that NDVI values probably were slightly lower in 1988 than previous years due to the extended drought conditions in 1988.
Figure 33 shows the temporal changes in NDVI values for the images listed in table 6 for the different burn-severity categories within the burned area and for the control area. As expected, the NDVI values for all of the burn-severity categories are much lower for 1989 than for 1988, with much lower values for the higher severity burn areas than for the lower severity burn areas. The NDVI value for the control area also is somewhat lower for 1989 than for 1988 because of the prolonged effects of drought conditions on vegetative condition. A very large increase in NDVI values for the burn areas is apparent for 1990, with the largest increase occurring for the higher severity areas. Much of the large increase for the higher severity areas prob-ably resulted from particularly heavy stands of yellow blossom sweet clover, which was the primary seed stock used for post-fire remedial seeding during 1988 (South Dakota Department of Environment and Natural Resources, 1991; Walker and others, 1995). The sweet clover was widely established as seedlings by 1989, and developed particularly heavy growth during 1990, but generally phased out very quickly thereafter (Ron Walker, Custer State Park, oral commun., October 2003). This general progression is visible in the photograph sequence of figure 13, which shows numerous sweet-clover stalks in background areas during 1990. The disturbed area in the foreground (fig. 13) also had relatively heavy sweet clover during 1992 (presumably because sweet clover is a biennial); however, various grasses are the predominant species apparent for all other years.
Hydrologic Effects of the Galena Fire 49

50
Figure 32. Burn severity of the Galena Fire determined on the basis of remotely sensed data from July 3, 1988, and June 20, 1989. Control area used to represent an unburned area also is shown.
BURN SEVERITY
CONTROL AREA
Unburned
Moderate-lowLow
HighModerate-high
Creek
Beaver
Battle
Spokane
Gulch
Bear
Iron
Flynn
Creek
Cr
Creek
Creek
CreekC
reek French
French
Lame
Johnny
GraceCoolidge
Creek
Creek
Creek
Creek
Highland
CenterLake
LegionLake
BismarckLake
StockadeLake
Galena
PENNINGTON CO
CUSTER CO
Custer
Pringle
Hayward
Custer
State
Park
0 642 531 MILES
0 642 531 KILOMETERS
Base modified from U.S. Geological Survey digital data, 1:100,000, 1977Universal Transverse Mercator projection, zone 13
Mt.Coolidge
HarneyPeak
EXPLANATIONCUSTER STATE PARK
Wind Cave National Park
Mt. RushmoreNationalMemorial
103º30' 103º15'
43º52'30"
43º45'
43º37'30"
X
X
Hydrologic Effects of the 1988 Galena Fire, Black Hills Area, South Dakota

Figure 33. Mean normalized difference vegetation index values for selected areas during or near June.
During 1991, the NDVI value for the lower severity burn areas increased moderately; however, the value for the higher severity areas decreased slightly (fig. 33). NDVI values for all subsequent years track similarly. The decrease during 1991 for the higher severity areas may have resulted from a general transi-tion from sweet-clover dominance to somewhat lighter stands of various grasses in many areas. Much of the variability in NDVI values for subsequent years prob-ably reflects vegetation response to differences in climatic conditions. The maximum mean post-fire NDVI value for the burned area (0.478) occurred in 1998 following several years of wet climatic condi-tions.
The regrowth of vegetation following the Galena Fire could be identified visually in the NDVI images for post-fire years in comparison to the pre-fire image in 1988. Only selected images from post-fire years (1989, 1990, and 1998) are shown in figure 34, but all avail-able images were considered in the following discus-sion. In figure 34, the dark tones within the area burned by the Galena Fire in the 1989 image indicate relatively low quantities of green vegetation. The light tones in other areas indicate relatively high quantities of green vegetation. Within the area burned by the Galena Fire, the tones became progressively lighter from 1989 to 1998, which correspond to increases in green vegeta-tion. The largest annual increase to lighter tones within the burned area of the Galena Fire occurred between the 1989 and 1990 NDVI images. Areas burned intensively during the 1990 Cicero Peak Fire also are readily apparent in the 1998 image.
1988 1990 1992 1994 1996 1998 2000 2002
YEAR
0
0.2
0.4
0.6N
OR
MA
LIZ
ED
DIF
FER
EN
CE
VE
GE
TA
TIO
NIN
DE
X
All areas within fire boundaryModerate-low to high severity burn areasUnburned to low severity burn areasControl area
The NDVI analyses provide evidence that establishment of grasses and forbs as a replacement for the previous stands of ponderosa pine had largely occurred by 1990. Although NDVI analyses indicate that post-fire vegetation density has remained gener-ally smaller than pre-fire vegetation density, analyses of streamflow data indicate that peak-flow character-istics subsequent to 1990 are approximately similar to peak-flow characteristics prior to the Galena Fire. Thus, these data indicate that the grasses and forbs that replaced the ponderosa pine forest are approximately equally effective in suppressing peak flows.
As discussed previously, quantification of increased stormflow potential is difficult because of various factors. Peak-flow frequency analyses for selected sites and periods of record are presented in table 7 for consideration of various quantitative aspects of increased stormflow potential. These peak-flow frequency estimates were derived using the log-Pearson Type III procedure recommended in Bulletin 17B of the Hydrology Subcommittee of the U.S. Inter-agency Advisory Committee on Water Data, 1982, “Guidelines for Determining Flood Flow Frequency” (United States Water Resources Council, 1982). Annual peak flows used in the analyses are provided in table 10. Readers are cautioned that the peak-flow estimates provided in table 7 are heavily influenced by conditions during the short periods of record consid-ered, and should not be considered representative of long-term peak-flow characteristics for these sites.
Peak-flow frequency estimates for pre- and post-burn periods for Battle Creek and Grace Coolidge Creek (near Game Lodge) are presented in table 7. The pre-burn period considered excludes data prior to 1973 because of the influence of a massive storm that occurred during 1972 and resulted in a flood peak in excess of 26,000 ft3/s for Battle Creek (table 8). The corresponding peak, however, was less than 1,000 ft3/s for Grace Coolidge Creek, which was on the south fringe of the storm. The post-burn (1988-98) peak-flow estimates for Grace Coolidge Creek (table 7) generally are about twice as large as the pre-burn (1973-87) estimates for corresponding recurrence intervals; however, post-burn estimates for Battle Creek are about three to four times larger than the corresponding pre-burn estimates. Thus, it is apparent that the influence of the Galena Fire on peak-flow frequency estimates for Grace Coolidge Creek is minor, relative to the influence of episodic rainfall events that caused a series of large peaks for Battle Creek during 1993-98 (table 8) and resulted in the particularly large peak-flow frequency estimates for the post-burn period for this station.
Hydrologic Effects of the Galena Fire 51

Table 7. Peak-flow frequency estimates for selected recurrence intervals for selected streamflow-gaging stations
Stationnumber
Station name
Period of analysis(water years)
Peak flow, in cubic feet per second, for recurrence interval, in years
2 5 10 25 50 100 200 500
06404000 Battle Creek near Keystone 1973-87 137 425 788 1,550 2,420 3,660 5,350 8,570
1988-98 297 1,270 2,660 5,730 9,310 14,300 21,100 33,500
06404998 Grace Coolidge Creek near Game Lodge near Custer
1973-87 48 181 371 809 1,350 2,160 3,320 5,640
1988-98 211 657 1,170 2,120 3,100 4,330 5,860 8,410
06404800 Grace Coolidge Creek near Hayward
1989-98 81 201 320 522 713 942 1,210 1,640
06405800 Bear Gulch near Hayward 1989-98 69 276 573 1,260 2,100 3,310 5,040 8,420
Most peak-flow frequency estimates for Bear Gulch (table 7) are considerably larger than for Grace Coolidge Creek (near Hayward), despite smaller drainage area (table 2). The peak-flow estimates for Bear Gulch are roughly comparable to estimates for three of the four periods considered for Battle Creek and Grace Coolidge Creek (near Game Lodge), both of which have drainage areas that are about an order of magnitude larger than Bear Gulch. The peak-flow fre-quency estimates for Bear Gulch are heavily influenced by the peak of 1,250 ft3/s on September 7, 1989, which is about an order of magnitude larger than any of the other peaks for Bear Gulch (tables 9 and 10).
Data summarized in figures 29 and 30 provided strong evidence of increased stormflow potential for Bear Gulch through 1990. With the exception of the peak of 1,250 ft3/s for Bear Gulch, however, other peaks for Bear Gulch and Grace Coolidge Creek (near Hayward) during 1989-90 were of relatively small magnitude. Peaks exceeding the estimated magnitude for a 2-year recurrence interval (table 7) did occur for both streams on May 29, 1990 (table 10). The relative magnitudes of these peaks, and the associated unit-area discharges (table 9), however, are approximately com-mensurate with the predicted ratios based on drainage areas that were discussed previously. Thus, increased stormflow response for Bear Gulch is not indicated for this event, although increased response is apparent for several other smaller events that occurred later in 1990. Measured precipitation totals (U.S. Geological Survey, 1991) for this storm generally were in the range of 3 to 4 in. for applicable precipitation gages (table 1);
52 Hydrologic Effects of the 1988 Galena Fire, Black Hills Area
however, rainfall intensities were low for this long-duration storm (Moody and Martin, 2001).
Extremely high precipitation intensities occurred during the storm that resulted in large peaks (1,030 and 1,250 ft3/s, respectively) on September 7, 1989, for Grace Coolidge Creek (near Game Lodge) and Bear Gulch (table 10). Precipitation amounts for these drain-ages (fig. 14) were much larger than for Battle Creek and Grace Coolidge Creek (near Hayward); thus, valid comparisons between burned and unburned conditions cannot be made for this storm. Moody and Martin (2001) reported a maximum 30-minute intensity of about 2.6 in/hr (1.3 in. per 1/2 hour) for Bear Gulch, which constituted most of the storm total for that day. Additional rainfall in the range of 1 to 2 in. occurred during the next 1 to 2 days throughout the burned area, but failed to produce substantial runoff.
Moody and Martin (2001) investigated relations between peak discharge and rainfall intensity for three severely burned watersheds, including Bear Gulch, in the western United States. These investigators esti-mated a recurrence interval of about 10 years for the September 7, 1989, rainstorm. These investigators concluded that precipitation intensity is a particularly important factor in driving the occurrence of large-discharge events. Comparison of peak discharges for Bear Gulch for the two storms discussed in detail sup-ports this conclusion (the high-intensity storm yielded a peak discharge that was an order of magnitude larger than the high-volume storm with low intensity).
, South Dakota

Figure 34. Normalized difference vegetation index images for selected years.
U.S. Geological Survey/Geography Discipline, EROS Data CenterUniversal Transverse Mercator projection, zone 13
July 3, 1988
June 20, 1989
June 23, 1990
July 15, 1998
EXPLANATIONDark tones—Low quantites of green vegetationLight tones—High quantites of green vegetation
Hydrologic Effects of the Galena Fire 53
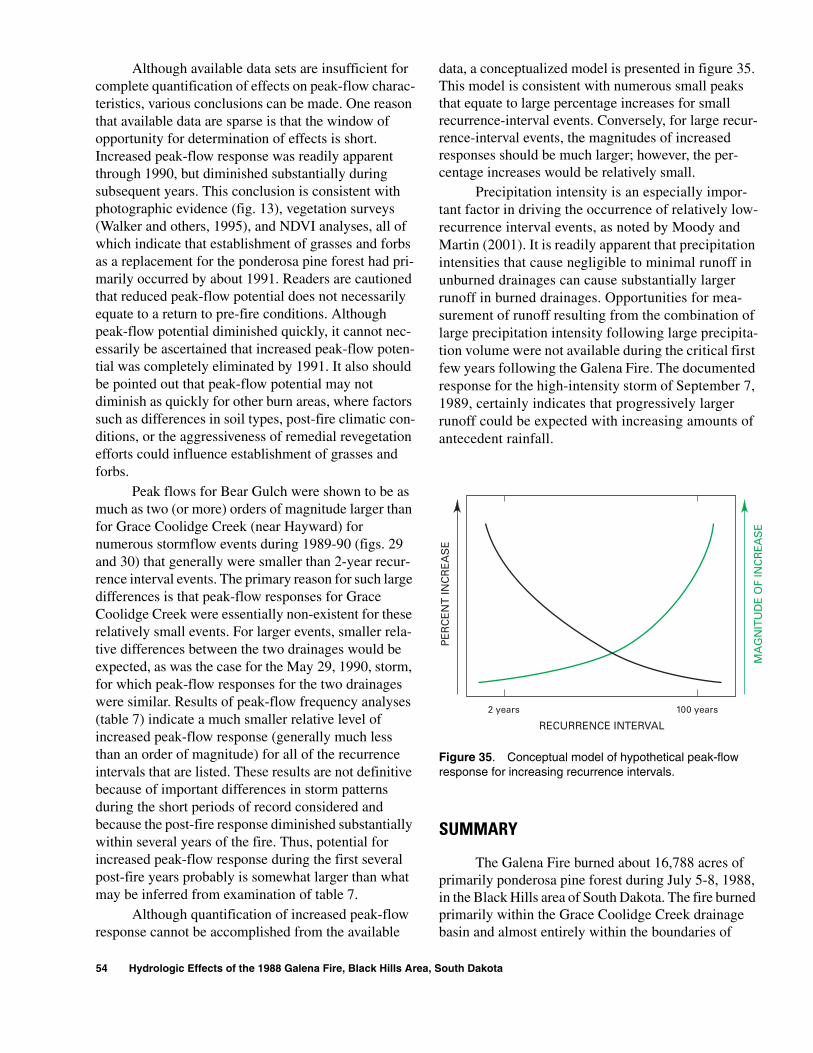
Although available data sets are insufficient for complete quantification of effects on peak-flow charac-teristics, various conclusions can be made. One reason that available data are sparse is that the window of opportunity for determination of effects is short. Increased peak-flow response was readily apparent through 1990, but diminished substantially during subsequent years. This conclusion is consistent with photographic evidence (fig. 13), vegetation surveys (Walker and others, 1995), and NDVI analyses, all of which indicate that establishment of grasses and forbs as a replacement for the ponderosa pine forest had pri-marily occurred by about 1991. Readers are cautioned that reduced peak-flow potential does not necessarily equate to a return to pre-fire conditions. Although peak-flow potential diminished quickly, it cannot nec-essarily be ascertained that increased peak-flow poten-tial was completely eliminated by 1991. It also should be pointed out that peak-flow potential may not diminish as quickly for other burn areas, where factors such as differences in soil types, post-fire climatic con-ditions, or the aggressiveness of remedial revegetation efforts could influence establishment of grasses and forbs.
Peak flows for Bear Gulch were shown to be as much as two (or more) orders of magnitude larger than for Grace Coolidge Creek (near Hayward) for numerous stormflow events during 1989-90 (figs. 29 and 30) that generally were smaller than 2-year recur-rence interval events. The primary reason for such large differences is that peak-flow responses for Grace Coolidge Creek were essentially non-existent for these relatively small events. For larger events, smaller rela-tive differences between the two drainages would be expected, as was the case for the May 29, 1990, storm, for which peak-flow responses for the two drainages were similar. Results of peak-flow frequency analyses (table 7) indicate a much smaller relative level of increased peak-flow response (generally much less than an order of magnitude) for all of the recurrence intervals that are listed. These results are not definitive because of important differences in storm patterns during the short periods of record considered and because the post-fire response diminished substantially within several years of the fire. Thus, potential for increased peak-flow response during the first several post-fire years probably is somewhat larger than what may be inferred from examination of table 7.
Although quantification of increased peak-flow response cannot be accomplished from the available
54 Hydrologic Effects of the 1988 Galena Fire, Black Hills Area
data, a conceptualized model is presented in figure 35. This model is consistent with numerous small peaks that equate to large percentage increases for small recurrence-interval events. Conversely, for large recur-rence-interval events, the magnitudes of increased responses should be much larger; however, the per-centage increases would be relatively small.
Precipitation intensity is an especially impor-tant factor in driving the occurrence of relatively low-recurrence interval events, as noted by Moody and Martin (2001). It is readily apparent that precipitation intensities that cause negligible to minimal runoff in unburned drainages can cause substantially larger runoff in burned drainages. Opportunities for mea-surement of runoff resulting from the combination of large precipitation intensity following large precipita-tion volume were not available during the critical first few years following the Galena Fire. The documented response for the high-intensity storm of September 7, 1989, certainly indicates that progressively larger runoff could be expected with increasing amounts of antecedent rainfall.
Figure 35. Conceptual model of hypothetical peak-flow response for increasing recurrence intervals.
SUMMARY
The Galena Fire burned about 16,788 acres of primarily ponderosa pine forest during July 5-8, 1988, in the Black Hills area of South Dakota. The fire burned primarily within the Grace Coolidge Creek drainage basin and almost entirely within the boundaries of
2 years 100 years
RECURRENCE INTERVAL
PE
RC
EN
T IN
CR
EA
SE
MA
GN
ITU
DE
OF
INC
RE
AS
E
, South Dakota

Custer State Park. A U.S. Geological Survey (USGS) gaging station with streamflow records dating back to 1977 was located along Grace Coolidge Creek within the burned area. About one-half of the gaging station’s 26.8-square-mile drainage area was burned. The drainage basin for Bear Gulch, which is tributary to Grace Coolidge Creek, was burned particularly severely, with complete deforestation occurring in nearly the entirety of the area upstream from a gaging station that was installed in 1989.
The existence of long-term, pre-burn streamflow data provided a unique opportunity to evaluate the hydrologic effects of forest fire. In 1988, a study to evaluate effects on streamflow, geomorphology, and water-quality was initiated by the USGS in cooperation with the South Dakota Department of Environment and Natural Resources and the South Dakota Department of Game, Fish and Parks. The geomorphologic and water-quality components of the study were completed by 1990. A data-collection network consisting of stream-flow- and precipitation-gaging stations was operated through water year 1998 for evaluation of effects on streamflow characteristics, including both annual-yield and peak-flow characteristics. Additional cooperators that have supported this continuing component of the study included the South Dakota Department of Agriculture (Forestry Division), West Dakota Water Development District, and U.S. Department of Agriculture (Forest Service).
Moderately burned areas did not experience a substantial increase in the rate of surface erosion; how-ever, severely burned areas underwent surficial erosion nearly twice that of the unburned areas. The increased erosion was caused by a combination of sheet erosion and wind erosion. The sediment production rate of Bear Gulch estimated 8 to 14 months after the fire was 870 ft3/acre (44 tons/acre). Substantial degradation of stream channels within the severely burned headwater areas of Bear Gulch was documented. Further down-stream, channel aggradation resulted from deposition of sediments transported from the headwater areas.
The most notable water-quality effect was on concentrations of suspended sediment, which were orders of magnitude higher for Bear Gulch than for the unburned control area. Effects on several other water-quality constituents, such as organic carbon and nitrogen and phosphorus nutrient constituents, prob-ably were influenced by the large concentrations of sus-pended matter that were documented in initial post-fire, stormflow events. The first post-fire stormflow pro-duced the highest measured concentrations of specific
conductance, nitrogen, phosphorus, organic carbon, calcium, magnesium, potassium, manganese, and sulfate in the burned areas. For most constituents sampled, differences in concentrations between burned and unburned areas were no longer discernible within about 1 year following the Galena Fire.
The effects of the Galena Fire on annual-yield characteristics of Grace Coolidge Creek were evalu-ated primarily from comparisons with long-term streamflow records for Battle Creek, which is hydro-geologically similar and is located immediately to the north. Analyses were complicated by climatic condi-tions, which were considerably wetter during the post-burn period than during the pre-burn period. Thus, statistically significant increases in annual yield occurred during the post-burn period for both drain-ages. Various analyses indicated larger increases for Grace Coolidge Creek than for Battle Creek. Between the pre- and post-burn periods, the mean annual yield increased from 1.53 to 3.93 in. for Grace Coolidge Creek compared to an increase from 1.29 to 2.98 in. for Battle Creek. Relations between annual yield for Grace Coolidge Creek and Battle Creek for pre- and post-burn periods were used to estimate increased annual yield of about 20 percent for Grace Coolidge Creek. Many of the post-burn data points are well beyond the range of the pre-burn data, which required extrapolation of the pre-burn regression equation used in estimating yield increases, and is a source of uncer-tainty for the estimates.
Substantial increases in peak-flow characteris-tics for severely burned drainages were visually apparent from numerous post-fire field observations. Evidence of frequent, minor runoff events from burned drainages was readily apparent because stream banks were coated with fine ash mobilized from burned areas. Somewhat larger runoff events also occurred frequently, and would mobilize large vol-umes of woody debris, including pine needles, charred pine bark, and tree limbs. Mobilization of sediment was apparent for particularly large runoff events in several locations, with mobilization of large boulders documented in one small, intensively burned drainage.
Various analyses of streamflow data indicated substantial increases in peak-flow response for burned drainage areas; however, quantification of effects was particularly difficult because peak-flow response diminished quickly and returned to a generally pre-burn condition by about 1991. Field observations of vegetation and analysis of remotely sensed data indi-cated that establishment of grasses and forbs in the
Summary 55

burn area occurred within a similar timeframe. Com-parison of pre-fire peak flows to post-1991 peak flows indicates that these grasses and forbs were equally effective in suppressing peak flows as the predomi-nantly ponderosa pine forest was prior to the Galena Fire. Peak-flow potential may not diminish as quickly for other burn areas where various factors could influ-ence revegetation.
Numerous peak-flow events with small recur-rence intervals occurred within burned areas through 1990. Peak-flow events for Bear Gulch during this period were about one to two orders of magnitude larger than corresponding peaks for a small control drainage located along Grace Coolidge Creek upstream from the burn area. The small peaks do not provide quantitative information applicable to estimation of peak-flow magnitudes for larger events, however. Peak-flow events for Bear Gulch that occurred during 1991-98 were generally similar to those for the control drainage. A short-term increase in peak-flow potential also was documented for the longer-term gaging station located along Grace Coolidge Creek; however, peak-flow response was less pronounced than for Bear Gulch, which had nearly complete deforestation within a much smaller drainage area.
One particularly high-intensity storm (recur-rence interval of about 10 years) occurred during 1989 within the burned areas for both Grace Coolidge Creek and Bear Gulch, but produced minimal rainfall in the two primary control drainages. Especially large peaks occurred from the burned areas; however, representa-tive comparisons with unburned areas could not be made.
REFERENCES
Anderson, M.T., 1980, Water quantity and quality of three adjacent Black Hills watersheds: Rapid City, South Dakota School of Mines and Technology, unpublished M.S. thesis, 158 p.
Berndt, H.W., 1971, Early effects of forest fire on streamflow characteristics: Portland, Oregon, U.S. Department of Agriculture, Forest Service, Pacific Northwest Forest and Range Experiment Station, Research Note PNW-148, 9 p.
Beschta, R.L., 1978, Long-term patterns of sediment produc-tion following road construction and logging in the Oregon Coast Range: Water Resources Research, v. 14, no. 6, p. 1011-1016.
56 Hydrologic Effects of the 1988 Galena Fire, Black Hills Area
Bosch, J.M., and Hewlett, J.D., 1982, A review of catchment experiments to determine the effect of vegetation changes on water yield and evapotranspiration: Journal of Hydrology, v. 55, p. 3-23.
Bowling, L.C., Storck, Pascal, and Lettenmaier, D.P., 2000, Hydrologic effects of logging in western Washington, United States: Water Resources Research, v. 36, no. 11, p. 3223-3240.
Brown, P.M., and Sieg, C.H., 1996, Fire history in interior ponderosa pine communities of the Black Hills, South Dakota, USA: International Journal of Wildland Fire, v. 6, no. 3, p. 97-105.
Burr, M.J., and Korkow, K.L., 1996, Peak-flow frequency estimates through 1994 for gaged streams in South Dakota: U.S. Geological Survey Open-File Report 96-202, 407 p.
Cannon, S.H., 2001, Debris-flow generation from recently burned watersheds: Environmental & Engineering Geoscience, v. 7, no. 4, p. 321-341.
Carter, J.M., Driscoll, D.G., Williamson, J.E., and Lindquist, V.A., 2002, Atlas of water resources in the Black Hills area, South Dakota: U.S. Geological Survey Hydro-logic Investigations Atlas HA-747, 120 p.
Colman, E.A., 1953, Fire and water in southern California’s mountains: Berkeley, California, U.S. Department of Agriculture, Forest Service, California Forest and Range Experiment Station, Miscellaneous Paper No. 3, 8 p.
DeBano, L.F., 2000, The role of fire and soil heating on water repellency in wildland environments—A review: Journal of Hydrology, v. 231-232, p. 195-206.
DeWitt, Ed, Redden, J.A., Buscher, David, and Wilson, A.B., 1989, Geologic map of the Black Hills area, South Dakota and Wyoming: U.S. Geological Survey Map I-1910, scale 1:250,000.
Doerr, S.H., Shakesby, R.A., and Walsh, R.P.D., 2000, Soil water repellency—Its causes, characteristics and hydro-geomorphological significance: Earth-Science Reviews, v. 51, p 33-65.
Driscoll, D.G., and Carter, J.M., 2001, Hydrologic condi-tions and budgets for the Black Hills of South Dakota, through water year 1998: U.S. Geological Survey Water-Resources Investigations Report 01-4226, 143 p.
Driscoll, D.G., Carter, J.M., Williamson, J.E., and Putnam, L.D., 2002, Hydrology of the Black Hills area, South Dakota: U.S. Geological Survey Water-Resources Investigations Report 02-4094, 150 p.
Driscoll, D.G., Hamade, G.R., and Kenner, S.J., 2000, Sum-mary of precipitation data for the Black Hills area of South Dakota, water years 1931-98: U.S. Geological Survey Open-File Report 00-329, 151 p.
Grafe, Ernest, and Horsted, Paul, 2002, Exploring with Custer—The 1874 Black Hills Expedition: Custer, S. Dak., Golden Valley Press, 288 p.
, South Dakota

Gundarlahalli, J.R., 1990, Chemical and biological charac-teristics of Grace Coolidge and Bear Gulch Creeks after the Galena Forest Fire in Custer State Park, South Dakota: Rapid City, South Dakota School of Mines and Technology, unpublished M.S. thesis, 207 p.
Harris, D.D., 1977, Hydrologic changes after logging in two small Oregon coastal watersheds: U.S. Geological Survey Water-Supply Paper 2037, 31 p.
Helsel, D.R., and Hirsch, R.M., 1992, Statistical methods in water resources—Studies in environmental science: New York, Elsevier, v. 49, 529 p.
Helvey, J.D., 1973, Watershed behavior after forest fire in Washington, in Selected Papers from Agricultural and Urban Considerations in Irrigation and Drainage Spe-cialty Conference, Fort Collins, Colorado, April 22-24, 1973: New York, American Society of Civil Engineers, p. 403-422.
Helvey, J.D., Tiedemann, A.R., and Fowler, W.B., 1976, Some climatic and hydrologic effects of wildfire in Washington State, in Annual Proceedings of the Tall Timbers Fire Ecology Conference, October 16-17, 1974: Portland, Oregon, Proceedings no. 15, p. 201-222.
Hortness, J.E., and Driscoll, D.G., 1998, Streamflow losses in the Black Hills of western South Dakota: U.S. Geological Survey Water-Resources Investigations Report 98-4116, 99 p.
Jarrett, R.D., 1999, Geomorphic estimates of rainfall, floods, and sediment runoff—applied to the 1996 wildfire, Buffalo Creek, Colorado, in Abstracts with Programs, 1999 Geological Society of America Annual Meeting and Exposition, October 25-28, 1999, Denver, Colo-rado: Geological Society of America, v. 31, no. 7, p. A-313.
Johnson, B.N., 1933, A climatological review of the Black Hills: The Black Hills Engineer, Rapid City, South Dakota School of Mines and Technology, 71 p.
Key, C.H., and Benson, N.C., 2003, Landscape assessment sampling and analysis methods: Fire Effects Monitor-ing and Inventory Protocol (FIREMON), accessed October 22, 2003, at URL http://www.fire.org/firemon/LAv3_Methods.pdf
Linsley, R.K., Kohler, M.A., and Paulhus, J.L., 1982, Hydrol-ogy for engineers: New York, McGraw-Hill, 508 p.
Moody, J.A., and Martin, D.A., 2001, Post-fire, rainfall intensity-peak discharge relations for three mountain-ous watersheds in the western USA: Hydrological Processes, v. 15, p. 2981-2993.
National Oceanic and Atmospheric Administration, 1988, Climatological data for South Dakota, annual summary: Asheville, North Carolina, U.S. Department of Commerce (issued annually).
———1989, Climatological data for South Dakota, annual summary: Asheville, North Carolina, U.S. Department of Commerce (issued annually).
———1991, Climatological data for South Dakota, annual summary: Asheville, North Carolina, U.S. Depart-ment of Commerce (issued annually).
Parrett, Charles, 1987, Fire-related debris flows in the Beaver Creek drainage, Lewis and Clark County, Montana, in Subitzky, Seymour, ed., Selected papers in the hydrologic sciences, 1987: U.S. Geological Survey Water-Supply Paper 2330, p. 57-67.
Progulske, D.R., 1974, Yellow ore, yellow hair, yellow pine—A photographic survey of a century of forest ecology: Brooking, S. Dak., Agricultural Experiment Station, South Dakota State University, Bulletin 616, 169 p.
Rahn, P.H., and Gries, J.P., 1973, Large springs in the Black Hills, South Dakota and Wyoming: South Dakota Geological Survey Report of Investigations 107, 46 p.
Redden, J.A., and Lisenbee, A.L., 1996, Geologic setting, Black Hills, South Dakota in Paterson, C.J., and Kirch-ner, J.G., eds., Guidebook to the geology of the Black Hills, South Dakota: Rapid City, South Dakota, South Dakota School of Mines and Technology Bulletin No. 19, p. 1-8.
Robichaud, P.R., 2000, Fire effects on infiltration rates after prescribed fire in Northern Rocky Mountain forests, USA: Journal of Hydrology, v. 231-232, p. 220-229.
Simon, R.J., 1999, Observed channel response to wild-fire—Moose Creek, Idaho, in Olsen, D.S., and Poty-ondy, J.P., eds., Wildland hydrology: American Water Resources Association Technical Publication Series TPS, v. 99-3, p. 429-436.
South Dakota Department of Environment and Natural Resources, 1991, Post-fire evaluation of the Galena and Westberry Trails forest fires in the southern Black Hills (1988-1990): South Dakota Department of Environment and Natural Resources, Office of Water Resources Management, 51 p.
South Dakota State University, 2003, Normals statistics: accessed June 5, 2003, at URL http://cli-mate.sdstate.edu/data/normalsstats.htm
Strobel, M.L., Jarrell, G.J., Sawyer, J.F., Schleicher, J.R., and Fahrenbach, M.D., 1999, Distribution of hydro-geologic units in the Black Hills area, South Dakota: U.S. Geological Survey Hydrologic Investigations Atlas HA-743, 3 sheets, scale 1:100,000.
Taylor, M.J., Shay, J.M., and Hamlin, S.N., 1993, Changes in water-quality conditions in Lexington Reservoir, Santa Clara County, California, following a large fire in 1985 and flood in 1986: U.S. Geological Survey Water-Resources Investigations Report 92-4172, 23 p.
U.S. Forest Service, 1979, Effects of fire on water, a state-of-knowledge review: U.S. Department of Agricul-ture, Forest Service, General Technical Report WO-10, 28 p.
References 57

———1994, Appendix B, Historic and contemporary use and occupation of the Black Hills, in Proposed revised land and resource management plan, draft environmen-tal impact statement: 34 p.
U.S. Geological Survey, 1968-99, Water resources data for South Dakota, water years 1967-98: U.S. Geological Survey Water Data Reports SD-67-1 to SD-98-1 (pub-lished annually).
United States Water Resources Council, 1982, Guidelines for determining flood flow frequency: Hydrology Subcommittee, Bulletin 17B, appendices 1-14, 28 p.
Veenhuis, J.E., 2002, Effects of wildfire on the hydrology of Capulin and Rito de los Frijoles Canyons, Bandelier National Monument, New Mexico: U.S. Geological
58 Hydrologic Effects of the 1988 Galena Fire, Black Hills Area
Survey Water-Resources Investigations Report 02-4152, 39 p.
Walker, Ronald, Brundige, Gary, Hill, William, and Sparks, Richard, 1995, Custer State Park resource management plan, 1995-2010: Custer State Park, 255 p.
Weier, John, and Herring, David, 2001, Measuring vegeta-tion (NDVI and EVI): National Aeronautics and Space Administration, accessed October 20, 2003, at URL http:earthobservatory.nasa.gov/Library/ MeasuringVegetation/
Whitesides, D.H., 1989, Geomorphologic effects of the Galena Forest Fire in Custer State Park, South Dakota: Rapid City, South Dakota School of Mines and Technology, unpublished M.S. thesis, 96 p.
, South Dakota

SUPPLEMENTAL INFORMATION

-ft, acre-feet; --, no data]
Grace Coolidge near GL (06404998)
Flow Precip (inches)
YE(percent)acre-ft inches
-- -- -- --
-- -- -- --
-- -- -- --
-- -- -- --
-- -- -- --
-- -- -- --
-- -- -- --
-- -- -- --
-- -- -- --
-- -- -- --
-- -- -- --
-- -- -- --
-- -- -- --
-- -- -- --
-- -- -- --
7 918 0.64 19.02 3.38
8 4,040 2.83 21.80 12.97
3 3,140 2.20 20.05 10.96
7 852 0.60 15.82 3.77
2 2,760 1.93 18.12 10.66
3 2,990 2.09 24.27 8.62
8 1,800 1.26 15.67 8.04
2 2,990 2.09 22.13 9.45
1 588 .41 11.54 3.56
60
Hyd
rolo
gic E
ffects of th
e 1988 Galen
a Fire, B
lack Hills A
rea, So
uth
Dako
ta
Table 8. Annual flow and precipitation data for selected streamflow-gaging stations
[Precipitation data are for drainage area upstream of streamflow-gaging station. Precip, precipitation; YE, yield efficiency; ft3/s, cubic feet per second; acre
Wateryear
French Creek above Fairburn (06403300) Battle Creek near Keystone (06404000)
Flow Precip (inches)
YE(percent)
Flow Precip (inches)
YE(percent)ft3/s acre-ft inches ft3/s acre-ft inches ft3/s
1962 -- -- -- -- -- 14.2 10,250 3.29 29.09 11.30 --
1963 -- -- -- -- -- 15.0 10,830 3.47 27.00 12.86 --
1964 -- -- -- -- -- 7.90 5,730 1.84 19.05 9.64 --
1965 -- -- -- -- -- 19.5 14,100 4.52 30.98 14.59 --
1966 -- -- -- -- -- 3.79 2,740 .88 17.43 5.04 --
1967 -- -- -- -- -- 15.3 11,100 3.56 22.23 16.00 --
1968 -- -- -- -- -- 4.01 2,910 .93 19.49 4.79 --
1969 -- -- -- -- -- 5.80 4,200 1.35 20.23 6.65 --
1970 -- -- -- -- -- 6.83 4,940 1.58 21.69 7.30 --
1971 -- -- -- -- -- 15.8 11,420 3.66 26.91 13.60 --
1972 -- -- -- -- -- 21.1 15,310 4.91 24.65 19.91 --
1973 -- -- -- -- -- 8.61 6,230 2.00 18.60 10.73 --
1974 -- -- -- -- -- 1.65 1,190 .38 12.45 3.06 --
1975 -- -- -- -- -- 4.58 3,320 1.06 17.14 6.21 --
1976 -- -- -- -- -- 13.2 9,550 3.06 23.39 13.09 --
1977 -- -- -- -- -- 2.78 2,010 .64 18.25 3.53 1.2
1978 -- -- -- -- -- 11.9 8,590 2.75 21.75 12.66 5.5
1979 -- -- -- -- -- 6.00 4,350 1.39 21.22 6.57 4.3
1980 -- -- -- -- -- 2.48 1,800 .58 15.32 3.77 1.1
1981 -- -- -- -- -- 5.79 4,190 1.34 18.20 7.38 3.8
1982 -- -- -- -- -- 6.38 4,620 1.48 22.60 6.55 4.1
1983 7.55 5,470 0.98 17.36 5.63 3.98 2,880 .92 14.83 6.23 2.4
1984 10.1 7,340 1.31 22.76 5.76 8.64 6,280 2.01 21.87 9.20 4.1
1985 3.53 2,560 .46 12.48 3.66 1.11 803 .26 10.44 2.47 .8

2.03 1,470 1.03 25.02 4.11
3.49 2,520 1.76 16.67 10.58
.61 442 .31 13.19 2.34
1.40 1,020 .71 19.75 3.61
4.82 3,490 2.44 22.94 10.64
8.89 6,440 4.51 25.05 17.99
2.98 2,160 1.51 20.60 7.33
9.12 6,600 4.62 26.86 17.19
3.26 2,360 1.65 17.11 9.65
19.1 13,840 9.68 34.23 28.29
7.93 5,750 4.02 27.40 14.68
11.8 8,510 5.95 28.05 21.23
8.35 6,040 4.23 24.73 17.09
ond; acre-ft, acre-feet; --, no data]
Grace Coolidge near GL (06404998)
Flow Precip (inches)
YE(percent)ft3/s acre-ft inches
Su
pp
lemen
tal Info
rmatio
n - T
able 8
61
1986 3.97 2,870 0.51 23.63 2.17 5.05 3,660 1.17 24.26 4.84
1987 7.03 5,090 .91 16.05 5.66 6.84 4,950 1.59 16.60 9.55
1988 3.04 2,210 .39 13.79 2.86 .69 503 .16 13.13 1.23
1989 1.01 734 .13 18.09 .72 1.02 736 .24 19.36 1.22
1990 4.94 3,570 .64 21.50 2.97 8.32 6,020 1.93 23.38 8.25
1991 13.7 9,950 1.78 24.20 7.34 16.7 12,070 3.87 26.96 14.35
1992 4.57 3,310 .59 18.80 3.14 3.50 2,540 .81 19.03 4.28
1993 12.0 8,720 1.56 24.51 6.35 15.1 10,950 3.51 26.88 13.06
1994 7.06 5,110 .91 15.38 5.93 5.03 3,640 1.17 15.82 7.38
1995 34.7 25,110 4.48 30.63 14.64 27.7 20,050 6.43 33.34 19.28
1996 17.6 12,790 2.28 25.52 8.95 14.4 10,470 3.36 28.72 11.68
1997 24.7 17,900 3.20 26.60 12.02 23.7 17,180 5.51 29.92 18.40
1998 19.5 14,140 2.53 23.89 10.57 12.9 9,360 3.00 25.44 11.79
Table 8. Annual flow and precipitation data for selected streamflow-gaging stations–Continued
[Precipitation data are for drainage area upstream of streamflow-gaging station. Precip, precipitation; YE, yield efficiency; ft3/s, cubic feet per sec
Wateryear
French Creek above Fairburn (06403300) Battle Creek near Keystone (06404000)
Flow Precip (inches)
YE(percent)
Flow Precip (inches)
YE(percent)ft3/s acre-ft inches ft3/s acre-ft inches

Table 9. Peak discharges for selected dates for Grace Coolidge Creek and Bear Gulch
[ft3/s, cubic feet per second; (ft3/s)/mi2, cubic feet per second per square mile]
Date1
Grace Coolidge Creek near Hayward (06404800)
Bear Gulch near Hayward(06405800) Ratio of peak
discharge per unitarea of Bear Gulch toGrace Coolidge Creek
Maximum daily instantaneous
streamflow(ft3/s)
Peak dischargeper unit area[(ft3/s)/mi2]
Maximum daily instantaneous
streamflow(ft3/s)
Peak dischargeper unit area[(ft3/s)/mi2]
6/17/1989 0.4 0.1 10.0 2.4 41.1
6/25/1989 .6 .1 57.0 13.5 158
7/14/1989 .3 .0 49.0 11.6 333
7/17/1989 .2 .0 54.0 12.8 531
8/7/1989 .1 .0 20.0 4.7 589
8/14/1989 .1 .0 23.0 5.4 313
9/7-8/1989 .9 .1 1,250 296 2,480
9/21/1989 25.0 3.3 27.0 6.4 1.91
5/29/1990 168 22.5 111 26.2 1.17
6/6/1990 19.0 2.5 4.6 1.1 .43
6/16/1990 5.7 .8 19.0 4.5 5.89
7/7/1990 1.5 .2 46.0 10.9 54.2
7/15/1990 2.8 .4 53.0 12.5 33.5
7/20/1990 2.0 .3 54.0 12.8 47.7
4/26/1991 5.2 .7 38.0 9.0 12.9
5/12/1991 26.0 3.5 13.0 3.1 .88
5/18/1991 38.0 5.1 12.0 2.8 .56
5/22-23/1991 72.0 9.6 13.0 3.1 .32
5/28/1991 91.0 12.2 16.0 3.8 .31
6/1/1991 104 13.9 16.0 3.8 .27
6/3/1991 210 28.1 17.0 4.0 .14
6/21-22/1991 12.0 1.6 11.0 2.6 1.62
7/10-11/1991 25.0 3.3 48.0 11.3 3.40
6/21/1992 18.0 2.4 3.5 .8 .34
7/29/1992 11.0 1.5 2.8 .7 .45
5/6/1993 50.0 6.7 57.0 13.5 2.02
5/8/1993 37.0 4.9 71.0 16.8 3.39
6/4/1993 12.0 1.6 16.0 3.8 2.36
6/7/1993 141 18.9 115 27.2 1.44
6/17/1993 12.0 1.6 6.1 1.4 .90
7/17/1993 15.0 2.0 3.0 .7 .35
10/16/1994 22.0 2.9 1.5 .4 .12
5/8/1995 337 45.1 169 40.0 .89
5/13/1995 59.0 7.9 72.0 17.0 2.16
62 Hydrologic Effects of the 1988 Galena Fire, Black Hills Area, South Dakota

5/19/1995 26.0 3.5 33.0 7.8 2.24
5/26/1995 28.0 3.7 33.0 7.8 2.08
6/4/1995 35.0 4.7 4.2 1.0 .21
6/9/1995 77.0 10.3 19.0 4.5 .44
6/16/1995 19.0 2.5 15.0 3.5 1.40
6/21/1995 19.0 2.5 29.0 6.9 2.70
8/5/1995 1.8 .2 100 23.6 98.2
5/24/1996 13.0 1.7 16.0 3.8 2.18
5/27/1996 52.0 7.0 81.0 19.1 2.75
6/12/1996 18.0 2.4 12.0 2.8 1.18
7/31/1996 1.8 .2 12.0 2.8 11.8
8/15/1996 3.9 .5 42.0 9.9 19.0
8/29/1996 4.8 .6 14.0 3.3 5.16
10/29/1996 23.2 3.1 30.0 7.1 2.28
5/2-3/1997 15.4 2.1 18.7 4.4 2.14
5/25/1997 112 14.9 98.3 23.2 1.55
6/3/1997 17.6 2.3 15.9 3.8 1.60
7/21/1997 7.0 .9 14.4 3.4 3.64
7/29/1997 6.7 .9 12.8 3.0 3.35
7/31/1997 4.3 .6 13.0 3.1 5.38
5/21/1998 10.5 1.4 6.2 1.5 1.04
6/8/1998 9.4 1.3 12.6 3.0 2.36
6/18/1998 126 16.8 108 25.6 1.52
7/8/1998 16.1 2.2 14.0 3.3 1.53
8/11/1998 23.7 3.2 2.7 .6 .20
8/21/1998 10.5 1.4 2.6 .6 .43
Mean 1989 3.4 .5 186 44.0 556
Median 1989 .3 .0 38.0 9.0 323
Mean 1990 33.2 4.4 47.9 11.3 23.8
Median 1990 4.3 .6 49.5 11.7 19.7
Mean 1991-98 43.0 5.7 31.7 7.5 4.6
Median 1991-98 19.0 2.5 15.9 3.8 1.6
1Selected dates are those when peak discharge for either station equalled or exceeded 10 ft3/s. For consecutive days with discharges exceeding 10 ft3/s, the day with the largest discharge was used.
Table 9. Peak discharges for selected dates for Grace Coolidge Creek and Bear Gulch–Continued
[ft3/s, cubic feet per second; (ft3/s)/mi2, cubic feet per second per square mile]
Date1
Grace Coolidge Creek near Hayward (06404800)
Bear Gulch near Hayward(06405800) Ratio of peak
discharge per unitarea of Bear Gulch toGrace Coolidge Creek
Maximum daily instantaneous
streamflow(ft3/s)
Peak dischargeper unit area[(ft3/s)/mi2]
Maximum daily instantaneous
streamflow(ft3/s)
Peak dischargeper unit area[(ft3/s)/mi2]
Supplemental Information - Table 9 63

Creekrd)
Grace Coolidge Creek near Game Lodge, near Custer
(06404998)
eak flow(ft3/s)
Date2 Peak flow(ft3/s)
-- 06/12/1967 151
-- 06/09/1968 29
-- 07/05/1969 52
-- 08/06/1970 196
-- 05/21/1971 109
-- 06/10/1972 709
-- 04/20/1973 46
-- 10/13/1974 6.0
-- 06/19/1975 83
-- 06/15/1976 980
-- 07/27/1977 63
-- 05/18/1978 102
-- 07/04/1979 226
-- 10/11/1980 15
-- 05/18/1981 370
-- 06/03/1982 41
-- 05/07/1983 16
-- 05/10/1984 41
-- 10/05/1985 2.3
-- 06/10/1986 22
-- 03/21/1987 102
-- 08/03/1988 621
25 09/07/1989 1,030
64
Hyd
rolo
gic E
ffects of th
e 1988 Galen
a Fire, B
lack Hills A
rea, So
uth
Dako
ta
Table 10. Annual peak flows for selected streamflow-gaging stations, water years 1967-98
[ft3/s, cubic feet per second; --, no data]
Water year
Beaver Creek near Buffalo Gap (06402500)
French Creek above Fairburn (06403300)
Battle Creek near Keystone (06404000)
Grace Coolidgenear Haywa
(06404800
DatePeak flow
(ft3/s)Date
Peak flow(ft3/s)
DatePeak flow
(ft3/s)Date
P
1967 06/23/1967 109 -- -- 06/15/1967 1533 --
1968 06/07/1968 111 -- -- 06/25/1968 1103 --
1969 07/17/1969 340 -- -- 07/17/1969 1551 --
1970 03/10/1970 15 -- -- 06/12/1970 1680 --
1971 05/04/1971 340 -- -- 06/01/1971 1429 --
1972 06/10/1972 829 -- -- 06/09/1972 126,200 --
1973 03/14/1973 13 -- -- 04/19/1973 737 --
1974 04/11/1974 16 -- -- 07/19/1974 35 --
1975 07/24/1975 861 -- -- 07/19/1975 239 --
1976 07/31/1976 660 -- -- 06/15/1976 1,260 --
1977 05/05/1977 16 -- -- 04/12/1977 27 --
1978 03/10/1978 157 -- -- 05/18/1978 230 --
1979 07/23/1979 192 -- -- 07/04/1979 409 --
1980 10/29/1980 15 -- -- 06/17/1980 21 --
1981 10/20/1981 14 -- -- 05/17/1981 763 --
1982 05/20/1982 19 06/24/1982 194 06/04/1982 101 --
1983 12/09/1983 12 05/05/1983 50 05/07/1983 80 --
1984 06/14/1984 21 07/15/1984 166 06/11/1984 327 --
1985 12/04/1985 13 09/12/1985 23 03/18/1985 34 --
1986 04/26/1986 31 06/10/1986 41 05/09/1986 105 --
1987 05/27/1987 56 03/07/1987 329 10/03/1987 75 --
1988 01/12/1988 19 07/16/1988 53 06/23/1988 9.2 --
1989 01/22/1989 18 08/14/1989 4.6 09/21/1989 166 09/21/1989

168 05/30/1990 442
210 06/03/1991 254
18 06/22/1992 15
141 06/07/1993 298
3.1 10/14/1994 19
337 05/08/1995 765
52 05/27/1996 140
112 05/25/1997 236
126 06/18/1998 162
olidge Creek Hayward404800)
Grace Coolidge Creek near Game Lodge, near Custer
(06404998)
Peak flow(ft3/s)
Date2 Peak flow(ft3/s)
Su
pp
lemen
tal Info
rmatio
n - T
able 10
65
1990 06/21/1990 12 05/30/1990 141 05/30/1990 473 05/29/1990
1991 06/03/1991 97 06/04/1991 304 06/05/1991 620 06/03/1991
1992 09/08/1992 23 06/22/1992 32 06/22/1992 37 06/21/1992
1993 08/20/1993 49 06/08/1993 266 06/07/1993 1,250 06/07/1993
1994 11/25/1994 17 03/03/1994 110 05/14/1994 35 05/13/1994
1995 07/03/1995 203 05/08/1995 1,060 05/08/1995 1,690 05/08/1995
1996 10/02/1996 14 05/28/1996 162 05/27/1996 595 05/27/1996
1997 07/29/1997 216 05/25/1997 239 05/25/1997 854 05/25/1997
1998 07/25/1998 43 06/19/1998 323 06/18/1998 1,520 06/18/1998
Table 10. Annual peak flows for selected streamflow-gaging stations, water years 1967-98–Continued
[ft3/s, cubic feet per second; --, no data]
Water year
Beaver Creek near Buffalo Gap (06402500)
French Creek above Fairburn (06403300)
Battle Creek near Keystone (06404000)
Grace Conear
(06
DatePeak flow
(ft3/s)Date
Peak flow(ft3/s)
DatePeak flow
(ft3/s)Date
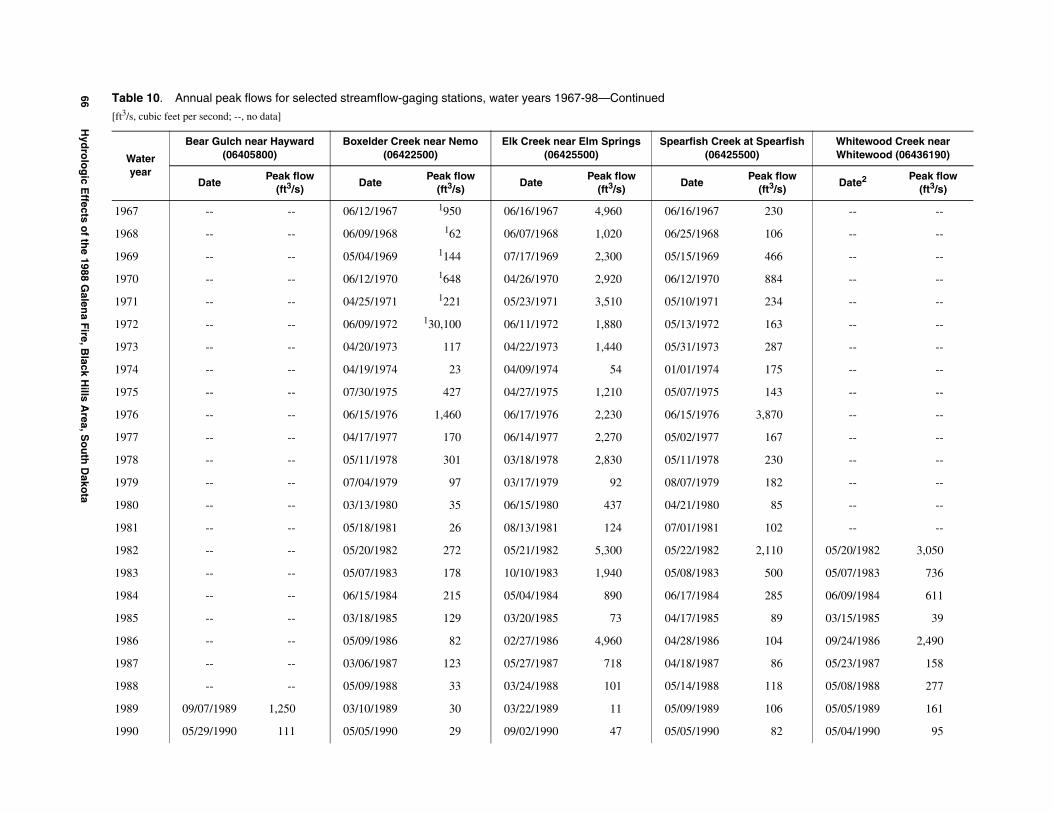
arfish Whitewood Creek nearWhitewood (06436190)
flow/s)
Date2 Peak flow(ft3/s)
0 -- --
6 -- --
6 -- --
4 -- --
4 -- --
3 -- --
7 -- --
5 -- --
3 -- --
0 -- --
7 -- --
0 -- --
2 -- --
5 -- --
2 -- --
0 05/20/1982 3,050
0 05/07/1983 736
5 06/09/1984 611
9 03/15/1985 39
4 09/24/1986 2,490
6 05/23/1987 158
8 05/08/1988 277
6 05/05/1989 161
2 05/04/1990 95
66
Hyd
rolo
gic E
ffects of th
e 1988 Galen
a Fire, B
lack Hills A
rea, So
uth
Dako
ta
Table 10. Annual peak flows for selected streamflow-gaging stations, water years 1967-98—Continued
[ft3/s, cubic feet per second; --, no data]
Water year
Bear Gulch near Hayward (06405800)
Boxelder Creek near Nemo (06422500)
Elk Creek near Elm Springs (06425500)
Spearfish Creek at Spe(06425500)
DatePeak flow
(ft3/s)Date
Peak flow(ft3/s)
DatePeak flow
(ft3/s)Date
Peak (ft3
1967 -- -- 06/12/1967 1950 06/16/1967 4,960 06/16/1967 23
1968 -- -- 06/09/1968 162 06/07/1968 1,020 06/25/1968 10
1969 -- -- 05/04/1969 1144 07/17/1969 2,300 05/15/1969 46
1970 -- -- 06/12/1970 1648 04/26/1970 2,920 06/12/1970 88
1971 -- -- 04/25/1971 1221 05/23/1971 3,510 05/10/1971 23
1972 -- -- 06/09/1972 130,100 06/11/1972 1,880 05/13/1972 16
1973 -- -- 04/20/1973 117 04/22/1973 1,440 05/31/1973 28
1974 -- -- 04/19/1974 23 04/09/1974 54 01/01/1974 17
1975 -- -- 07/30/1975 427 04/27/1975 1,210 05/07/1975 14
1976 -- -- 06/15/1976 1,460 06/17/1976 2,230 06/15/1976 3,87
1977 -- -- 04/17/1977 170 06/14/1977 2,270 05/02/1977 16
1978 -- -- 05/11/1978 301 03/18/1978 2,830 05/11/1978 23
1979 -- -- 07/04/1979 97 03/17/1979 92 08/07/1979 18
1980 -- -- 03/13/1980 35 06/15/1980 437 04/21/1980 8
1981 -- -- 05/18/1981 26 08/13/1981 124 07/01/1981 10
1982 -- -- 05/20/1982 272 05/21/1982 5,300 05/22/1982 2,11
1983 -- -- 05/07/1983 178 10/10/1983 1,940 05/08/1983 50
1984 -- -- 06/15/1984 215 05/04/1984 890 06/17/1984 28
1985 -- -- 03/18/1985 129 03/20/1985 73 04/17/1985 8
1986 -- -- 05/09/1986 82 02/27/1986 4,960 04/28/1986 10
1987 -- -- 03/06/1987 123 05/27/1987 718 04/18/1987 8
1988 -- -- 05/09/1988 33 03/24/1988 101 05/14/1988 11
1989 09/07/1989 1,250 03/10/1989 30 03/22/1989 11 05/09/1989 10
1990 05/29/1990 111 05/05/1990 29 09/02/1990 47 05/05/1990 8

106 06/05/1991 1,030
70 06/14/1992 172
100 05/05/1993 1,050
175 04/23/1994 261
1,900 05/08/1995 3,930
204 05/27/1996 718
322 07/24/1997 473
899 06/18/1998 2,380
massive storm that occurred during 1972 and resulted in
k at Spearfish 5500)
Whitewood Creek nearWhitewood (06436190)
Peak flow(ft3/s)
Date2 Peak flow(ft3/s)
Su
pp
lemen
tal Info
rmatio
n - T
able 10
67
1991 07/10/1991 48 06/06/1991 401 05/28/1991 620 05/22/1991
1992 07/13/1992 4.0 06/13/1992 53 06/21/1992 27 04/29/1992
1993 06/07/1993 115 06/07/1993 293 05/08/1993 3,660 06/08/1993
1994 10/14/1994 6.1 05/06/1994 125 06/08/1994 5,570 04/25/1994
1995 05/08/1995 169 05/09/1995 1,140 05/10/1995 4,580 05/08/1995
1996 05/27/1996 81 05/30/1996 826 05/28/1996 7,660 05/30/1996
1997 05/25/1997 98 06/02/1997 463 02/18/1997 3,000 05/08/1997
1998 06/18/1998 108 06/18/1998 607 06/19/1998 592 06/18/1998
1Records for water years 1967-72 are excluded from peak-flow analyses for Battle Creek and Boxelder Creek because of the influence of a a flood peak with a recurrence interval in excess of 100 years.
2Peaks for water years 1967-76 are for station 06405000, which was located just downstream.
Table 10. Annual peak flows for selected streamflow-gaging stations, water years 1967-98—Continued
[ft3/s, cubic feet per second; --, no data]
Water year
Bear Gulch near Hayward (06405800)
Boxelder Creek near Nemo (06422500)
Elk Creek near Elm Springs (06425500)
Spearfish Cree(0642
DatePeak flow
(ft3/s)Date
Peak flow(ft3/s)
DatePeak flow
(ft3/s)Date