hydrological modelling with swat - btu
TRANSCRIPT

1
Hydrological Modelling with SWAT
1
Step-by-Step tutorial
The hydrological model for Robit Watershed
Qianwen He, Nov. 2020

Follow the step by step tutorial to set up a hydrological model with the given dataset. After the practice, you need to understand:
• What are the required input data?
• What is the modeling procedure?
• What results can be obtained from the model?
Task Description
2

• Software installation
• Input data description
• Settings
• SWAT model setup
• SWAT model run
• SWAT model result visualization
Content
3

Software Installation
• Prerequisite
oMicrosoft Windows XP to 10(No Mac OS)
oMicrosoft Access (the interface to use Access database)
Please download from https://www.b-tu.de/it-services/basisdienste/software/lizenzvertraege/microsoft-software/ees-campus-vertrag(Download Keys(separate Datei) und Software)
Microsoft .NET Framework 3.5
• Software to install
oQGIS
o SWATEditor
oQSWAT
4

• Installation:o Step1: go to:
http://swat.tamu.edu/software/qswat/
o Step2: Install QGIS from the same webpage
o Step3: Install SWATEditor
o Step4: Install QSWAT
Software Installation
5

• Time and Date format modification
Control panel Clock, Language and Region Change data, time or number formats
This is to ensure the weather input data can be readable by the software
Settings
6

• Step1: Launch QGIS Desktop 3.x
• Step2: go to “Manage and Install Plugins” and find “QSWAT” and “install plugin”
• SWAT icon will appear on the toolbar
Install SWAT in QGIS
7

• http://swat.tamu.edu/software/qswat/
o QSWAT3 user manual
o Discussion group: user group
References
8

1. Watershed delineation (dem)o Define the region of the basin/catchment
o Delineate the basin in order to obtain the subbasins/watersheds
o Define the location of the outlet, point source,…
2. HRU analysis (landuse, soil type, slope)o Add land use, soil type data and link the attributes to SWAT database
o Choose the combination of landuse, soil type and slope in order to obtain the suitable HRUs
3. Write Input tables (weather data, management strategy,…)o Weather data as the driving force of the model
o Other input data are also considered if obtained
SWAT Modelling Overview
9

Example Data Set: Robit Watershed, Lake Tana Basin, Ethiopia
https://drive.google.com/drive/folders/1FFz2-lSUtgW9kDh-zaW2vMBWvbsBQL7q?usp=sharing
10
Remark
Climeate input, with measuring sites and time series
Location of the outlet
Observed discharge at basin outlet (m3/s)
Stream .shp
Landuse look up table, with corresponding SWAT Landuse Code
Soil look up table, with corresponding data to link the usersoil.xlsx
Soil database, to update the database
Weather statistics for weather generator
Input Data Overview

• Step 1. Create a new project
• Step 2. Copy the input data set to the project folder
• Step 3. Modify tables in the database
SWAT Project Setup
11
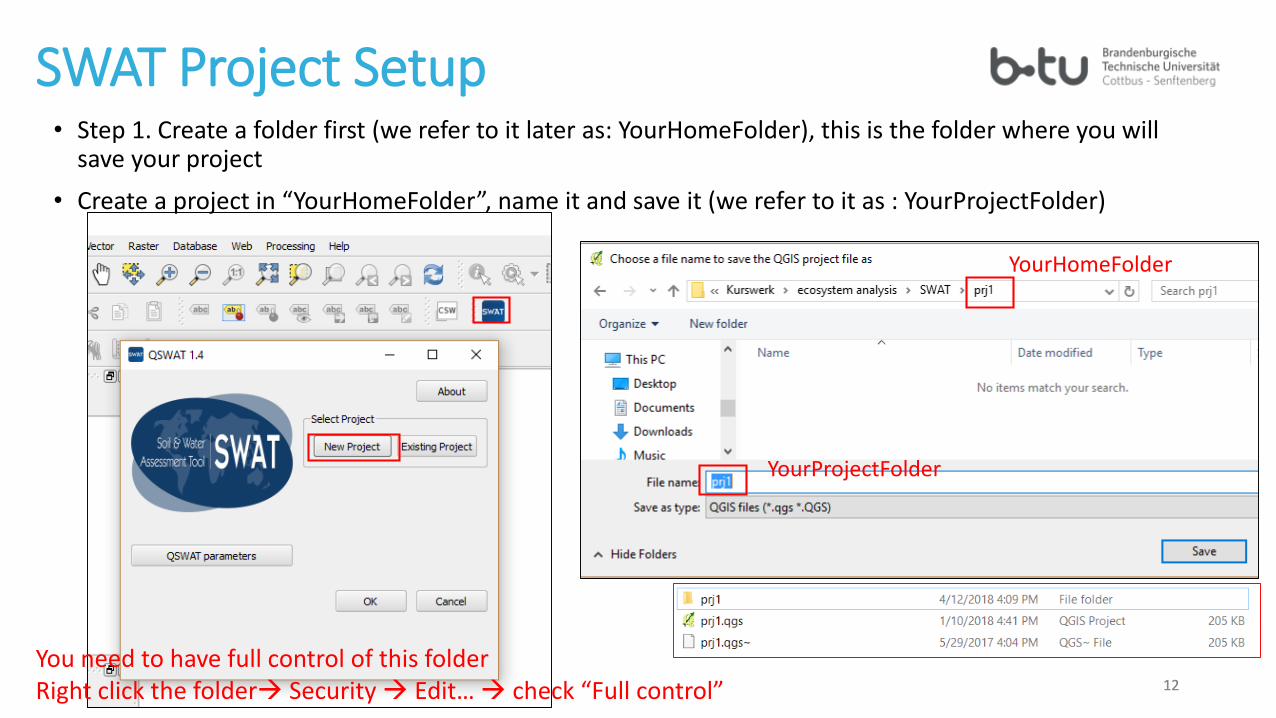
SWAT Project Setup
You need to have full control of this folderRight click the folder Security Edit… check “Full control” 12
• Step 1. Create a folder first (we refer to it later as: YourHomeFolder), this is the folder where you will save your project
• Create a project in “YourHomeFolder”, name it and save it (we refer to it as : YourProjectFolder)
12
YourHomeFolder
YourProjectFolder

SWAT Project Setup
• When the project is successfully created, the SWAT window will popup again and new features appear
13

• Step 2. Copy the input dataset to “YourHomeFolder”
o The input dataset were prepared and should be downloaded (page 10)
oCopy folder ”ExampleDataset” to YourHomeFolder(created in step1)
SWAT Project Setup
14

• Step 3. Modify tables in the databaseoAfter creating the project, two database(.mdb) were generated in
“YourProjectFolder”
• YourProjectName.mdb (e.g. prj1.mdb)
This is the database to store the data created
during your modelling process
• QSWATRef2012.mdb
This is the database stored the default parameters
sets that SWAT predefined
SWAT Project Setup
15
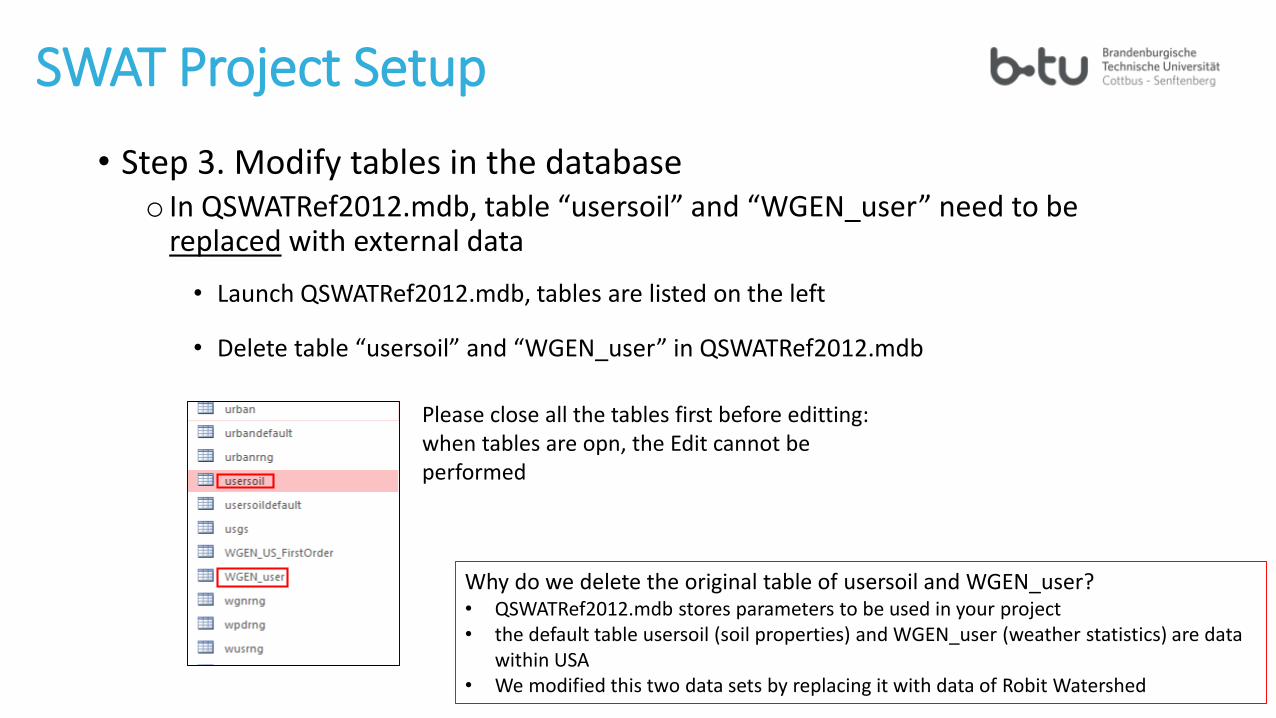
• Step 3. Modify tables in the databaseo In QSWATRef2012.mdb, table “usersoil” and “WGEN_user” need to be
replaced with external data
• Launch QSWATRef2012.mdb, tables are listed on the left
• Delete table “usersoil” and “WGEN_user” in QSWATRef2012.mdb
SWAT Project Setup
Please close all the tables first before editting: when tables are opn, the Edit cannot be performed
Why do we delete the original table of usersoil and WGEN_user?• QSWATRef2012.mdb stores parameters to be used in your project• the default table usersoil (soil properties) and WGEN_user (weather statistics) are data
within USA• We modified this two data sets by replacing it with data of Robit Watershed
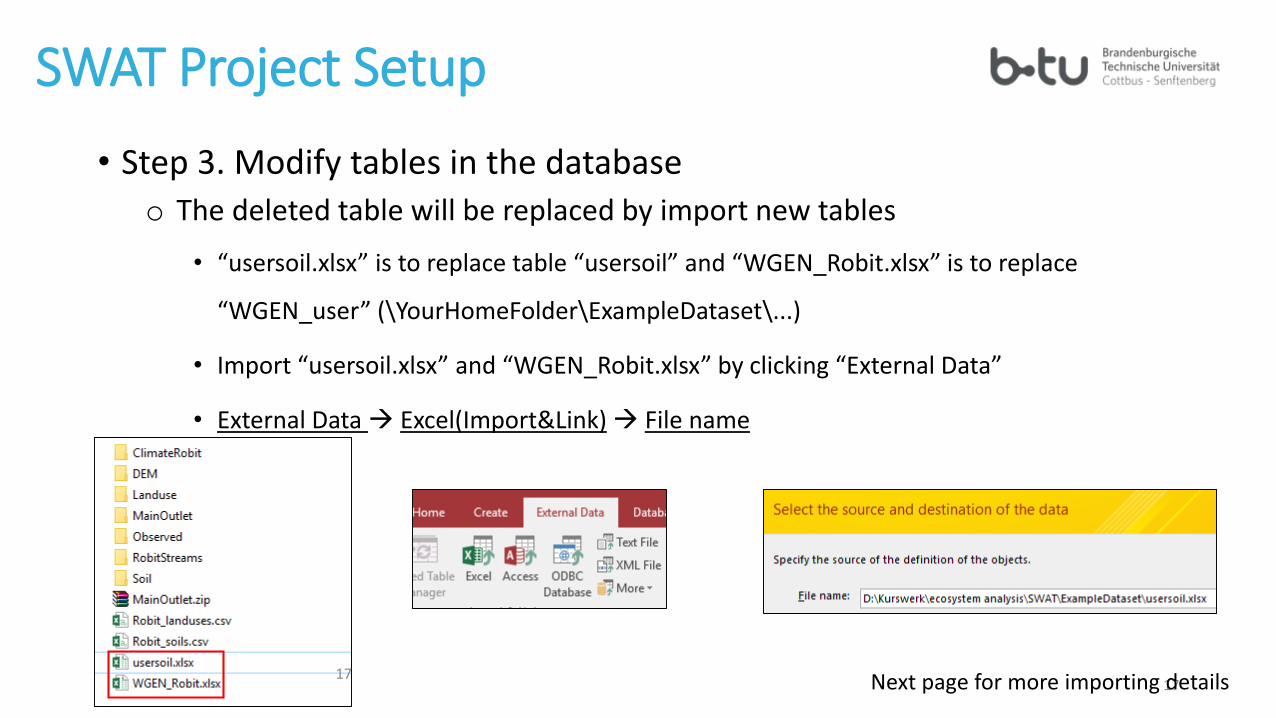
• Step 3. Modify tables in the databaseo The deleted table will be replaced by import new tables
• “usersoil.xlsx” is to replace table “usersoil” and “WGEN_Robit.xlsx” is to replace
“WGEN_user” (\YourHomeFolder\ExampleDataset\...)
• Import “usersoil.xlsx” and “WGEN_Robit.xlsx” by clicking “External Data”
• External Data Excel(Import&Link) File name
SWAT Project Setup
1717 Next page for more importing details

1 2 3
4 5 6
Select “No primary Key”
Name it as “usersoil”
• Table “WGEN_user” should be deleted, then import “WGEN_Robit.xlsx” with the same procedure and name it as “WGEN_user”
18

• Step 4. Watershed delineation
• Step 5. HRU Analysis
• Step 6. Edit input tables
SWAT Model Setup
19
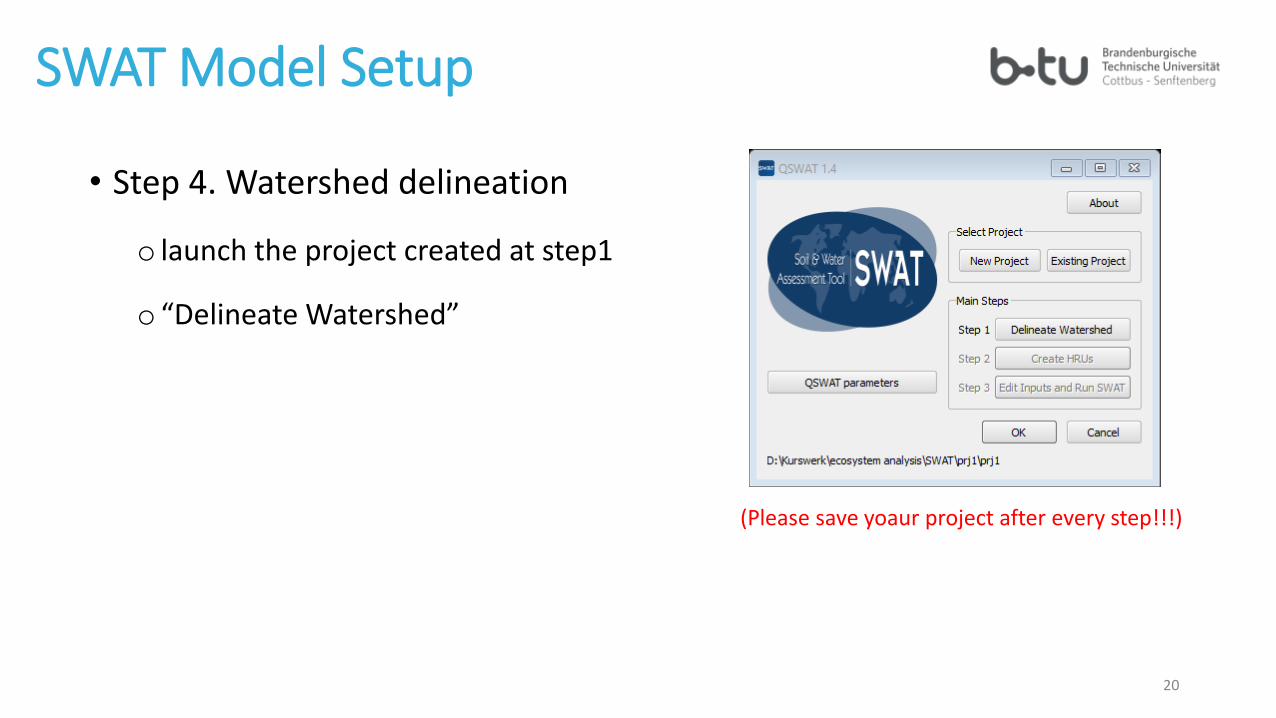
• Step 4. Watershed delineation
o launch the project created at step1
o “Delineate Watershed”
SWAT Model Setup
20
(Please save yoaur project after every step!!!)

SWAT Model Setup• Step 4. Watershed delineation
o Import DEM: “YourHomeFolder\ExampleDataset\DEM\srtm_30m\hdr.adf”
21
If your extention (.adf) is not shown, please google „how to display the file extention in Win7/8/10?“

SWAT Model Setup• Step 4. Watershed delineation
oBurn in existing stream network“\YourHomeFolder\ExampleDataset\RobitStreams\robReach.shp”
22

SWAT Model Setup• Step 4. Watershed delineation
oCreate streams
123
• Stream are created based on the digital elevation model and the burned in stream network
• In “Define threshold”, number of cells or area is to determine the density of the river network. When a cell has more than 1000 cells draining into it, this cell can be defined as part of a stream. (the less the cells/area are set, the more dense the stream network is) For now, please choose the value shown in the picture.
23

SWAT Model Setup• Step 4. Watershed delineation
o Insert a outlet : the outlet location is given in ExampleDataset“\YourHomeFolder\ExampleDataset\MainOutlet\MainOutlet.shp”
A outlet is displayed and then snapped by the river network
2
1
24

SWAT Model Setup• Step 4. Watershed delineation
oCreate watershed
• Robit Watershed is now divided into 9 sub-watersheds.• If the stream network is denser, more sub-watershed will
be generated.• Area: approx. 17 sq.km
25

SWAT Model Setup• Step 5. HRU analysis
o Import landuse and soil data, and generate the HRUs
• SWAT window Create HRUs (the button will only turned to black after completing “Delineate Watershed”)
26

SWAT Model Setup• Step 5. HRU analysis
o Import landuse map and soil map“\YourHomeFolder\ExampleDataset\Landuse\roblandusenew\hdr.adf”
o Import soil map“\YourHomeFolder\ExampleDataset\Soil\mowr_soil90\hdr.adf”
27

SWAT Model Setup• Step 5. HRU analysis
o Import landuse and soil lookup table• Landuse table Use csv file
• Soil table Use csv file
o After “Read”, “choose landuse/soil lookup csv file” pop up
o Select “Robit_landuses.csv” and “Robit_soils.csv” respectively
28

SWAT Model Setup• Step 5. HRU analysis
o landuse and soil lookup table
• The lookup tables have the attribute that can be linked to tables stored in QSWATRef2012.mdb. Those
tables contain parameters and the model will use the parameters for simulation
• The usersoil table has been replaced with the usersoil.xlsx in ExampleDataset. usersoil.xlsx contains the
soil property of the Robit watershed and the original usersoil table did not have those information
Robit_landuse.xlsx
QSWATRef2012.mdb, table “crop”
parameters
29

SWAT Model Setup• Step 5. HRU analysis
o Set landuse, soil and slope thresholds
Select “Read from maps”
Check “Generate FullHRUs shapefile” (if you are not
able to check it, please click “Read” again)
Insert “10”
Select “Filter by landuse, soil, slope”
Insert “Landuse(%)” with 10 “Go”
Insert “Soil(%)” with 5 “Go”
“Create HRUs”
30
Hint: If “Set bands for slope(%)” panel is grey and slope value 10 cannot be inserted, please cancel this window and go back to “Delineate Watershed” window again, click “OK” at the bottom, and redo “Step5. HRU analysis”

SWAT Model Setup• Step 5. HRU analysis
o HRUs are the combination of a certain landuse, soil and slope, when the three of them are overlayed
o The threshold of the landuse, soil and slope can be user-defined
• Dominant landuse, soil, slope/dominant HRU indicate only one HRU to be created within one sub-watershed
• ”Filter by landuse, soil, slope” to determine the
combination(e.g. 10% of landuses means in each sub-
watershed, only landuses larger than 10% will be considered
for HRUs and the other landuses are neglected)
• “Set bands for slope(%)” is to category the slope range
• “Generate FullHRUs shapefile” is to generate the HRU map
when Landuse is 0% , soil is 0% and slope is also 0%
31

SWAT Model Setup• Step 5. HRU analysis
oRead reports• Click “Select report to view”
Elevation
Landuse and soil
HRUs
32
The watershed delineation results and the HRU generated are listed in those tables
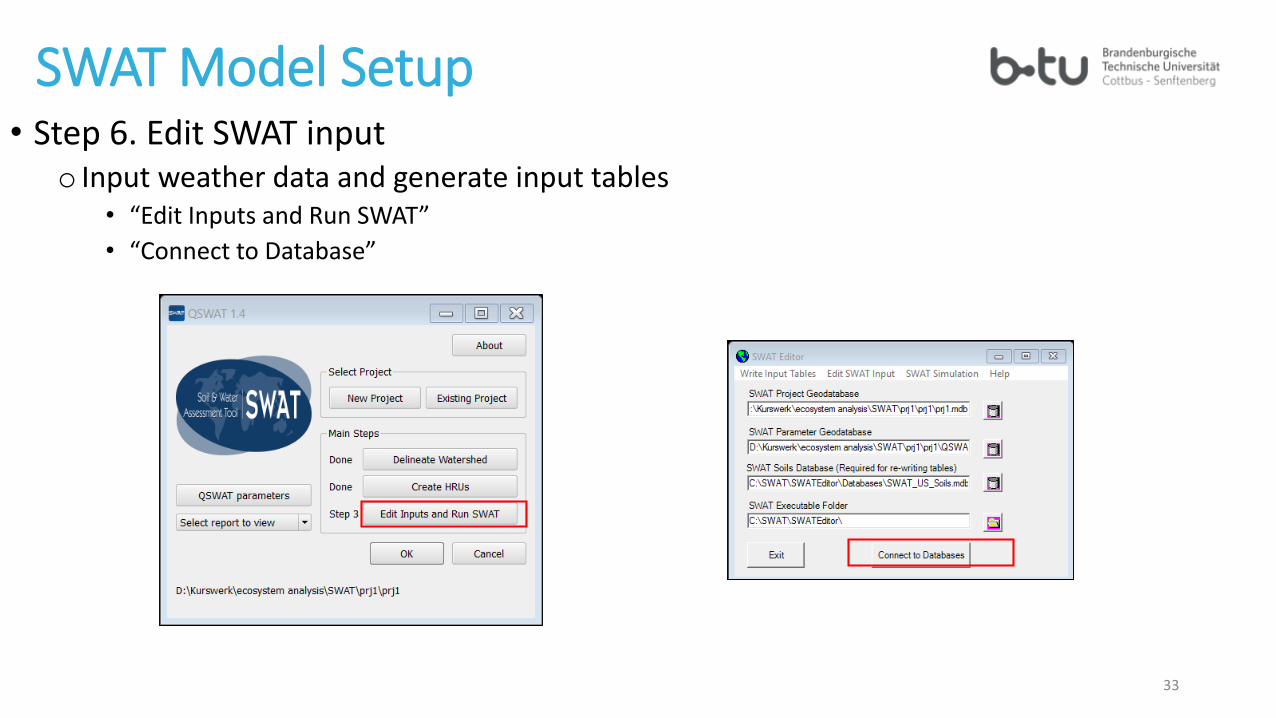
SWAT Model Setup• Step 6. Edit SWAT input
o Input weather data and generate input tables• “Edit Inputs and Run SWAT”
• “Connect to Database”
33

SWAT Model Setup• Step 6. Edit SWAT input
o “Write Input Tables” “weather stations”
Weather data list:“\YourHomeFolder\ExampleDataset\ClimateRobit\”
o The location of weather station• pcpRobStation.txt• rhumRobStation.txt• windRobStation.txt• tmpRobstations.txt
o Time series of the measured weather data• robpcp.txt• robrhum.txt• robwind.txt• robsol.txxt
34

SWAT Model Setup• Step 6. Edit SWAT input
o “Write Input Tables” “weather stations”
This is the table user_WGEN and we have replaced the original one with WGEN_Robit.xlsx.
35

SWAT Model Setup• Step 6. Edit SWAT input
o “Write Input Tables” “weather stations”• Insert “location of weather station” file(.txt) accordingly
36

SWAT Model Setup• Step 6. Edit SWAT input
o “Write Input Tables” “Write SWAT Input Tables”• All the tables needed for the simulated will be created in the yourProjectName.mdb
37

SWAT Model Run• Step 7. Run SWAT
o “SWAT simulation” “Run SWAT”• Period of simulation can be set for any period
within the time range of the input weather data
• NYSKIP should be set to 2~5 years as a warm up period for the model
• First ”Setup SWAT run” and then “Run SWAT”
38
Hints: if you have warnings related to .sol file error, please go to “Edit SWAT Input” (see slide 28), and “rewrite input tables”, select “sol”, click rewrite. Then redo “Step 7. Run SWAT”

SWAT Model Run• Step 7. Run SWAT
o “SWAT simulation” “Read SWAT Output”• Select ”output.rch”, “output.sub”, “output.hru”
• Then, ”Import Files to Database”
• Save SWAT Simulation with a name (e.g. sim1)
39

• Static data
o A single summary value
o A .shp file is created
• Animation
o Visualize the time series with the spatial variation
• Plot
o Compare with observed data
o Compare between channels
SWAT Result Visualization
40

• Static data• Example: Annual mean ET (evapotranspiration) at each subbasin
SWAT Result Visualization
41

SWAT Result Visualization• Animation
• Example: Annual mean ET (evapotranspiration) at each subbasin
42

SWAT Result Visualization• Compare with observed discharge
“\YourHomeFolder\ExampleDataset\Observed\observedFLOW.csv”
Should be the same period with the observed discharge
43

SWAT Result Visualization• Compare with observed discharge
44

45
SWAT Result Database“\YourHomeFolder\YourProjectFolder\Scenarios\YourSimulationName\TablesOut\SWATOutput.mdb”

46
SWAT Result Database“\YourHomeFolder\YourProjectFolder\Scenarios\YourSimulationName\TablesOut\SWATOutput.mdb”
These three tables were the simulation results, for hru or rch or subbasin.
The list of table here is the corresponding table to each simulation results table and explain the meaning of each field.e.g. tblHruDef hru

47
SWAT Application• Fertilizer manufactory at sub basin 6Daily discharge: 2400m3/dayDaily ammonia nitrogen release: 0.72t/day
1. Step 3 “Edit Inputs and Run SWAT”2. “SWAT Editor” window “Connect to Database”3. “Edit SWAT Input” “Point Source Discharges”4. “Select Point Source” 65. Modify the point source Flow and NH36. “Save Edits” and “Exit” 7. “Edit SWAT Input” again Re-write SWAT Input
files8. Select “point source/inlet” Write Files then
“Cancel” to exit the window9. “SWAT Simulation” “Run SWAT” check
“Print Water Quality Output”10. Read SWAT output and save the simulation11. Data visualization: have a look of variables
“NH4_OUTkg” and “TOT_kg” in rch