hydrological summary - nrfa.ceh.ac.uknrfa.ceh.ac.uk/sites/default/files/hs_201803.pdf ·...
TRANSCRIPT

Hydrological Summary for the United Kingdom
Ma
rch
20
18
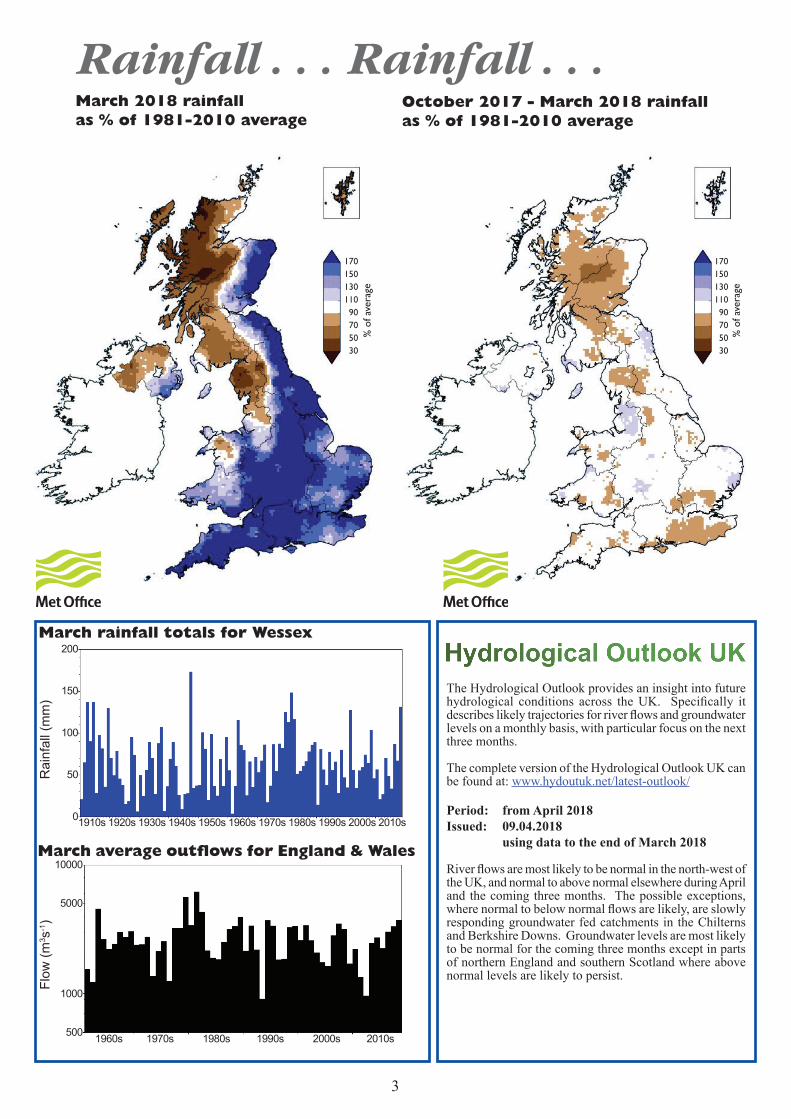
GeneralMarch heralded an unusually wintry and remarkably cold start to spring 2018. Spells of mild and wet weather were interrupted by two periods of snow, ice and blizzard conditions that brought widespread disruption. Across the UK, monthly mean temperatures generally registered more than 1.5°C below average. A minimum temperature of -10.7°C was recorded at Cawdor Castle (Nairnshire) on the 1st. In contrast with the very dry February, March rainfall for the UK was notably above average, exceptionally so in southern England and the Midlands which received almost twice the average. In contrast, north-west England and western Scotland received less than 75% of the average. River flows were generally above normal with exceptionally high flows recorded in south-west England and south-east Scotland. Conversely, some catchments in western Scotland and Northern Ireland registered around half of the average. Reservoir stocks were above average in all but a few northern impoundments and many in the south continued to recover from the unseasonably low stocks recorded at the beginning of the year (e.g. Bewl was at full capacity by the end of March). Seasonal recovery of groundwater levels continued at most sites and levels were generally in the normal range or higher, apart from in the slower responding Chalk of south-east England. Overall, wet weather late in the recharge season has significantly improved the outlook for the remainder of spring and summer 2018. In localised parts of the Chalk aquifer (e.g. the Chilterns) low groundwater levels and river flows may persist, although current low flows and levels are not exceptional. RainfallAn exceptionally cold easterly airflow, which began in late February, continued into early March and brought widespread snow, ice and freezing rain as UK transport networks were severely affected and thousands of schools closed. A deep low-pressure system reached south-west England on the 1st bringing snow showers and a red weather warning was issued for wind and snow in Wales and south-west England. Exceptional snow depths of 55cm in St Athan (South Glamorgan) on the 3rd and 57cm in Little Rissington (Gloucestershire) on the 4th were recorded and significant snow drifts on higher ground were reported (up to 3m on Exmoor). As temperatures rose, homes in Wales, southern England, the Midlands and Scotland faced water supply problems; at its peak over 20,000 homes in London were left without water. Low pressure systems dominated mid-month; 70.6mm was recorded at Trassey Slievenaman (County Down) on the 14th. An easterly airflow returned on the 17th, bringing snow and ice once again, albeit less severe than at the start of the month. After a brief dry spell, unsettled weather returned for the remainder of the month. For March overall, most regions in England received over 150% of average rainfall, with South West England and Wessex receiving over 190%, ranking as the fifth wettest March on record (both in series from 1910). In contrast, Scotland and North West England received less than 75% of average. For the winter half-year (October-March), the UK received marginally below average rainfall with areas of central Scotland receiving less than 70% of the long-term average.
River flowsFlows generally started the month below average and in some cases remained low during the first week of the month approaching the daily minima (e.g. the Nevis). Elsewhere, unsettled conditions led to increased flows; 15 Flood Warnings were issued in south-west England and property flooding was reported in Penzance on the 2nd due to high river levels and high tides and new daily flow maxima were recorded in eastern Scotland (e.g. the Whiteadder on the 6th). The slow thaw meant that, for the most part, rivers were capable of absorbing snow melt and by mid-month flows were largely in recession. River flows increased towards month-end across the UK in response to heavy rainfall and new daily flow maxima were recorded across the country. For March, monthly mean flows were
generally above normal and the March outflows from England & Wales were amongst the highest in the last 35 years (in a series from 1961). Flows in south-west England were notably high or exceptional, with the highest March average flows recorded on the Tone, Exe and Warleggan (in records greater than 45 years). In contrast, flows in some catchments in Northern Ireland and western Scotland were below normal; the Ewe, Carron, Ness and Nevis all registered less than half of the March average. For the winter half-year (October-March), flows were generally within the normal range, with above normal flows recorded in south-west England, south Wales, northern England and Northern Ireland and notably high flows for the Ribble and Bush. Below normal flows were registered in northern Scotland, notably so on the Scottish Dee, and in some groundwater influenced catchments of south-east England.
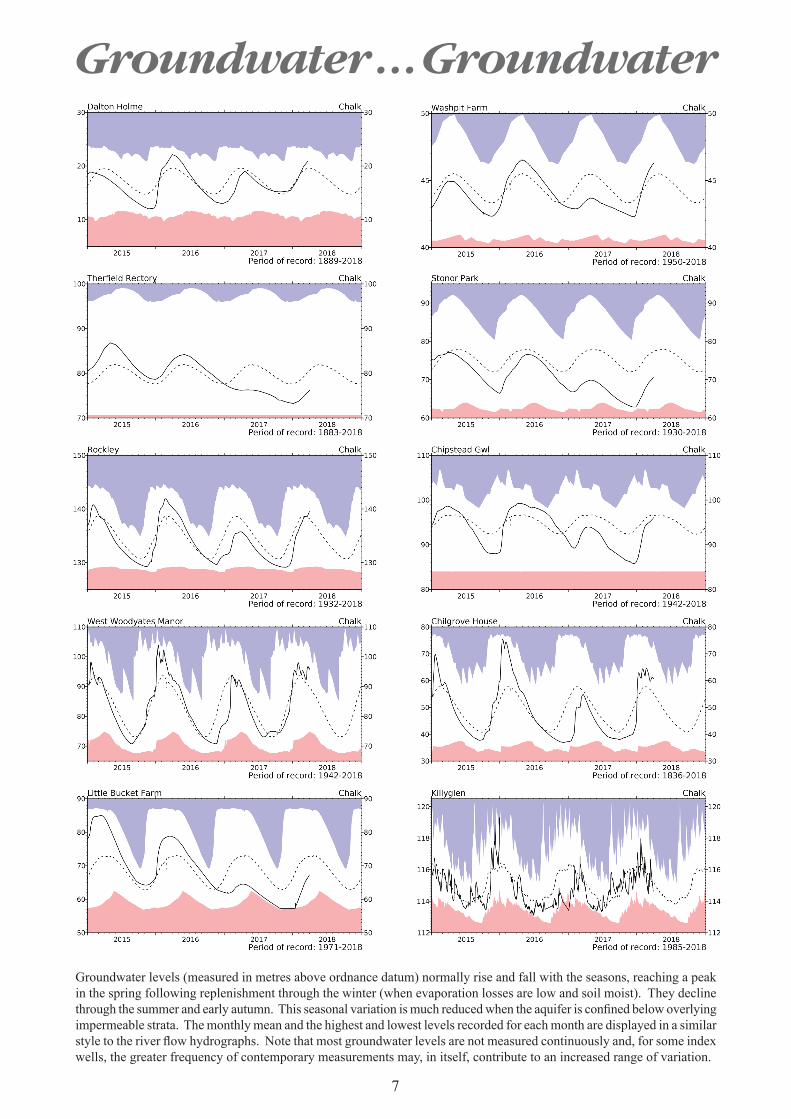
GroundwaterThe above average rainfall and near-zero soil moisture deficits in March meant the delayed seasonal recovery of groundwater levels continued at a majority of sites. Levels generally increased throughout the Chalk but declined at boreholes on the South Downs. Levels in the Chalk remained within the normal range for March but were exceptionally high at Ashton Farm and notably high at Wetwang and West Woodyates Manor. Levels remained below average at Stonor Park, Dial Farm and across the North Downs. In the more rapidly responding Jurassic limestones, water levels responded to the March recharge, leading to exceptionally high levels at Ampney Crucis. In the Magnesian limestone levels also generally increased. Levels in the Upper Greensand at Lime Kiln Way continued to rise but remained below normal. In the north-western part of the Permo-Triassic sandstones, levels fell at Newbridge and stabilised at Skirwith (reflecting the lower rainfall in March in these areas) but remained well above average. Elsewhere, levels generally rose but remained in the normal range or below, with the exceptions of Bussels No. 7A where they became notably high and Nuttalls Farm where levels fell. Levels remained in the normal range or below in the Midlands and north-east Wales. In the rapidly responding Carboniferous Limestone levels rose during March to above normal, exceptionally so at Pant y Lladron. In the Fell Sandstone at Royalty Observatory, levels increased and were above normal for the time of year.

2
Rainfall . . . Rainfall . . . Rainfall accumulations and return period estimatesPercentages are from the 1981-2010 average.
Region RainfallMar
2018Jan18 – Mar18 Oct17 – Mar18 Jul17 – Mar18 Apr17 – Mar18
RP RP RP RP
United mm 104 302 629 960 1166Kingdom % 112 101 2-5 95 2-5 105 2-5 103 2-5England mm 102 237 458 723 885
% 162 116 2-5 97 2-5 108 2-5 105 2-5Scotland mm 99 373 848 1248 1523
% 72 85 2-5 91 2-5 98 2-5 100 2-5Wales mm 151 420 858 1291 1525
% 133 112 2-5 99 2-5 111 5-10 107 2-5Northern mm 86 331 648 1046 1242Ireland % 90 112 5-10 101 2-5 115 20-30 109 10-15England & mm 109 263 513 801 973Wales % 156 115 2-5 98 2-5 109 2-5 105 2-5
North West mm 74 291 711 1122 1347% 75 94 2-5 100 2-5 112 5-10 110 5-10
Northumbria mm 104 249 484 744 937% 157 116 2-5 102 2-5 108 2-5 107 2-5
Severn-Trent mm 105 222 412 655 797% 185 123 2-5 100 2-5 109 2-5 102 2-5
Yorkshire mm 110 248 442 720 904% 171 120 5-10 96 2-5 109 2-5 107 2-5
Anglian mm 74 166 311 513 662% 169 122 2-5 99 2-5 108 2-5 106 2-5
Thames mm 93 196 366 601 727% 182 117 2-5 94 2-5 108 2-5 101 2-5
Southern mm 99 231 419 662 802% 171 117 2-5 89 2-5 103 2-5 100 2-5
Wessex mm 132 265 503 757 899% 197 119 2-5 97 2-5 107 2-5 102 2-5
South West mm 185 404 733 1096 1281% 194 123 5-10 97 2-5 109 2-5 104 2-5
Welsh mm 150 406 823 1235 1461 % 138 114 2-5 100 2-5 110 5-10 107 2-5Highland mm 79 394 1034 1463 1777
% 46 71 2-5 90 2-5 96 2-5 98 2-5North East mm 105 219 496 789 1016
% 133 86 2-5 86 2-5 97 2-5 100 2-5Tay mm 132 339 645 964 1209
% 111 86 2-5 79 5-10 87 2-5 90 2-5Forth mm 114 326 607 914 1170
% 109 97 2-5 85 2-5 93 2-5 97 2-5Tweed mm 109 304 556 851 1071
% 135 115 5-10 95 2-5 103 2-5 104 2-5Solway mm 94 411 865 1334 1630
% 75 103 2-5 97 2-5 108 5-10 110 10-20Clyde mm 108 488 1048 1550 1855
% 65 93 2-5 94 2-5 101 2-5 102 2-5 % = percentage of 1981-2010 average RP = Return periodImportant note: Figures in the above table may be quoted provided their source is acknowledged (see page 12). Where appropriate, specific mention must be made of the uncertainties associated with the return period estimates. The RP estimates are based on data provided by the Met Office and reflect climatic variability since 1910; they also assume a stable climate. The quoted RPs relate to the specific timespans only; for the same timespans, but beginning in any month the RPs would be substantially shorter. The timespans featured do not purport to represent the critical periods for any particular water resource management zone. For hydrological or water resources assessments of drought severity, river flows and/or groundwater levels normally provide a better guide than return periods based on regional rainfall totals. Note that precipitation totals in winter months may be underestimated due to snowfall undercatch. All monthly rainfall totals since January 2017 are provisional.
3
Rainfall . . . Rainfall . . . March 2018 rainfallas % of 1981-2010 average
October 2017 - March 2018 rainfallas % of 1981-2010 average
* For a grass cover
March rainfall totals for Wessex
March average outflows for England & Wales
Rai
nfal
l (m
m)
Flow
(m3 s
-1)
17015013011090705030
% o
f ave
rage
% o
f ave
rage
The Hydrological Outlook provides an insight into future hydrological conditions across the UK. Specifically it describes likely trajectories for river flows and groundwater levels on a monthly basis, with particular focus on the next three months.
The complete version of the Hydrological Outlook UK can be found at: www.hydoutuk.net/latest-outlook/
Period: from April 2018Issued: 09.04.2018 using data to the end of March 2018
River flows are most likely to be normal in the north-west of the UK, and normal to above normal elsewhere during April and the coming three months. The possible exceptions, where normal to below normal flows are likely, are slowly responding groundwater fed catchments in the Chilterns and Berkshire Downs. Groundwater levels are most likely to be normal for the coming three months except in parts of northern England and southern Scotland where above normal levels are likely to persist.
17015013011090705030
1910s 1920s 1930s 1940s 1950s 1960s 1970s 1980s 1990s 2000s 2010s
200
150
100
50
0
10000
5000
1000
500 1960s 1970s 1980s 1990s 2000s 2010s

!( !(!(!(
!(
!(!(
!(!(
!(
!(
!(
!(!(
!(!(!(
!(
!(
!(
!(!(
!(
!(
!(!(!( !(!(
!(!(
!(
!(!(
!(
!(!(
!(
!(!(
!(
!(
!(
!(
!(!(
!(
!(
!(!(
!(
!(
!(
!(
!(
!(
!(
!(
!( !(
!(!(!(!( !(
!(
75
79
7672
68
66
8486
84
9699
99
87
85
93
84
83
98 94
83 8171
79
84
89
95
89
70
9093
9589
111
106
106
110
107
105
110
101
102
110104
103
100
111
100
105
106100
108
101
101
120
117
125
113
117
126
118
121
119112
116
119
123
© NERC 2018. © Crown copyright.
Naver
Ness
SpeyEwe
Dee
Tay
Nevis
Tweed
Luss
Carron
Whiteadder
Clyde
Cree
Tyne
Derwent
WharfeLune
DeeDove
Trent
Lud
Soar
Witham
GreatOuse
Little Ouse
GreatStour
Stour
Itchen
Lambourn
Teifi
Yscir
Cynon
Teme
Severn
Coln
Tone
Taw
Exe
Avon
Ouse
Thames Colne
Warleggan
Kenwyn
Bush
Annacloy
Mourne
Lee
BlackwaterMedway
Wye
Ribble
Avon
Conwy
Stringside
Tyne
Deveron
Brue
Dart
Tywi
Ythan
Tees
Nith
Earn
Mersey
Eden
4
River flow . . . River flow . . .
River flows *Comparisons based on percentage flows alone can be misleading. A given percentage flow can represent extreme drought conditions in permeable catchments where flow patterns are relatively stable but be well within the normal range in impermeable catchments where the natural variation in flows is much greater. Note: the averaging period on which these percentages are based is 1981-2010. Percentages may be omitted where flows are under review.
Key
% of long-term average(record figure when circled)
Exceptionally low flow
Notably low flow
Exceptionally high flow
Below normal
Normal range
Notably high flow
Above normal
25
Based on ranking of the monthly flow*
March 2018
October 2017 -March 2018
!( !(!(!(
!(
!(!(
!(!(
!(
!(
!(
!(!(
!(!(!(
!(
!(
!(
!(!(
!(
!(
!(!(!( !(!(
!(!(
!(
!(!(
!(
!(!(
!(
!(!(
!(
!(
!(
!(
!(!(
!(
!(
!(!(
!(
!(
!(
!(
!(
!(
!(
!(
!(!(
!(!(!(!( !(
!(
J
J JJ
42
52
49
55
46
69
41
58
68
74
64
96
93
72
72
68
79
79
78
99
127
103
118
105
129
100103
125
115
101
117
123
112
139
138 159
127
137145
158
127 120
127
155
135
138
131
126
170
209
158
177
171
191
194
161
143151
168
179
153
211
231
185
173
240
© NERC 2018. © Crown copyright.
Naver
Ness
SpeyEwe
Dee
Tay
Nevis
Tweed
Luss
Carron
Whiteadder
Clyde
Cree
Tyne
Derwent
WharfeLune
DeeDove
Trent
Lud
Soar
Witham
GreatOuse
Little Ouse
GreatStour
Stour
Itchen
Lambourn
Teifi
Yscir
Cynon
Teme
Severn
Coln
Tone
Taw
Exe
Avon
Ouse
Thames Colne
Warleggan
Kenwyn
Bush
Annacloy
Mourne
Lee
BlackwaterMedway
Wye
Ribble
Avon
Conwy
Stringside
Tyne
Deveron
Brue
Dart
Tywi
Ythan
Tees
Nith
Earn
Mersey
Eden
© NERC (CEH) 2018 © Crown copyright.
© NERC (CEH) 2018. © Crown copyright.

5
River flow . . . River flow . . .
*The river flow hydrographs show the daily mean flows (measured in m3s-1) together with the maximum and minimum daily flows prior to April 2017 (shown by the shaded areas). Daily flows falling outside the maximum/minimum range are indicated where the bold trace enters the shaded areas. The dashed line represents the period-of-record average daily flow.
River flow hydrographs

6
River flow . . . River flow . . .
7
Groundwater . . . Groundwater
Groundwater levels (measured in metres above ordnance datum) normally rise and fall with the seasons, reaching a peak in the spring following replenishment through the winter (when evaporation losses are low and soil moist). They decline through the summer and early autumn. This seasonal variation is much reduced when the aquifer is confined below overlying impermeable strata. The monthly mean and the highest and lowest levels recorded for each month are displayed in a similar style to the river flow hydrographs. Note that most groundwater levels are not measured continuously and, for some index wells, the greater frequency of contemporary measurements may, in itself, contribute to an increased range of variation.

8
Groundwater . . . Groundwater

9
Groundwater . . . Groundwater
!(
!(!(
!(
!(
!(!(
!(!(
!(!(!(!(
!(!(
!(
!(
!(
!(
!(
!(!(!(
!(
!(!(
!(
!(!(
!(!(
!(
!(
!(
!(
Killyglen
Chipstead
Frying PanLodge
RoyaltyObservatory
Aylesby
BussellsNo.7a
Rockley
Wetwang
Houndean
Tilshead
Skirwith
LlanfairD.C
Westdean No.3
Newbridge
DialFarm
Heathlanes
Aycliffe
Alstonfield
AshtonFarm
StonorPark
New RedLion
WashpitFarm
DaltonHolme
NuttallsFarm
AmpneyCrucis
LimeKilnWay
ComptonHouse
Pant yLladron
ChilgroveHouse
BrickHouseFarm
Greenfield GarageTherfieldRectory
LittleBucketFarm
WestWoodyates
Manor
RedlandsHall
25/33
6/50
21/75
13/47
12/49
12/48
12/57
33/47
25/42
23/50
17/38
24/40
15/43
20/4530/55
44/76
52/86
23/53
43/68
88/124
39/132
76/130
24/28
30/40
19/24
145/183
22/25
38/43
41/47
34/38
68/74
42/47
24/25
58/60
43/45
Key
Monthly rank/Period of record(record figure when circled)J1/25
!( Exceptionally low levels!( Notably low levels
!( Exceptionally high levels
!( Below normal
!( Normal range
!( Notably high levels
!( Above normal
© NERC 2018.
AquiferChalk
Jurassic limestones
Permo-Triassic sandstones
Magnesian Limestone
Carboniferous Limestone
11/34
© BGS NERC 2018
Groundwater levels - March 2018The calculation of ranking has been modified from that used in summaries published prior to October 2012. It is now based on a comparison between the most recent level and levels for the same date during previous years of record. Where appropriate, levels for earlier years may have been interpolated. The rankings are designed as a qualitative indicator, and ranks at extreme levels, and when levels are changing rapidly, need to be interpreted with caution.

10
Reservoirs . . . Reservoirs . . .Guide to the variation in overall reservoir stocks for England andWales
Comparison between overall reservoir stocks for England and Wales in recent years
Area Reservoir
Capacity
(Ml)2018
Jan2018Feb
2018Mar
Mar Anom.
Min Mar
Year* of min
2017Mar
Diff 18-17
North West N Command Zone • 124929 87 86 83 -9 77 1993 98 -16 Vyrnwy 55146 99 96 100 5 64 1996 100 0Northumbrian Teesdale • 87936 100 97 99 5 77 2003 98 1 Kielder (199175) 95 90 91 -1 81 1993 97 -6Severn-Trent Clywedog 49936 93 94 100 5 86 1996 99 1 Derwent Valley • 46692 100 91 100 4 54 1996 97 3Yorkshire Washburn • 23373 94 96 99 6 70 1996 98 1 Bradford Supply • 40942 100 99 99 5 59 1996 95 4Anglian Grafham (55490) 92 96 96 4 77 1997 96 0 Rutland (116580) 92 93 95 4 73 2012 97 -2Thames London • 202828 94 95 96 2 88 1990 95 1 Farmoor • 13822 95 97 96 2 80 2013 96 0Southern Bewl 31000 64 88 100 10 49 2012 79 22
Ardingly 4685 100 100 100 3 51 2012 100 0Wessex Clatworthy 5364 100 100 100 3 82 1992 100 0 Bristol • (38666) 99 98 99 6 71 1992 94 5South West Colliford 28540 100 99 100 12 58 1997 95 5 Roadford 34500 95 90 95 10 37 1996 76 19 Wimbleball 21320 86 94 100 4 78 1996 93 7 Stithians 4967 100 100 95 1 52 1992 99 -4Welsh Celyn & Brenig • 131155 98 99 100 2 72 1996 100 0 Brianne 62140 100 98 100 2 90 1993 100 0 Big Five • 69762 93 94 96 0 78 1993 94 2 Elan Valley • 99106 100 98 99 2 89 1993 100 -1
Scotland(E) Edinburgh/Mid-Lothian • 96518 97 97 99 4 71 1998 92 7 East Lothian • 9374 100 100 100 1 95 2012 100 0Scotland(W) Loch Katrine • 110326 100 98 94 2 74 2010 97 -3
Daer 22412 100 99 91 -6 77 2013 100 -9 Loch Thom 10798 100 100 100 3 83 2010 97 3
Northern Total+ • 56800 99 98 98 8 83 2002 93 6Ireland Silent Valley • 20634 100 98 100 13 57 2000 88 12
( ) figures in parentheses relate to gross storage • denotes reservoir groups *last occurrence
+ excludes Lough Neagh
Details of the individual reservoirs in each of the groupings listed above are available on request. The percentages given in the Average and Minimum storage columns relate to the 1988-2012 period except for West of Scotland and Northern Ireland where data commence in the mid-1990s. In some gravity-fed reservoirs (e.g. Clywedog) stocks are kept below capacity during the winter to provide scope for flood attenuation purposes. Monthly figures may be artificially low due to routine maintenance or turbidity effects in feeder rivers. © NERC (CEH) 2018.
Percentage live capacity of selected reservoirs at end of month
11
© NERC (CEH, BGS) 2018 © Crown copyright
Minor aquifers have been omitted
G
"
"
"
"
G
G
"
"
"
"
"
G
G
"
"
GG
"
GG
G
G
G
"
G
"
G
G
"
""
"
"
!
!
!
!
!
!!
!
!
!
!
!
!
!
!
!
!
!
!
!
!
!
!
!
!
!
!
!
!
!
!
!
!
!
!
#
#
#
#
#
#
#
#
#
#
#
#
#
#
##
#
##
#
#
#
#
#
#
#
#
#
#
#
#
#
#
#
##
#
#
#
#
#
#
#
#
#
#
#
#
#
#
#
#
##
##
#
# #
##
#
#
#
##
#
#
##
#
#
#
#
#
#
#
##
#
#
#
#
##
#
#
#
#
#
#
#
#
#
#
#
#
#
#
#
Tay
Earn
Ness SpeyDeve
ron
Don
Ewe
Naver
Carron
Nevis
Dee
Ythan
ForthLuss
Tyne
Clyde
Tweed
Whiteadder
Cree
Nith
South Tyne
EdenLu
ne
Ribble
Dove
Der
wentOuse
Wharfe
Conwy
Dee
Dyfi
TemeWyeYscir
UskCynon
Tawe
TywiTeifi
Torne
Tren
t
Soar
Lud
Witham
Stringside
Little Ouse
Great Ouse
Colne
Lee
Thames Medway
Great Stour
Ouse
Mole
Blackwater
Coln
LambournKennet
Wallington
ItchenTest
Avon
StourPiddle
Brue
Tone
Otter
Exe
TawDartWarleggan
Kenwyn
Avon
Severn
Dover Beck
Dove
Bervie
Camowen
LowerBann
Bush
Faughan
Mourne
Lagan
Annacloy
Lossie
Tees
Lymington
Tyne
North Tyne
Pang
Derwent
Mersey
Silent Valley
Katrine
Thom
East Lothian
Edinburgh/ Mid-Lothian
Daer
KielderBraden
Northern Command
Zone
Derwent Valley
Bradford Supply
Washburn
Rutland
Grafham
Farmoor
London
BewlArdingly
Bristol
Stithians
Colliford
Roadford
Wimbleball Clatworthy
BigFive
ElanValley
Clywedog
Vyrnwy
Brianne
Celyn & Brenig
Teesdale
Pennines
West Lothian
Haweswater & Thirlmere
Newbridge
AycliffeSkirwith
Wetwang
DaltonHolmeBrick
HouseFarm
WashpitFarm
DialFarm
Redlands HallTherfield Rectory
NewRedLion
Aylesby
Alstonfield
NuttallsFarm
Heathlanes
Llanfair D.C.
GreenfieldGarage
Pant y Lladron
StonorPark
AmpneyCrucis
Rockley
Little BucketFarm
Tilshead
WestWoodyates
Manor
Lime Kiln Way
AshtonFarm
BussellsNo.7A
HoundeanBottom
WestdeanNo.3
ChilgroveHouse
ComptonHouse
Killyglen
Royalty Observatory
Frying Pan Lodge
Chipstead
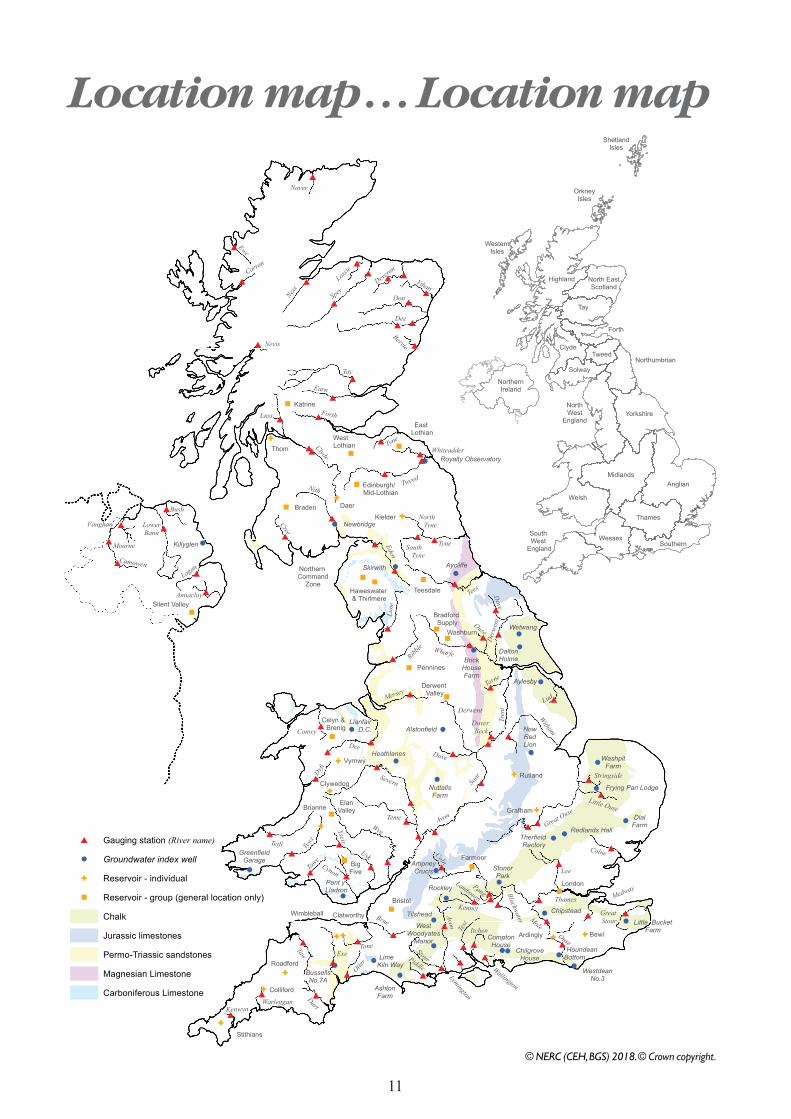
# Gauging station
! Groundwater index well
G Reservoir - individual
" Reservoir - group (general location only)
Chalk
Jurassic limestones
Permo-Triassic sandstones
Magnesian Limestone
Carboniferous Limestone
North EastScotland
Highland
Tay
Clyde
Forth
Tweed
SolwayNorthumbrian
NorthWest
EnglandYorkshire
MidlandsAnglian
Thames
SouthernWessex
South West
England
Welsh
NorthernIreland
OrkneyIsles
ShetlandIsles
WesternIsles
(River name)
© NERC (CEH, BGS) 2018. © Crown copyright.
Location map . . . Location map
12
NHMP
The National Hydrological Monitoring Programme (NHMP) was started in 1988 and is undertaken jointly by the Centre for Ecology & Hydrology (CEH) and the British Geological Survey (BGS). The NHMP aims to provide an authoritative voice on hydrological conditions throughout the UK, to place them in a historical context and, over time, identify and interpret any emerging hydrological trends. Hydrological analysis and interpretation within the Programme is based on the data holdings of the National River Flow Archive (NRFA; maintained by CEH) and National Groundwater Level Archive (NGLA; maintained by BGS), including rainfall, river flows, borehole levels, and reservoir stocks.
Data Sources
The NHMP depends on the active cooperation of many data suppliers. This cooperation is gratefully acknowledged.River flow and groundwater level data are provided by the Environment Agency (EA), Natural Resources Wales - Cyfoeth Naturiol Cymru (NRW), the Scottish Environment Protection Agency (SEPA) and, for Northern Ireland, the Department for Infrastructure - Rivers and the Northern Ireland Environment Agency. In all cases the data are subject to revision following validation (high flow and low flow data in particular may be subject to significant revision).
Details of reservoir stocks are provided by the Water Service Companies, the EA, Scottish Water and Northern Ireland Water.
The Hydrological Summary and other NHMP outputs may also refer to and/or map soil moisture data for the UK. These data are provided by the Meteorological Office Rainfall and Evaporation Calculation System (MORECS). MORECS provides estimates of monthly soil moisture deficit in the form of averages over 40 x 40 km grid squares over Great Britain and Northern Ireland. The monthly time series of data extends back to 1961.
Rainfall data are provided by the Met Office. To allow better spatial differentiation the rainfall data for Britain are presented for the regional divisions of the precursor organisations of the EA, NRW and SEPA. The areal rainfall figures have been produced by the Met Office National Climate Information Centre (NCIC), and are based on 5km resolution gridded data from rain gauges. The majority of the full rain gauge network across the UK is operated by the EA, NRW, SEPA and Northern Ireland Water; supplementary rain gauges are operated by the Met Office. The Met Office NCIC monthly rainfall series
extend back to 1910 and form the official source of UK areal rainfall statistics which have been adopted by the NHMP. The gridding technique used is described in Perry MC and Hollis DM (2005) available at http://www.metoffice.gov.uk/climate/uk/about/methods
Long-term averages are based on the period 1981-2010 and are derived from the monthly areal series.
The regional figures for the current month in the hydrological summaries are based on a limited rain gauge network so these (and the associated return periods) should be regarded as a guide only.
The monthly rainfall figures are provided by the Met Office NCIC and are Crown Copyright and may not be passed on to, or published by, any unauthorised person or organisation.
For further details on rainfall or MORECS data, please contact the Met Office:
Tel: 0870 900 0100Email: [email protected]
Enquiries
Enquiries should be directed to the NHMP:
Tel: 01491 692599Email: [email protected]
A full catalogue of past Hydrological Summaries can be accessed and downloaded at:
http://nrfa.ceh.ac.uk/monthly-hydrological-summary-uk
Some of the features displayed on the maps contained in this report are based on the following data with permission of the controller of HMSO.
i. Ordnance Survey data. © Crown copyright and/or database right 2005. Licence no. 100017897.
ii. Land and Property Services data. © Crown copyright and database right, S&LA 145.
iii. Met Office rainfall data. © Crown copyright.
All rights reserved. Unauthorised reproduction infringes crown copyright and may lead to prosecution or civil proceedings.
Text and maps in this document are © NERC (CEH) 2018 unless otherwise stated and may not be reproduced without permission.
04/2018