hydrology - faculty of civil engineering — "the best...
TRANSCRIPT
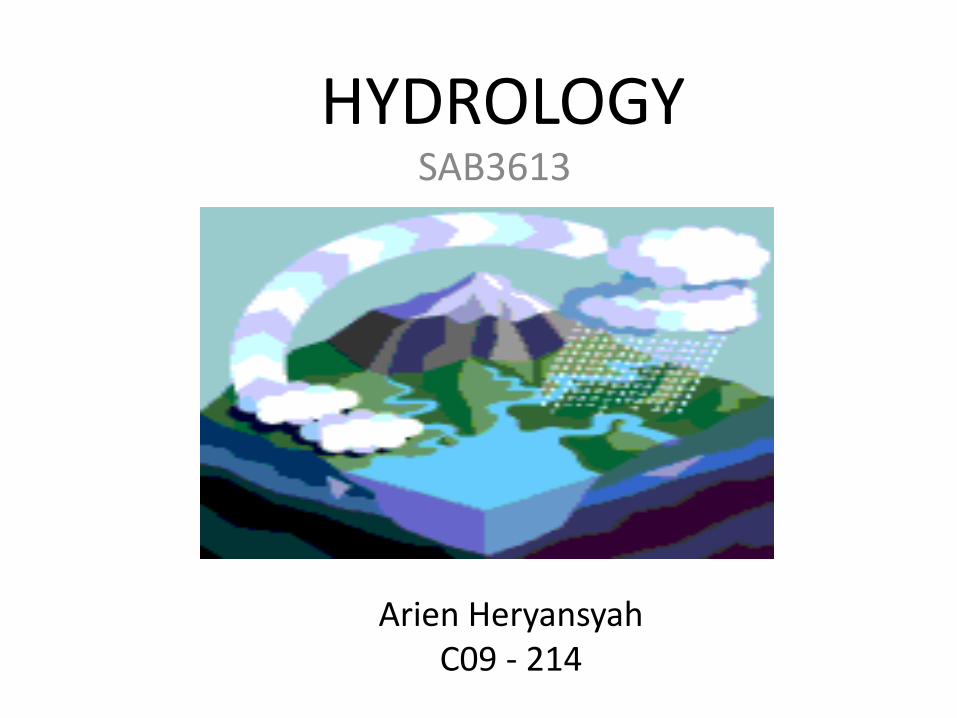
HYDROLOGYSAB3613
Arien HeryansyahC09 - 214

Do you like this landscape?
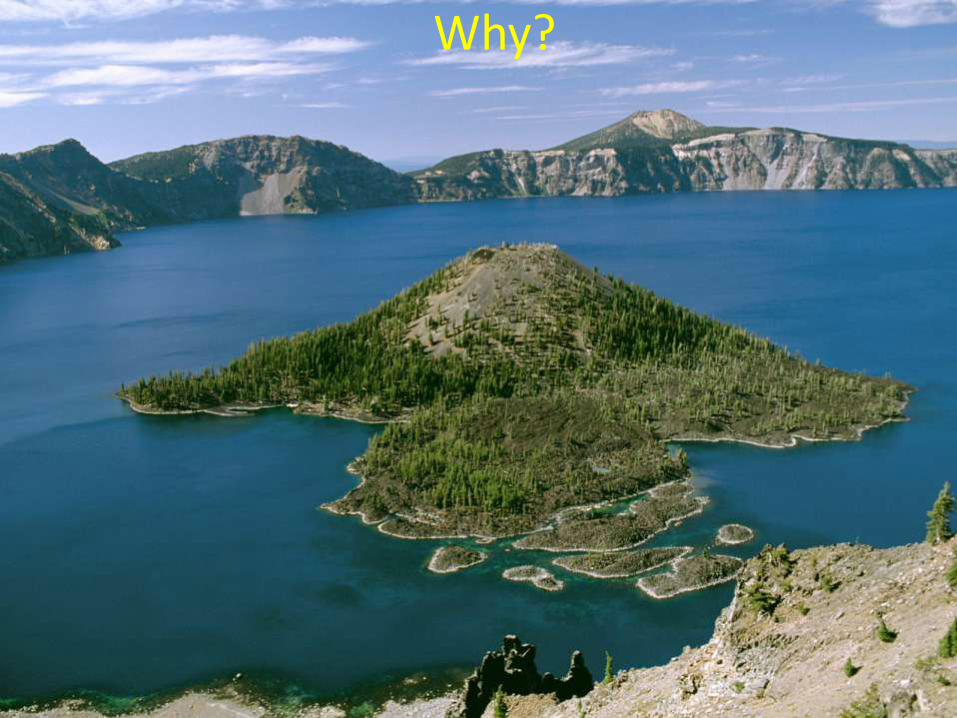
Why?

We are human …. !

Natural DisasterIt is NOT ?

Flush Flood
Assignment #1
• Take a piece of paper and write your name, and what do you think about “Durian”?
• Write down what is hydrology from your neighbor friend’s point of view….
• Why we need to study hydrology…
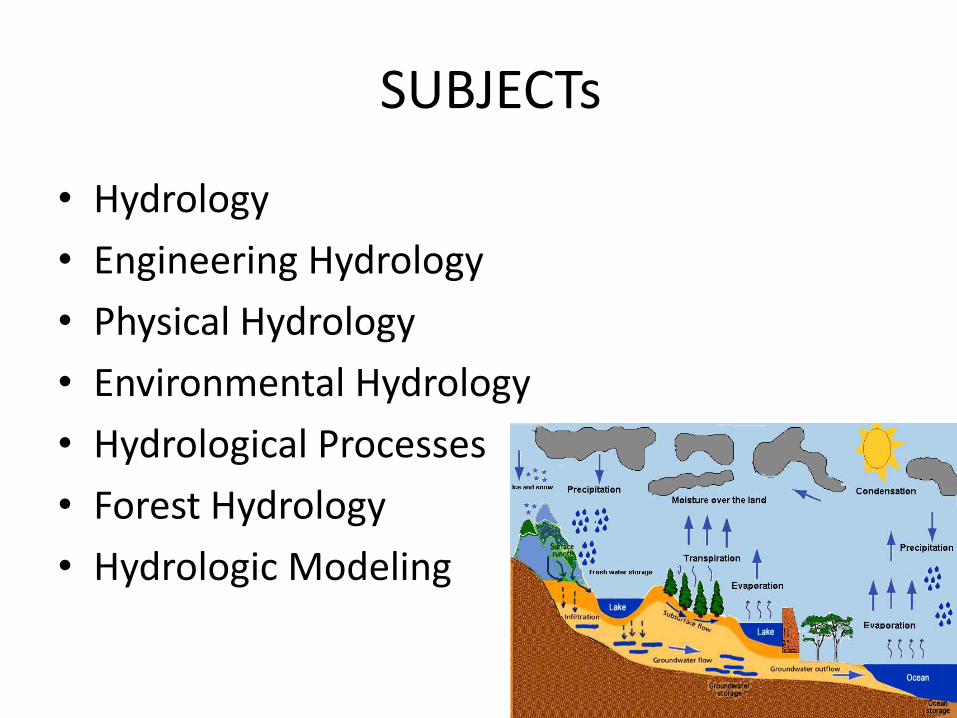
SUBJECTs
• Hydrology
• Engineering Hydrology
• Physical Hydrology
• Environmental Hydrology
• Hydrological Processes
• Forest Hydrology
• Hydrologic Modeling

Snow Melt
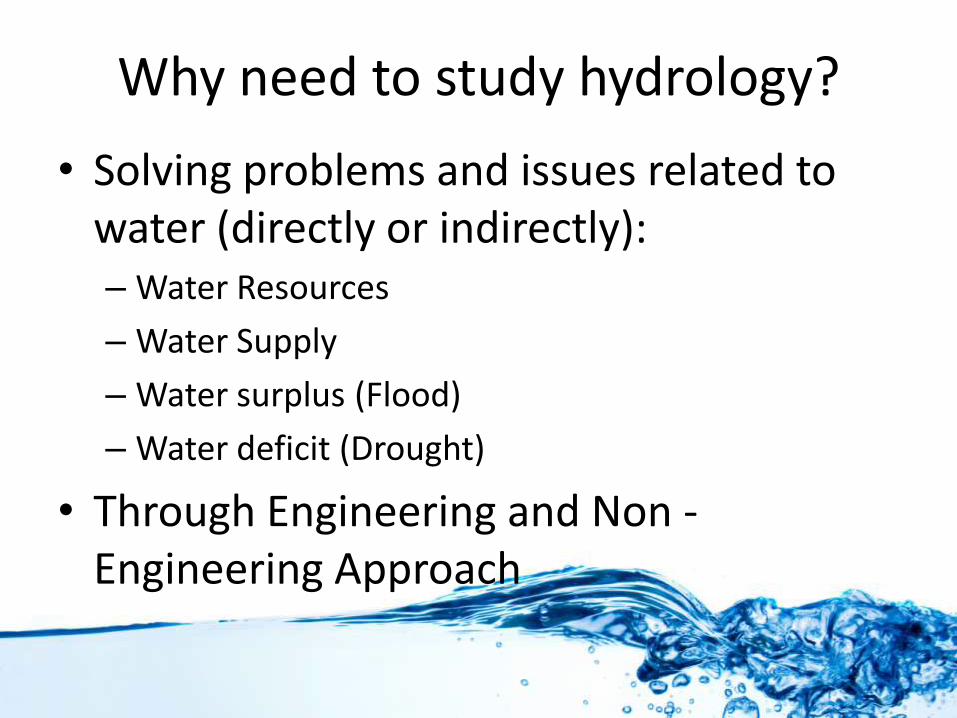
Why need to study hydrology?
• Solving problems and issues related to water (directly or indirectly):– Water Resources
– Water Supply
– Water surplus (Flood)
– Water deficit (Drought)
• Through Engineering and Non -Engineering Approach
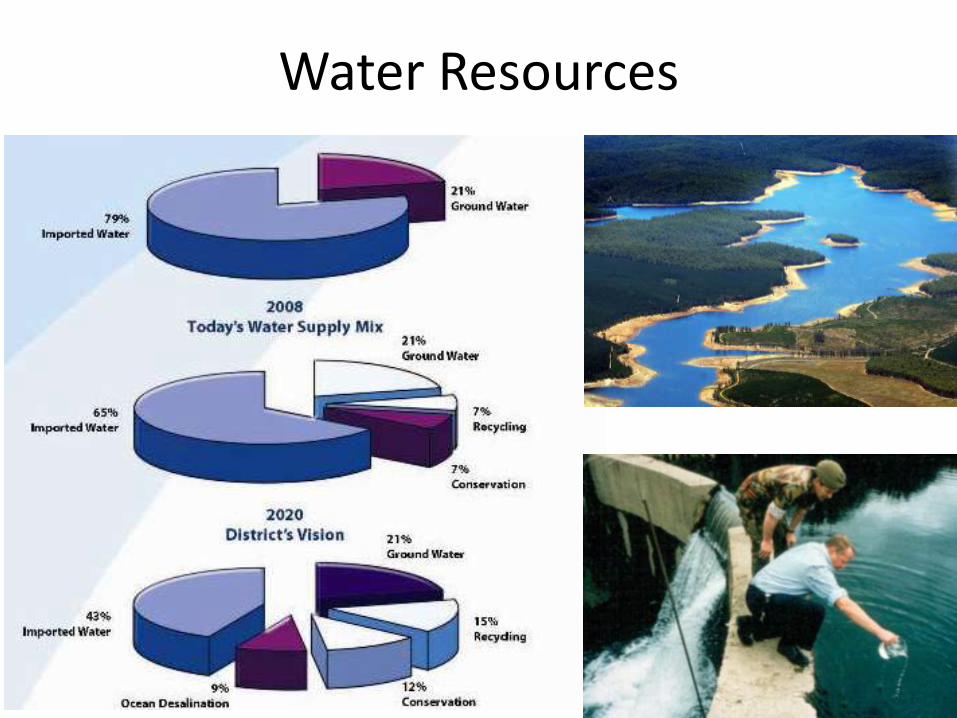
Water Resources

Water Supply
• Human life (150 liter/day)
• Industry
• Agricultural (75% of water supply)
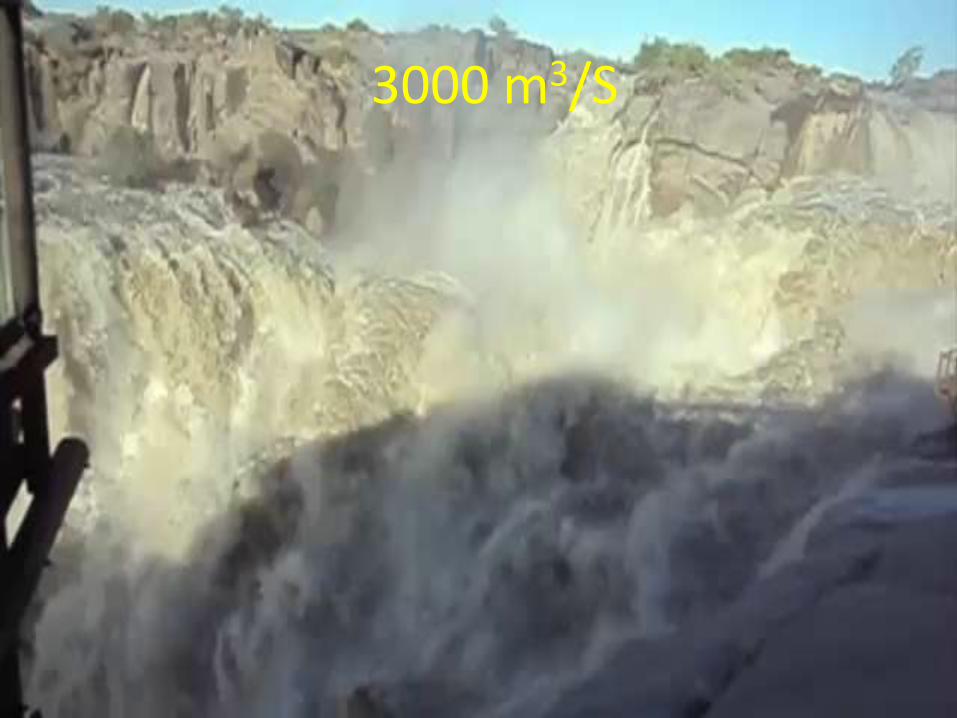
3000 m3/S
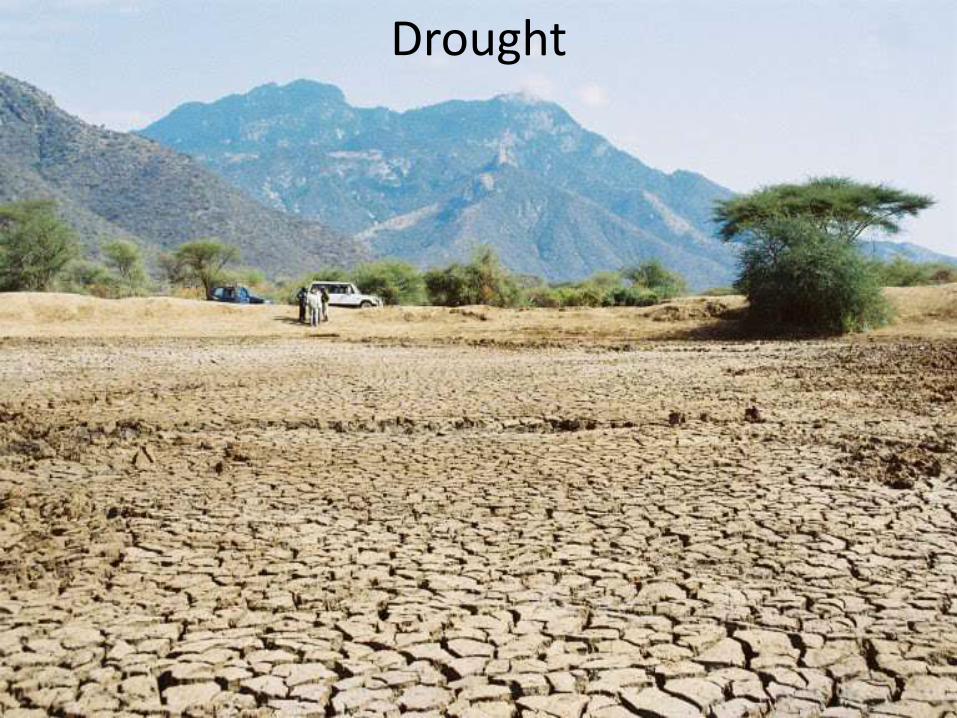
Drought
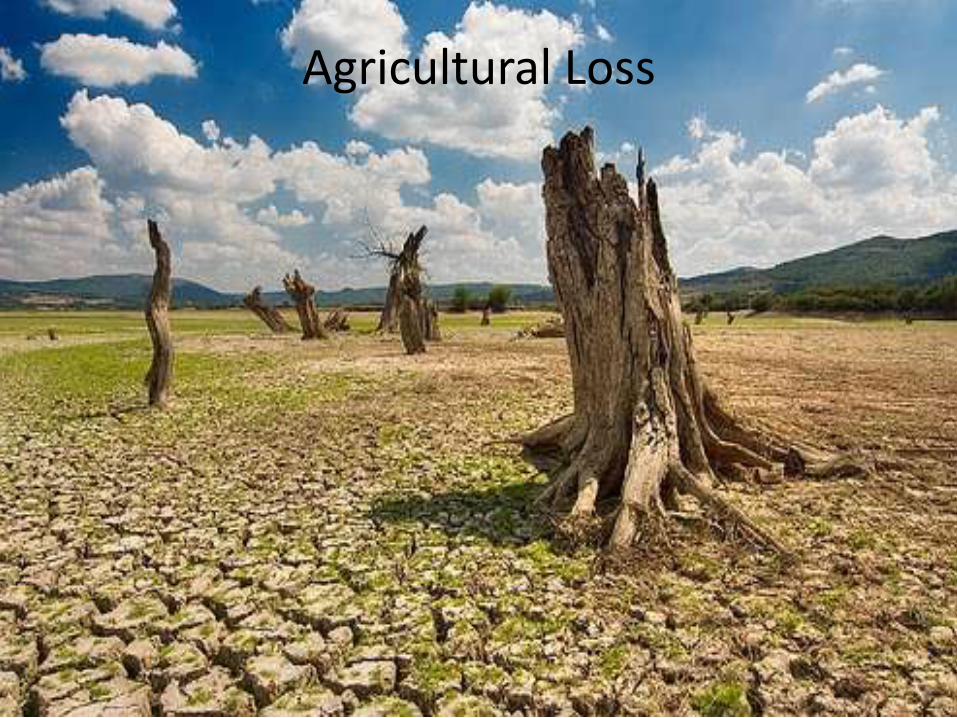
Agricultural Loss

Empty Dam

Extreme Drought
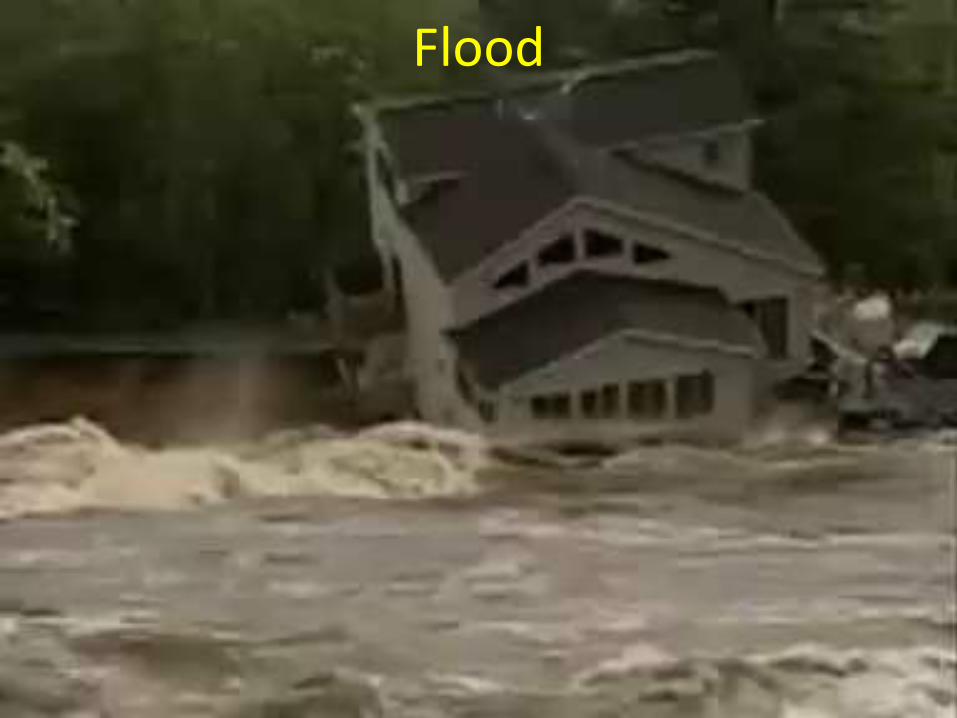
Flood

Flood at Australia
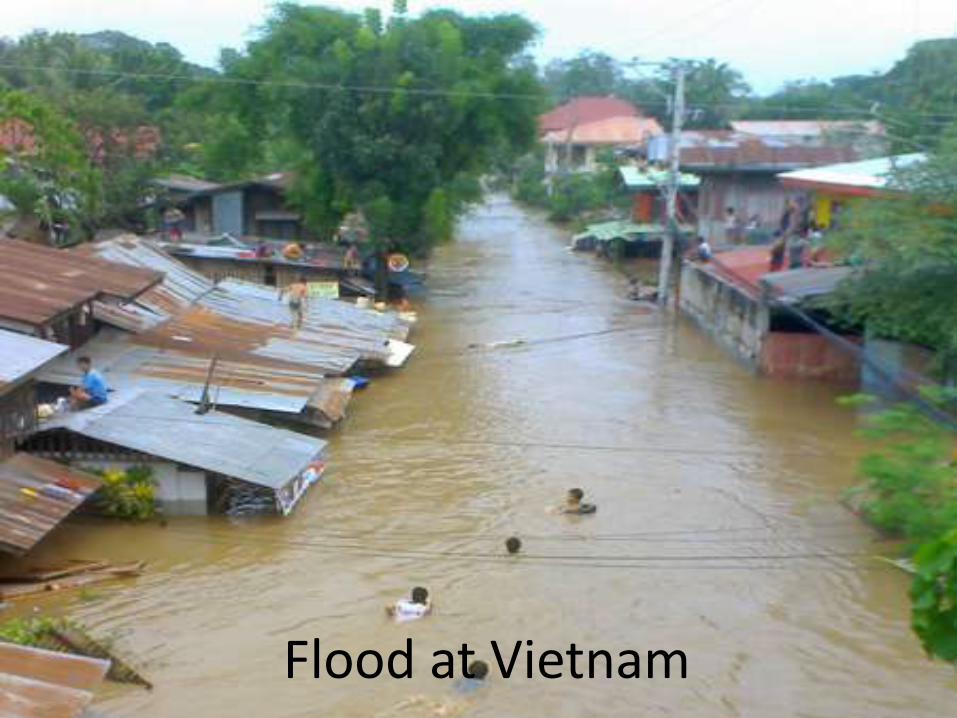
Flood at Vietnam

Water Cycle

Climate Change And Water Cycle
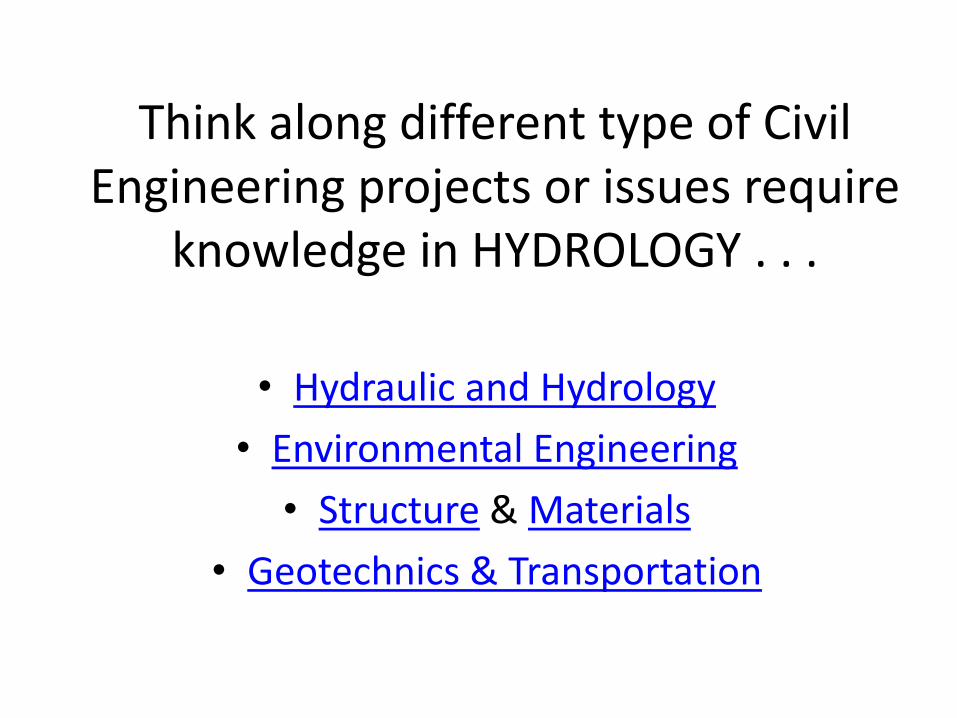
Think along different type of Civil Engineering projects or issues require
knowledge in HYDROLOGY . . .
• Hydraulic and Hydrology
• Environmental Engineering
• Structure & Materials
• Geotechnics & Transportation

HYDROLOGY
• Dealing with excess / surplus water which causeFLOOD
• And dealing with shortage water which caused byDROUGHT
• Hydrologist must be able to handle both situation
Hydrology is the science that encompasses the occurrence, distribution, movement andproperties of the waters of the earth and their relationship with the environment withineach phase of the hydrologic cycle. The water cycle, or hydrologic cycle, is a continuousprocess by which water is purified by evaporation and transported from the earth's surface(including the oceans) to the atmosphere and back to the land and oceans. All of thephysical, chemical and biological processes involving water as it travels its various paths inthe atmosphere, over and beneath the earth's surface and through growing plants, are ofinterest to those who study the hydrologic cycle.
Assignment #1
• Take a piece of paper and write your name
• Write down what is hydrology from your neighbor friend’s point of view….
• Why we need to study hydrology…
• Write down your opinion revision …

Synopsis• The course emphasizes hydrology and its application in the field of
engineering especially those related to water resources.Interdisciplinary aspects of hydrology that will be introduced anddiscussed are the understanding of the hydrological processes. Theseprocesses are precipitation, evaporation, transpiration, surface runoff,groundwater flow, infiltration and interception. Some processes will bediscussed in more detail as compared to the others. An introduction toflood estimation will be highlighted together with the basic analysis andconcept design in accordance to local guideline of Urban Storm waterManagement Manual for Malaysia (MASMA). Frequency analysis is thefinal topic to be discussed in this subject. A brief introduction to thehydrologic modeling processes will be introduced as a basicrequirement to the understanding to the empirical and numericalmodeling concepts.
• Upon completion of the course, students are expected to be able todescribe and assess all the physical processes found in the hydrologiccycle together with the basic quantitative hydrologic analysis methods.

Course Learning Outcomes
No. Course Learning Outcomes Programme Outcome(s)
Taxonomies and
Soft-Skills
Assessment Methods
1. Describe the basic concepts of hydrology and integrate the physical hydrological processes.
PO1, PO3 C3, P3 A, F
2. Analyze various hydrological data and sectional methods for stream flow quantification.
PO3 C4 A, Q, T, F
3. Develop precipitation and hydrograph estimation and apply into engineering
practices.
PO2, PO3 C5, A4 A, Q, T, F
4. Estimate and compute the discharge for hydrologic design purposes.
PO4 C4, CTPS1 A, T, F
5. Apply various statistical methods for hydrological analysis.
PO4
C3, CTPS2 A, T, F
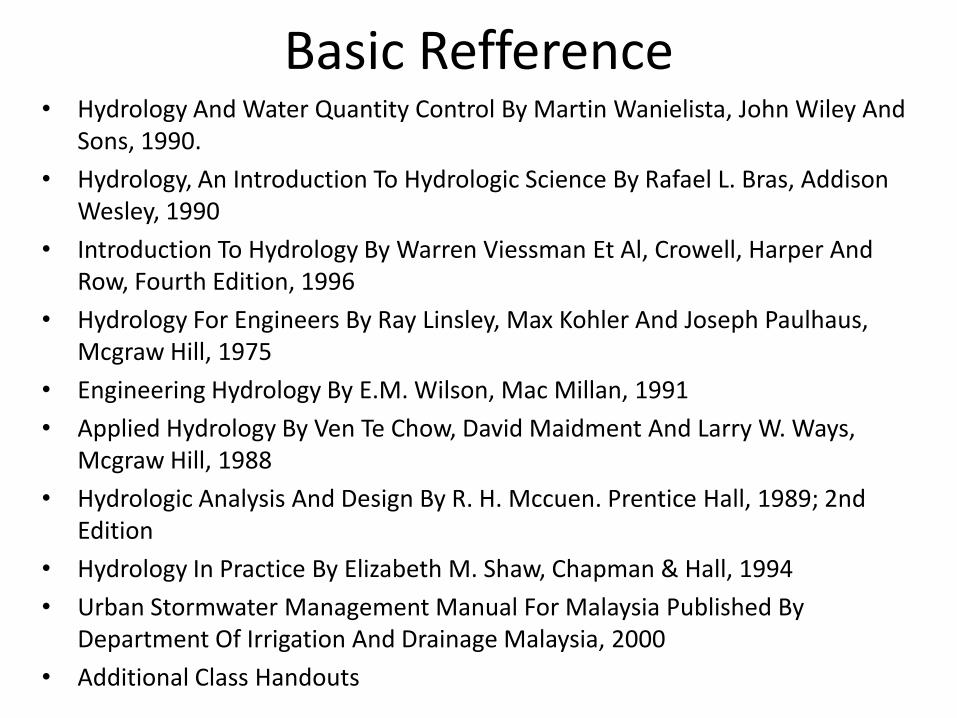
Basic Refference• Hydrology And Water Quantity Control By Martin Wanielista, John Wiley And
Sons, 1990.
• Hydrology, An Introduction To Hydrologic Science By Rafael L. Bras, Addison Wesley, 1990
• Introduction To Hydrology By Warren Viessman Et Al, Crowell, Harper And Row, Fourth Edition, 1996
• Hydrology For Engineers By Ray Linsley, Max Kohler And Joseph Paulhaus, Mcgraw Hill, 1975
• Engineering Hydrology By E.M. Wilson, Mac Millan, 1991
• Applied Hydrology By Ven Te Chow, David Maidment And Larry W. Ways, Mcgraw Hill, 1988
• Hydrologic Analysis And Design By R. H. Mccuen. Prentice Hall, 1989; 2nd Edition
• Hydrology In Practice By Elizabeth M. Shaw, Chapman & Hall, 1994
• Urban Stormwater Management Manual For Malaysia Published By Department Of Irrigation And Drainage Malaysia, 2000
• Additional Class Handouts

Grading
No. Assessment Number % each % total Dates
1. Assignment 2 2% 4 Wk: 7 & 13
2. Quizzes 3 2% 6 Wk: 8 & 12
3. Presentation 0 0% 0
4. Test 2 20% 40 Wk: 6 & 12
5. Final Exam 1 50% 50 Wk: 18
Overall Total 100

Weekly Schedule
1. Introduction to hydrology (week 1-2)CO-1
2. Rainfall (week 3-4)CO-1, CO-2, C0-5
3. Hydrologic Losses (week 5-6)CO-2
4. River Flow Measurement (week 7)CO-2, CO-5
5. Hydrograph Analysis (week 9)CO-3
6. Flow Estimation (week 10-11)CO-3, CO-4
7. Flood Routing (week 12-13)CO-4
8. Frequency Analysis (week 14-15)CO-5
Week 1 – 7 : Arien Heryansyah, PhD (C09-214)Week 9-15 : Dr Tarmizi Ismail (C07-330)

Definition
• Study about water (quantitative and qualitative).In Civil Engineering, quantitative hydrology isgiven more emphasis because it relates toinfrastructural development.
• Hydrology is a science of water; its existence, itscycle, its distribution, physical and chemicalproperties, and its response to biotic and abiotic.
• Hydrology is a science to study the processes ofcontrolling surface water of the earth.
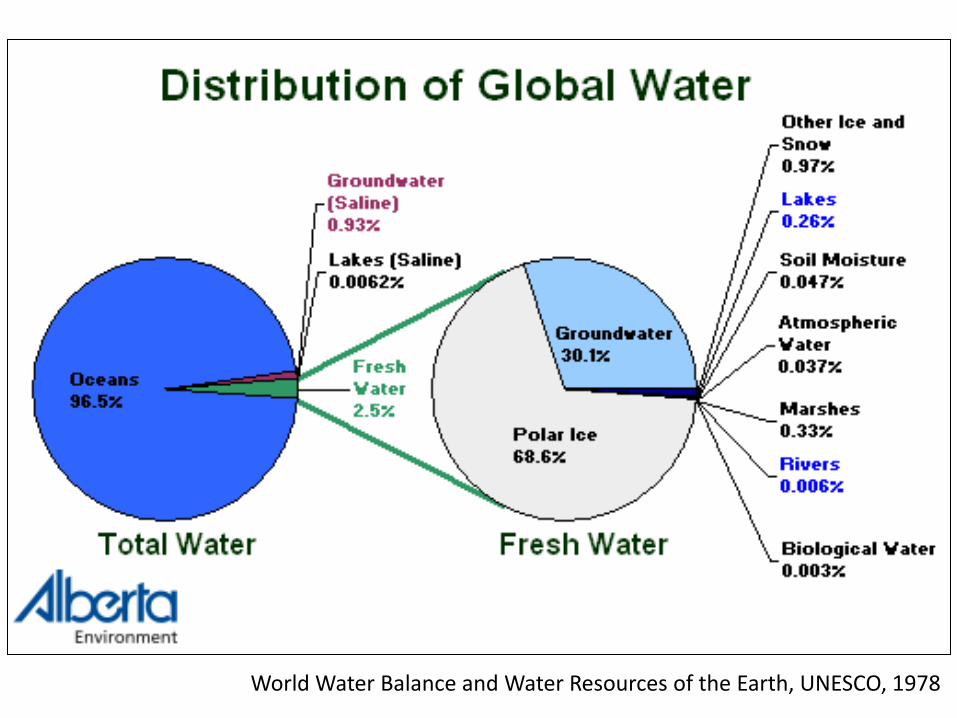
World Water Balance and Water Resources of the Earth, UNESCO, 1978

Water Fact
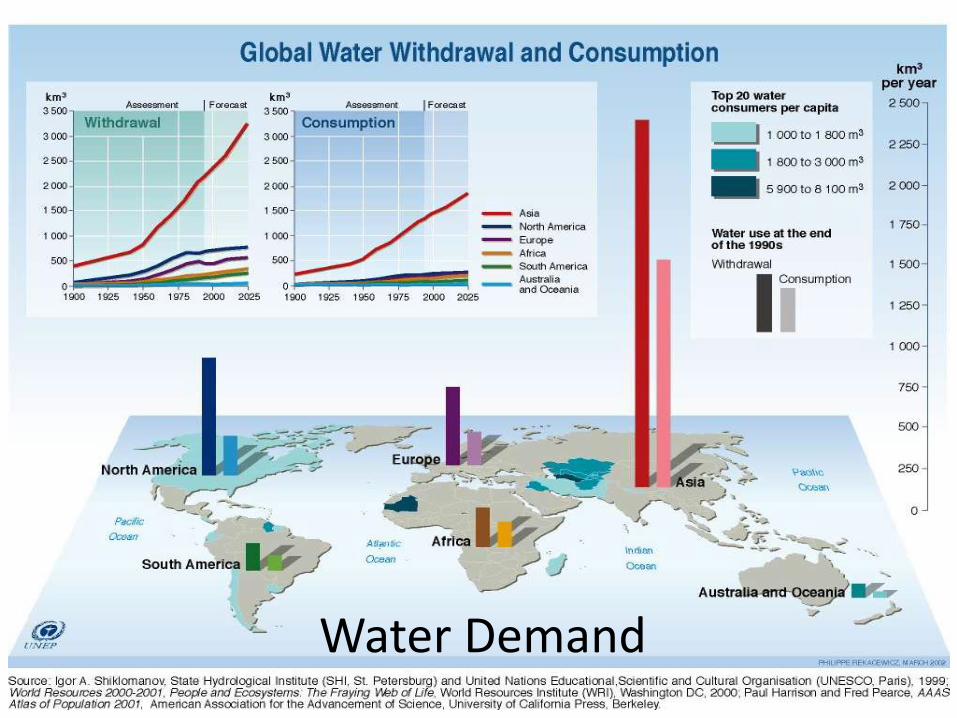
Water Demand
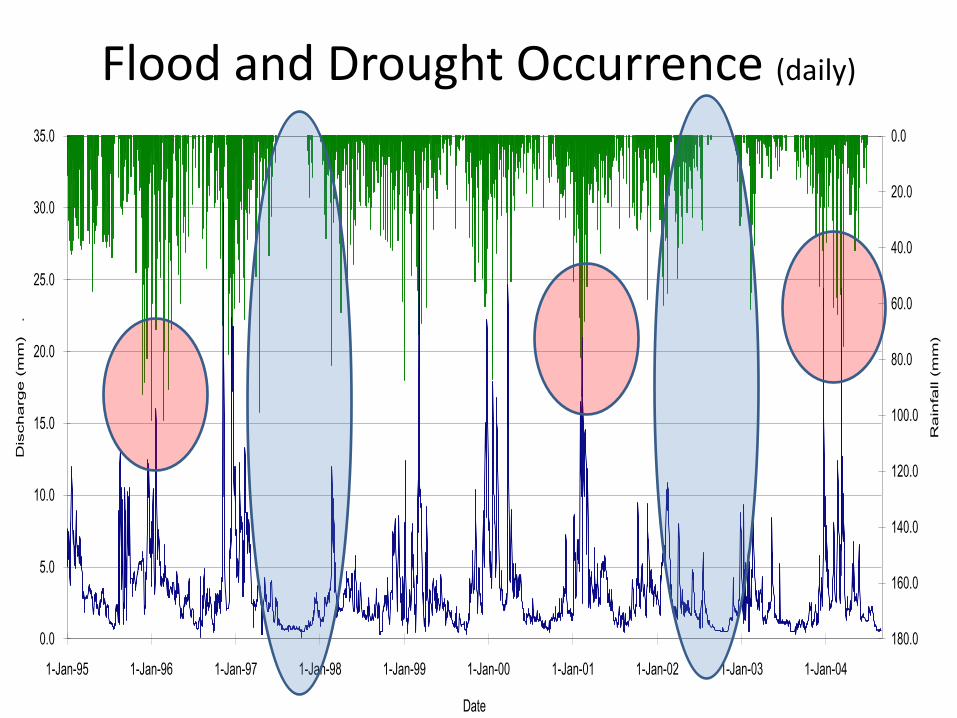
Flood and Drought Occurrence (daily)
0.0
5.0
10.0
15.0
20.0
25.0
30.0
35.0
1-Jan-95 1-Jan-96 1-Jan-97 1-Jan-98 1-Jan-99 1-Jan-00 1-Jan-01 1-Jan-02 1-Jan-03 1-Jan-04
Date
Dis
ch
arg
e (
mm
)
.
0.0
20.0
40.0
60.0
80.0
100.0
120.0
140.0
160.0
180.0
Ra
infa
ll (
mm
)

Flood and Drought Occurrence(Johor River)
0.00
50.00
100.00
150.00
200.00
250.00
300.001
-Au
g-6
3
1-A
ug-
65
1-A
ug-
67
1-A
ug-
69
1-A
ug-
71
1-A
ug-
73
1-A
ug-
75
1-A
ug-
77
1-A
ug-
79
1-A
ug-
81
1-A
ug-
83
1-A
ug-
85
1-A
ug-
87
1-A
ug-
89
1-A
ug-
91
1-A
ug-
93
1-A
ug-
95
1-A
ug-
97
1-A
ug-
99
1-A
ug-
01
1-A
ug-
03
1-A
ug-
05
1-A
ug-
07
1-A
ug-
09

Water Resources Planning
• Determines theavailability ofwater resources(quantity,quality, andtime)
• Alternativewater supply
• Hydroecological
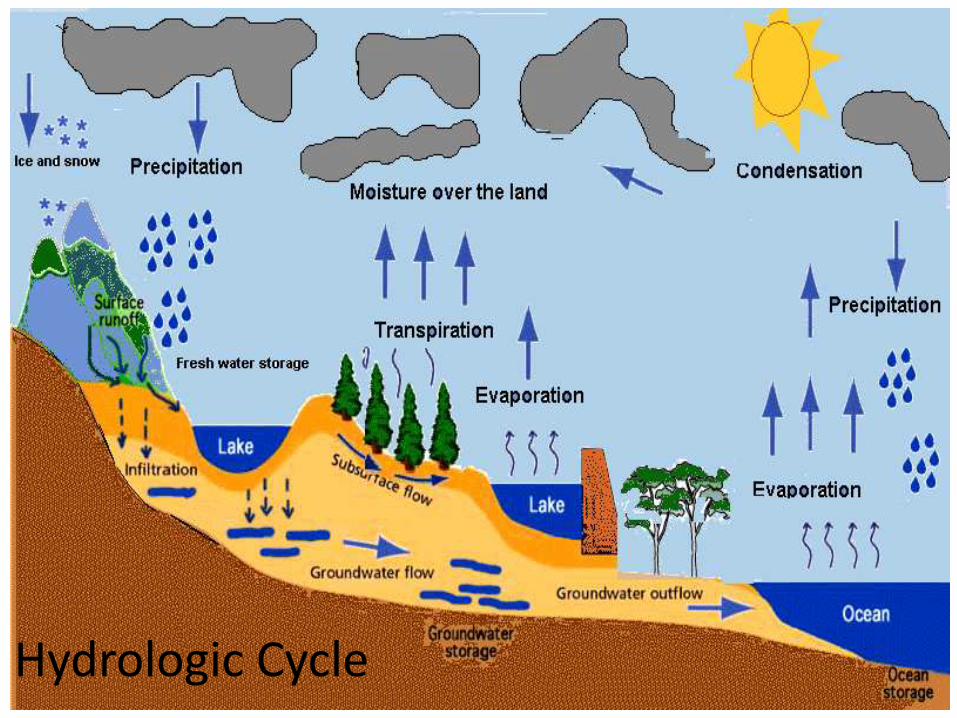
Hydrologic Cycle

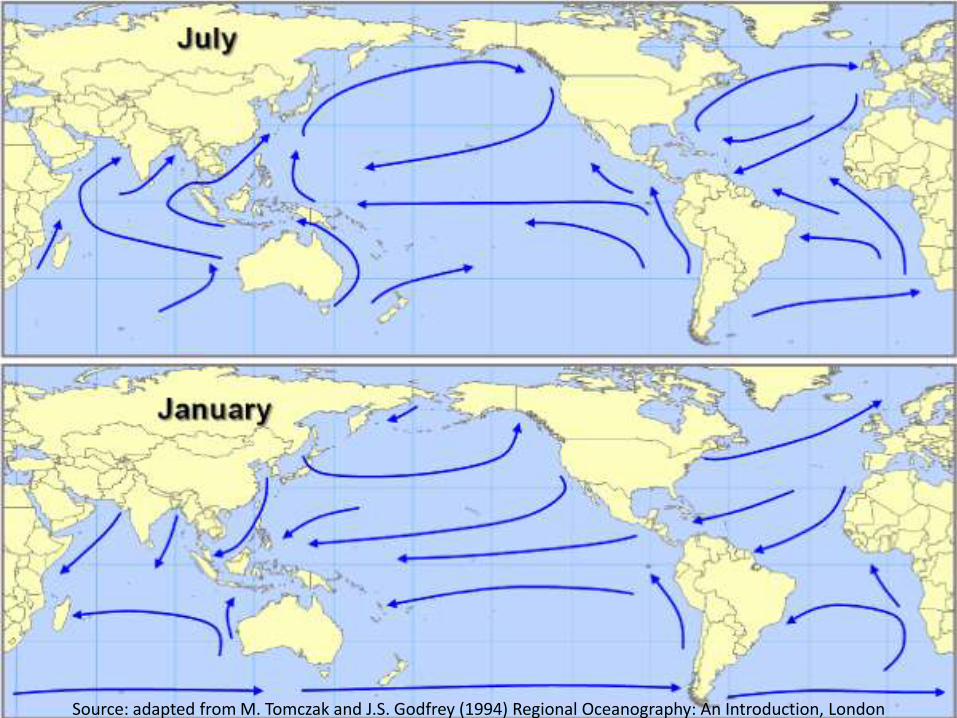
Source: adapted from M. Tomczak and J.S. Godfrey (1994) Regional Oceanography: An Introduction, London
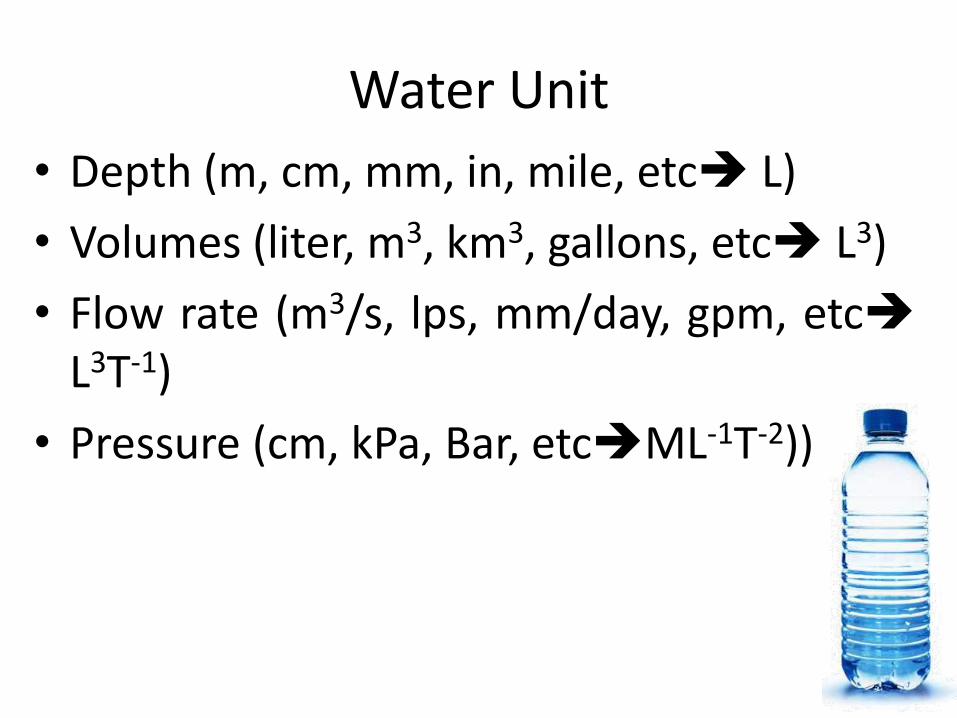
Water Unit
• Depth (m, cm, mm, in, mile, etc L)
• Volumes (liter, m3, km3, gallons, etc L3)
• Flow rate (m3/s, lps, mm/day, gpm, etcL3T-1)
• Pressure (cm, kPa, Bar, etcML-1T-2))

Water Documentary

Exercise
There is land as presentedon Fig.• How much the area?• If there are 2mm
depth of 2 hourrainfall with uniformdept all over the area,how much the volumeof the Rainfall?
• How much themaximum flow rate atthe outlet?
outlet

500m
500m 250,000 m2 = 25 Ha = 0.25 Km2
12= 300 Ha
Volume = 2 mm x 300Ha = 0.002 mm x 12 x250,000 m3 = 6,000 m3
Flow Rate = Volume / Time = 6,000 m3 / (2x3600 seconds)
1212
12
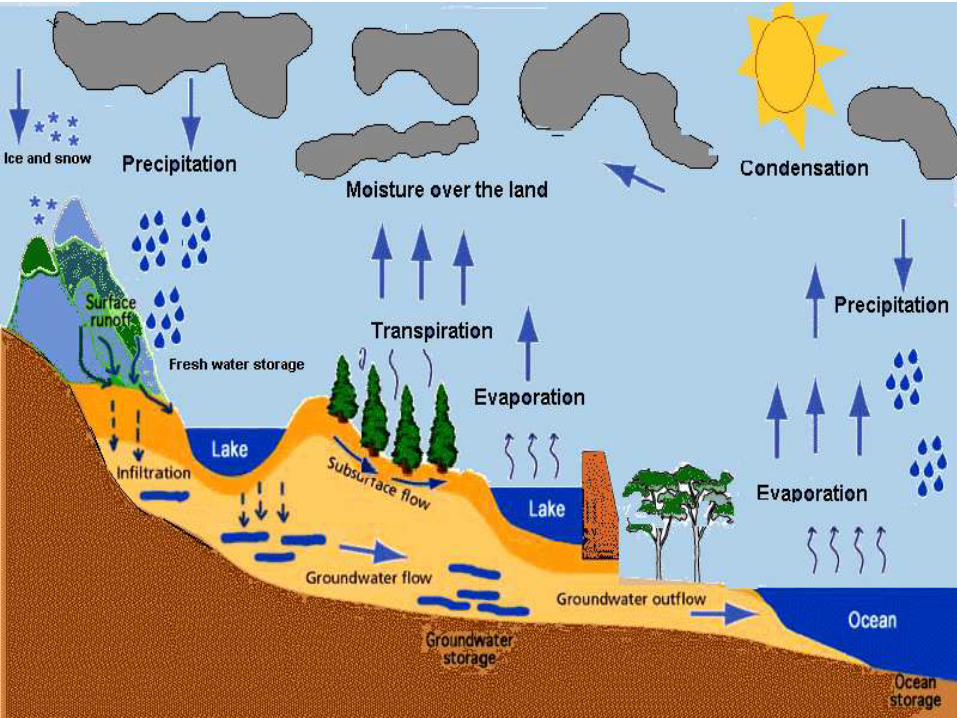
HYDROLOGIC CYCLE
What is Hydrologic Cycle ?In term of processes: In term of point of concern: in, out and…

Hydrologic Cycle• Form / Phase :
– Liquid : water
– Gas : cloud
– Solid : ice / snow
• Location:– Surface
– Underground
– Ocean
– Lake
– Atmosphere
– Bio
• Processes: ET, …

Flow Charts
Underground
Surface
Ocean
Atmosphere
Bio
LiquidSolid
Gas
Evaporation
Rainfall
Rainfall
Evapotranspiration
Tap? Drink?
Infiltration
Uptake
Waste???
Runoff
Groundwater
?????

Hydrologic Continuity Equation(Water Balance)
• A statement about water balance and water conservation law occurring in a clearly defined catchment area:
With :dS/dt = rate of storage change Ground water levelI = water input rainfall O = water output ET, Runoff, infiltration
𝛥𝑆
𝛥𝑡= 𝛥𝐼 − 𝛥𝑂
𝑑𝑆
𝑑𝑡= 𝐼 − 𝑂

Concept of Water Balance
0.0
100.0
200.0
300.0
400.0
500.0
600.0
Start Jan Feb Mar Apr May Jun Jul Aug Sep Oct Nov Dec
Storage Inflow Outflow
S
𝛥 O
𝛥 I
Assess the water
resources of the
watershed

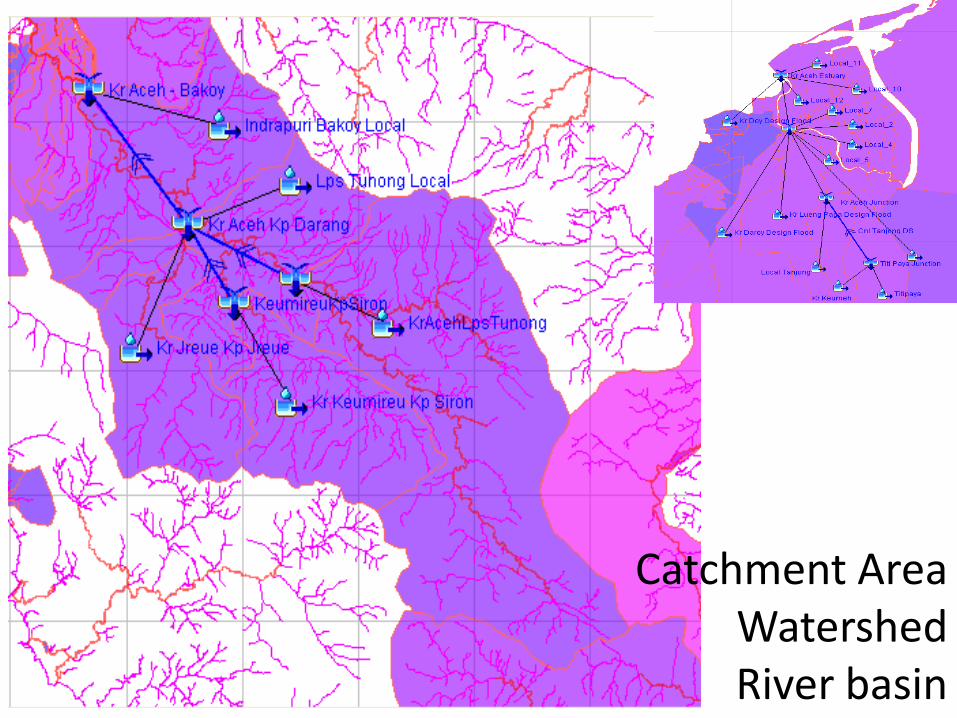
WATERSHED

Terminology• Region : geographic area, most relevant to Federal agencies
• River Basin : It is composed of a river system, a reach of a stream andits tributaries to that reach, a closed basin (e.g., Oregon ClosedBasins), or a group of streams composing a coastal drainage area.
• Watershed : refers to areas of land from which surface waters flow.
• The terms Region, Subregion, River Basin, Subbasin, Watershed,Subwatershed, Drainage, and Site are recommended.
• Catchment Area : The area drained by a river or body of water or Thesurrounding area served by an institution, such as a hospital or school
• Drainage basin : is an extent or area of land where surface water fromrain and melting snow or ice converges to a single point, usually theexit of the basin, where the waters join another waterbody, such as ariver, lake, reservoir, estuary, wetland, sea, or ocean.
• Hydrologic Unit : are similar with drainage basin but allow multipleinlets, outlets, or sinks.

Catchment AreaWatershedRiver basin
Outlet
Lake
Catchment AreaWatershedRiver basin

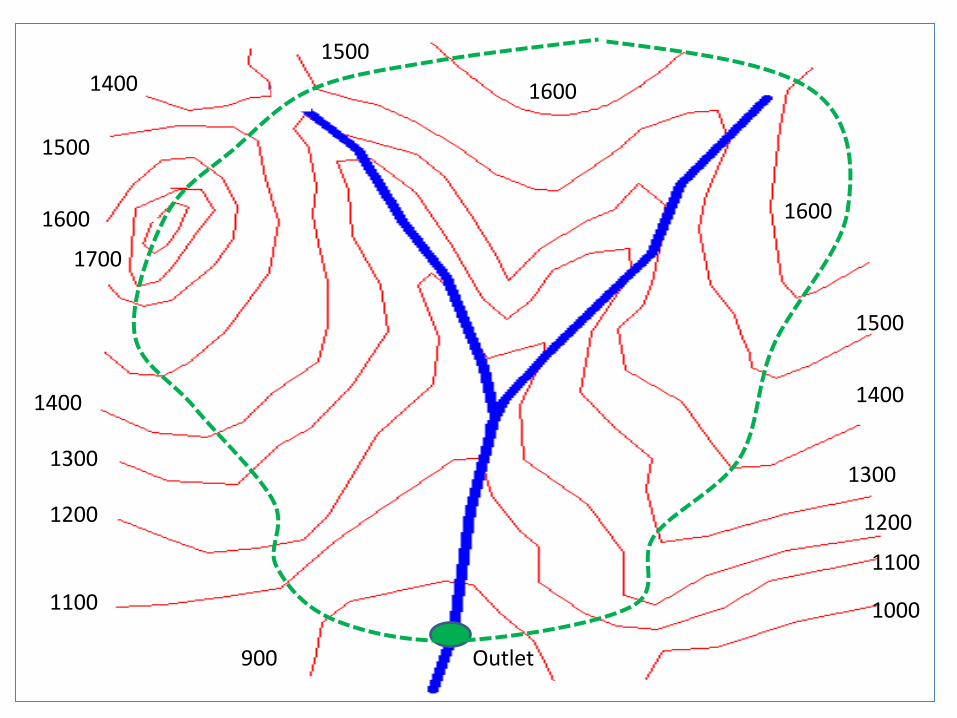
Watershed Delineation
1600
1600
1500
1400
1500
Outlet
1400 1400
1300
1200
1100
1000
1300
1200
1100
900
1500
1600
1700
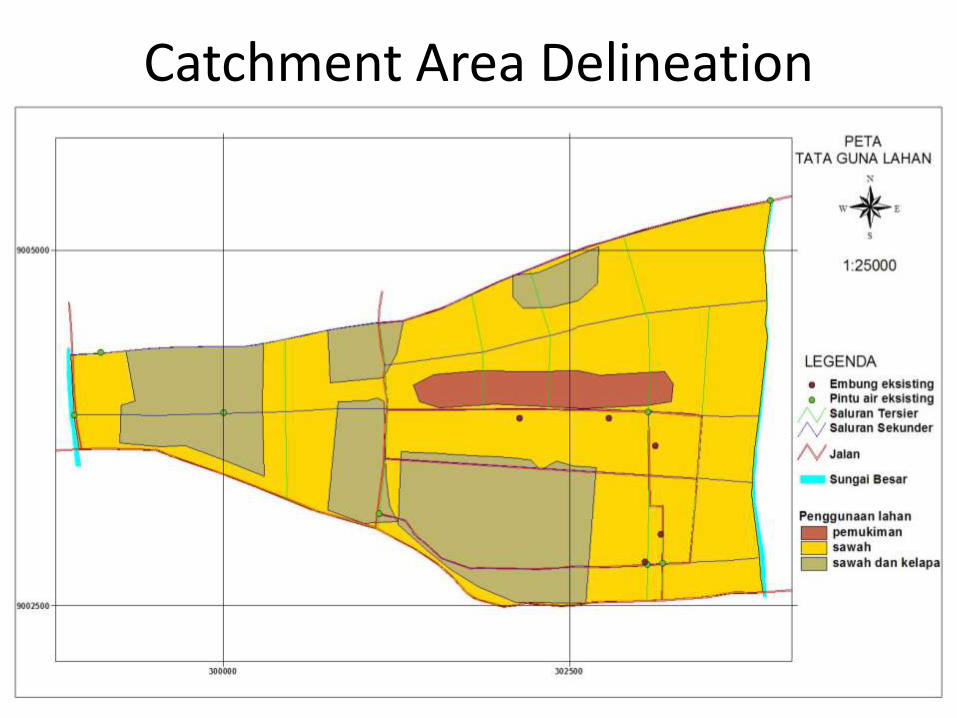
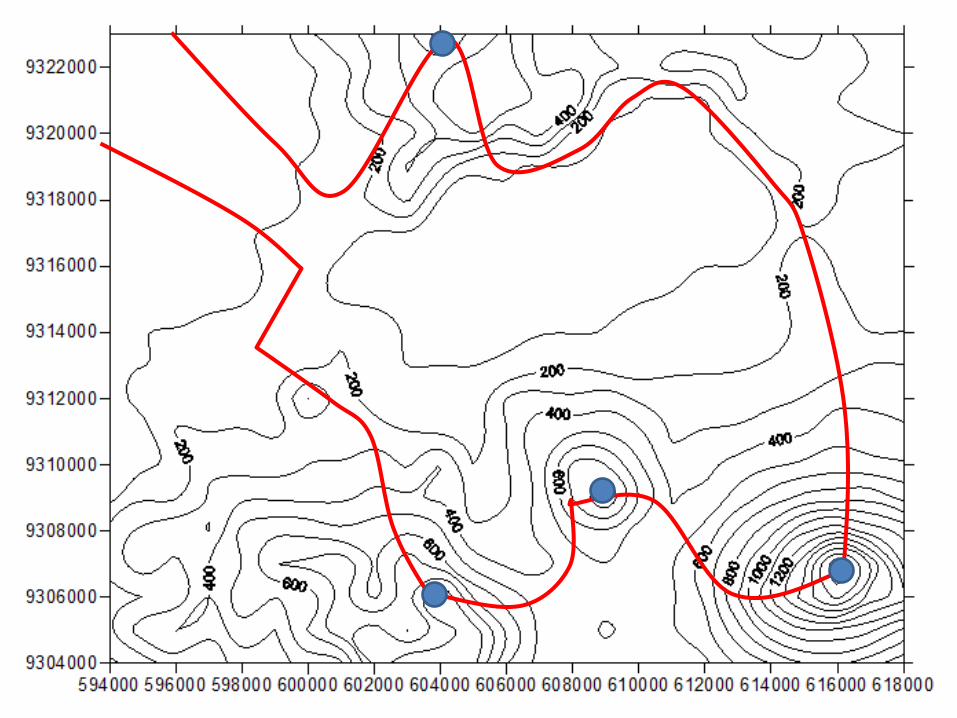
Catchment Area Delineation


0 10 20 15 10
12 10 20 25 17
15 20 30 32 30
20 35 40 37 45
10 20 35 40 50
D-8 Method


Water Balance
Month I O S
Jan 427.5 221.9 100.0
Feb 329.2 231.0
Mar 376.1 371.0
Apr 183.3 235.7
May 172.2 210.6
Jun 44.6 195.7
Jul 72.4 173.1
Aug 80.6 175.2
Sep 62.2 182.3
Oct 272.6 220.6
Nov 315.9 247.2
Dec 524.0 422.3
+
- 305.6403.8408.9356.5318.0167.0
66.3-25.3
-145.2-93.2-24.5
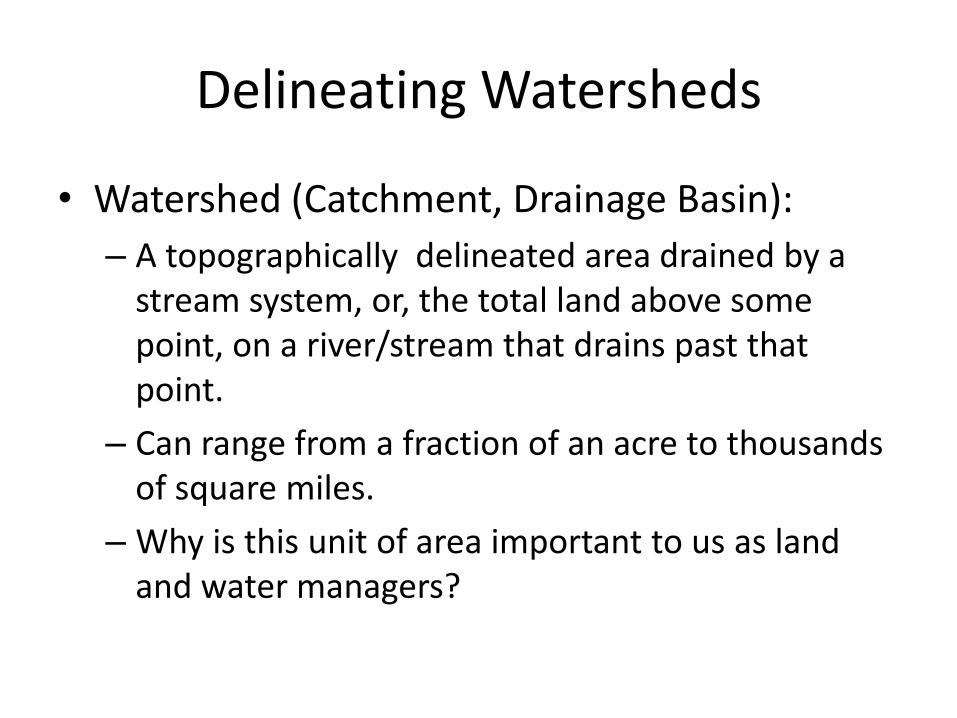
Delineating Watersheds
• Watershed (Catchment, Drainage Basin):
– A topographically delineated area drained by a stream system, or, the total land above some point, on a river/stream that drains past that point.
– Can range from a fraction of an acre to thousands of square miles.
– Why is this unit of area important to us as land and water managers?
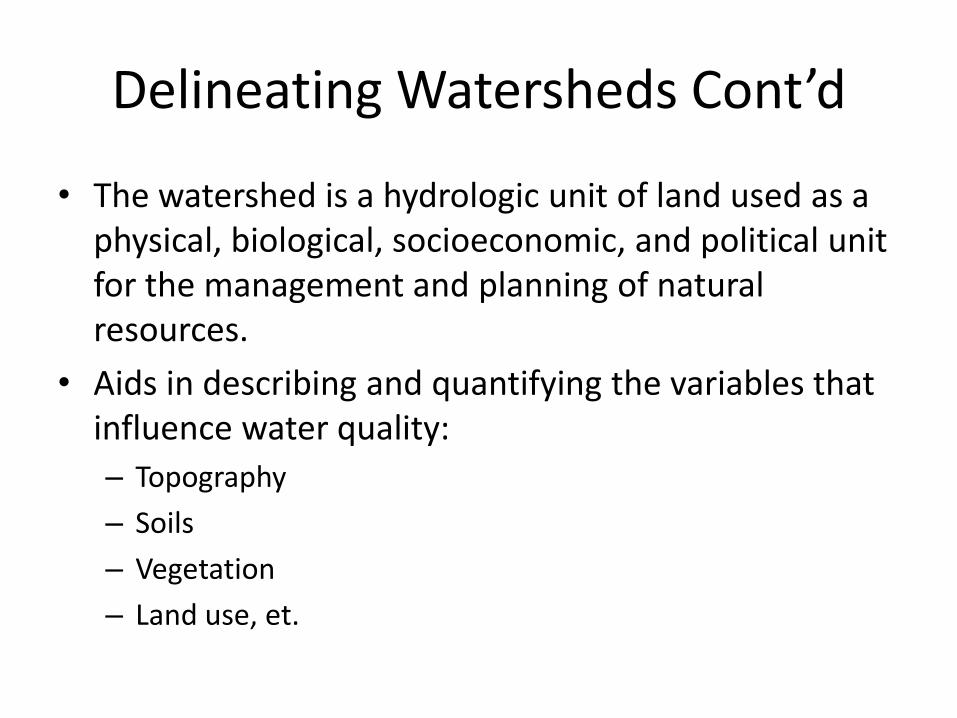
• The watershed is a hydrologic unit of land used as a physical, biological, socioeconomic, and political unit for the management and planning of natural resources.
• Aids in describing and quantifying the variables that influence water quality:
– Topography
– Soils
– Vegetation
– Land use, et.
Delineating Watersheds Cont’d

Identifying Watershed Boundaries
• Steps to delineation– Trace/outline outline the main stem of the stream
that you want to examine
– Trace all perennial or influential tributaries
– Locate the lowest point/outlet of the main stem and work uphill
• Working uphill, Identify the ridges and hill tops that divide the water from flowing into separate watersheds
• When in doubt, consider, – Where will the rain drops go
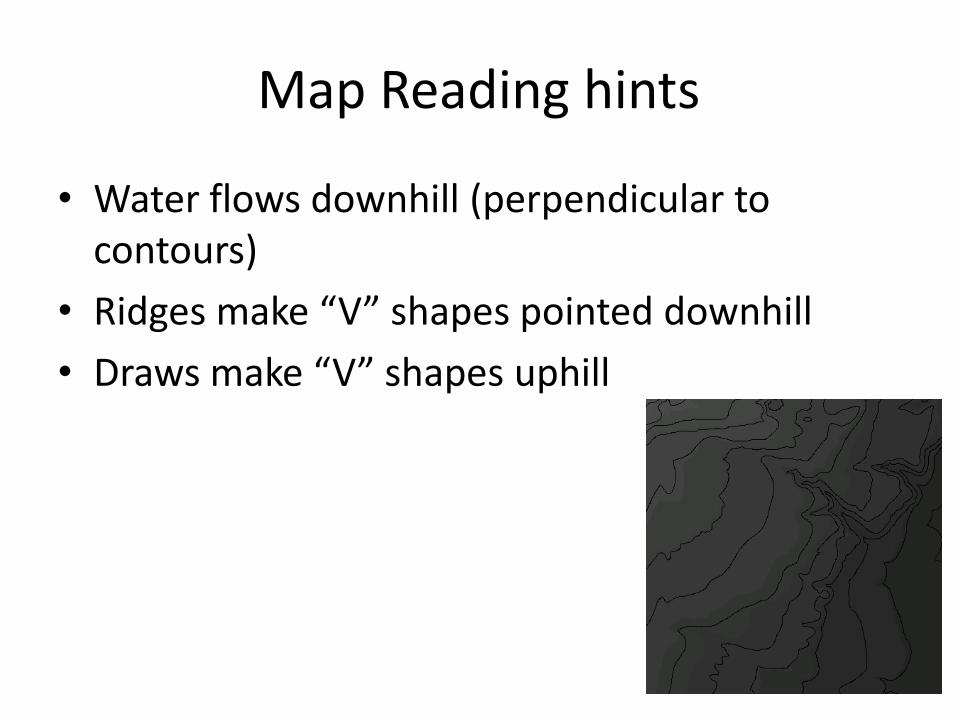
Map Reading hints
• Water flows downhill (perpendicular to contours)
• Ridges make “V” shapes pointed downhill
• Draws make “V” shapes uphill

Area / Size
• Important to watershed features because
– Estimating total annual water yield
– Flood potential
– Hydro characteristics: drainage density, time of concentration, drainage shape, etc..
– Amount of ground that you must deal with

Methods to Determine Size
• Planimeter
• GIS
• Historical Data (USGS etc.)
• Dot method using a grid

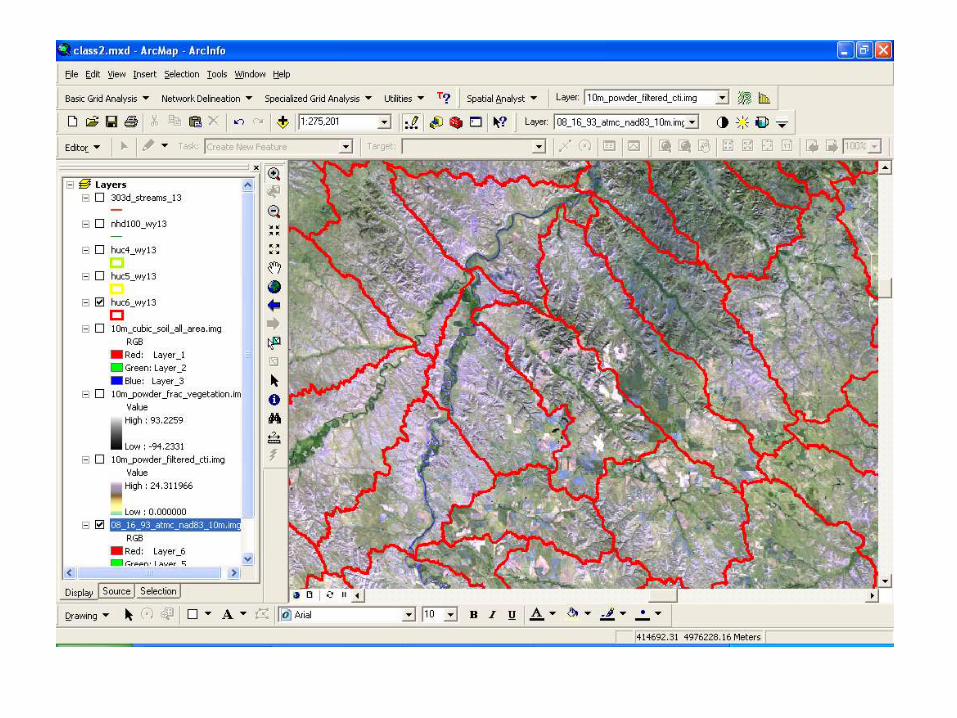
GIS as a measuring tool
• Polygons have an area column

Aspect and Orientation
• Different watersheds have unique differences and aspect has an affect
– Watersheds with south facing slopes are dryer due to evapotransperation and vegetation.
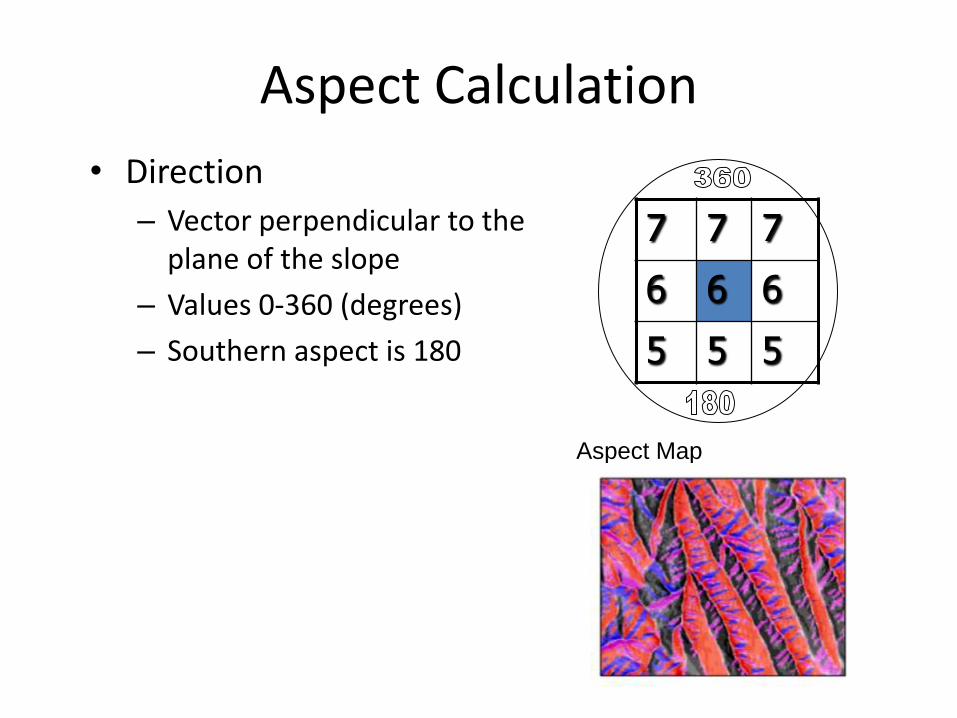
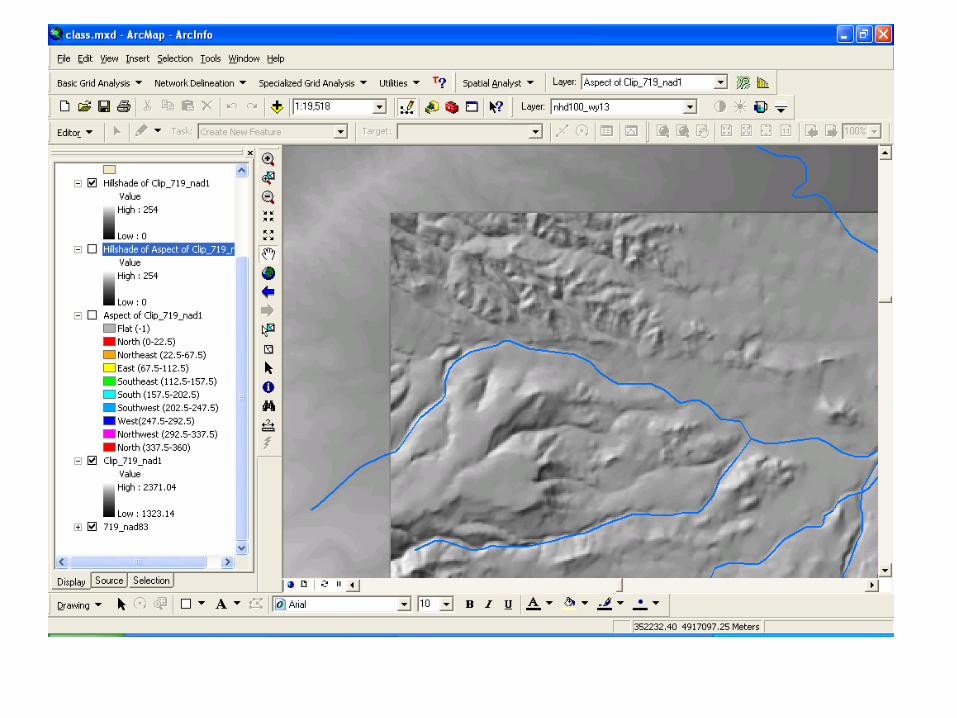
Aspect Calculation
• Direction
– Vector perpendicular to the plane of the slope
– Values 0-360 (degrees)
– Southern aspect is 180
7 7 7
6 6 6
5 5 5
Aspect Map

Aspect and Orientation
• Orientation- the General of the main stem of the watershed
– Obtain total stream length
– Determine 10% from the top and 15 % from the bottom
– Connect these points and get the aspect of that line
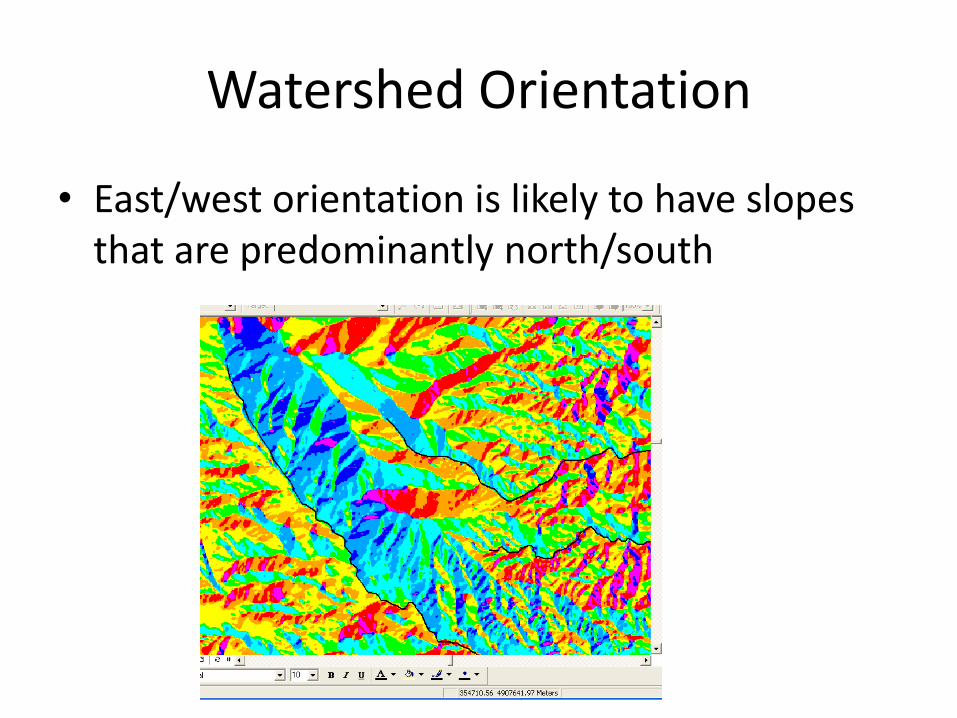
Watershed Orientation
• East/west orientation is likely to have slopes that are predominantly north/south
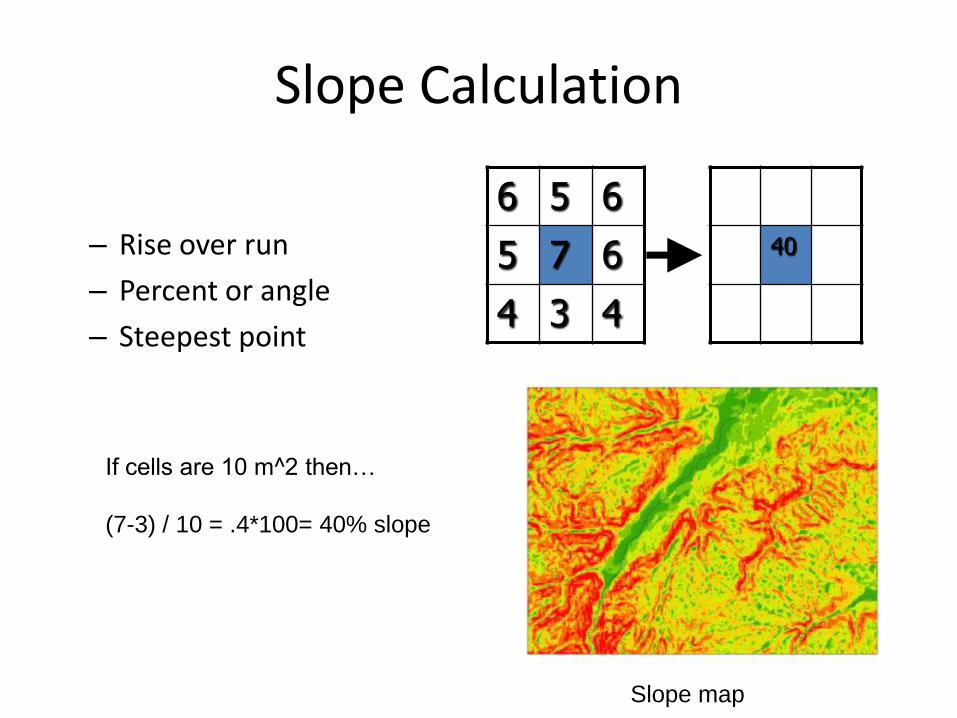
Slope Calculation
– Rise over run
– Percent or angle
– Steepest point
6 5 6
5 7 6
4 3 4
If cells are 10 m^2 then…
(7-3) / 10 = .4*100= 40% slope
40
Slope map
Slope
• The vertical difference between the upper and lower most points divided by the horizontal difference in the points.
• Why is slope important”
– Runoff, stream transport power, sediment type and load, aggrading or degrading.
– Calculate for the entire reach and individual sites.

Stream Profile
• Graph that provides longitudinal profile of the stream.
– X-axis is stream mileage
– Y-Axis is elevation
• Stream profiles help to stratify zones
– Alpine, foothills, basins
• Locate sample sites
• Zones of erosion etc.
Profile Cont’d
• Using a 1:24,000 or better map
– Record interval at contours
– Using a graphing program, create a line graph with elevation as the y-axis and stream miles as the x-axis
Sinuosity
• The repetition downstream of patterns of channel curves for a given length of stream. (channel length / valley length)
• Measure of:– Bends
– Curves
– Meanders
• Sinuosity is important for:– Stream Classification
– Variation in erosion and sediment concentration
Calculating Sinuosity
• GIS
• Longitudinal Profiles in the field
• Standard Map and Map Wheels

Stream Order
• Characterizes the drainage networks
• Broad reference for flow characteristics of a watershed
• Higher streams usually mean higher flow volume
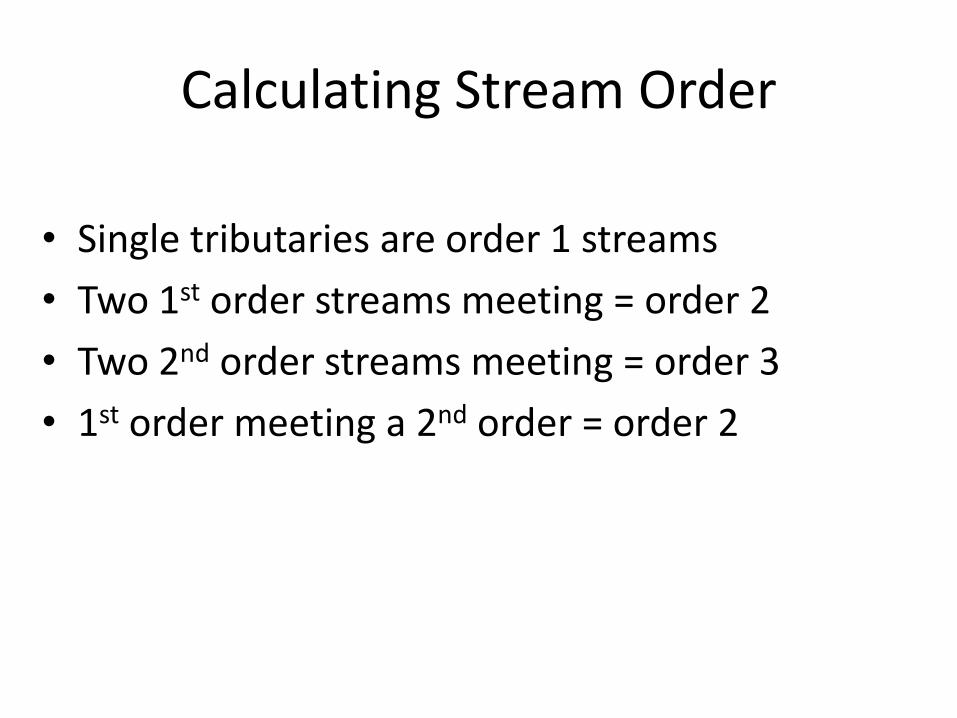
Calculating Stream Order
• Single tributaries are order 1 streams
• Two 1st order streams meeting = order 2
• Two 2nd order streams meeting = order 3
• 1st order meeting a 2nd order = order 2


Watershed Shape
• Watershed shape has an effect on flow characteristics
• Shape can be calculated by form factors and circulatory ratios
• Circular watersheds will concentrate water quickly and have a flashy discharge
• Long narrow watersheds tend to have steep slopes, high overland flow, high sediment yields, lower peak volumes over long periods of time.

WATER BALANCE APPROACH

1
1
1
1
1
1
1
1
1
11
1
2
2
3
2
3
3
“RIVER ORDO”

AB
C
D
E

Groundwater
AB
C
D
E
A
DCB E