hydrology literature applicable to us army corps of … us climate change and hydrology literature...
TRANSCRIPT

Recent US Climate Change and Hydrology Literature Applicable to US Army Corps of Engineers Missions MIDATLANTIC REGION 02
May 2015 FINAL


Climate Change Assessment for Water Resources Region 02 Mid-Atlantic Region
USACE Institute for Water Resources 1 May 18, 2015
CLIMATE CHANGE AND HYDROLOGY LITERATURE SYNTHESIS FOR THE US
ARMY CORPS OF ENGINEERS MISSIONS IN THE UNITED STATES
MID-ATLANTIC REGION 02
May 18, 2015
CDM Smith
Contract # W912HQ-10-D-0004, Task Order 147
Edited by:
Kathleen D. White PhD, PE, Institute for Water Resources - US Army Corps of Engineers
Jeffrey R. Arnold, PhD, Institute for Water Resources - US Army Corps of Engineers
Prepared by:
Chris Kurtz, PE, CDM Smith
Tim Cox, PhD, PE, CDM Smith
Frannie Bui, PE, CDM Smith
Lauren Klonsky, PE, CDM Smith
Lauren Miller, CDM Smith
Rebecca Jablon, AICP, LEED AP, CDM Smith
Quentin Smith, CDM Smith
Tim Feather, PhD, CDM Smith
Mark Dunning, PhD, CDM Smith
Larry Banks, CDM Smith
David Spector, CDM Smith
VIEWS, OPINIONS, AND/OR FINDINGS CONTAINED IN THIS REPORT SHOULD NOT
BE CONSTRUED AS AN OFFICIAL DEPARTMENT OF THE ARMY POSITION, POLICY,
OR DECISION UNLESS SO DESIGNATED BY OTHER OFFICIAL DOCUMENTATION.
Suggested Citation:
USACE (2015). Recent US Climate Change and Hydrology Literature Applicable to US Army
Corps of Engineers Missions – Water Resources Region 02, Mid-Atlantic. Civil Works
Technical Report, CWTS-2015-09, USACE, Washington, DC

Climate Change Assessment for Water Resources Region 02 Mid-Atlantic Region
USACE Institute for Water Resources 2 May 18, 2015
Table of Contents
Water Resources Region 02: Mid-Atlantic ......................................................... 3
1. Introduction ....................................................................................................................... 3
1.1 A Note on the Water Resources Region Scale ............................................................. 6
2. Observed Climate Trends ................................................................................................ 6
2.1. Temperature .................................................................................................................. 7
2.2. Precipitation ................................................................................................................ 13
2.3. Hydrology ................................................................................................................... 19
2.4. Summary of Observed Climate Findings ................................................................... 21
3. Projected Climate Trends .............................................................................................. 21
3.1. Temperature ................................................................................................................ 22
3.2. Precipitation ................................................................................................................ 27
3.3. Hydrology ................................................................................................................... 34
3.4. Summary of Future Climate Projection Findings ....................................................... 39
4. Business Line Vulnerabilities ......................................................................................... 41
Appendix A: References Climate/Hydrology Summary Table .......................................... 44
Appendix B: Reference List ................................................................................................... 45

Climate Change Assessment for Water Resources Region 02 Mid-Atlantic Region
USACE Institute for Water Resources 3 May 18, 2015
Water Resources Region 02: Mid-Atlantic Region
1. Introduction
U.S. Army Corps of Engineers (USACE) staff are increasingly considering potential climate
change impacts when undertaking long-term planning, setting priorities, and making decisions
that affect resources, programs, policies, and operations, consistent with the 2011 and 2014
policy statements on climate change adaptation by the Assistant Secretary of the Army for Civil
Works, the USACE Climate Change Adaptation Plans, and agency policy and guidance. USACE
is undertaking its climate change preparedness and resilience planning and implementation in
consultation with internal and external experts using the best available – and actionable – climate
science and climate change information. This report represents one component of actionable
science, in the form of concise and broadly-accessible summaries of the current science with
specific attention to USACE missions and operations. This report is part of a series of twenty one
(21) regional climate syntheses prepared by the USACE under the leadership of the Response to
Climate Change Program at the scale of 2-digit U.S. Geological Survey (USGS) Hydrologic
Unit Codes (HUC) across the continental United States, Alaska, Hawaii, and Puerto Rico. The
twenty one Water Resources Regions included in this series of reports is shown in Figure 1.1
along with USACE division boundaries. Each of these regional reports summarizes observed
and projected climate and hydrological patterns cited in reputable peer-reviewed literature and
authoritative national and regional reports, and characterizes climate threats to USACE business
lines. They also provide context and linkage to other agency resources for climate resilience
planning, such as sea level change calculation and coastal risk reduction resources, downscaled
climate data for subregions, and watershed vulnerability assessment tools.
This report focuses on Water Resources Region 02, the Mid-Atlantic Region, the boundaries for
which are shown in Figure 1.2. The New York, Philadelphia, Baltimore, and Norfolk USACE
districts each include territory within the region.

Climate Change Assessment for Water Resources Region 02 Mid-Atlantic Region
USACE Institute for Water Resources 4 May 18, 2015
Figure 1.1. 2-digit Water Resources Region Boundaries for the Continental United States,
Alaska, Hawaii, and Puerto Rico.

Climate Change Assessment for Water Resources Region 02 Mid-Atlantic Region
USACE Institute for Water Resources 5 May 18, 2015
Figure 1.2. Water Resources Region 02: Mid-Atlantic Region Boundary.

Climate Change Assessment for Water Resources Region 02 Mid-Atlantic Region
USACE Institute for Water Resources 6 May 18, 2015
1.1 A Note on the Water Resources Region Scale
USACE and other resource management agencies require reliable, science-based methods for
incorporating climate change information into the assessments that support water resources
decisions and actions. Such planning assessments must quantify projections of future climate and
hydrology. One common practice is to begin by developing relationships between the currently
observed climate and the projected future possible climate over the assessment region.
However, the numerical models producing these multiple projections of future possible climate
were not designed to support these assessments for local-to-regional scale operations. This
means that intervening steps have to be taken to correct obvious biases in the models' outputs
and to make the outputs relevant at the scales where hydrologic resource assessments can take
place. The commonly used name for these post-processing steps is "downscaling" because one
step is using one or another method to spatially (and temporally) disaggregate or interpolate the
results produced at the numerical climate models' native scale to the scale of the water resources
assessment. The current generation of climate models, which includes the models used to
generate some of the inputs described in this work, have a native scale on the order of one to two
hundred kilometers on each side of the grids used to simulate climate for Earth, substantially too
coarse for the watershed assessments needed to inform resource assessment questions and
decisions.
On the other hand, these questions and decisions should not be addressed with model inputs at
scales so fine that they impart false precision to the assessment. False precision would appear by
suggesting that the driving climate model information can usefully be downscaled, by any
method, to individual river reaches and particular project locations, for example.
The approach at USACE is to consider the questions in need of climate change information at the
geospatial scale where the driving climate models retain the climate change signal. At present,
USACE judges that the regional, sub-continental climate signals projected by the driving climate
models are coherent and useful at the scale of the 2-digit HUC (Water Resources Region), and
that confidence in the driving climate model outputs declines below the level of a reasonable
trade-off between precision and accuracy for areas smaller than the watershed scale of the 4-digit
HUC (Water Resources Subregion). Hence, these summaries group information at the Water
Resources Region scale both to be guides into the climate change literature and to support the
vulnerability assessments USACE is conducting at the Water Resources Subregion scale. For
Water Resources Region 02, both the 2-digit and 4-digit HUC boundaries are shown in Figure
1.2.
2. Observed Climate Trends
Observed climate trends within Water Resources Region 02 are presented in this section to
generally characterize current, or past, climate in the study region. While the primary cause for
global warming is attributed by the scientific community to human-induced increases in
atmosphere levels of heat-trapping gases (Walsh et al., 2014) this section is not focused on
attribution or cause (either natural or unnatural). Rather, it is specifically focused on the
identification and detection of climate trends in the recent historical record. The

Climate Change Assessment for Water Resources Region 02 Mid-Atlantic Region
USACE Institute for Water Resources 7 May 18, 2015
interrelationships of Earth’s climate systems are complex and influenced by multiple natural and
unnatural (i.e., anthropogenic greenhouse gas emissions) forcings. When additional detail is
needed the reader is referred to the specific references cited, including the third National Climate
Assessment (NCA) which includes not only regional assessments but also foundational resources
related to climate science literacy.
The climate trends presented in this section are based on peer-reviewed literature on the subject
of observed climate. To the extent possible, studies specific to the Mid-Atlantic Region or its
sub-watersheds were relied upon. A focus is placed on identified primary variables including:
mean temperature
extreme temperatures
average precipitation
extreme precipitation events
mean streamflow
In addition to primary variables, peer-reviewed literature addressing climate change within the
geographic region or inclusive of Water Resources Region 02 (fully or partially) revealed
additional, secondary, climatic variables that have been studied such as the spring index (SI),
drought indices, and soil moisture.
The results presented below indicate mild upward trending in both temperature and precipitation
in the Mid-Atlantic Region over the past 50 to 100 years as the region has gotten warmer and
wetter. No such trends have been identified for streamflow, suggesting that the two climate
trends may be offsetting.
2.1. Temperature
A number of studies focused on observed trends in historical temperature were reviewed for this
report. These include both national scale studies inclusive of results relevant to the Mid-Atlantic
Region and regional studies focused more specifically and exclusively on the area. Results from
both types of studies, relevant to the Mid-Atlantic Region, are discussed below.
A 2009 study by Wang et al. examined historical climate trends across the continental U.S.
Gridded (0.5 degrees x 0.5 degrees) mean monthly climate data for the period 1950 – 2000 were
used. The focus of this work was on the link between observed seasonality and regionality of
trends and sea surface temperature variability. The authors identified positive trends in recent
observed mean air temperature for most of the U.S. (Figure 2.1). The results represent the net
change in annual average value as predicted by a fitted linear regression on observed data
(regression coefficient multiplied by the length of the time period). For the Mid-Atlantic Region,
results generally indicate warming, up to 1 ºC (1.8 ºF), for the majority of the region for winter,
spring, and summer but a largely cooling trend <1 ºC (<1.8 °F) for autumn. The authors do not
provide information on statistical significance of the presented observed trends. A later study by
(Westby et al., 2013), using data from the period 1949 – 2011, contradicted these findings,
presenting a general (but not statistically significant) winter cooling trend for the majority of the
region for this time period.

Climate Change Assessment for Water Resources Region 02 Mid-Atlantic Region
USACE Institute for Water Resources 8 May 18, 2015
Figure 2.1. Linear trends in (a) air surface temperature and (b) precipitation over the United
States, 1950 – 2000. The Mid-Atlantic Region is within the black oval (Wang et al., 2009).
Grundstein and Dowd (2011) investigated trends in one-day extreme maximum and minimum
temperatures across the continental U.S. They used daily temperature data compiled by the
National Climatic Data Center (NCDC) for 187 stations across the country for the period 1949 –
2010. For the Mid-Atlantic Region, they found statistically significant increasing trends in the
number of one-day extreme minimum temperatures throughout most of the region. However, no
significant trends were found for one-day extreme maximum temperatures for the region.
Meehl et al. (2012) used a combination of observed climate data and model calculations to
analyze historical temperature changes across North America for the period 1950 – 1999. Results
(Figure 2.2) highlight the well documented “warming hole” observed in the eastern United
States. Unlike most of the rest of the country, the warming hole is characterized by a lack of
significant warming, or a net cooling (up to -1 ºC [-1.8 °F over 50 years), for the recent past. For
the winter months (December – February), the warming hole extends throughout the entire Mid-
Atlantic Region. For the summer months, the warming hole appears to cover only approximately
the southern half of the Mid-Atlantic Region, with summer warming reported for the northern
portion of the region (up to 1 ºC [1.8 °F] over 50 years). These results appear to agree with the
findings of Westby et al. (2013) (cooler winters) but not with those presented by Wang et al.
(2009) (warmer summers). Differences may be attributable to differences in temporal and spatial
scopes.

Climate Change Assessment for Water Resources Region 02 Mid-Atlantic Region
USACE Institute for Water Resources 9 May 18, 2015
Figure 2.2. Seasonal mean air temperature trends, 1950 – 1999, winter (December –
February, left panel) and summer (June – August, right panel). The Mid-Atlantic Region is
within the red oval (Meehl et al., 2012).
Schwartz et al. (2013) investigated changes in spring onset for the continental U.S. Their
particular focus was on changes in the seasonality of plant growth as dictated by changing
temperature regimes. The authors used historical data from over 22,000 stations across the
United States, obtained from the NCDC with periods of record extending through 2010. Their
findings indicate that for most of the Mid-Atlantic Region, spring onset is occurring at least a
few days earlier for the current period (2001 – 2010) compared to an earlier baseline reference
decade (1951 – 1960) (Figure 2.3). In other words, an apparent small shift in seasons has been
identified for most of the Mid-Atlantic Region, with spring warming occurring earlier than in the
past. These results seem to agree with the findings of Wang et al. (2009) (warmer winter and
spring).
Figure 2.3. Change in spring onset (first leaf date), in days for 2001 – 2010 compared to
1951 – 1960. The Mid-Atlantic Region is within the red oval (Schwartz et al., 2013).
More regionally, the third NCA report (Horton et al., 2014) cites a nearly 2 ºF (1.1 ºC) increase
in average annual temperature between 1895 and 2011 for the northeast region. This finding
seems to agree with the general warming trends cited by Wang et al. (2009) and is supported by
results presented by Huntington et al. (2009) that show a 1 – 3 degree increase in average annual
temperature for the northern portion of the region (New York State). For the southeast region
(Carter et al., 2014), which includes the southern portion of Mid-Atlantic Region, NCA data

Climate Change Assessment for Water Resources Region 02 Mid-Atlantic Region
USACE Institute for Water Resources 10 May 18, 2015
generally show mild warming of average annual temperatures in the early part of the 20th
century, followed by a few decades of cooling, followed again, more recently, by indications of
warming.
Cook et al. (2010) analyzed a new homogeneous climate record (1896 – 2006) for a watershed in
southern New York. They identified statistically significant (p < 0.05) increasing trends in
minimum, maximum, and mean annual temperature for their study site (Figure 2.4), with rates
of change in the range of 0.01 to 0.02 ºC (0.018 °F to 0.036 °F) per year. Additionally, the
authors identified statistically significant (p < 0.05) increasing trends in the occurrence of
extreme heat days for their study period and statistically significant decreasing trends in the
occurrence of extreme cold days. There appears to be no evidence of the “warming hole”
described above for this particular site. Similar results were presented three years earlier by
Burns et al. (2007), who identified statistically significant (p < 0.05) increasing trends in mean
air temperature for the majority of their climate stations in the Catskill Mountains in southern
New York. These authors used data from the period 1952 to 2005 and quantified an average rate
of increase in mean temperature of approximately 0.1 ºC (0.18 °F) per decade, similar to the rate
quantified by Cook et al. (2010).
Figure 2.4. Annual temperatures, 1896 – 2006, Mohonk Lake (NY) (Cook et al., 2010).
Brown et al. (2010) used an extended period data set (1893 – 2005) to investigate for trends in
climate extremes in the northeast. Results of this study (Figure 2.5) are mixed for the Mid-
Atlantic Region portion of the study area (New York and Pennsylvania). The early part of the
record exhibits largely increasing, and statistically significant, trends in the number of summer
high heat days, while the latter part of the record exhibits primarily decreasing trends, or no trend
at all, for this same metric. The number of cold spells, however, appears to largely be on the
decline for this portion of the Mid-Atlantic Region, particularly for the most recent record.
Differences between the first half and the second half of the 20th century are also apparent in the
work presented by Warrach et al. (2006). These authors quantified a statistically significant (p <

Climate Change Assessment for Water Resources Region 02 Mid-Atlantic Region
USACE Institute for Water Resources 11 May 18, 2015
0.05) trend in average annual temperature for a station in southern New York over the entire 20th
century (at a rate of 0.01 ºC [0.018 °F] per year). However, the rate of increase during the first
half of the century was much higher than that during the latter half of the century.
a) Summer extreme heat days (> 25 ºC [77 °F])
b) Cold spell duration indicator (annual count of days with at least consecutive days with
temperatures below the 10th percentile)
Figure 2.5. Observed trends in climate-changes in extreme temperatures. 1893 – 1950 (left
panels), 1951 – 2005 (right panels). Large circles indicate statistical significance (p < 0.05).
The Mid-Atlantic Region is within the red oval (Brown et al., 2010).
Anandhi et al. (2013) analyzed changes in daily minimum temperatures, and more specifically
the occurrence of frost, in the Catskill Mountains of New York. They looked at both historical
trends, based on observations from the Northeast Regional Climate Center (1960 – 2008), and
future projections, based on multiple global climate models (GCMs) and greenhouse gas
emissions scenarios. Results (Figure 2.6) show clearly increasing trends in annual average daily
minimum temperatures (Tmin) (up to 0.5 ºC [0.9 ºF] per decade), and corresponding decreasing
trends in the number of frost days (up to 7 days per decade), for their study watersheds. Nearly
all appear to be statistically significant, although no significance levels are provided by the
authors. These results agree well with those presented a few years earlier by Cook et al. (2010)
described above, who also found a significant decrease in the number of extreme cold days in

Climate Change Assessment for Water Resources Region 02 Mid-Atlantic Region
USACE Institute for Water Resources 12 May 18, 2015
New York State. The results do appear, however, to generally contradict the more regional
results presented by Meehl et al. (2012), which indicate a cooling trend in winter temperatures
for the northeast United States.
a) Annual average daily minimum temperature (Tmin) (ºC)
b) Number of annual frost days
Figure 2.6. Historical trends in daily minimum temperatures and the occurrence of frost,
Catskill Mountains (New York) watersheds (Anandhi et al., 2013).
Key point: There has been an apparent warming in the region over the past century, particularly
early in the century and then again in the past 30 to 40 years. There have also been noted
increasing trends in the number of extreme heat days and decreasing trends in the number of
extreme cold days. A large number of studies have focused on southern New York State, all of
which demonstrate significant warming trends in that region.

Climate Change Assessment for Water Resources Region 02 Mid-Atlantic Region
USACE Institute for Water Resources 13 May 18, 2015
2.2. Precipitation
Palecki et al. (2005) examined historical precipitation data from across the continental U.S. They
quantified trends in precipitation, by season, for the period 1972 to 2002 using NCDC 15-minute
rainfall data. For the Mid-Atlantic Region, no statistically significant (p < 0.05) trends were
found for storm magnitude, duration, or intensity for any season.
Grundstein (2009) identified statistically significant (p < 0.05) increasing trends in soil moisture
and total annual precipitation for the northern portion of the Mid-Atlantic Region (Figure 2.7)
over the past 100+ years (1895 – 2006). Soil moisture is a function of both supply (precipitation)
and demand (evapotranspiration [ET]), and therefore is an effective proxy for both precipitation
and ET. A number of sites in New York, Pennsylvania, New Jersey, and Maryland exhibit
significant increasing trends in both annual precipitation and soil moisture over the past century.
Figure 2.7. Statistically significant linear trends in (a) soil moisture index (unitless) and
(b) annual precipitation (cm) for the continental U.S. The Mid-Atlantic Region is within the
red oval (Grundstein, 2009).
As described in Section 2.1, a similar study by Wang et al. (2009) also focused on historical
climate trends across the continental U.S. using gridded climate data and a shorter period of
record (1950 – 2000). The authors identified generally positive trends in annual precipitation for
most of the U.S. For the Mid-Atlantic Region, mostly positive trends in annual precipitation
were quantified for summer, fall, and spring, while mostly negative trends were quantified for
winter precipitation across the region. No information is provided with respect to statistical
significance of the reported trends.
A 2011 study by McRoberts and Nielsen-Gammon used a new continuous and homogenous data
set to perform precipitation trend analyses for sub-basins across the United States. The extended
data period used for the analysis was 1895 – 2009. Linear positive trends in annual precipitation
were identified for most of the U.S (Figure 2.8). For the Mid-Atlantic Region, in general
Climate Change Assessment for Water Resources Region 02 Mid-Atlantic Region
USACE Institute for Water Resources 14 May 18, 2015
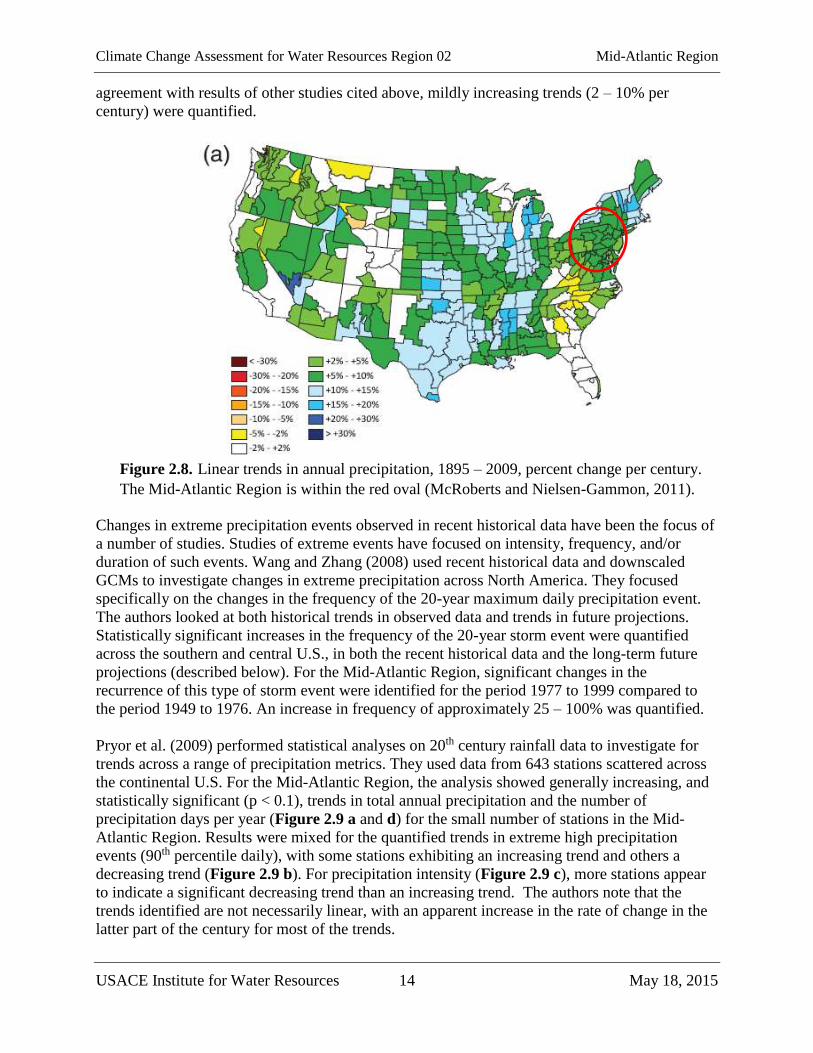
agreement with results of other studies cited above, mildly increasing trends (2 – 10% per
century) were quantified.
Figure 2.8. Linear trends in annual precipitation, 1895 – 2009, percent change per century.
The Mid-Atlantic Region is within the red oval (McRoberts and Nielsen-Gammon, 2011).
Changes in extreme precipitation events observed in recent historical data have been the focus of
a number of studies. Studies of extreme events have focused on intensity, frequency, and/or
duration of such events. Wang and Zhang (2008) used recent historical data and downscaled
GCMs to investigate changes in extreme precipitation across North America. They focused
specifically on the changes in the frequency of the 20-year maximum daily precipitation event.
The authors looked at both historical trends in observed data and trends in future projections.
Statistically significant increases in the frequency of the 20-year storm event were quantified
across the southern and central U.S., in both the recent historical data and the long-term future
projections (described below). For the Mid-Atlantic Region, significant changes in the
recurrence of this type of storm event were identified for the period 1977 to 1999 compared to
the period 1949 to 1976. An increase in frequency of approximately 25 – 100% was quantified.
Pryor et al. (2009) performed statistical analyses on 20th century rainfall data to investigate for
trends across a range of precipitation metrics. They used data from 643 stations scattered across
the continental U.S. For the Mid-Atlantic Region, the analysis showed generally increasing, and
statistically significant (p < 0.1), trends in total annual precipitation and the number of
precipitation days per year (Figure 2.9 a and d) for the small number of stations in the Mid-
Atlantic Region. Results were mixed for the quantified trends in extreme high precipitation
events (90th percentile daily), with some stations exhibiting an increasing trend and others a
decreasing trend (Figure 2.9 b). For precipitation intensity (Figure 2.9 c), more stations appear
to indicate a significant decreasing trend than an increasing trend. The authors note that the
trends identified are not necessarily linear, with an apparent increase in the rate of change in the
latter part of the century for most of the trends.

Climate Change Assessment for Water Resources Region 02 Mid-Atlantic Region
USACE Institute for Water Resources 15 May 18, 2015
a) annual precipitation
b) 90th percentile daily
precipitation
c) precipitation intensity
(annual total / number of
precipitation days)
d) number of
precipitation days per
year
Figure 2.9. Historical precipitation trends in the 20th century. a) Annual totals, b) 90th
percentile daily, c) precipitation intensity (annual total/number of precipitation days), and d)
number of precipitation days per year. Blue dots indicate positive trend, red circles indicate
negative trend, and symbol sizes are scaled to 3% change per decade. The Mid-Atlantic
Region is within the red oval (Pryor et al., 2009).
A number of recent studies have focused more specifically on the northeastern regions of the
U.S., including the Mid-Atlantic Region. As above, regional investigations have targeted trends,
or changes, in annual precipitation and the occurrence of extreme events. The third NCA report
(Horton et al., 2014) cites an approximately 10% increase in average annual precipitation
between 1895 and 2011 for the northeast region, inclusive of most of the Mid-Atlantic Region.
This study also cites a substantial increase in the amount of precipitation received in the region
from extreme heavy events. Both findings are well supported by the majority of the focused
studies described below.

Climate Change Assessment for Water Resources Region 02 Mid-Atlantic Region
USACE Institute for Water Resources 16 May 18, 2015
The work of Small et al. (2006) included analysis of the Mid-Atlantic Region specifically. These
authors investigated for significant trends in various precipitation and flow metrics based on
Hydro-Climatic Data Network (HCDN) climate data from 1948 to 1997. Statistically significant
(p < 0.05) increasing trends in fall precipitation were identified for the region for multiple
locations in the region (Figure 2.10 a). There were even more locations within the region,
however, where no statistically significant trends in fall precipitation were identified. For total
annual precipitation (Figure 2.10 b), no statistically significant trends were quantified for the
Mid-Atlantic Region.
Figure 2.10. Historical trends in a) precipitation, P, and b) streamflow, Q, 1948 – 1997. The
Mid-Atlantic Region is within the red oval (Small et al., 2006).
Burns et al. (2007) identified statistically significant (p < 0.05) increasing trends in annual
precipitation for half of their climate stations in the Catskill Mountains in southern New York.
These authors used data from the period 1952 to 2005 and quantified average rates of increase in
annual precipitation in the range of 79 to 263 mm per fifty years of record. However, no such
trend was found by Warrach et al. (2006) for a climate station also in southern New York State.
These authors analyzed annual precipitation totals for the period 1900 to 2000. While no
significant annual trends were detected, seasonal trends were detected: including decreasing
winter and summer monthly precipitation totals.
Cook et al. (2010) analyzed a new homogeneous climate record (1896 – 2006) for a watershed in
southern New York. They identified statistically significant (p < 0.05) increasing trends in total
three-month autumn (September – November) precipitation for their study site (Figure 2.11),
with an overall rate of change of nearly 1 mm year-1.

Climate Change Assessment for Water Resources Region 02 Mid-Atlantic Region
USACE Institute for Water Resources 17 May 18, 2015
Figure 2.11. Seasonal precipitation totals, September – November, at Mohonk Lake, New
York (Cook et al., 2010).
For the same part of the country, Brown et al. (2010) quantified a number of statistically
significant (p < 0.05) increasing trends in the number of annual extreme wet days (Figure 2.12)
since 1950. Prior to 1950, however, few significant trends were identified, and those that were
significant were decreasing. While extreme precipitation may be increasing in the region,
extreme snowfall is not, according to Kunkel et al. (2009). These authors investigated for trends
in the occurrence of extreme snowfall years for multiple regions in the U.S., including the
northeast (which includes all of the Mid-Atlantic Region). They used data back to 1950. Results
indicate no significant trends in the occurrence of extreme high snowfall years for this region,
but significantly increasing trends in the occurrence of extreme low snowfall years.
Figure 2.12. Observed trends in climate changes in the annual number of very wet days (> 95th
percentile). 1893 – 1950 (left panel), 1951 – 2005 (right panel). Large circles indicate
statistical significance (p < 0.05). The Mid-Atlantic Region is within the red oval (Brown et al.,
2010).
Nguyen and DeGaetano (2012) investigated for trends in high precipitation events, characterized
as “closed low” precipitation, on a regional basis for much of the U.S. They used a study period
of 1948 to 2007. Results show statistically significant (p < 0.05) increasing trends in frequency
and magnitude of these events for the northeast region, which includes most of the Mid-Atlantic
Region. These results appear to be supported by the work of Bonnin et al. (2011) who identified
statistically significant (p < 0.05) increasing trends in the occurrence of large storm events, of

Climate Change Assessment for Water Resources Region 02 Mid-Atlantic Region
USACE Institute for Water Resources 18 May 18, 2015
varying duration, in the Ohio River Region and surrounding states. Their study area includes
most of the Mid-Atlantic Region and their period of analysis was 1908 to 2007.
Maxwell et al. (2012) used tree ring reconstruction to develop an approximately 800-year record
(1200 – 2000) of May precipitation totals for the Mid-Atlantic Region. Results show increased
variability, with a disproportionate number of extreme wet and extreme dry periods, for the past
100 years compared to the previous centuries. A statistically significant (p < 0.05) increasing
trend in May precipitation was identified for the period 1895 to 1997 (Figure 2.13 a), although
similar large multi-decade oscillations are observed for earlier centuries (Figure 2.13 b).
a) 20th century May precipitation, tree ring vs. instrumental record. The light gray trend line
is significant at p < 0.001.
b) Full tree ring reconstruction, May precipitation. The dark black line is the fourth order
smoothing spline. The straight line is the median value.
Figure 2.13. Tree-ring reconstruction of May precipitation, Mid-Atlantic Region (Maxwell et
al., 2012).
A 2012 study by Patterson et al. focused exclusively on the South Atlantic regions, investigating
historical climate and streamflow trends. The northern portion of their study area (Virginia and
Maryland) is included in the Mid-Atlantic Region. Monthly and annual trends were analyzed for
a number of stations distributed throughout the southern half of the Mid-Atlantic Region for the
Climate Change Assessment for Water Resources Region 02 Mid-Atlantic Region
USACE Institute for Water Resources 19 May 18, 2015
period 1934 – 2005. Results identified little, if any, patterns of precipitation change in the region
over this period. Only one station, out of approximately 15 in the region, exhibited a statistically
significant (p < 0.05) trend (increasing). Most of the other stations in the region exhibited overall
increasing trends for the study period, but the trends were not statistically significant.
Trends in the frequency and severity of droughts in the Southeast U.S. were the subject of studies
by Chen et al. (2012) and Cook et al. (2014). In the first study, historical data (1895 – 2007) for
the southern U.S., including the southern edge of the Mid-Atlantic Region (Virginia), were used
to identify trends in drought, as defined by the standard precipitation index (SPI). The SPI is a
metric of precipitation only and neglects the impacts of ET on droughts (Chen et al., 2012). The
authors identified a slightly increasing significant (p < 0.05) trend in 12 and 6-month SPI
averaged over the entire study region, equating to higher precipitation rates and decreased
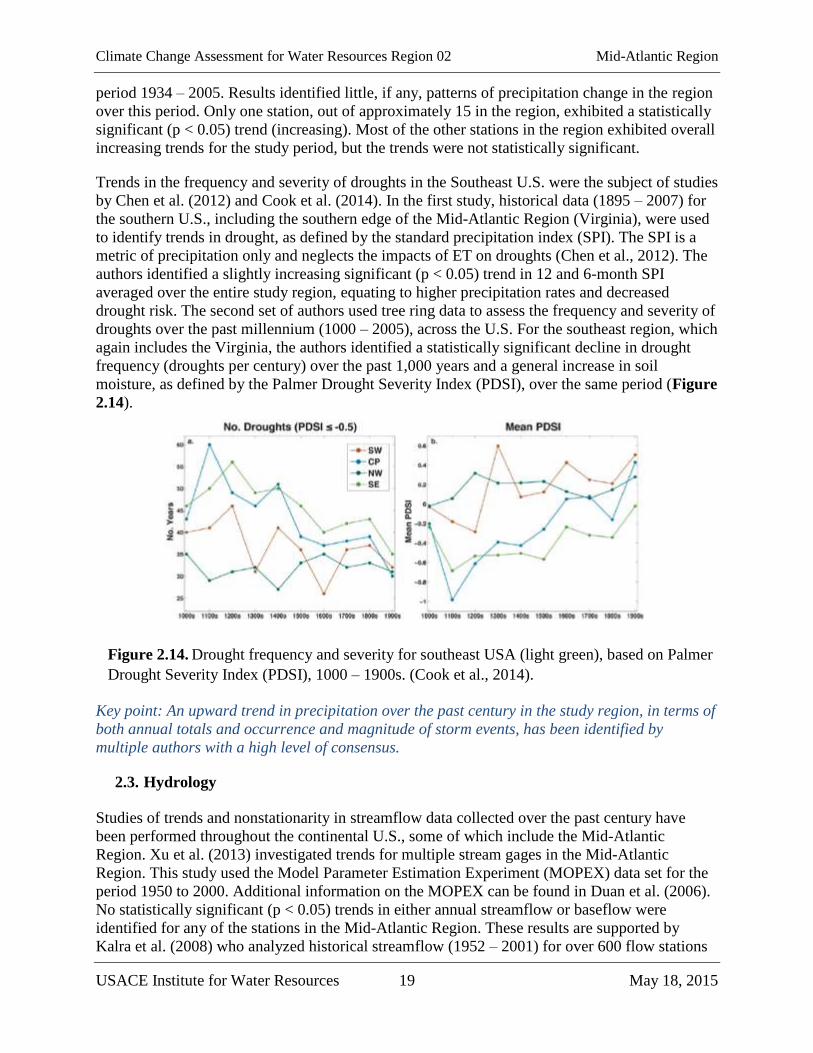
drought risk. The second set of authors used tree ring data to assess the frequency and severity of
droughts over the past millennium (1000 – 2005), across the U.S. For the southeast region, which
again includes the Virginia, the authors identified a statistically significant decline in drought
frequency (droughts per century) over the past 1,000 years and a general increase in soil
moisture, as defined by the Palmer Drought Severity Index (PDSI), over the same period (Figure
2.14).
Figure 2.14. Drought frequency and severity for southeast USA (light green), based on Palmer
Drought Severity Index (PDSI), 1000 – 1900s. (Cook et al., 2014).
Key point: An upward trend in precipitation over the past century in the study region, in terms of
both annual totals and occurrence and magnitude of storm events, has been identified by
multiple authors with a high level of consensus.
2.3. Hydrology
Studies of trends and nonstationarity in streamflow data collected over the past century have
been performed throughout the continental U.S., some of which include the Mid-Atlantic
Region. Xu et al. (2013) investigated trends for multiple stream gages in the Mid-Atlantic
Region. This study used the Model Parameter Estimation Experiment (MOPEX) data set for the
period 1950 to 2000. Additional information on the MOPEX can be found in Duan et al. (2006).
No statistically significant (p < 0.05) trends in either annual streamflow or baseflow were
identified for any of the stations in the Mid-Atlantic Region. These results are supported by
Kalra et al. (2008) who analyzed historical streamflow (1952 – 2001) for over 600 flow stations

Climate Change Assessment for Water Resources Region 02 Mid-Atlantic Region
USACE Institute for Water Resources 20 May 18, 2015
throughout the U.S., including a large number in the Mid-Atlantic Region. None of the stations
in the region exhibited statistically significant (p < 0.05) trends, in either direction, for annual or
seasonal streamflow.
These findings are further supported by a regional study by Small et al. (2006) (Figure 2.10,
above). This study, using HCDC data for the period 1948 – 1997, was not able to identify any
statistically significant trends in annual flow for any of their multiple stations distributed
throughout the Mid-Atlantic Region. A small number of stations in the region did exhibit
statistically significant (p < 0.05) increasing trends in fall low flow.
The Patterson et al. (2012) study identified significant (p < 0.05) decreasing trends in streamflow
for a number of flow stations in the southern portion of the Mid-Atlantic Region (Virginia) for
the period 1934 to 1969 (Figure 2.15). A small number of stations in the region exhibited
significant decreasing trends for the more recent period (1970 – 2000). However, for the entire
period of record (1934 – 2000), no significant trends were detected for stations within the Mid-
Atlantic Region.
Figure 2.15. Observed changes in annual streamflow for the South Atlantic Region. Mid-
Atlantic Region (Virginia) is within the red oval (Patterson et al., 2012).
Key point: No significant trends in historical streamflow, in either direction, have been identified
in the literature for the Mid-Atlantic Region.

Climate Change Assessment for Water Resources Region 02 Mid-Atlantic Region
USACE Institute for Water Resources 21 May 18, 2015
2.4. Summary of Observed Climate Findings
The general consensus in the recent literature points toward increases in annual temperature in
the Mid-Atlantic Region over the past century, particularly over the past 40 years and early in the
century. The region appears to be outside of the so-called “warming hole” identified by various
researchers. The literature also points toward an increasing trend in the number of extreme heat
days and a decrease in the number of extreme cold days.
There is also good consensus in the literature that precipitation, and the occurrence of extreme
storm events, has increased over the past century in the study region. However, despite the
increased precipitation in the region, there is no evidence of significant increases in streamflow
over the same period. This paradox is discussed by Small et al. (2006) who attribute it largely to
seasonal differences in the timing of the changes in precipitation versus streamflow. Results
presented here also suggest that increasing temperatures may play an additional role in the lack
of streamflow sensitivity to precipitation changes in the region.
3. Projected Climate Trends
While historical data is essential to understanding current and future climate, nonstationarity in
the data (i.e., a changing climate) dictates the use of supplemental information in long-term
planning studies. In other words, the past may no longer be a good predictor of the future (Milly
et al., 2005). Consequently, the scientific and engineering communities are actively using
computer models of the Earth’s atmosphere and associated thermodynamics to project future
climate trends for use in water resources planning efforts. Although significant uncertainties are
inherent in these model projections, the models, termed GCMs, are widely accepted representing
the best available science on the subject, and have proven highly useful in planning as a
supplement to historical data. A wealth of literature now exists on the use of GCMs across the
globe.
This section summarizes projected climate trends, as projected by GCMs, within the Mid-
Atlantic Region identified in a review of recent peer-reviewed literature. The information
presented should be considered an overview and, similar to Section 2 on observed climate
trends, does not focus on attribution or causation of the projected climate trends or the causal
relationships between climate variables. These relationships are complex and influenced by
multiple natural and unnatural (i.e., anthropogenic greenhouse gas emissions) forcings that
influence the Earth’s climate system. Typical of projected climate studies, often specific (and
sometimes multiple) greenhouse gas emission scenarios (or representative concentration
pathways) are modeled by a single GCM (or ensemble of GCMs). The spectrum of scenarios
offer a wide range of “climate futures” so each study’s assumed emission scenario(s) are noted.
When additional detail is needed the reader is referred to the specific references cited, including
the third National Climate Assessment (NCA) which includes not only regional assessments but
also foundational resources related to climate science literacy, GCMs, and emission scenarios.
The USACE vulnerability assessments (https://corpsclimate.us/rccvar.cfm) rely on downscaled
climate projection data and hydrologic simulations produced by USACE in conjunction with
Lawrence Livermore National Laboratory, Bureau of Reclamation, U.S. Geological Survey,
Climate Central, Scripps Oceanographic Institute and Santa Clara University, and others. The

Climate Change Assessment for Water Resources Region 02 Mid-Atlantic Region
USACE Institute for Water Resources 22 May 18, 2015
data are housed in the publicly accessible Downscaled Climate and Hydrology Projections
website archive, hosted by Lawrence Livermore National Laboratory, which is meant to provide
access to climate and hydrologic projections at spatial and temporal scales relevant to watershed
water resources management decisions. These data, and the vulnerability assessments for which
they provide a foundation, serve as supplements to the information about projected climate
conditions provided in this report.
Results of this review indicate a strong consensus in the scientific literature that air temperatures
will trend sharply upward over the next century in the Mid-Atlantic Region. There is less
consensus on the future trending of precipitation and streamflow in the region. However, most
studies project an increase in both precipitation and streamflow for the region, particularly
extreme high events.
3.1. Temperature
GCMs have been used extensively to project future climate conditions across the country. At a
national scale, model projections generally show a significant warming trend throughout the 21st
century, with a high level of consensus across models and modeling assumptions. There is much
less consensus on future patterns of precipitation. Results of studies inclusive of the Mid-Atlantic
Region typically fall in line with both of these generalizations.
Maximum air temperature projections were investigated by Liu et al. (2013) using a single GCM
and assuming an A2 greenhouse gas emissions scenario (worst case). The results of their study,
specific to the Mid-Atlantic Region, show a projected increase in winter and spring maximum air
temperature of about 2 ºC (3.6 ºF) for a 2055 planning horizon compared to a baseline period of
1971 – 2000 (Figure 3.1). They show projected increases of up to 3.5 ºC (6.3 ºF) for summer
and fall temperatures.
Figure 3.1. Projected changes in seasonal maximum air temperature, ºC, 2055 vs. 1985. The
Mid-Atlantic Region is within the red oval (Liu et al., 2013).
Similar results are presented by Scherer and Diffenbaugh (2014). These authors apply a multi-
member ensemble GCM, assuming an A1B (middle of the road) emissions scenario, to the
continental U.S. For the northeast region of the country, including the Mid-Atlantic Region,

Climate Change Assessment for Water Resources Region 02 Mid-Atlantic Region
USACE Institute for Water Resources 23 May 18, 2015
model projections indicate steadily increasing air temperatures throughout the 21st century for
both summer and winter seasons (Figure 3.2). By 2090, projections show an expected increase
of 5.2 ºC (9.4 ºF) in the summer and 1.7 ºC (3.1 ºF) in the winter, compared to a 1980 – 2009
baseline period. These results agree reasonably well with those described previously for Liu et al.
(2013).
a) b)
Figure 3.2. Probability distributions of GCM Projections of daily maximum temperatures
for Years 2000 – 2100 by decade, northeast region a) summer months, June – August, b)
winter months, December – February. Colors indicate the decade of the 21st century.
Probabilities on the vertical axis are in 0.01%. The value in the upper left-hand corner of
each box is the expected anomaly during the 2090s (Scherer and Diffenbaugh, 2014).
Elguindi and Grundstein (2013) present results of regional climate modeling of the U.S. focused
on the Thornthwaite climate type – a measure of the combination of relative temperature and
precipitation projections. For the Mid-Atlantic Region, results show a shift from primarily cool
wet or cold moist climate type in the latter decades of the 20th century to a larger proportion of
warm to cool moist/wet climate type areas by the period 2041 – 2070 (Figure 3.3).
a) Historical observed (1971 –
2000)
b) GCM projections (2041 – 2070)
Figure 3.3. Revised Thornthwaite climate types projected by regional climate models. The
Mid-Atlantic Region is within the red oval (Elguindi and Grundstein, 2013).

Climate Change Assessment for Water Resources Region 02 Mid-Atlantic Region
USACE Institute for Water Resources 24 May 18, 2015
Projected changes in temperature extremes were the subject of a study by Kunkel et al. (2010). In
this study, two different downscaled GCMs were applied to the continental U.S., assuming high
greenhouse gas emissions scenarios (A2 and A1F), with a focus on summer heat wave
occurrence and intensity. For the Mid-Atlantic Region, projections indicate a 4 to 5 ºC (7.2 to
9ºF) increase in three-day heat wave temperatures and a 40 to 60 day increase in the annual
number of heat wave days for a 2090 planning horizon compared to a recent historical baseline.
At a regional scale, Gao et al. (2012) focused on future extreme climate events in the eastern
U.S., as forecast by GCMs. They applied a single GCM downscaled to a high resolution grid (4
km x 4 km) that included the entire Mid-Atlantic Region n and a single planning horizon
centered on 2058. A single representative concentration pathway was simulated, representative
of intensive future fossil fuel use and high greenhouse gas emissions. Results show projected
increases in heat wave intensity, duration, and frequency for the study region (Figure 3.4).
Extreme heat wave temperatures are projected to increase by up to 5 ºC (9 ºF) in the Mid-
Atlantic Region and the frequency of heat waves is projected to increase by 4 to 7 days per year,
compared to the baseline period (2001 – 2004). Heat wave durations are also predicted to
increase for most of the Mid-Atlantic Region, by up to 4 days per event.
a) Intensity (ºC)
b) Duration (days/event)
c) Frequency
(events/year)
Figure 3.4. GCM projections of heat wave patterns in eastern USA - intensity, duration,
frequency, for a 2058 planning horizon (compared to 2002 baseline); baseline (first column),
future (second column ), and difference between the two (third column). The Mid-Atlantic
Region is within the black oval (Gao et al., 2012).

Climate Change Assessment for Water Resources Region 02 Mid-Atlantic Region
USACE Institute for Water Resources 25 May 18, 2015
Matonse et al. (2013) used an integrated modeling approach to quantify the impacts of projected
climate change on a portion of New York City’s water supply system. Climate projections from
an ensemble of climate models, spanning three different greenhouse gas emission scenarios,
were used to generate climate inputs to hydrologic and water supply models for two future
planning horizons (2055’s and 2090’s). The authors applied a “delta” method whereby they used
model output to generate climate change factors that were then applied to historical climate to
develop future climate scenarios. Results of their work for the New York City region, show
projected increases in monthly average temperatures ranging from 1 to 4 ºC (1.8 to 7.2 ºF) for the
2055’s and from 2 to 6 ºC (3.6 to 10.8 ºF) for the 2090’s (Figure 3.5). Temperature increases are
projected for each calendar month, with the largest increases projected for July, August,
December, and January.
Figure 3.5. Projected monthly temperatures, ºC, for New York City, West of Hudson
Watershed. Baseline historical, 1927 – 2004 (solid line), range of future projections (box and
whisker plots) (Matonse et al., 2013).
Samal et al. (2012) also investigated the potential impacts of climate change on part of New
York City’s water supply: the Cannonsville Reservoir (southern New York State). The focus of
their study was reservoir thermal impacts. They used projections from three GCMs, applied for
three greenhouse gas emissions scenarios, to modify historical climate records (delta method) to
reflect future climate conditions associated with a 2081 to 2100 planning horizon. Results
indicate an increase in annual average air temperature of approximately 3 to 5 ºC (5.4 to 9 ºF),
depending on assumed emissions scenario compared to historical baseline (Figure 3.6).

Climate Change Assessment for Water Resources Region 02 Mid-Atlantic Region
USACE Institute for Water Resources 26 May 18, 2015
Figure 3.6. Projected future, 2081 – 2100, and historical baseline, annual average air
temperature for Cannonsville Reservoir. Projections for three different greenhouse gas
emissions scenarios are shown (A1B, A2, B1) (Samal et al., 2012).
Mean monthly daily minimum temperatures in the Catskill Mountain region of New York were
the subject of a study by Anandhi et al. (2013). As above, these authors used an ensemble of
GCM data, spanning three greenhouse gas emissions scenarios, to quantify future changes in
daily minimum temperatures and the occurrence of frost. They focused on two future planning
horizons: 2045 – 2065 and 2080 – 2100. For all calendar months and both planning horizons,
projections show a significant increase in mean daily temperatures, in the range of approximately
1 to 10 ºC (1.8 to 18 ºF), with the greatest increases projected for the winter months. These
results translate into projected decreases in the number of frost days and frost season length.
Najjar et al. (2009) used a projection ensemble from seven GCMs and two emissions scenarios to
evaluate climate change in three Mid-Atlantic watersheds: the Chesapeake Bay, the Delaware
Bay, and the Hudson River Estuary. Compared to historical baseline (1971 – 2000), the
ensemble of projections quantify a nearly 3 ºC (5.4 ºF) increase in average temperature by mid-
21st century and an approximately 5 ºC (9 ºF) increase by the end of the century (Table 3.1).
Table 3.1. Projected changes in mean annual temperature and precipitation ( + one standard
deviation) for three Mid-Atlantic estuaries (Najjar et al., 2009).

Climate Change Assessment for Water Resources Region 02 Mid-Atlantic Region
USACE Institute for Water Resources 27 May 18, 2015
The third NCA report (Horton et al., 2014) generally supports the findings presented above. This
report states that, for the northeast region of the U.S., climate model projections predict an
increase in the frequency, intensity, and duration of heat waves. Under the worst case (A2)
greenhouse gas emissions scenario, model projections indicate an increase in annual average
temperature of 4.5 to 10 ºF (2.5 to 5.5 ºC) for the region. The number of extreme heat days (over
90ºF) is projected to increase by more than 60 days per year by the middle of the 21st century,
compared to the end of last century (Figure 3.7).
Figure 3.7. Projected increase in the number of days per year with a maximum temperature
greater than 90 °F averaged between 2041 and 2070, compared to 1971 – 2000. The Mid-
Atlantic Region is within the black oval (Horton et al., 2014).
Key point: Strong consensus exists in the literature that projected temperatures in the study
region show a sharp increasing trend through the next century.
3.2. Precipitation
In line with projections for the rest of the country, projections of future changes in precipitation
in the Mid-Atlantic Region are variable and generally lacking in consensus among studies or
across models. The Liu et al. study (2013), described above, quantified significant increases in
winter and spring precipitation associated with a 2055 planning horizon, relative to a recent
historical baseline (1971 – 2000, centered around 1985), for the Mid-Atlantic Region (Figure
3.8). Smaller increases, or even slight decreases, are projected for the other two seasons.

Climate Change Assessment for Water Resources Region 02 Mid-Atlantic Region
USACE Institute for Water Resources 28 May 18, 2015
However, the authors also project slight increases in the severity of future droughts for the
region, as projected temperature and ET impacts outweigh the increases in precipitation.
Figure 3.8. Projected changes in seasonal precipitation, 2055 vs. 1985, mm. The Mid-
Atlantic Region is within the yellow oval (Liu et al., 2013).
More regionally, Thibeault and Seth (2014) use a suite of GCM projections from the recently
released Phase 5 Coupled Models Intercomparison Project (CMIP5) to evaluate projected
summer precipitation changes for the northeastern United States. They assume a high greenhouse
gas emissions scenario (RCP 8.5) for all projections. Results show reasonably high consensus
(four out of five models) that summer average daily precipitation will increase in the future for
most of the Mid-Atlantic Region (Figure 3.9). The projected increases range from 0.1 to 1.5
mm/day, with the high end being statistically significant (p < 0.05). One of the models (middle
map) shows a mix of projected changes: decreased precipitation along the coast and mild
increases inland.

Climate Change Assessment for Water Resources Region 02 Mid-Atlantic Region
USACE Institute for Water Resources 29 May 18, 2015
Figure 3.9. Projected changes in summer, June – August, mean precipitation (mm/day) for
eastern U.S., 2081 – 2100 vs. 1981 – 2000. Stippling indicates statistically significant (p <
0.05) differences. The Mid-Atlantic Region is within the red ovals (Thibeault and Seth,
2014).

Climate Change Assessment for Water Resources Region 02 Mid-Atlantic Region
USACE Institute for Water Resources 30 May 18, 2015
Tryhorn and Degaetano (2013) use a combination of GCM projections and empirical regression
models to evaluate future snowpack conditions in the northeast as a function of a changing
climate. Their study domain includes the northern half of the Mid-Atlantic Region. They apply
projections from a single GCM (HadCM3) and two assumed greenhouse gas emissions scenarios
(A2 and B1). The authors quantify an average decrease in annual maximum snow depth of
approximately 20% by the end of the century for the entire study region. Results for two specific
locations in the Mid-Atlantic Region (Maryland and New York, Figure 3.10 a and b) show
projected large (up to 50%) seasonal decreases in average daily snow pack for future decades
compared to a historical baseline for the A2 emissions scenario. Results also indicate a clear
increasing trend (significance not provided) in the annual number of days without snow, for a
site in Pennsylvania, through the end of the 21st century (Figure 3.10 c).
a) average daily snow depth (cm), Frostburg, Maryland
b) average daily snow depth (cm), Boonville, New York
c) number of days without snow cover
Figure 3.10. Projected changes in (a) and (b) average snowpack depth, and (c) days without
snow cover. For snowpack figures, historical baseline 1970 – 2000 (solid black line), 2010 –
2039 (black dotted line), 2040 – 2069 (grey dotted line), and 2070 – 2099 (grey solid). For
(c) snow cover days, both A2 and B1 scenarios are shown (thin lines), as well as 20 year
running averages (thick black and grey lines) (Tryhorn and Degaetano, 2013).

Climate Change Assessment for Water Resources Region 02 Mid-Atlantic Region
USACE Institute for Water Resources 31 May 18, 2015
The Matonse et al. (2013) study described above, in addition to temperature projections, also
present precipitation projections for their New York City area study region. Results, from an
ensemble of GCMs and emissions scenarios, indicate generally increasing monthly average
precipitation values, with respect to projected medians, for future planning horizons compared to
historical baseline (Figure 3.11). Variability in the projections, however, is higher compared to
temperature projections, with some months and GCMs projecting small decreases in
precipitation. These results are generally supported by another study of a similar geographic area
(Samal et al., 2012). GCM projections presented in this study indicate future increases in average
precipitation on the order of 15 to 20% for a 2081 – 2100 planning horizon, compared to
historical baseline (Figure 3.12).
Figure 3.11. Projected monthly precipitation (cm/day) for New York City West of Hudson
Watershed. Baseline historical 1927 – 2004 (solid line), and range of future projections (box
and whisker plots) (Matonse et al., 2013).
Figure 3.12. Projected future (2081 – 2100) and historical baseline, mean daily precipitation
for Cannonsville Reservoir. Projections for three different greenhouse gas emissions
scenarios are shown (A1B, A2, B1) (Samal et al., 2012).

Climate Change Assessment for Water Resources Region 02 Mid-Atlantic Region
USACE Institute for Water Resources 32 May 18, 2015
Ning et al. (2012) used an ensemble of nine GCMs and two downscaling methods to characterize
projected future changes in precipitation for the State of Pennsylvania. For a 2046 – 2065
planning horizon, the majority of projection data sets show small increases in both monthly
average precipitation (up to 10 mm/month) and average number of monthly precipitation days
(up to 1 day/month) (Figure 3.13). The uncertainty in these projections is highlighted by the fact
that a smaller number of projection sets indicate slight decreases in annual precipitation and
precipitation days.
Figure 3.13. Projected changes in monthly average precipitation, 2046 – 2065 vs. 1981 –
2000. Annual average (y-axis), monthly number of precipitation days (x-axis ), averaged
over 17 stations across Pennsylvania (Ning et al., 2012).
The study by Najjar et al. (2009) quantified an ensemble mean increase in annual precipitation
for three major Mid-Atlantic watersheds (Table 3.1, above). Mid and end of century projections
show an average 2 – 5% increase in annual precipitation for the study region, compared to
historical baseline (1971 – 2000). However, the uncertainty in these projections is reflected in the
relatively high standard deviations (3 – 12%) associated with these values.
Future projections of extreme events, including storm events and droughts, are the subject of
studies by Tebaldi (2006), Wang and Zhang (2008), and Gao et al. (2012). The first author, as
part of a global study, compared an ensemble of GCM projections for the southeast U.S. and a
2090 planning horizon with historical baseline data (1980 to 1999). They report small to
moderate increases in the number of high (> 10 mm) precipitation days for the region, the
number of storm events greater than the 95th percentile of the historical record, and the daily
precipitation intensity index (annual total precipitation divided by number of wet days). In other
words, the projections forecast increases in the occurrence and intensity of storm events by the
end of the 21st century for the general study region. Wang and Zhang (2008) used downscaled
GCMs to look at potential future changes in precipitation events across North America. They
used an ensemble of GCMs and a single high emissions scenario (A2) to quantify a significant
increase (c. 20 to 50%) in the recurrence of the current 20-year 24-hour storm event for their
future planning horizon (2075) and the general Mid-Atlantic Region (Figure 3.14). The
projected increases in storm frequency presented by Wang and Zhang (2008) appear to be more
significant than those projected by Tebaldi (2006), but there is agreement on the general trend.

Climate Change Assessment for Water Resources Region 02 Mid-Atlantic Region
USACE Institute for Water Resources 33 May 18, 2015
Figure 3.14. Projected risk of current 20-year, 24-hour precipitation event occurring in 2070
compared to historical (1974). A value of 2 indicates this storm will be twice as likely in the
future compared to the past. Black dots show the locations of stations. The Mid-Atlantic
Region is within the red oval (Wang and Zhang, 2008).

Climate Change Assessment for Water Resources Region 02 Mid-Atlantic Region
USACE Institute for Water Resources 34 May 18, 2015
The GCM applied in the Gao et al. (2012) study for the eastern U.S. generally projects increases
in the magnitude of annual total (up to 200 mm/year) and daily (up to 15 mm/day) extreme storm
events and in the frequency of storm events (up to 5 days/year), for their 2058 planning horizon
compared to current conditions (2001 – 2004) (Figure 3.15). Extreme events are defined as those
events equally or exceeding the 95th percentile event.
a) Annual total of extreme
events (mm/year)
b) Daily extreme storms
(mm/day)
c) Frequency of storm events
(days/year)
Figure 3.15. GCM projections of future precipitation patterns in eastern USA -annual
extreme totals, daily extremes, frequency of events, for a 2057 – 2059 planning horizon
(compared to 2001 – 2004 baseline); baseline (first column), future (second column), and
difference between the two (third column). The Mid-Atlantic Region is within the red oval
(Gao et al., 2012).
Key point: Reasonable consensus exists in the literature that total annual precipitation, as well
as the intensity and frequency of extreme storm events, will increase in the future for the Mid-
Atlantic Region. Significant uncertainty exists, however, with respect to the extent of these
increases.
3.3. Hydrology
A number of global and national scale studies have attempted to project future changes in
hydrology, relying primarily on a combination of GCMs and macro-scale hydrologic models.
These studies include projections of potential hydrologic changes in the Mid-Atlantic region.
Thomson et al. (2005) applied two GCMs, across a range of varying input assumptions, in
combination with the macro-scale Hydrologic Unit Model to quantify potential changes in water

Climate Change Assessment for Water Resources Region 02 Mid-Atlantic Region
USACE Institute for Water Resources 35 May 18, 2015
yield across the United States. Results are presented for both continuous spatial profiles across
the country (Figure 3.16) and for individual Water Resources Regions. For the Mid-Atlantic
Region, contradictory results are generated by the two GCMs. For the same set of input
assumptions, one model predicts significant decreases in water yield, the other projects
significant increases in water yield.
Figure 3.16. Projected change in water yield (from historical baseline), under various
climate change scenarios based on two GCM projections. The Mid-Atlantic Region is within
the red ovals (Thomson et al., 2005).
The results presented by (Thomson et al., 2005), described above, highlight the significant
uncertainties associated with global climate modeling, particularly with respect to hydrologic
parameters. Additional uncertainty is generated when these climate models are combined with
hydrologic models that carry their own uncertainty. This comparison and quantification of
uncertainty is the subject of a study completed by Hagemann et al. (2013). In this study, the
authors apply three GCMs, across two emission scenarios to seed eight different hydrologic
models for projecting precipitation, ET, and runoff on a global scale. Their findings, in
agreement with CDM Smith (2012), indicate that the uncertainty associated with macro-scale
hydrologic modeling is as great, or greater, than that associated with the selection of climate
models. Study projections for the general Mid-Atlantic Region show an overall increase in runoff
by approximately 80 mm per year for their future planning horizon (2071 – 2100) compared to
recent historical baseline (1971 – 2000) (Figure 3.17), assuming an A2 emissions scenario.

Climate Change Assessment for Water Resources Region 02 Mid-Atlantic Region
USACE Institute for Water Resources 36 May 18, 2015
Figure 3.17. Ensemble mean runoff projections (mm/year) for A2 greenhouse gas emissions
scenario, changes in annual runoff, 2085 vs. 1985. The Mid-Atlantic Region is within the red
oval (Hagemann et al., 2013).
More regionally, Stagge and Moglen (2013) used a stochastic statistical model to quantify
changes in mean and low flow for the Potomac River These authors used five GCMs applied for
three greenhouse gas emissions scenarios (A2, B1, A1B) as inputs to their stochastic climate
model to adjust historical flow records to reflect future climate conditions. Results (Tables 3.2
and 3.3) project primarily increases in annual flow (Table 3.2), mostly in winter and spring, but
largely decreases in critical low flow (7Q10) (Table 3.3), which occur during the summer
months. The uncertainty in these projections is highlighted by the range of values provided in the
tables.
Table 3.2. Projected percent change in mean annual flow for a range of GCMs, Potomac
River. (Stagge and Moglen, 2013).

Climate Change Assessment for Water Resources Region 02 Mid-Atlantic Region
USACE Institute for Water Resources 37 May 18, 2015
Table 3.3. Projected percent change in 7 day 10 year low flow (7Q10) for a range of GCMs,
Potomac River (Stagge and Moglen, 2013).
Gilroy and McCuen (2012) projected changes in annual 24-hour peak runoff as a function of a
combination of urbanization and climate change. They applied a suite of GCMs for the A1B
emissions scenario (middle of the road) and multiple 21st century planning horizons to a large
portion of the Mid-Atlantic region. They used the NRCS graphical peak discharge method to
translate changes in precipitation into changes in river discharge. Results (Figure 3.18) indicate
sequential increases in annual peak discharge, at all recurrence levels, through the 21st century.
These increased peak flows are a function of both increased peak precipitation (climate change)
and urbanization.
Figure 3.18. Projected changes in 24 hour flood (peak discharge) frequency curves as
functions of climate change and urbanization, Delaware, Virginia, Maryland region (Gilroy
and McCuen, 2012).
The increase in peak runoff projected by the studies described above was also identified in an
earlier study by Hejazi and Moglen (2008). These authors applied climate projections from two
GCMs in combination with a lumped mechanistic rainfall-runoff model to quantify future flow
conditions in the Maryland Piedmont region (within the Mid-Atlantic Region). In addition to
increases in peak runoff (due to increases in peak precipitation), results also show decreases in
statistical low flows (attributed to increased ET).

Climate Change Assessment for Water Resources Region 02 Mid-Atlantic Region
USACE Institute for Water Resources 38 May 18, 2015
Pradhanang et al. (2013) used a combination of GCM output and water balance hydrologic
modeling to project streamflow changes for a watershed in southern New York State (West
Branch of the Delaware River). They used an ensemble of nine GCMs for a single, middle of the
road, emissions scenario (A1B) and an end-of-century planning horizon (2081 – 2100). Results
(Figure 3.19) show a decreased snow pack and earlier snow melt, compared to historical
baseline (1964 – 2008), causing higher flows during the winter and lower flows during the spring
runoff period. Results also indicate increased stream flashiness in the study watershed with larger
and more abrupt changes in streamflow, primarily due to reduced snowpack and increased winter
rain. These results are generally supported by a similar studies performed by Mukundan et al.
(2013) and Matonse et al. (2013) for the same general area (New York City water supply
system). The first authors applied a suite of five GCMs for three different greenhouse gas
emissions scenarios (B1, A1B, A2) and two planning horizons (2055 and 2090).
As above, their results indicate decreased snowpack, earlier snow melt peak runoff, and
increased winter rain and streamflow. The second set of authors used an ensemble of 16 sets of
GCM projections to quantify future changes in streamflow and water supply. Their results
project an overall increase in median flow, as well as the same patterns of reduced snowpack and
earlier snowmelt described above, for the latter half of the 21st century compared to a recent
historical baseline period.
Figure 3.19. Projected streamflow, West Branch of the Delaware River (New York). 2081 –
2100 planning horizon vs. 1964 – 2008 baseline historical (Pradhanang et al., 2013).
Key points: While additional uncertainty is introduced by the use of hydrologic models, there is
moderate consensus that flows, particularly peak flows, will increase in the region through the
21st century as a result of increased precipitation. Low flows, however, are generally projected
to decrease in the future. For snowpack dominated watersheds in the region, studies predict
decreased snowpack and earlier snowmelt.
Climate Change Assessment for Water Resources Region 02 Mid-Atlantic Region
USACE Institute for Water Resources 39 May 18, 2015
3.4. Summary of Future Climate Projection Findings
There is strong consensus in the literature that air temperatures will increase in the study region,
and throughout the country, over the next century. The studies reviewed here generally agree on
an increase in mean annual air temperature of approximately 2 to 5 ºC by the latter half of the
21st century for the Mid-Atlantic region. The largest increases are projected for the summer
months. Reasonable consensus is also seen in the literature with respect to projected increases in
extreme temperature events, including more frequent, longer, and more intense summer heat
waves in the long-term future compared to the recent past.
Projections of precipitation and hydrology in the study region are less certain than those
associated with air temperature. However, the majority of the studies reviewed here project
increases in precipitation and streamflow through the 21st century. Extreme high events (storms
and floods), in particular, are projected to increase in the future. Low flows, however, have been
projected to decrease in the future as a result of the projected temperature (and ET) increases.
The trends and literary consensus of observed and projected primary variables noted above are
summarized for reference and comparison in Figure 3.20.

Climate Change Assessment for Water Resources Region 02 Mid-Atlantic Region
USACE Institute for Water Resources 40 May 18, 2015
Figure 3.20. Summary Matrix of Observed and Projected Climate Trends and Literary
Consensus.

Climate Change Assessment for Water Resources Region 02 Mid-Atlantic Region
USACE Institute for Water Resources 41 May 18, 2015
4. Business Line Vulnerabilities
The Mid-Atlantic Region encompasses a vast area in the eastern region of the United States.
USACE recognizes the potential impacts of future climate considering the exposure and
dependency of many of its projects on the natural environment. To assess the potential
vulnerabilities that climate change may pose on USACE’s missions, a set of primary USACE
business lines were identified. They include:
Navigation
Flood Risk Management
Water Supply
Ecosystem Restoration
Hydropower
Recreation
Emergency Management
Regulatory
Military Programs
Millions of tons of cargo are transported to the ports in the Mid-Atlantic region. By the end of
the century, the frequency and intensity of large storm events and associated flooding are also
expected to increase. This may impact the ability of cargo ships to dock at ports. The Mid-
Atlantic Region may experience increases in ambient air temperature and a broader range of
extremes in water availability, which has implications for water levels and thus the ability for
vessels to navigate and dock at freshwater ports, such as the Port of Philadelphia.
The region has experienced several historic flooding events, most recently Superstorm Sandy,
which impacted urban centers and local communities. USACE implements flood risk
management projects in the region, which include structural projects such as storm and hurricane
barriers. Annual precipitation, extreme storm events, and peak flows may increase in the region,
making flood risk management projects very important for reducing the residual flooding
impacts.
USACE also maintains and operates several fresh water supplies for aquifer replenishment for
agricultural uses. Managing competing water needs can be a challenge, especially when water
demand is high and water supply is low. While this report does not highlight the impacts of sea
level change, changes in coastal conditions can have impacts which penetrate to inland water
bodies. Sea levels along the Mid-Atlantic coastline of the United States are projected to increase
and may exacerbate salt water intrusion into freshwater water supply. Tools and information
related to sea level change can be found on the USACE Responses to Climate Change website
(USACE, 2014). Water supplies may also be strained due to increased temperatures and heat
waves in the summer months. Maintaining necessary flows for competing sources such as
navigation and ecosystem management, may present some significant, additional challenges to
an already complex water resource system.

Climate Change Assessment for Water Resources Region 02 Mid-Atlantic Region
USACE Institute for Water Resources 42 May 18, 2015
USACE implements several ecosystem restoration projects in the Mid-Atlantic Region, such as
examining existing ecosystems, developing watershed management plans, performing restoration
feasibility studies, executing comprehensive river restoration, and preserving and maintaining
natural habitats. Increased air temperatures and increased frequencies of drought, particularly in
the summer months, will result in increased water temperatures. This may lead to water quality
concerns, particularly for the dissolved oxygen levels, which are an important water quality
parameter for aquatic life. Increased air temperatures are associated with the growth of nuisance
algal blooms and influence wildlife and supporting food supplies.
Increased annual rainfall in the region may pose complications to planning for ecosystem needs
and lead to higher peak flows and lower low flows. This may be particularly true during dry
years, when water demands for conflicting uses may outweigh water supply. During wet years,
flooding may raise particular ecological concerns and may threaten ecosystems.
Recreational facilities in the Mid-Atlantic Region offer several benefits to visitors as well as
positive economic impacts. Increases in air temperature along extended heat waves in the
summer months and the increased frequency of extreme storm events have the potential to
decrease the number of visitors to USACE’s recreational facilities. Periods of extreme high heat
poses human health concerns and higher water temperatures can result in algal blooms and other
water quality issues which may cause health risks for those involved in aquatic activities. An
increase in extreme storm events may make recreational activity difficult, dangerous, or
impossible.
USACE has extraordinary capabilities to respond to natural disasters and other emergency
situations throughout the country, and it is a top priority. There are designated emergency
managers and assigned staff in each region and subregion that are able to quickly mobilize.
Extreme storm events are capable of creating emergency situations in which USACE would be
needed to provide assistance in the Mid-Atlantic Region. These types of storms are capable of
intense precipitation, winds, and storm surge in coastal areas. Since these may occur more
frequently, USACE can expect an increased need for their assistance in disaster response and
recovery.
USACE’s regulatory mission has a serious commitment to protecting aquatic resources while
allowing reasonable development. The climate projections may have indirect implications for
permitting in the region, and may result from modifications in federal laws and guidance. This
may spur stricter regulation or increase the permitting breadth and depth. While most of the
permitting processes may not change, the volume and frequency of the permitting requirements
may increase – thus increasing the permitting costs for projects.
In addition, USACE provides engineering, construction, real estate, environmental management,
disaster response, and other support or consulting services for the Army, Air Force, other
assigned U.S. Government agencies, and foreign governments. Environmental management
services include the rehabilitation of active and inactive military bases, formerly used defense
sites, or areas that house excess munitions. Expected changes in climate may necessitate
adjustments in rehabilitation approaches, engineering design parameters, and potential types of
military construction/infrastructure projects that USACE may be asked to support.
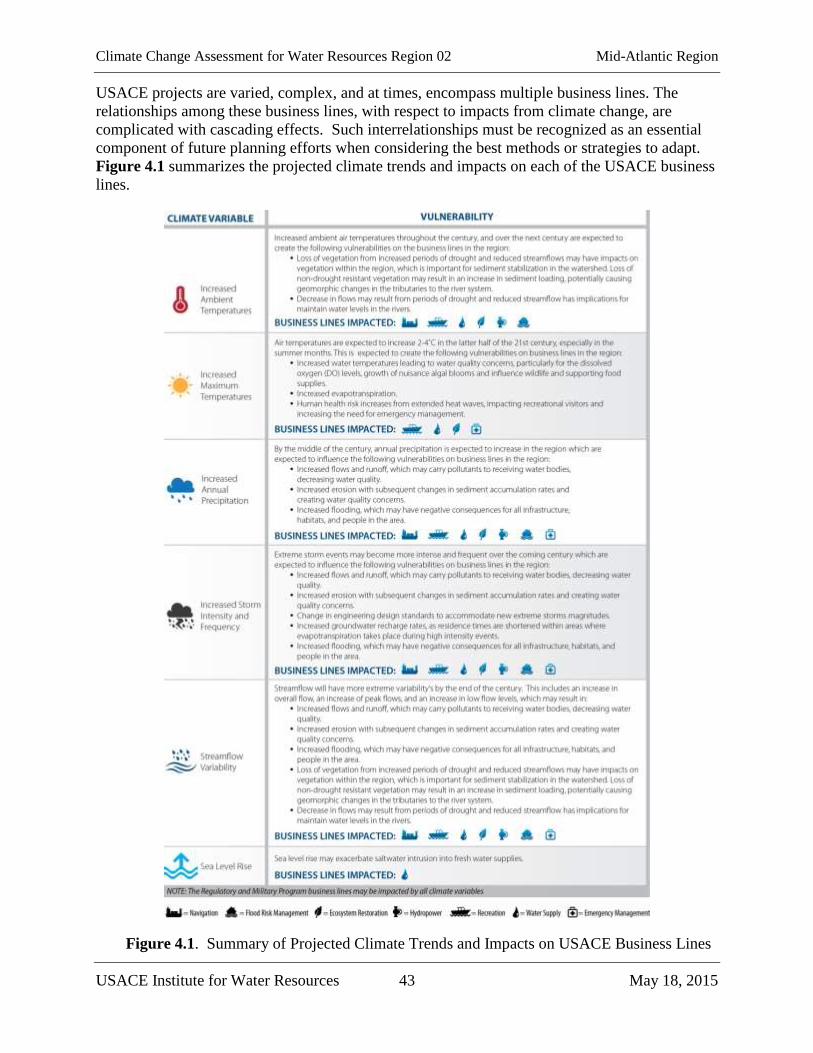
Climate Change Assessment for Water Resources Region 02 Mid-Atlantic Region
USACE Institute for Water Resources 43 May 18, 2015
USACE projects are varied, complex, and at times, encompass multiple business lines. The
relationships among these business lines, with respect to impacts from climate change, are
complicated with cascading effects. Such interrelationships must be recognized as an essential
component of future planning efforts when considering the best methods or strategies to adapt.
Figure 4.1 summarizes the projected climate trends and impacts on each of the USACE business
lines.
Figure 4.1. Summary of Projected Climate Trends and Impacts on USACE Business Lines

Climate Change Assessment for Water Resources Region 02 Mid-Atlantic Region
USACE Institute for Water Resources 44 May 18, 2015
Appendix A: References Climate/Hydrology Summary Table
Observed Projected
Me
an T
em
pe
ratu
re
Tem
pe
ratu
re M
inim
um
s
Tem
pe
ratu
re M
axim
um
s
Pre
cip
ita
tio
n
Pre
cip
ita
tio
n E
xtre
me
s
Hyd
rolo
gy/S
trea
mfl
ow
Dro
ugh
t In
dic
es
Soil
Mo
istu
re
Spri
ng
On
set
Ind
ex
Clim
ate
Cla
ssif
icat
ion
Me
an T
em
pe
ratu
re
Tem
pe
ratu
re M
inim
um
s
Tem
pe
ratu
re M
axim
um
s
Pre
cip
ita
tio
n
Pre
cip
ita
tio
n E
xtre
me
s
Hyd
rolo
gy/S
trea
mfl
ow
Dro
ugh
t In
dic
es
Soil
Mo
istu
re
Spri
ng
On
set
Ind
ex
Clim
ate
Cla
ssif
icat
ion
Anandhi, A., Zion, M.S., Gowda, P.H., Pierson, D.C., Lounsbury, D., Frei, A. (2013) X X X
Bonnin, G.M., Maitaria, K., Yekta, M. (2011) X
Brown, P.J., Bradley, R.S., Keimig, F.T. (2010) X X X
Burns, D.A., Klaus, J., McHale, M.R. (2007) X X
Carter, L.M., J. W. Jones, L. Berry, V. Burkett, J. F. Murley, J. Obeysekera, P. J. Schramm, and D. Wear, (2014) X
CDM Smith (2012) X
Chen, G., Tian, H., Zhang, C., Liu, M., Ren, W., Zhu, W., Chappelka, A.H., Prior, S.A., Lockaby, G.B. (2012) X X X
Cook, B.I., Cook, E.R., Anchukaitis, K.J., Huth, P.C., Thompson, J.E., Smiley, S.F. (2010) X X X X
Cook, B.I., Smerdon, J.E., Seager, R., Cook, E.R. (2014) X X X
Duan, Q., Schaake, J., Andreassian, V., Franks, S., Goteti, G., …, Sorooshian, S., Wagener, T., Wood, E.F. (2006) X
Elguindi, N., Grundstein, A. (2013) X X X
Gao, Y., Fu, J.S., Drake, J.B., Liu, Y., Lamarque, J.F. (2012) X X X
Gilroy, K.L., McCuen, R.H. (2012) X
Grundstein, A. (2009) X X
Grundstein, A., Dowd, J. (2011) X X
Hagemann, S., Chen, C., Clark, D.B., Folwell, S., Gosling, S.N., …, F., Wiltshire, A.J. (2013) X
Hejazi, M.I., Moglen, G.E. (2008) X
Horton R, Yohe R, Easterling W, Kates R, Ruth M, Sussman E, Whelchel A, Wolfe D, Lipschultz F (2014) X X X X
Huntington, T.G., Richardson, A.D., McGuire, K.J., Hayhoe, K. (2009) X
Kalra, A., Piechota, T.C., Davies, R., Tootle, G.A. (2008) X
Kunkel, K.E., Liang, X.-Z., Zhu, J. (2010) X
Kunkel, K.E., Palecki, M.A., Ensor, L., Easterling, D., Hubbard, K.G., Robinson, D., Redmond, K. (2009) X
Liu, Y., Goodrick, S.L., Stanturf, J.A. (2013) X X X X
Matonse, A.H., Pierson, D.C., Frei, A., Zion, M.S., Anandhi, A., Schneiderman, E., Wright, B. (2013) X X X
Maxwell, R.S., Hessl, A.E., Cook, E.R., Buckley, B.M. (2012) X X
McRoberts, D.B., Nielsen-Gammon, J.W. (2011) X
Meehl, G.A., Arblaster, J.M., Branstator, G. (2012) X X X
Mukundan, R., Pierson, D.C., Wang, L., Matonse, A.H., Samal, N.R., Zion, M.S., Schneiderman, E.M. (2013) X
Najjar, R., Patterson, L., Graham, S. (2009) X X
Ning, L., Mann, M.E., Crane, R., Wagener, T., Najjar Jr, R.G., Singh, R. (2012) X
Nguyen, L.T., DeGaetano, A.T. (2012) X
Palecki, M.A., Angel, J.R., Hollinger, S.E. (2005) X
Patterson, L.A., Lutz, B., Doyle, M.W. (2012) X X
Pradhanang, S.M., Mukundan, R., Schneiderman, E.M., Zion, M.S., Anandhi, A., …, Steenhuis, T.S. (2013) X
Pryor, S.C., Howe, J.A., Kunkel, K.E. (2009) X X
Samal, N.R., Pierson, D.C., Schneiderman, E., Huang, Y., Read, J.S., Anandhi, A., Owens, E.M. (2012) X X
Scherer, M., Diffenbaugh, N. (2014) X
Schwartz, M.D., Ault, T.R., Betancourt, J.L. (2013) X X
Small, D., Islam, S., Vogel, R.M. (2006) X X X
Stagge, J.H., Moglen, G.E. (2013) X
Tebaldi, C. (2006) X X X
Thibeault, J.M., Seth, A. (2014) X
Thomson, A.M., Brown, R.A., Rosenberg, N.J., Srinivasan, R., Izaurralde, R.C. (2005) X
Tryhorn, L., Degaetano, A. (2013) X X
Walsh, J., Wuebbles, D., Hayhoe, K., Kossin, J., Kunkel, K.E., …, Lenton, T., Kennedy, J., Somerville, R., (2014) X
Wang, H., Schubert, S., Suarez, M., Chen, J., Hoerling, M., Kumar, A., Pegion, P. (2009) X X X X
Wang, J., Zhang, X. (2008) X X
Warrach, K., Stieglitz, M., Shaman, J., Engel, V.C., Griffin, K.L. (2006) X X
Westby, R.M., Lee, Y.-Y., Black, R.X. (2013) X
Xu, X., Scanlon, B.R., Schilling, K., Sun, A. (2013) X
References

Climate Change Assessment for Water Resources Region 02 Mid-Atlantic Region
USACE Institute for Water Resources 45 May 18, 2015
Appendix B: Reference List
Anandhi, A., Zion, M.S., Gowda, P.H., Pierson, D.C., Lounsbury, D., Frei, A. (2013) Past and
future changes in frost day indices in Catskill Mountain region of New York. Hydrological
Processes 27, 3094-3104.
Bonnin, G.M., Maitaria, K., Yekta, M. (2011) Trends in rainfall exceedances in the observed
record in selected areas of the United States. Journal of the American Water Resources
Association 47, 1173-1182.
Brown, P.J., Bradley, R.S., Keimig, F.T. (2010) Changes in extreme climate indices for the
Northeastern United States, 1870-2005. Journal of Climate 23, 6555-6572.
Burns, D.A., Klaus, J., McHale, M.R. (2007) Recent climate trends and implications for water
resources in the Catskill Mountain region, New York, USA. Journal of Hydrology 336, 155-170.
Carter, L.M., J. W. Jones, L. Berry, V. Burkett, J. F. Murley, J. Obeysekera, P. J. Schramm, and
D. Wear, (2014) Southeast and the Caribbean. Climate Change Impacts in the United States: The
Third National Climate Assessment, in: Program, U.S.G.C.R. (Ed.), pp. 396-417.
CDM Smith (2012) Incorporating Climate Change into Water Supply Planning and Yield
Studies: A Demonstration and Comparison of Practical Methods
Chen, G., Tian, H., Zhang, C., Liu, M., Ren, W., Zhu, W., Chappelka, A.H., Prior, S.A.,
Lockaby, G.B. (2012) Drought in the Southern United States over the 20th century: Variability
and its impacts on terrestrial ecosystem productivity and carbon storage. Climatic Change 114,
379-397.
Cook, B.I., Cook, E.R., Anchukaitis, K.J., Huth, P.C., Thompson, J.E., Smiley, S.F. (2010) A
homogeneous record (1896-2006) of daily weather and climate at mohonk lake, New York.
Journal of Applied Meteorology and Climatology 49, 544-555.
Cook, B.I., Smerdon, J.E., Seager, R., Cook, E.R. (2014) Pan-Continental Droughts in North
America over the Last Millennium. Journal of Climate 27, 383-397.
Duan, Q., Schaake, J., Andreassian, V., Franks, S., Goteti, G., Gupta, H.V., Gusev, Y.M.,
Habets, F., Hall, A., Hay, L., Hogue, T., Huang, M., Leavesley, G., Liang, X., Nasonova, O.N.,
Noilhan, J., Oudin, L., Sorooshian, S., Wagener, T., Wood, E.F. (2006) Model Parameter
Estimation Experiment (MOPEX): An overview of science strategy and major results from the
second and third workshops. Journal of Hydrology 320, 3-17.
Elguindi, N., Grundstein, A. (2013) An integrated approach to assessing 21st century climate
change over the contiguous U.S. using the NARCCAP RCM output. Climatic Change 117, 809-
827.

Climate Change Assessment for Water Resources Region 02 Mid-Atlantic Region
USACE Institute for Water Resources 46 May 18, 2015
Gao, Y., Fu, J.S., Drake, J.B., Liu, Y., Lamarque, J.F. (2012) Projected changes of extreme
weather events in the eastern United States based on a high resolution climate modeling system.
Environmental Research Letters 7.
Gilroy, K.L., McCuen, R.H. (2012) A nonstationary flood frequency analysis method to adjust
for future climate change and urbanization. Journal of Hydrology 414-415, 40-48.
Grundstein, A. (2009) Evaluation of climate change over the continental United States using a
moisture index. Climatic Change 93, 103-115.
Grundstein, A., Dowd, J. (2011) Trends in extreme apparent temperatures over the United States,
1949-2010. Journal of Applied Meteorology and Climatology 50, 1650-1653.
Hagemann, S., Chen, C., Clark, D.B., Folwell, S., Gosling, S.N., Haddeland, I., Hanasaki, N.,
Heinke, J., Ludwig, F., Voss, F., Wiltshire, A.J. (2013) Climate change impact on available
water resources obtained using multiple global climate and hydrology models. Earth System
Dynamics 4, 129-144.
Hejazi, M.I., Moglen, G.E. (2008) The effect of climate and land use change on flow duration in
the Maryland Piedmont region. Hydrological Processes 22, 4710-4722.
Horton, R., Yohe, R., Easterling, W., Kates, R., Ruth, M., Sussman, E., Whelchel, A., Wolfe, D.,
Lipschultz, F., (2014) Ch. 16: Northeast. Climate Change Impacts in the United States: The
Third National Climate Assessment, Melillo, J.M., Richmond, Terese (T.C.), Yohe, G.W. ed,
U.S. Global Change Research Program, pp. 371-395.
Huntington, T.G., Richardson, A.D., McGuire, K.J., Hayhoe, K. (2009) Climate and
hydrological changes in the northeastern United States: Recent trends and implications for
forested and aquatic ecosystems. Canadian Journal of Forest Research 39, 199-212.
Kalra, A., Piechota, T.C., Davies, R., Tootle, G.A. (2008) Changes in U.S. streamflow and
Western U.S. snowpack. Journal of Hydrologic Engineering 13, 156-163.
Kunkel, K.E., Liang, X.-Z., Zhu, J. (2010) Regional climate model projections and uncertainties
of U.S. summer heat waves. Journal of Climate 23, 4447-4458.
Kunkel, K.E., Palecki, M.A., Ensor, L., Easterling, D., Hubbard, K.G., Robinson, D., Redmond,
K. (2009) Trends in twentieth-century U.S. extreme snowfall seasons. Journal of Climate 22,
6204-6216.
Liu, Y., Goodrick, S.L., Stanturf, J.A. (2013) Future U.S. wildfire potential trends projected
using a dynamically downscaled climate change scenario. Forest Ecology and Management 294,
120-135.
Matonse, A.H., Pierson, D.C., Frei, A., Zion, M.S., Anandhi, A., Schneiderman, E., Wright, B.
(2013) Investigating the impact of climate change on New York City's primary water supply.
Climatic Change 116, 437-456.

Climate Change Assessment for Water Resources Region 02 Mid-Atlantic Region
USACE Institute for Water Resources 47 May 18, 2015
Maxwell, R.S., Hessl, A.E., Cook, E.R., Buckley, B.M. (2012) A multicentury reconstruction of
may precipitation for the mid-atlantic region using Juniperus Virginiana tree rings. Journal of
Climate 25, 1045-1056.
McRoberts, D.B., Nielsen-Gammon, J.W. (2011) A new homogenized climate division
precipitation dataset for analysis of climate variability and climate change. Journal of Applied
Meteorology and Climatology 50, 1187-1199.
Meehl, G.A., Arblaster, J.M., Branstator, G. (2012) Mechanisms contributing to the warming
hole and the consequent U.S. East-west differential of heat extremes. Journal of Climate 25,
6394-6408.
Milly, P.C., Dunne, K.A., Vecchia, A.V. (2005) Global pattern of trends in streamflow and water
availability in a changing climate. Nature 438, 347-350.
Mukundan, R., Pierson, D.C., Wang, L., Matonse, A.H., Samal, N.R., Zion, M.S., Schneiderman,
E.M. (2013) Effect of projected changes in winter streamflow on stream turbidity, Esopus Creek
watershed in New York, USA. Hydrological Processes 27, 3014-3023.
Najjar, R., Patterson, L., Graham, S. (2009) Climate simulations of major estuarine watersheds in
the Mid-Atlantic region of the US. Climatic Change 95, 139-168.
Ning, L., Mann, M.E., Crane, R., Wagener, T., Najjar Jr, R.G., Singh, R. (2012) Probabilistic
projections of anthropogenic climate change impacts on precipitation for the mid-Atlantic region
of the United States. Journal of Climate 25, 5273-5291.
Nguyen, L.T., DeGaetano, A.T. (2012) A climatology of 500-hpa closed lows and associated
precipitation in the northeastern United States. Journal of Applied Meteorology and Climatology
51, 3-15.
Palecki, M.A., Angel, J.R., Hollinger, S.E. (2005) Storm precipitation in the United States. Part
I: Meteorological characteristics. Journal of Applied Meteorology 44, 933-946.
Patterson, L.A., Lutz, B., Doyle, M.W. (2012) Streamflow Changes in the South Atlantic, United
States During the Mid- and Late 20th Century. Journal of the American Water Resources
Association 48, 1126-1138.
Pradhanang, S.M., Mukundan, R., Schneiderman, E.M., Zion, M.S., Anandhi, A., Pierson, D.C.,
Frei, A., Easton, Z.M., Fuka, D., Steenhuis, T.S. (2013) Streamflow responses to climate change:
Analysis of hydrologic indicators in a new york city water supply watershed. Journal of the
American Water Resources Association.
Pryor, S.C., Howe, J.A., Kunkel, K.E. (2009) How spatially coherent and statistically robust are
temporal changes in extreme precipitation in the contiguous USA? International Journal of
Climatology 29, 31-45.

Climate Change Assessment for Water Resources Region 02 Mid-Atlantic Region
USACE Institute for Water Resources 48 May 18, 2015
Samal, N.R., Pierson, D.C., Schneiderman, E., Huang, Y., Read, J.S., Anandhi, A., Owens, E.M.
(2012) Impact of climate change on Cannonsville reservoir thermal structure in the New York
City water supply. Water Quality Research Journal of Canada 47, 389-405.
Scherer, M., Diffenbaugh, N. (2014) Transient twenty-first century changes in daily-scale
temperature extremes in the United States. Climate Dynamics 42, 1383-1404.
Schwartz, M.D., Ault, T.R., Betancourt, J.L. (2013) Spring onset variations and trends in the
continental United States: Past and regional assessment using temperature-based indices.
International Journal of Climatology 33, 2917-2922.
Small, D., Islam, S., Vogel, R.M. (2006) Trends in precipitation and streamflow in the eastern
U.S.: Paradox or perception? Geophysical Research Letters 33.
Stagge, J.H., Moglen, G.E. (2013) A nonparametric stochastic method for generating daily
climate-adjusted streamflows. Water Resources Research 49, 6179-6193.
Tebaldi, C. (2006) Going To The Extremes: An Intercomparison of Model-Simulated Historical
and Future Changes in Extreme Events. Climate Change 79, 185-211.
Thibeault, J.M., Seth, A. (2014) A framework for evaluating model credibility for warm-season
precipitation in northeastern north america: A case study of CMIP5 simulations and projections.
Journal of Climate 27, 493-510.
Thomson, A.M., Brown, R.A., Rosenberg, N.J., Srinivasan, R., Izaurralde, R.C. (2005) Climate
change impacts for the conterminous USA: An integrated assessment: Part 4: Water resources.
Climatic Change 69, 67-88.
Tryhorn, L., Degaetano, A. (2013) A methodology for statistically downscaling seasonal snow
cover characteristics over the Northeastern United States. International Journal of Climatology
33, 2728-2743.
Walsh, J., Wuebbles, D., Hayhoe, K., Kossin, J., Kunkel, K.E., Stephens, G., Thorne, P., Vose,
R.S., Wehner, M.F., Willis, J., Anderson, D., Kharin, V., Knutson, T., Landerer, F., Lenton, T.,
Kennedy, J., Somerville, R., (2014) Appendix 3: Climate Science Supplement, in: Melillo, J.M.,
Richmond, T.C., Yohe, G.W. (Eds.), Climate Change Impacts in the United States: The Third
National Climate Assessment. U.S. Global Change Research Program, pp. 735-789.
Wang, H., Schubert, S., Suarez, M., Chen, J., Hoerling, M., Kumar, A., Pegion, P. (2009)
Attribution of the seasonality and regionality in climate trends over the United States during
1950-2000. Journal of Climate 22, 2571-2590.
Wang, J., Zhang, X. (2008) Downscaling and projection of winter extreme daily precipitation
over North America. Journal of Climate 21, 923-937.
Warrach, K., Stieglitz, M., Shaman, J., Engel, V.C., Griffin, K.L. (2006) Twentieth century
climate in the New York Hudson Highlands and the potential impacts on eco-hydrological
processes. Climatic Change 75, 455-493.

Climate Change Assessment for Water Resources Region 02 Mid-Atlantic Region
USACE Institute for Water Resources 49 May 18, 2015
Westby, R.M., Lee, Y.-Y., Black, R.X. (2013) Anomalous temperature regimes during the cool
season: Long-term trends, low-frequency mode modulation, and representation in CMIP5
simulations. Journal of Climate 26, 9061-9076.
Xu, X., Scanlon, B.R., Schilling, K., Sun, A. (2013) Relative importance of climate and land
surface changes on hydrologic changes in the U.S. Midwest since the 1930s: Implications for
biofuel production. Journal of Hydrology 497, 110-120.

Prepared by:
www.cdmsmith.com