hydrothermal fluid evolution and metal transport in the ...eprints.brighton.ac.uk/11159/1/smith et...
TRANSCRIPT
Accepted Manuscript
Hydrothermal fluid evolution and metal transport in the Kiruna District, Swe‐
den: Contrasting metal behaviour in aqueous and aqueous-carbonic brines
M.P. Smith, S.A. Gleeson, B.W.D. Yardley
PII: S0016-7037(12)00591-1
DOI: http://dx.doi.org/10.1016/j.gca.2012.10.015
Reference: GCA 7960
To appear in: Geochimica et Cosmochimica Acta
Received Date: 27 April 2012
Accepted Date: 9 October 2012
Please cite this article as: Smith, M.P., Gleeson, S.A., Yardley, B.W.D., Hydrothermal fluid evolution and metal
transport in the Kiruna District, Sweden: Contrasting metal behaviour in aqueous and aqueous-carbonic brines,
Geochimica et Cosmochimica Acta (2012), doi: http://dx.doi.org/10.1016/j.gca.2012.10.015
This is a PDF file of an unedited manuscript that has been accepted for publication. As a service to our customers
we are providing this early version of the manuscript. The manuscript will undergo copyediting, typesetting, and
review of the resulting proof before it is published in its final form. Please note that during the production process
errors may be discovered which could affect the content, and all legal disclaimers that apply to the journal pertain.

Hydrothermal fluid evolution and metal transport in the Kiruna District,
Sweden: Contrasting metal behaviour in aqueous and aqueous-carbonic brines.
M.P. Smith1*
, S.A. Gleeson2 and B.W.D. Yardley
3.
1. School of Environment and Technology, University of Brighton, Brighton, BN2
4GJ, U.K.
2. Department of Earth & Atmospheric Sciences, University of Alberta, Edmonton,
AB, T6G 2E3, Canada
3. School of Earth and Environment, University of Leeds, Leeds, LS2 9JT, U.K.
*Corresponding author:
Dr. Martin Smith,
School of Environment and Technology,
University of Brighton,
Lewes Road,
Brighton,
BN2 4GJ.
U.K.
e-mail: [email protected]
Tel.: (+44)(0)1273 642265

Abstract
Iron oxide-copper-gold (IOCG) deposits and Fe oxide-apatite deposits from
Norrbotten, Sweden, formed in similar settings, and in some cases IOCG
mineralisation overprinted Fe oxide-apatite mineralisation. Fluid inclusions in quartz
veins cutting Fe oxide-apatite deposits range in salinity from 33-37 wt. % NaCl eq.,
and those in IOCG-type deposits from 41-54 wt. % NaCl eq. Minimum trapping
conditions for these inclusions are ~200-300MPa and 200-300°C in the Fe oxide-
apatite bodies, and 250->300MPa and 300-500°C in the IOCG deposits. Deformed
Cu-Au deposits have similar early fluid characteristics, but contain complex
secondary fluid inclusion assemblages including halite saturated (20-30 wt. % NaCl
eq.), aqueous-carbonic (3-13 wt. % NaCl eq.; X(CO2) 0.17-0.29) and CO2-rich fluids.
The aqueous-carbonic and carbonic inclusions are consistent with aqueous-carbonic
fluid immiscibility at ~150MPa. A secondary population, with a high Ca-content
occurs in all deposit types.
The chemical composition of these inclusions has been determined by crush-
leach analysis and LA-ICPMS. Halogen contents indicate a range of salinity sources
with possible inputs from both magmatic and halite-dissolution brines. Element ratios
suggest the alkali content of the fluid exceeded the buffer capacity of the host rocks.
Iron and other transition metal contents correlate strongly with Cl concentrations, with
secondary controls on solubility from pH, redox and temperature. Copper and Ag
contents are higher in lower salinity aqueous-carbonic brines (up to 5000ppm Cu,
900ppm Ag) than in the most saline brines (up to 2297ppm Cu, 837ppm Ag). This
may reflect differences in metal source between deposit types, but is also consistent
with the complexation of Cu by bisulphide in the lower salinity fluids. Late stage

aqueous-carbonic fluid flux through the deformed deposits either introduced
additional copper to the deposits, remobilised pre-existing copper or both.
1. Introduction
Iron oxide–copper–gold deposits (IOCG) are a relatively recently defined class of
ore deposit, which are characterised by Cu-sulphide ± Au hydrothermal ores with
abundant magnetite or hematite. Their classification has been problematical since the
definition of the Fe oxide-Cu-Au (IOCG) class of deposits by Hitzman (1992).
Subsequent research has refined the definition (Hitzman, 2000; Williams et al., 2005;
Groves et al., 2010), and suggested the Fe oxide-apatite (Kiruna-type) deposits are a
separate, but related, type of ore deposit. A range of genetic models have also been
proposed for IOCG deposits that have included the involvement of basinal brines,
fluids interacted with meta-evaporites, surface derived brines (e.g. Barton and
Johnson, 1996; 2000) and magmatic fluids in ore formation. Evidence from different
deposits and districts supports the potential involvement of all these fluid sources in
producing deposits of similar characteristics (e.g. Williams et al., 2001; Kendrick et
al., 2007, 2008a, b; Gleeson and Smith, 2009). The key linking factor in all models is
the involvement of high salinity brines, which account for the high total masses of Fe
deposited and the prevalence of Na-rich alteration including the formation of regional
scapolite and albite. There is also good evidence for mixing of different fluids, and/or
for numerous generations of fluid circulation (Broman and Martinsson, 2000;
Wanhainen et al., 2003; Gleeson and Smith, 2009), including CO2-rich fluids either
during the main stage of ore deposition, or involved in post ore modification of the
deposits (e.g. Williams et al., 2001; Fu et al., 2003; Baker et al., 2008). In many
instances in IOCG deposits Cu-(Au) mineralisation post-dates Fe mineralisation, with

Cu minerals either in cross-cutting veins or in breccia matrices, and may be the result
of the circulation of different fluids through the same deposit with a significant time
difference between the mineralising events (e.g. Smith et al., 2009). However, despite
the complex interaction of primary fluid sources, fluid mixing, immiscibility and
multiple generations of overprint, studies so far that have targeted the chemistry of
individual fluid inclusions have found the highest concentrations of ore forming
elements, particularly Cu, in high temperature, hypersaline fluids of inferred to be of
either magmatic derivation (Baker et al., 2008), or non-magmatic brines(Bastrakov et
al., 2007). Even in deposits with primary fluids suggested to be of magmatic origin,
however, there is evidence for the subsequent interaction of evaporate-derived brines
(Baker et al., 2008).
In this study, we report on the characteristics of aqueous and aqueous-carbonic
fluid inclusions from quartz veins cutting Fe oxide-apatite mineralisation, and hosting
Cu mineralisation in IOCG deposits, from the Kiruna and Malmberget ore districts,
northern Sweden (Fig. 1) with the aims of examining the formation conditions of the
veins and ores and the transport and deposition processes of metals. The study used
crush leach and laser ablation Inductively Coupled Plasma Mass Spectrometry (LA-
ICPMS) analyses of fluid inclusion chemistry to give constraints on both the cation
and anion composition of fluids, and to allow discrimination between different
populations in mixed inclusion assemblages where crush leach techniques would
average the chemistry of different populations.
2. Background geology
The detailed geology and metallogeny of Norrbotten County, Sweden, have
been reviewed by Carlon (2000) and Bergman et al. (2001). Fe oxide-apatite and
IOCG type deposits are hosted in a Palaeoproterozoic sequence of metavolcanic and
metasedimentary rocks, that can be broadly divided into the Karelian Greenstone
Group (>1.9Ga) and the Svecofennian Porphyry Group (Fig. 1). The Greenstone
Group consists of dominantly tholeiitic to komatiitic volcanic rocks, and overlies
Archaean basement (Ekdhal, 1993). The Porphyry Group consists of andesitic
(Porphyrite Group) to syenitic and quartz-syenitic (Kiruna Porphyries) igneous rocks
and associated sediments (Martinsson, 1997). The Kiruna Porphyries host the
Kiirunavaara magnetite-apatite deposit, and may have acquired their syenitic
character by metasomatism, and the porphyry group has been identified as initially
consisting of a sequence of basalt, trachyandesite and rhyodacite-rhyoite (Martinsson
and Perdahl, 1995; Bergman e al., 2001). Storey et al. (2007) suggested a minimum
formation age for these units of ca. 2050Ma. These rocks are cut by the calc-alkaline
Haparanda and Perthite-Monzonite granitoid suites (1.9-1.8Ga; Skiöld, 1987),
followed by the Lina suite granitoids at around 1.79Ga. The country rocks underwent
metamorphism, peaking at upper greenschist to lower amphibolites facies conditions
from 1.9-1.8Ga (Skiöld, 1987). The rocks are affected by albitisation and
scapolitisation on the regional scale (Frietsch et al., 1997), which occurred at
~1903±8Ma (Smith et al., 2009). A number of large-scale shear systems cut the area,
including the Nautanen Deformation Zone (NDZ), a NNW-trending structure with
schistose or mylonitic rocks occurring in several high strain branches in a zone up to
3km wide (Martinsson and Wanhainen, 2004).
Samples for this study were taken from three groups of deposits and prospects;
late-stage quartz veins cutting Fe oxide-apatite deposits and associated alteration,
mineralization-related quartz veins from Cu-(Au) prospects hosted by the Greenstone
and Porphyry Groups, and mineralization-related quartz veins from the heavily
deformed metavolcanic rocks of the NDZ. The Fe oxide- apatite bodies
are typified by the Kiirunavaara-Luossavaara body, dominated by magnetite, and the
Per Geiger ores, with both hematite and magnetite (Geijer, 1910; Martinsson, 2004).
The formation of the Kiirunavaara-Luossavaara ores has been dated at 1880-1870Ma
(Romer et al., 1994; Smith et al., 2009), which is coeval with both the intrusion of the
Haparanda and Perthite-Monzonite suite granitoids, and peak metamorphic conditions
in the area (Bergstrom et al., 2001), although the ores underwent a second period of
metamorphism and possibly hydrothermal alteration at ~1800Ma (Romer et al., 1994;
Smith et al., 2009). Quartz veins cross-cut magnetite and/or hematite in these deposits
(Fig. 2A, B) and so cannot be directly linked to ore deposition. However, the quartz
veins also include actinolite, magnetite, hematite and titanite (Fig. 2A, B), and do not
show alteration haloes when cross-cutting oxide ore (there is no hematisation of
magnetite; Fig. 2C). We therefore argue that these veins represent the latest stage
fluid associated with the main stage of Fe oxide deposition, and hence have provide
some constraints on the transport of metals in these systems. Hematite-bearing veins
do occur, and are represented in this study by the late stage quartz vein sample from
Kirunavaara (KR2), and veins from the Nuktus deposit.
The IOCG deposits occur in both Greenstone Group and Porphyry Group
rocks affected by sodic , (including both scapolite and albite), potassic and carbonate
alteration (Martinsson, 2004). It is likely that IOCG mineralisation post-dated Fe
oxide-apatite mineralisation by 10-20Ma (Martinsson and Virkkunen, 2004; Smith et
al., 2009). In these deposits quartz veins host chalcopyrite and pyrite, and so the
deposition of quartz can be closely related to ore mineral deposition (Fig. 2D, E).
Quartz veins directly associated with Cu mineralisation were also taken from
sites associated with the NDZ, where shear-zone hosted mineralisation is associated
with the development of scapolite, tourmaline, sericite, K-feldspar, epidote and garnet
(Martinsson and Wanhainen, 2004). The samples come from both the Nautanen
prospect, and from the Ferrum vein hosted Cu-Au prospect on the margins of the
main deformation zone. An additional sample from the Aitik Cu-Au mine
(Wanhainen et al., 2003) was analysed for comparison with the Nautanen samples. It
has been suggested that primary mineralisation in the NDZ was formed at a similar
time to other mineralisation in the area (1870-1890Ma; Wanhainen and Martinsson,
2003; Wanhainen et al., 2005), although the Aitik deposit may represent a deformed
and metamorphosed porphyry-Cu system (Monro, 1988). The ore mineral assemblage
in both deposits is typified by pyrite, chalcopyrite, magnetite and pyrrhotite (Fig. 2F).
Both the Nautanen prospect and Aitik deposit were significantly modified, and ore
metals remobilised by subsequent deformation and metamorphic events associated
with the formation of the deformation zone, notably at ~1760Ma (Wanhainen et al.,
2005; Smith et al., 2009). Secondary fluid inclusions can be related to either
remobilisation of Cu or addition of Cu to the deposits as sulphides phases occur as
solid inclusions along secondary fluid inclusion trails (Wanhainen et al., 2003).
The settings and characteristics of individual samples are described in Table 1,
and additional descriptions of the same samples are given by Gleeson and Smith
(2009).
*3. Methods
3.1 Fluid inclusion microthermometry
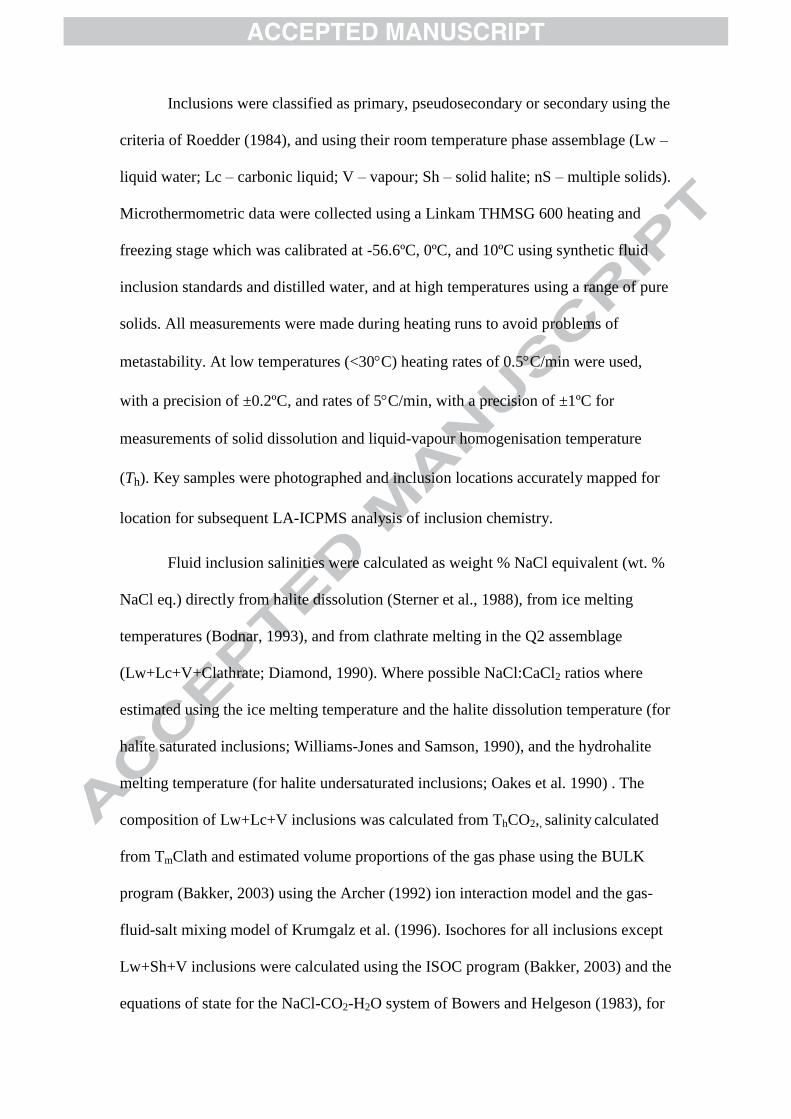
Inclusions were classified as primary, pseudosecondary or secondary using the
criteria of Roedder (1984), and using their room temperature phase assemblage (Lw –
liquid water; Lc – carbonic liquid; V – vapour; Sh – solid halite; nS – multiple solids).
Microthermometric data were collected using a Linkam THMSG 600 heating and
freezing stage which was calibrated at -56.6ºC, 0ºC, and 10ºC using synthetic fluid
inclusion standards and distilled water, and at high temperatures using a range of pure
solids. All measurements were made during heating runs to avoid problems of
metastability. At low temperatures (<30C) heating rates of 0.5C/min were used,
with a precision of ±0.2ºC, and rates of 5C/min, with a precision of ±1ºC for
measurements of solid dissolution and liquid-vapour homogenisation temperature
(Th). Key samples were photographed and inclusion locations accurately mapped for
location for subsequent LA-ICPMS analysis of inclusion chemistry.
Fluid inclusion salinities were calculated as weight % NaCl equivalent (wt. %
NaCl eq.) directly from halite dissolution (Sterner et al., 1988), from ice melting
temperatures (Bodnar, 1993), and from clathrate melting in the Q2 assemblage
(Lw+Lc+V+Clathrate; Diamond, 1990). Where possible NaCl:CaCl2 ratios where
estimated using the ice melting temperature and the halite dissolution temperature (for
halite saturated inclusions; Williams-Jones and Samson, 1990), and the hydrohalite
melting temperature (for halite undersaturated inclusions; Oakes et al. 1990) . The
composition of Lw+Lc+V inclusions was calculated from ThCO2,, salinity calculated
from TmClath and estimated volume proportions of the gas phase using the BULK
program (Bakker, 2003) using the Archer (1992) ion interaction model and the gas-
fluid-salt mixing model of Krumgalz et al. (1996). Isochores for all inclusions except
Lw+Sh+V inclusions were calculated using the ISOC program (Bakker, 2003) and the
equations of state for the NaCl-CO2-H2O system of Bowers and Helgeson (1983), for
the system NaCl-CaCl2-H2O of Zhang & Frantz (1987), and the pure CO2 system of
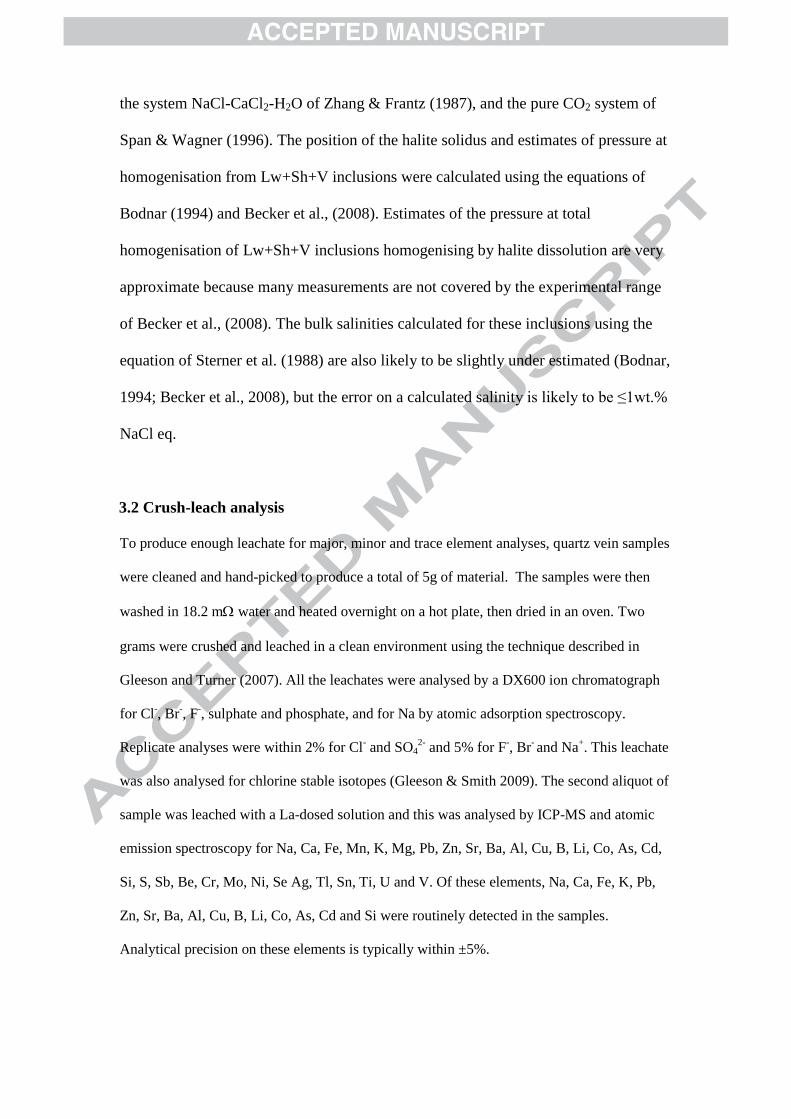
Span & Wagner (1996). The position of the halite solidus and estimates of pressure at
homogenisation from Lw+Sh+V inclusions were calculated using the equations of
Bodnar (1994) and Becker et al., (2008). Estimates of the pressure at total
homogenisation of Lw+Sh+V inclusions homogenising by halite dissolution are very
approximate because many measurements are not covered by the experimental range
of Becker et al., (2008). The bulk salinities calculated for these inclusions using the
equation of Sterner et al. (1988) are also likely to be slightly under estimated (Bodnar,
1994; Becker et al., 2008), but the error on a calculated salinity is likely to be ≤1wt.%
NaCl eq.
3.2 Crush-leach analysis
To produce enough leachate for major, minor and trace element analyses, quartz vein samples
were cleaned and hand-picked to produce a total of 5g of material. The samples were then
washed in 18.2 m water and heated overnight on a hot plate, then dried in an oven. Two
grams were crushed and leached in a clean environment using the technique described in
Gleeson and Turner (2007). All the leachates were analysed by a DX600 ion chromatograph
for Cl-, Br
-, F
-, sulphate and phosphate, and for Na by atomic adsorption spectroscopy.
Replicate analyses were within 2% for Cl- and SO4
2- and 5% for F
-, Br
- and Na
+. This leachate
was also analysed for chlorine stable isotopes (Gleeson & Smith 2009). The second aliquot of
sample was leached with a La-dosed solution and this was analysed by ICP-MS and atomic
emission spectroscopy for Na, Ca, Fe, Mn, K, Mg, Pb, Zn, Sr, Ba, Al, Cu, B, Li, Co, As, Cd,
Si, S, Sb, Be, Cr, Mo, Ni, Se Ag, Tl, Sn, Ti, U and V. Of these elements, Na, Ca, Fe, K, Pb,
Zn, Sr, Ba, Al, Cu, B, Li, Co, As, Cd and Si were routinely detected in the samples.
Analytical precision on these elements is typically within ±5%.

3.3 Laser Ablation ICP-MS
Fluid inclusions were analysed following the method of Allan et al. (2005)
using a GeoLas Q Plus Excimer laser (ArF, 193nm, Microlas, Göttingen, Germany).
Ablated material was transported from a cylindrical chamber with a height of 5 mm
and internal diameter of 57 mm (approximately 13 cm3) in 0.68 L/min He via
Teflon® tubing to a cyclone gas mixer, where the analyte was premixed with 0.95
L/min Ar before introduction into the plasma. The analyte was analysed with an
Agilent 7500c quadrupole ICP-MS, equipped with an octopole reaction cell that was
pressurized with 2.5 mL/min H2, which virtually eliminated 40
Ar+ and
40Ar
16O
+
interferences on 40
Ca+ and
56Fe
+, respectively, and greatly reduced the high Ar-based
backgrounds on 39
K+. Fluid inclusion analyses were calibrated using combinations of
NIST SRM 610 and 612, an in-house EMPA glass standard, and HNO3 spiked
aqueous standards ablated directly through the walls of glass capillaries (Ghazi and
Shuttleworth, 2000; Günther et al., 1997; Boué-Bigne et al., 1999). Silicate glass
standards were ablated for 200 pulses over a single 50 m spot, using a repetition rate
of 5 Hz and laser fluence of 10 J/cm2. Laser focus on the ablation surface was
maintained by raising the ablation cell 1m per 10 shots, in accordance with an
approximate ablation rate of 0.1 m/pulse. Sodium was used as the internal standard
in all cases. Sets of fluid inclusion analyses were bracketed by standards, and linear
drift corrections were applied. Dwell times were 5 - 15 ms.
The absolute concentration of cations in analysed inclusions, and in bulk leachates
was calculated by charge balance of the total cations against a Cl molality determined
from microthermometric data wherever possible (Allen et al., 2005). An octopole
reaction cell was not used for the analyses including Br and Cl to maximise the
sensitivity on those elements, but this allowed polyatomic interferences on some

elements which were consequently omitted from the element list (40
Ca+,
56Fe
+,
39Ca
+ -
Allan et al., 2005). In the case of analyses of inclusions for Cl and Br therefore, where
a limited element list was used, the element ratios from the analyses were normalised
to the total Cl concentration in ppm. Limits of determination varied according to
inclusion, and were defined as 6σ in the background counts. Signals below this limit
were rejected *
4. Results
4.1 Fluid inclusion petrography
The petrography of fluid inclusions from the samples used here is described in
Gleeson and Smith (2009) and is summarised briefly in Table 2 and Figure 3. In late
stage quartz veins from the Fe oxide-apatite deposits, along with Lw+Sh+V (Fig. 3A)
inclusions trapped on annealed trails, inclusions of consistent microthermometric
properties occur in settings interpreted as primary, in growth zone parallel trails (Fig.
3B), or isolated in grain cores. Metastable Lw+Sh inclusions occur which nucleated a
vapour bubble on freezing. The sample from the Henry Fe-oxide-apatite body is
notable in that halite-bearing inclusions showed a double meniscus and a small
amount of CO2 within the inclusion (Fig. 3C). In Pahtohavare and other relatively
undeformed IOCG deposits the inclusions (typically Lw+nS+V; Fig, 3D) are
likewise trapped in primary settings, notably in vein wall parallel trails or as randomly
distributed groups, overgrown by inclusion free rims (Fig. 3E, F). Secondary trails are
dominated by CO2-rich inclusions (Lindblom et al., 1996). The majority of samples
from undeformed Fe oxide-apatite and IOCG deposits were analysed by crush-leach
techniques, with selected samples from Kiruna, Nuktus and Pahtohavare also analysed
by LA-ICPMS.
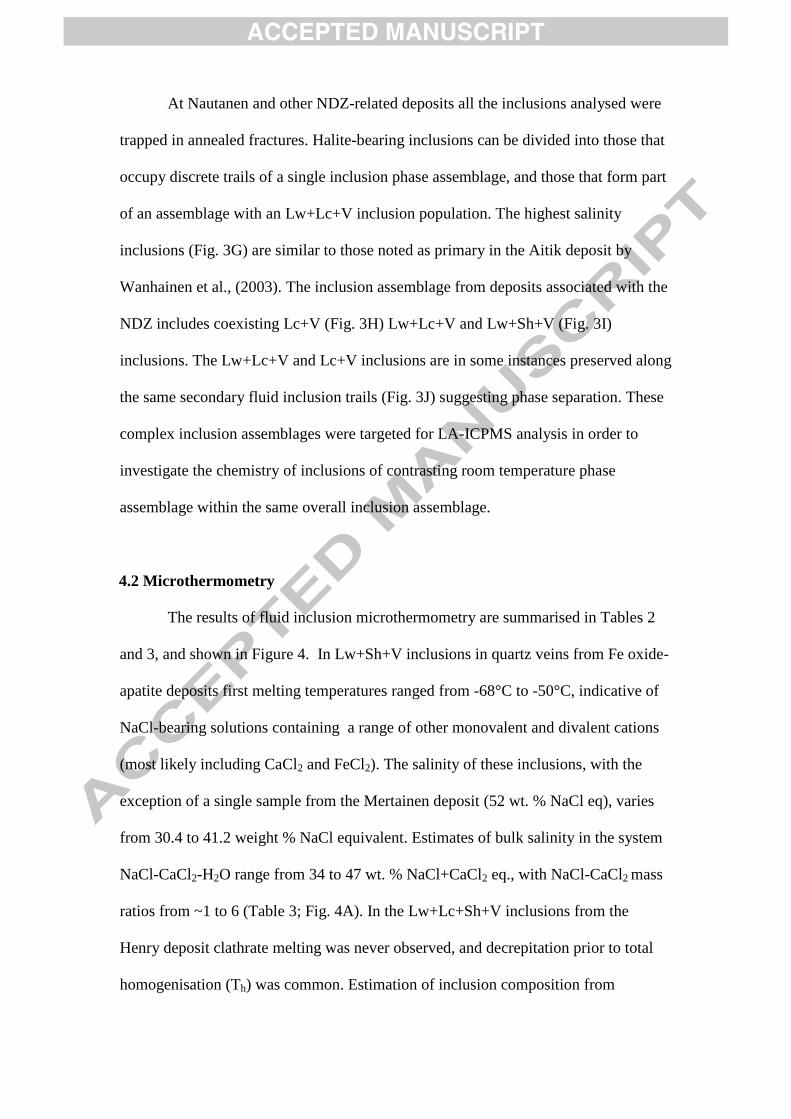
At Nautanen and other NDZ-related deposits all the inclusions analysed were
trapped in annealed fractures. Halite-bearing inclusions can be divided into those that
occupy discrete trails of a single inclusion phase assemblage, and those that form part
of an assemblage with an Lw+Lc+V inclusion population. The highest salinity
inclusions (Fig. 3G) are similar to those noted as primary in the Aitik deposit by
Wanhainen et al., (2003). The inclusion assemblage from deposits associated with the
NDZ includes coexisting Lc+V (Fig. 3H) Lw+Lc+V and Lw+Sh+V (Fig. 3I)
inclusions. The Lw+Lc+V and Lc+V inclusions are in some instances preserved along
the same secondary fluid inclusion trails (Fig. 3J) suggesting phase separation. These
complex inclusion assemblages were targeted for LA-ICPMS analysis in order to
investigate the chemistry of inclusions of contrasting room temperature phase
assemblage within the same overall inclusion assemblage.
4.2 Microthermometry
The results of fluid inclusion microthermometry are summarised in Tables 2
and 3, and shown in Figure 4. In Lw+Sh+V inclusions in quartz veins from Fe oxide-
apatite deposits first melting temperatures ranged from -68°C to -50°C, indicative of
NaCl-bearing solutions containing a range of other monovalent and divalent cations
(most likely including CaCl2 and FeCl2). The salinity of these inclusions, with the
exception of a single sample from the Mertainen deposit (52 wt. % NaCl eq), varies
from 30.4 to 41.2 weight % NaCl equivalent. Estimates of bulk salinity in the system
NaCl-CaCl2-H2O range from 34 to 47 wt. % NaCl+CaCl2 eq., with NaCl-CaCl2 mass
ratios from ~1 to 6 (Table 3; Fig. 4A). In the Lw+Lc+Sh+V inclusions from the
Henry deposit clathrate melting was never observed, and decrepitation prior to total
homogenisation (Th) was common. Estimation of inclusion composition from

microthermometric data and estimates of phase volume proportions suggests salinities
from 33 to 38 wt. % NaCl eq., with XCO2 in the bulk inclusion ranging from 0.01 to
0.03. This sample also included a secondary population of Lw+Lc+V inclusions
(Table 3) with compositions of ~21.5 wt. % NaCl eq. and XCO2 ranging from 0.03 to
0.06.
Primary, pseudosecondary and secondary inclusions from relatively
undeformed IOCG deposits are Lw+nS+V halite-bearing inclusions, with the main
solid being halite. Microthermometric and laser Raman spectroscopic investigations
by Lindblom et al. (1996) also identified sylvite, calcite, hematite and graphite in
inclusions from Pahtohavare. Lw+Sh+V inclusions dominate in the sample from
Kiskamavaara. Secondary trails of Lc+V inclusions are common. In most cases,
salinities ranged from ~40 to ~58 wt. % NaCl eq. The fluids are NaCl dominated,
with NaCl:CaCl2 ratios ranging from ~6 to 21. Lw+Sh+V inclusions at Kallosalmi
and Pahtohavare, Kiskamavaara, and Gruvberget range in salinity from ~30 to 38 wt.
% NaCl eq (Table 3; Fig. 4B). The Lc+V inclusions have TmCO2 temperatures
ranging from -56.6 to 60°C, indicating CO2-dominated fluids. Lindblom et al. (1996)
identified N2 in addition to CO2 in this inclusion type. Carbonic phase
homogenisation was always to the liquid and ranged from -16 to 22°C. A secondary
population of Lw+V inclusions was observed in samples from the Gruvberget deposit.
These show Tmice from -6.8 to -45 and Tmhh from -30 to -48°C, consistent with Ca-
rich brines (Oakes et al., 1990; Table 3; Fig. 4B). This population has been noted
from other deposits in the area (Broman and Martinsson, 2000; Wanhainen et al.,
2003).
All samples analysed from deposits and prospects within or near the Nautanen
Deformation Zone (NDZ) have complex fluid inclusion assemblages and parageneses
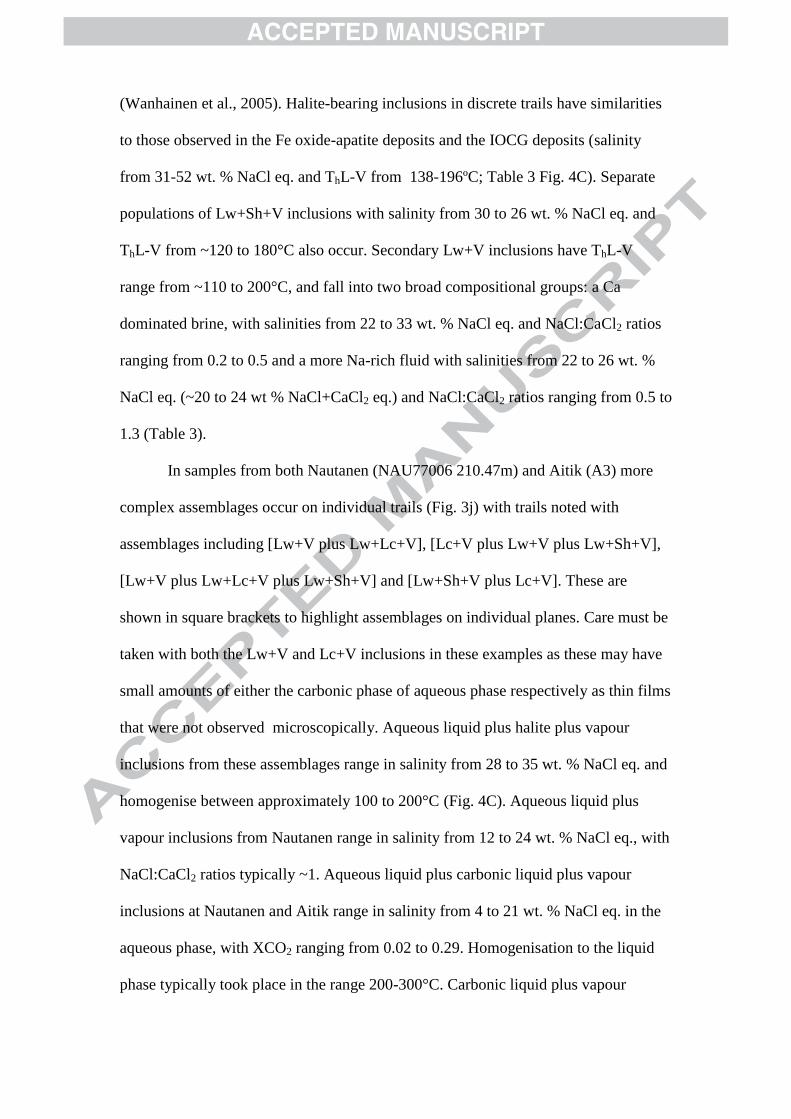
(Wanhainen et al., 2005). Halite-bearing inclusions in discrete trails have similarities
to those observed in the Fe oxide-apatite deposits and the IOCG deposits (salinity
from 31-52 wt. % NaCl eq. and ThL-V from 138-196ºC; Table 3 Fig. 4C). Separate
populations of Lw+Sh+V inclusions with salinity from 30 to 26 wt. % NaCl eq. and
ThL-V from ~120 to 180°C also occur. Secondary Lw+V inclusions have ThL-V
range from ~110 to 200°C, and fall into two broad compositional groups: a Ca
dominated brine, with salinities from 22 to 33 wt. % NaCl eq. and NaCl:CaCl2 ratios
ranging from 0.2 to 0.5 and a more Na-rich fluid with salinities from 22 to 26 wt. %
NaCl eq. (~20 to 24 wt % NaCl+CaCl2 eq.) and NaCl:CaCl2 ratios ranging from 0.5 to
1.3 (Table 3).
In samples from both Nautanen (NAU77006 210.47m) and Aitik (A3) more
complex assemblages occur on individual trails (Fig. 3j) with trails noted with
assemblages including [Lw+V plus Lw+Lc+V], [Lc+V plus Lw+V plus Lw+Sh+V],
[Lw+V plus Lw+Lc+V plus Lw+Sh+V] and [Lw+Sh+V plus Lc+V]. These are
shown in square brackets to highlight assemblages on individual planes. Care must be
taken with both the Lw+V and Lc+V inclusions in these examples as these may have
small amounts of either the carbonic phase of aqueous phase respectively as thin films
that were not observed microscopically. Aqueous liquid plus halite plus vapour
inclusions from these assemblages range in salinity from 28 to 35 wt. % NaCl eq. and
homogenise between approximately 100 to 200°C (Fig. 4C). Aqueous liquid plus
vapour inclusions from Nautanen range in salinity from 12 to 24 wt. % NaCl eq., with
NaCl:CaCl2 ratios typically ~1. Aqueous liquid plus carbonic liquid plus vapour
inclusions at Nautanen and Aitik range in salinity from 4 to 21 wt. % NaCl eq. in the
aqueous phase, with XCO2 ranging from 0.02 to 0.29. Homogenisation to the liquid
phase typically took place in the range 200-300°C. Carbonic liquid plus vapour

inclusions mostly showed TmCO2 from -56.6 to -59.0°C, with the majority of data
between -56.6 and -57.0°C indicating a CO2 dominated carbonic phase. These
inclusions showed a wide range of densities, and homogenised to both the liquid and
the vapour phase.
4.3 Crush leach and Laser Ablation ICP-MS analyses
The results of crush leach analyses are shown in Table 4, and representative LA-
ICPMS analyses are shown in Table 5. The full data set for LA-ICPMS analyses is
shown in the electronic Appendix. In all cases, the cationic composition of the brines
is dominated by Na, Ca, K and Fe. In rare instances, the Fe concentration exceeded
the K concentration. Concentrations of Mn, Sr, Ba, Zn, and Pb, are also significant,
exceeding 1000 ppm in reconstructed fluid compositions in a number of cases.
Copper concentrations are comparable in both data sets, ranging from tens to
hundreds of ppm, and in rare case up to a few 1000, notably in individual fluid
inclusion LA-ICPMS analyses compared to lower values in samples analysed by
crush-leach methods. Boron and Li concentrations from the crush leach analyses are
typically low, with Li below detection limits in some instances. Crush leach analyses
also show significant sulphate concentrations in most fluids, ranging from ~10 to
5000ppm.
The results of crush leach and LA-ICPMS analyses are compared in Table 6.
Analytical precision on leachate analyses is typically ~5%, whilst Allan et al. (2005)
found accuracy typically around 15%, and precision was around 15%RSD for K, Rb
and Cs, and 30% for other elements using LA-ICPMS. We have chosen to show a
30% error for all elements analysed by LA-ICPMS. Given that the crush-leach
analyses represent a composition homogenised over many inclusions within a large

sample of quartz whilst the LA-ICPMS analyses are analyses of a limited number of
individual inclusions the two data seta are reasonably consistent. For Fe oxide–apatite
and IOCG-type fluids there is good agreement between crush-leach and LA-ICPMS
analyses for individual samples for Na, Fe, K, Ca, Mn, Cu and B. There is greater
spread in the LA-ICPMS data, as would be expected from the relatively low analytical
precision, and from the analysis of individual inclusions, which trapped fluids during
different stages of wall-rock interaction, precipitation and potentially mixing.
However, significant differences do occur for K (in some samples), Ca (in some
samples), Ba, B, and Br. Potassium values are only inconsistent for the sample from
Kirunavaara where they are higher in the LA-ICPMS analyses than in the crush leach
analyses. This may therefore represent sampling bias in the LA-ICPMS analyses.
Although the microthermometric and LA-ICPMS data confirm that high Ca
concentrations are characteristic of some fluids, the crush leach data gives some
anomalously high Ca values. These may be related to contamination of the leachate
by calcite on fracture surfaces. There is poor agreement between crush-leach analyses
and LA-ICPMS data for Br. This is likely to be because Br only exceeded detection
limits for LA-ICPMS in a limited number of the most saline and Br-rich inclusions.
Bromine analysis of fluid inclusions by the methods used here has also been noted to
give anomalously high Br concentrations from synthetic fluid inclusions (Allan et al.,
2005), which Seo et al. (2011) attributed to remobilisation of Br from the ablation
chamber and sample surface. As a result, Br/Cl ratios for inclusions analysed by LA-
ICPMS are not included in the discussion and figures below.
5. Discussion
5.1 Trapping and ore formation conditions
For the vast majority of inclusions from the Fe oxide-apatite and IOCG
deposits in this study there are a scarcity of relevant experimental data to constrain
pressures at homogenisation and the positions of isochors. Very approximate
estimates of P at Th can be made from the data of Becker et al. (2008) by comparison
of Tsolhalite and ThL-V with calculated isobars (Fig. 5A-C). Generally minimum
trapping conditions for ‘Fe oxide-apatite type’ fluids are from 200-350°C and 200-
>300MPa, with those in chalcopyrite bearing veins from the Henry deposit potentially
being even higher because of the presence of CO2 (Schmidt and Bodnar, 2000), whilst
those for ‘IOCG type’ fluids are from 300-450°C and 250 to >300MPa.
Early stages of fluid circulation at Aitik and Nautanen presumably took place
under similar conditions to those seen in less deformed deposits (Wanhainen et al.,
2005). The presence of secondary inclusion assemblages with complex mixtures of
room temperature phase assemblage may provide better evidence for trapping
conditions if they represent an unmixing assemblage (Fig. 5 D, E). Inclusions that
homogenise by halite dissolution cannot represent part of an aqueous-carbonic fluid
immiscibility assemblage, but mixed assemblages of Lw+Lc+V and Lc+V inclusions
can, as can halite bearing inclusions which homogenise by vapour disappearance. For
the sample studied at Aitik all Lw+Sh+V inclusions homogenise by halite dissolution,
and so cannot have been formed by immiscibility. They hence indicate the presence of
a fluid with salinities in the range 28-30 wt. % NaCl eq., comparable to fluids in veins
cross-cutting the Fe oxide-apatite deposits. Aqueous-carbonic inclusions in trails with
mixed Lw+Lc+V and Lc+V inclusions have estimated homogenisation pressures of
250-350MPa at temperatures of 200-290ºC, which provide minimum estimates of
trapping conditions. Isochors for Lc+V inclusions which homogenise to a carbonic
liquid do not intersect with those of the Lw+Lc+V inclusions and so either do not
represent part of an unmixing assemblage, or more likely given that these inclusion
types occur on the same trails, contain a film of water which was not visible using
transmitted light microscopy and hence may have homogenised at higher T and P than
observed. The presence of Lc+V inclusions that homogenise to a carbonic vapour
suggests pressures may have dropped even lower during periods of fracturing and
vein dilation.
At Nautanen Lw+Sh+V inclusions homogenising by halite dissolution are also
common, and so indicate similar saline fluids to those seen at Aitik. However, saline
Lw+V inclusions, Lc+V, and Lw+Lc+V inclusions do co-exist, alongside some
Lw+Sh+V inclusions which homogenise by vapour disappearance. Isochors for co-
existing Lw+Lc+V, Lc+V, and Lw+V inclusions intersect (Fig. 5E), but do not have
the same homogenisation temperature and pressures as would be required for
definitive evidence of aqueous-carbonic fluid immiscibility (Ramboz et al., 1982).
However, thin films of aqueous or carbonic fluids may be microthermometrically
undetectable in the Lc+V and Lw+V inclusions respectively meaning that the trails
with secondary populations are still consistent with immiscibility. The alternative, of
mixing of aqueous and carbonic fluids cannot be ruled out, but would have been
unlikely because of the difference in fluid density. In the case of immiscibility the
homogenisation temperatures and pressures of the Lw+Lc+V inclusions indicate
ranges ~240-370ºC and ~130-160MPa, and ~250-280 ºC and 25-55MPa. The wide
range in homogenisation pressure is consistent with changes in fluid pressure during
shear zone movement. The samples from the Ferrum Au prospect, peripheral to the
main NDZ (Fig.5F), have a saline inclusion population with isochors similar to those
from the saline populations from Aitik and Nautanen, but have no carbonic or
aqueous-carbonic inclusions. The conditions of trapping of secondary calcic brine
inclusions in all deposits cannot be constrained beyond the plotting of representative
isochors (Fig. 5F).
5.2 Source of salinity in the fluids.
Gleeson and Smith (2009) examined the potential sources of salinity in the
sample set studied here using Br and Cl concentrations and chlorine stable isotope
ratios. They concluded that whilst the Br/Cl ratios could be derived from either
magmatic sources or halite dissolution, 37
Cl values of Fe oxide-apatite and IOCG
mineralisation-related quartz veins were lower than most crustal values and, hence,
suggested magmatic input. However, some 37
Cl values were very low and it was
suggested that these may be the result of fractionation during extensive fluid-rock
interaction between the fluids and Cl-rich phases (biotite and scapolite). The Br/Cl
ratios and 37
Cl values of vein fluids in NDZ-related deposits indicated a crustal
origin for salinity and could indicate that the fluid salinity was sourced from either
evaporites or from input from crustal melts, such as the granitic pegmatites of the
Lina Suite that cut the Aitik deposit (Gleeson & Smith, 2009).
In this study, although a number of samples have Cl/Br ratios consistent with a
magmatic source for the halogens, the Cl-enrichment apparent in the extended dataset
(Fig. 6A),could be a strong indicator of interaction of fluids with (meta-) evaporites
and consequent halite dissolution (Fig. 6B), followed by extensive water-rock
interaction (Gleeson and Smith, 2009). No single group of inclusions or sample type
shows a range of ratios consistent with a single fluid source, nor do high Cl/Br ratios
correlate with the highest salinity fluids (Fig. 6C), which indicates that halite
dissolution was not the only mechanism which generated highly saline brines. Typical
magmatic-hydrothermal fluids are expected to have low salinities (Candela, 1989) and
salinities of ~6wt % NaCl eq. were used by Barton and Johnson (2000) for mass
balance models of IOCG deposit formation. In this situation, however, highly saline
magmatic brines could be produced by aqueous-carbonic fluid exsolution from
magmas at relatively high pressure (compared with the porphyry environment) with
subsequent separation and loss of water to a carbonic phase resulting in a high-salinity
magmatic brine (Pollard, 2006). Brines associated with the NDZ show less evidence
from Cl isotopes for fluid-rock interaction (Gleeson and Smith, 2009) and are
significantly removed in time and tectonic setting from those involved in the
formation of Fe oxide-apatite and IOCG mineralisation (Smith et al., 2009).
The complex range of sources for fluid components inferred above are
consistent with the picture from IOCG type mineralisation globally, with deposits
showing a complex mix of brine sources including magmatic-hydrothermal,
evaporitic and surface fluids (e.g. Kendrick et al., 2007, 2008b) with some examples
of deposits dominated by a single end-member (c.f. Williams et al., 2001). There
remain issues with mixing models as the fluids involved frequently show high density
contrasts, and there is abundant evidence for fluid overpressure in the form of
hydraulic breccias in many districts, both of which would inhibit fluid mixing.
5.3 Controls on major element chemistry
The major element chemistry (Na, Ca, K, Fe and Mn) of crustal brines is
controlled either by mineral-fluid equilibria, or, in cases where the buffer capacity of
the host rock is exceeded, by the initial composition of the brine and the water-rock
ratio (Yardley, 2005). It is rare in any of the deposits studied to see two feldspars in
equilibrium, as albite replaces intermediate plagioclase in volcanic host rocks, and
potassic alteration producing K-feldspar and biotite is common. Thus, the second of

the two cases above is more applicable to the alkali and alkaline earth metal
concentrations in the hydrothermal systems. Most fluids are depleted in Na relative to
the trend of halite dissolution by seawater. The Na-depletion is likely to relate to Na-
Ca exchange reactions (albitisation and scapolitisation). The microthermometric data
show that fluids in veins associated with Kiruna-type and IOCG mineralisation are
strongly enriched in Na relative to Ca (Fig.7) and the LA-ICPMS and crush-leach data
show that, except for in the late stage vein from Kiirunavaara, they are enriched in Na
relative to K. The higher K content of the late Kiirunavaara brines suggests that the
fluid trapped here is closer to a composition buffered by two feldspars, and potentially
represents a less evolved fluid. In all these fluids K shows a strong positive
correlation with Ba and Ba-rich K-feldspar has been reported from the IOCG deposit
at Tjarrojakka (Edfelt et al., 2005).
At Gruvberget, and in both Aitik (Wanhainen et al., 2003) and Nautanen,
strongly Ca-enriched fluids are found in secondary inclusions. The correlation of high
Ca with high Na/K ratios (Fig. 7) is consistent with these fluids reacting with feldspar
bearing assemblages at lower T than in the Fe oxide-apatite and IOCG related brines.
High Ca contents can also be facilitated by low CO2 fugacities, possibly following
phase separation, resulting in a lack of buffering of Ca contents by calcite
precipitation (Yardley, 2005). At Aitik, Wanhainen et al. (2003) attributed Ca-rich
fluids to interaction of fluids with evaporites and anhydrite/gypsum dissolution.
However, no concomitant increase in sulphate is seen, and there is little or no
evidence of evaporitic sulphur in the region (Frietsch et al., 1995). The only other
major source of Ca-rich fluids would be the dissolution of limestone. Intense
magnetite and calc-silicate skarns do occur in the area (distinct from the magnetite-

apatite deposits) and hence limestone destruction may have acted as an additional
source of Ca.
The fluids vary significantly in Fe content, in some cases to the extent that the
brines are in fact Fe-dominant chloride solutions. This in part reflects the strong
control of chlorinity on Fe solubility in most relatively reducing environments (Chou
and Eugster, 1977; Kwak et al., 1986; Yardley, 2005). Iron was effectively mobilised
from a volumetrically extensive zone during the regional albitisation and
scapolitisation events that affected the Fennoscandian shield in northern Sweden and
western Finland (Freitsch, 1997; Niiranen, 2005). Iron solubility is also controlled to a
lesser degree by temperature and oxygen fugacity (Chou and Eugster, 1977;Yardley,
2005). The latter can be examined using the Fe/Mn ratio (Bottrell and Yardley, 1991),
as Fe and Mn should exhibit contrasting redox behaviour. Unsurprisingly the Fe/Mn
ratio correlates positively with the Fe content (Fig.8A). The data from the Nautanen
prospect and Aitik deposits show lower Fe contents at a specific Fe/Mn ratio
compared the Fe oxide-apatite deposits and IOCG-type deposits reflecting lower P-T
conditions of trapping, and potentially different, Mn-depleted, host rocks. Copper
concentrations show no correlation with the Fe-Mn ratio (Fig. 8B), suggesting a less
significant redox control on copper solubility..
5.4 Metal transport and deposition
For a given source rock or magma the primary constraints on the metal
bearing capacity of a hydrothermal solution are the availability of ligands, the
temperature, the pH and the redox conditions (Barnes, 1979; Seward and Barnes,
1997; Wood and Samson, 1998; Yardley, 2005). In a significant proportion of natural
solutions chloride is the predominant available anion for aqueous complex formation,
although HS- maybe important for some metals (Seward and Barnes, 1997). Figure 9
shows plots of metal content against overall salinity. Within the relatively broad range
of analytical values it is clear that salinity, and by inference chloride concentration,
has a key effect on metal concentrations. Both pH and fO2 are likely to have been
strongly buffered by the alteration (feldspars and phyllosilicates) and oxide and
sulphide mineral assemblages (magnetite-pyrite-hematite) in these deposits, and both
are difficult to directly assess on the basis of fluid inclusion analyses alone. The
effects of temperature are examined in Figure 10A-C, using fluid inclusion
homogenisation temperatures (either halite dissolution or L-V homogenisation) as a
proxy for trapping temperature. Correlations between T and metal concentration are
poor for most metals with exception of Fe and Ag, which, despite the order of
magnitude variations at any given T, show distinct high concentration clusters at high
T (Fig. 10B). There may be some masking of the true trend here as the Th values used
are not corrected from pressure at trapping. Also the spread in data may be affected by
the water-rock interaction history and the extent of equilibration with Fe-minerals.
The effects of chlorinity can be normalised for by using the molal Me/Cl ratio
(Yardley, 2005). Examples of these plots are shown in Figure 10F-H, which support
interpretations of the influence of T on the solubility of Fe. For some transition metals
(Cu and Pb) such a relationship is not apparent.
Cu contents in the hypersaline brines of the Pahtohavare deposit are typically
in the range 100-500ppm, although some inclusions here and in the late stage
Kiirunavaara veins have in excess of 1000ppm Cu. These ranges are comparable to
saline magmatic fluids from the Cloncurry district, Australia (Baker et al., 2008), and
are consistent with conclusions of Cu transport in saline brines in porphyry systems
(Lerchbaumer and Audetat, 2012) The highest Cu contents are, however, in lower

salinity and temperature fluids from the NDZ. Previous work has identified solid
sulphide inclusions on secondary trails in quartz from Aitik (Wanhainen et al., 2003),
but these were not observed in the samples used in this study, and so we conclude that
the data reflect real inclusion metal concentrations. A key control on elevated Cu
concentrations may be high Cu contents in the source rocks and along the flow paths
of the later hydrothermal fluids at Aitik and Nautanen, and, hence, a closer approach
to saturation with Cu phases when compared to the earlier Fe oxide-apatite fluids
(c.1890-1870Ma) and IOCG fluids (c. 1870-1860Ma). This interpretation is supported
by Nd isotope data which indicate distinct sources for the two main mineralisation
stages (Storey and Smith, in prep.). However, there is still a contrast between halite-
bearing fluid inclusions and aqueous-carbonic brines at Nautanen and Aitik, which
suggest other factors may also be important.
Diffusional loss or gain of Cu+ in fluid inclusions has been demonstrated
experimentally (Li et al., 2009; Lerchbaumer and Audetat, 2012) via interdiffusion
with Na+ and H
+, and to a lesser extent down concentration and electrochemical
potential gradients. These studies involved Cu diffusion into very low salinity vapour
inclusions, rather than the saline (10-20 wt. 5 NaCl eq.) aqueous-carbonic fluid
observed here and so the conditions of the experiments did not reproduce those seen
here. Analyses of some aqueous and aqueous carbonic fluid inclusions on single
secondary trails show very consistent Cu contents (Appendix – NAU7706s)
interpreted as trapping from a relative homogenous fluid in this case, and suggesting a
lack of modification by post-entrapment diffusion. However, post-entrapment
modification of inclusion Cu content cannot be entirely ruled out.
If high Cu contents in aqueous-carbonic fluids are not caused by post-
entrapment modification, then the lack of correlation of high Cu with the most saline
brines suggests complexation of Cu by ligands other than Cl. Sulphur concentrations
(as sulphate) are only available from crush-leach analyses in this study, but Figure 11
shows positive correlations between SO42-
and Cu concentration. Yardley et al. (1993)
argued that crush-leach techniques are S-species specific, with H2S escaping the gas
phase during crushing. The oxygen fugacity and pH in ore mineral assemblages in
these rocks are likely to have either been buffered by the assemblage pyrite plus
magnetite, or in the NDZ-related deposits by assemblages including pyrrhotite. The
positions of pyrite-magnetite boundary and the pyrite-pyrrhotite-magnetite triple point
would in part also be controlled by the total sulphur content of the fluid (Bowman,
1998). For the lowest sulphate contents analysed here H2S and HS- would also be
significant components of the fluid, whilst in the highest sulphate content fluids SO4-
would predominate, but there would still be significant reduced S species. Hence, the
order of magnitude variations in sulphate content of the leachate fluids may be taken
as also indicate major variations in the concentration of the reduced sulphur species
(Fig. 11). This suggests a role for complexation of metals by sulphur species,
probably HS-, in these fluids. High concentrations of sulphide species in low salinity
fluids are consistent with the lower solubility of volatile species in aqueous solution
with increasing salinity. Halite-bearing inclusions from both Aitik and Nautanen show
lower Cu, Ag and Au concentrations than co-existing Lw+V and Lw+Lc+V
inclusions. H2S solubility in aqueous fluids decreases with increasing salt content with
little temperature dependence except close to the critical point of water (Suleimanov
and Krupp, 1994; Duan et al., 1996) in a similar way to CO2. Data on CO2-H2S
miscibility are lacking, but in most natural fluids H2S concentrations are unlikely to
be high enough to result in separation of two volatile-rich fluids and H2S would
remain completely miscible with a CO2-rich aqueous carbonic phase. It is therefore
reasonable to suppose that bisulphide complexation will lead to elevated
concentrations of metals acting as ‘soft’ Lewis acids (Cu, Au, Ag; Robb, 2005) in
relatively low salinity, aqueous-carbonic solutions. The data presented here indicate
that post-primary ore stage aqueous and aqueous-carbonic fluids in the NDZ hosted
deposits, derived from either the local meta-volcanosedimentary rocks or from Lina
stage crustal melts (Gleeson and Smith, 2009), transported significant Cu, Ag and
possibly Au, resulting in grade increases as a result of addition of new metal, or by
remobilisation of the primary ore. In mixed-volatile fluids, water activity coefficients
rise above 1 at low pressures (~1.5kbar), but then fall with increasing temperature and
pressure (Shmulovich and Graham, 1996). Aqueous-carbonic fluids may therefore be
effective at forming outer sphere hydration shells (c.f. Williams-Jones and Heinrich,
2005) despite a lowered dielectric constant in the mixed solvent (Walther and
Helgeson, 1980; Walther and Orville, 1983; Fein and Walther, 1987, 1989), at
relatively shallow crustal depths, although there may be a preference for the
occurrence of neutral complexes in solution.
The fact that mixed Lw+Sh+V, Lw+Lc+V and Lc+V inclusions exist on
individual trails may be indicative of aqueous-carbonic fluid immiscibility. It has not
been possible in this study to present full analyses of the CO2-rich inclusions in these
assemblages, as salinity could not be determined microthermometrically. Studies of
vapour phase transport all emphasise the role of bisulphide complexation in the low
density phase (e.g. Heinrich et al., 1999; Ulrich et al., 1999; 2001; Williams-Jones
and Heinrich, 2005). It has now been demonstrated that S partitions strongly into the
vapour phase on boiling in porphyry-type environments (Seo et al., 2009), and similar
behaviour would be expected in aqueous-carbonic fluid immiscibility. However, at
high XCO2 outer sphere hydration shells implicated in vapour phase transport

(Williams-Jones and Heinrich, 2005) would breakdown, and so analogous behaviour
of metals during aqueous-carbonic fluid immiscibility may not occur, and the
preferentially partitioning of H2S into the carbonic phase may actually be a trigger for
metal deposition (Robb, 2005). The primary nature of high Cu contents in vapour
inclusions has also now been called into question (Lerchbaumer and Audetat, 2012),
suggesting immiscibility may be an effective trigger for Cu and possibly precious
metal deposition. A full interpretation of these effects will require further analyses of
CO2-rich fluid inclusions.
6. Conclusions
The Fe oxide-apatite and IOCG deposits of the Kiruna and Malmberget
districts, Sweden, formed from contrasting high salinity fluids at different times
during the evolution of the districts. Deposits associated with major deformation
zones show similar early fluid inclusions, but all have strongly overprinting fluid
inclusion assemblages, with lower (but still highly saline) salinities, the presence of
aqueous-carbonic fluids, and potentially immiscibility at some stages. These latter
fluids are potentially related to a separate stage of hydrothermal circulation at
~1780Ma. Microthermometric constraints indicate minimum P-T conditions for Fe
oxide apatite mineralisation of ~200-350°C and 200-300MPa and for IOCG
mineralisation of ~300-450°C and 250 to >300MPa. Co-existing aqueous-carbonic,
carbonic and saline fluid inclusions in deformed deposits associated with the NDZ
indicate formation during a fluctuating pressure regime, potentially with periods of
phase separation..
The Cl/Br ratios of inclusion fluids determined by crush-leach are consistent
with a range of fluid sources including both magmas and halite-bearing evaporates.

The major element concentrations of the fluids are variable, and change between
different stages of fluid circulation. Alkali metal concentrations appear to be
unbuffered by rock mineral assemblages, consistent with the extensive alkali
metasomatism in the area. Iron concentrations are strongly related to chlorinity, as are
other metals such as Pb, consistent with chloride complexation control on solubility,
with secondary controls from T and fO2. Copper concentrations (and potentially Ag
and Au) do not correlate with chlorinity in low salinity aqueous-carbonic fluids, and
although post-entrapment modification of Cu concentrations cannot be ruled out, are
inferred to be transported as bisulphide complexes in these lower salinity fluids. Low
to moderate salinity and aqueous-carbonic fluids may have high H2S concentrations,
relative to highly saline fluids, and hence similar to higher metal carrying capacity.
Acknowledgements.
This work was originally funded by European Union Regional Development Fund
Georange Program Grant 89121 to MS and SG. LA-ICPMS work was carried out at
the NERC JIF sponsored facility at the University of Leeds, U.K.
(NER/H/S/2000/853), with the assistance of L. Forbes and D. Banks. C. Storey
assisted with field work in Sweden. The manuscript was improved by constructive
comments from M. Barton and I. Samson.
Role of the funding source
The original field work and fluid inclusion work described in this manuscript were
funded by European Union Regional Development Fund Georange Program Grant
89121. Apart from specifically funding work related to metallogeny and mineral
exploration in Northern Sweden, this program played no role in the data collection or
interpretation beyond facilitating field work. The LA-ICPMS analyses were carried
out at the UK Natural Environment Research Council sponsored facility (NERC Joint
Infrastructure Fund) at the University of Leeds, U.K. (NER/H/S/2000/853). There is
no influence from the funders on the data collection at this facility.
References.
Allan M.M.; Yardley, B.W.D.; Forbes, L.J., Shmulovich, K. I., Banks, D.A. and Shepherd
,
T.J. (2005).Validation of LA-ICP-MS fluid inclusion analysis with synthetic fluid
inclusions. Am. Mineral., 90, 1767-1775
Archer, D.G. (1992) Thermodynamic properties of the NaCl+H2O system .2. thermodynamic
properties of NaCl(aq), NaCl.2H2O(cr), and phase-equilibria. J. Phys.Chem. Ref.
Data 21, 793-829
Baker T., Mustard R., Fu B., Williams P.J., Dong G., Fisher L., Mark G. and Ryan C.G.
(2008) Mixed messages in iron oxide–copper–gold systems of the Cloncurry district,
Australia: insights from PIXE analysis of halogens and copper in fluid inclusions.
Mineral. Dep. 43, 599-608.
Bakker R.J. (2003) Package FLUIDS 1. Computer programs for analysis of fluid inclusion
data and for modelling bulk fluid properties. Chem. Geol. 194, 3-23.
Barnes H.L. (1979) Solubilities of ore minerals. In Geochemistry of hydrothermal ore
deposits (ed. H.L. Barnes). 2nd ed. Wiley, New York, p.404–459.
Barton M. D. and Johnson D. A. (1996) Evaporitic-source model for igneous-related Fe
oxide-(REE–Cu–Au–U) mineralization. Geology 24, 259–262.
Barton M.D. and Johnson D.A. (2000) Alternative brine sources for Fe-oxide (-Cu-Au)
systems: Implications for hydrothermal alteration and metals. In Hydrothermal iron
oxide copper-gold and related deposits: a global perspective, (ed. T.M. Porter) Aus.
Min. Found. Glenside, Australia, pp. 43-60.

Bastrakov, E.N., Skirrow, R.G., Davidson, G.J. (2007) Fluid evolution and origins of iron
oxide Cu-Au prospects in the Olympic Dam district, Gawler Craton, South Australia.
Econ. Geol. 102, 1415-1440.
Becker S.P.; Fall A.; Bodnar R.J. (2008) Synthetic fluid inclusions. XVII. PVTX properties of
high salinity H2O-NaCl solutions (> 30 wt % NaCl): Application to fluid inclusions
that homogenize by halite disappearance from porphyry copper and other
hydrothermal ore deposits. Econ. Geol. 103, 539-554.
Bergman S., Kübler L., and Martinsson O. (2001) Description of the regional geological and
geophysical maps of Northern Norrbotten County (east of the Caledonian orogen).
Geological Survey of Sweden (Sveriges Geologiska Undersökning). Ba56, 110p.
Bodnar R.J. (1993) Revised equation and table for determining the freezing-point depression
of H2O-NaCl solutions. Geochim. Cosmochim. Acta 57, 683-684.
Bodnar R.J. (1994) Synthetic fluid inclusions .12. The system H2O-NaCl - experimental-
determination of the halite liquidus and isochores for a 40 wt-percent NaCl solution.
Geochim. Cosmochim. Acta 58, 1053-1063.
Bottrell S.H., and Yardley B.W.D. (1991) The distribution of Fe and Mn between chlorite and
fluid - evidence from fluid inclusions. Geochim. Cosmochim. Acta 55, 241-244
Bowers T.S. and Helgeson H.C. (1983) Calculation of the thermodynamic and geochemical
consequences of nonideal mixing in the system H2O-CO2-NaCl on phase relations in
geologic systems: Equation of state for H2O-CO2-NaCI fluids at high pressures and
temperatures. Geochim. Cosmochim. Acta 41, 1247-1275.
Bowman J.R. (1998) Basic aspects and applications of phase equilibria in the
Analysis of metasomatic Ca-Mg-Al-Fe-Si-S skarns. In: Lentz, D.R. (ed)
Mineralized intrusion-realted skarn systems, Mineralogical Association of
Canada Short course volume 26, 99-145.

Boue-Bigne F.; Masters B.J.; Crighton J.S. and Sharp B. L. (1999) A calibration strategy for
LA-ICP-MS analysis employing aqueous standards having modified absorption
coefficients. J. Anal. Atom. Spec. 14, 1665-1672.
Broman C. and Martinsson O. (2000) Fluid inclusions in epigenetic Fe-Cu-Au ores in
Northern Norrbotten. In 2nd
Annual GEODE Fennoscandian Shield workshop on
Palaeo-proterozoic and Archaean greenstone belts and VMS districts in the
Fennoscandian Shield: Gallivare-Kiruna. Sweden, (eds. P.Weihed and O.
Martinsson). Luleå Univeristy of Technology Research Report 2000,6, p7.
Candela P.A., (1989), Magmatic ore-forming fluids: Thermodynamic and
mass transfer calculations of metal concentrations. Rev. Econ. Geol. 4, 203–221.
Carlon C.J. (2000) Iron oxide systems and base metal mineralisation in northern Sweden. In
Hydrothermal iron oxide copper-gold and related deposits: a global perspective, (ed.
T.M. Porter) Aust. Min. Found., Glenside, Australia pp. 283–296.
Chou I.M. and Eugster H.P. (1977) Solubility of magnetite in supercritical chloride solutions.
Am. J. Sci. 277, 1296-1314.
Diamond L.W. (1990) Stability of CO2 clathrate hydrate+CO2 liquid+CO2 vapour+aqueous
KCl-NaCl solutions - experimental-determination and application to salinity
estimates of fluid inclusions. Geochim. Cosmochim. Acta 56, 273-280.
Duan Z., Moller N., Weare J.H. (1996) Prediction of the solubility of H2S in NaC1 aqueous
solution: an equation of state approach. Chem. Geol. 130, 15-20.
Edfelt A.,Armstrong R.N., Smith M., and Martinsson O. (2005) Alteration paragenesis and
mineral chemistry of the Tjarrojakka apatite-iron and Cu (-Au) occurrences, Kiruna
area, northern Sweden. Mineral. Dep. 40, 409-434.
Ekdahl E. (1993) Early Proterozoic Karelian and Svecofennian formations and evolution of
the Raahe-Ladoga ore zone, based on the Pielavesi area, central Finland. Geol. Survey
Finland Bull. 373, 1-137.
Fein J.B. and Walther J.V. (1987) Calcite solubility in supercritical CO2-H2O fluids.
Geochim. Cosmochim. Acta 5, 1665-1673.
Fein J.B. and Walther J.V. (1989) Portlandite solubilities in supercritical Ar-H2O mixtures -
implications for quantifying solvent effects. Am. J. Sci. 289, 975-993.
Fontes J.C. and Matray J.M. (1993) Geochemistry and origin of formation brines from
the Paris Basin, France .1. Brines associated with Triassic salts. Chem. Geol.
109, 149-175.
Frietsch R., Tuisku P., Martinsson O. and Perdahl J.A. (1997). Early Proterozoic Cu-(Au)
and Fe ore deposits associated with regional Na-Cl metasomatism in northern
Fennoscandia. Ore Geol. Revs. 12, 1-34.
Frietsch R., Billstrom K., and Perdahl J.A. (1995) Sulfur isotopes in lower Proterozoic iron
and sulfide ores in northern Sweden. Mineral. Dep. 30, 275-284.
Fu B., Williams P.J., Oliver N.H.S., Dong G.Y., Pollard P.J. and Mark G.M. (2003) Fluid
mixing versus unmixing as an ore-forming process in the Cloncurry Fe-oxide-Cu-Au
District, NW Queensland, Australia: evidence from fluid inclusions. J. Geochem.
Explor. 78-9, 617-622.
Geijer P. (1910) Igneous rocks and iron ores of Kiirunavaara,Luossavaara and Tuollavaara:
scientific and practical researches in Lapland arranged by Luossavaara–Kiirunavaara
Aktiebolag, Stockholm. p. 278.
Ghazi A.M. and Shuttleworth S. (2000) Trace element determination of single fluid inclusions
by laser ablation ICP-MS: applications for halites from sedimentary basins. Analyst
125, 205-210.
Gleeson S.A. and Smith M.P. (2009) The sources and evolution of mineralising fluids in iron
oxide–copper–gold systems, Norrbotten, Sweden: Constraints from Br/Cl ratios and
stable Cl isotopes of fluid inclusion leachates. Geochim. Cosmochim. Acta 73, 5658–
5672.
Gleeson S.A. and Turner W.A. (2007) Fluid inclusion constraints on the origin of the brines
responsible for Pb-Zn mineralization at Pine Point and coarse non-saddle and saddle
dolomite formation in southern Northwest Territories. Geofluids 7, 51-68.
Groves D.I., Bierlein F.P., Meinert, L.D. and Hitzman M. (2010) Iron Oxide Copper-Gold
(IOCG) Deposits through Earth History: Implications for Origin, Lithospheric
Setting, and Distinction from Other Epigenetic Iron Oxide Deposits. Econ. Geol. 105,
641-654.
Günther D., Frischknecht R., Muschenborn H.J., and Heinrich C.A. (1997) Direct liquid
ablation: a new calibration strategy for laser ablation ICP-MS microanalysis of solids
and liquids. Fres. J. Anal. Chem. 359, 390-393.
Heinrich C.A., Günther D., Audétat A., Ulrich T., and Frischknecht R. (1999) Metal
fractionation between magmatic brine and vapor, determined by microanalysis of
fluid inclusions: Geology, 27, 755–758.
Hitzman M.W., Oreskes N. and Einaudi M.T. (1992) Geological characteristics and tectonic
setting of Proterozoic iron-oxide (Cu-U-Au-REE) deposits. Precam. Res. 58, 241-
287.
Hitzman M.W. (2000) Iron oxide-Cu-Au deposits: What, where, when and why In
Hydrothermal iron oxide copper-gold and related deposits: a global perspective, (ed.
T.M. Porter) Aus. Min. Found., Glenside, Australia p.9 -26.
Kendrick M.A., Baker T., Fu B., Phillips D., Williams P.J. (2008a) Noble gas and halogen
constraints on regionally extensive mid-crustal Na–Ca metasomatism, the Proterozoic
Eastern Mount Isa Block, Australia. Precam. Res. 163, 131–150.
Kendrick M. A., Honda M., Gillen D., Baker T. and Phillips D. (2008b) New constraints on
regional brecciation in the Wernecke Mountains, Canada from He, Ne, Ar, Kr, Xe,
Cl, Br and I in fluid inclusions. Chem. Geol. 255, 33–36.
Kendrick M.A., Mark G. and Phillips, D. (2007) Mid-crustal fluid mixing in a Proterozoic Fe
oxide–Cu–Au deposit, Ernest Henry, Australia: Evidence from Ar, Kr, Xe, Cl, Br,
and I. Earth Planet. Sci. Letts 256, 328–343
Krumgalz B.S., Pogorelsky R., Pitzer K.S. (1996) Volumetric properties of single aqueous
electrolytes from zero to saturation concentration at 298.15 K represented by Pitzer’s
ion-interaction equations. J. Phys. Chem. Ref. Data 25, 639– 663.
Kwak T.A.P., Brown W.M., Abeysinghe P.B., Tan T.H. (1986) Fe solubilities in very saline
hydrothermal fluids - their relation to zoning in some ore-deposits. Econ. Geol. 81,
447-465.
Lerchbaumer, L. And Audetat, A. (2012) High Cu concentrations in vapor-type fluid
inclusions: An artifact? Geochim. Cosmochim. Acta 88, 255-274.
Li Y., Audetat A., Lerchbaumer L., and Xiong X.L. (2009) Rapid Na, Cu exchange between
synthetic fluid inclusions and external aqueous solutions: evidence from LA-ICP-MS
analysis. Geofluids 9, 321-329.
Lindblom S., Broman C. and Martinsson O. (1996) Magmatic-hydrothermal fluids in the
Pahtohavare Cu–Au deposit in greenstone at Kiruna, Sweden. Mineral. Dep. 31, 307–
318.
Martinsson O. (2004) Geology and metallogeny of the Northern Norrbotten Fe-Cu-Au
province. Soc. Econ. Geol. Guidebook Series 33, 131-148.
Martinsson O. (1997). Tectonic Setting and Metallogeny of the Kiruna Greenstones. PhD
Thesis, Luleå Univ. Tech.
Martinsson O. and Perdahl, J.-A. (1995) Paleoproterozoic extensional and compressional
magmatism in northern Sweden. In J.-A. Perdahl: Svecofennian volcanism in
northern Sweden, Doctoral thesis 1995:169D, Paper II, 1–13. Luleå University of
Technology.
Martinsson O. and Virkkunen R. (2004) Apatite Iron Ores in the Gällivare, Svappavaara, and
Jukkasjärvi Areas. Soc. Econ. Geol. Guidebook Series 33, 167–172.

Martinsson O. and Wanhainen C. (2004) Character of Cu–Au mineralisation and related
hydrothermal alteration along the Nautanen Deformation Zone, Gällivare Area,
Northern Sweden. Soc. Econ. Geol. Guidebook Series 33, 149–160.
Monro D. (1988) The geology and genesis of the Aitik Cu-Au deposit, arctic Sweden. Ph.D.
Thesis, Department of Geology, Univ. Coll. Cardiff.
Niiranen T; Manttari I; Poutiainen M, Oliver N.H.S, and Miller J. (2005) Genesis of
Palaeoproterozoic iron skarns in the Misi region, northern Finland. Mineral. Dep. 40,
192-217.
Oakes C.S., Bodnar R.J. and Simonson J.M. (1990) The system NaCl-CaCl2-H2O .1. The ice
liquidus at 1 atm total pressure. Geochim. Cosmochim. Acta, 54, 603-610.
Pollard P.J. (2006) An intrusion-related origin for Cu-Au mineralization in iron oxide-copper-
gold (IOGC) provinces. Mineral. Dep. 41, 179-197.
Ramboz C., Pichavant M., and Weisbrod, A. (1982) Fluid immiscibility in natural processes –
use and misuse of fluid inclusion data in terms of immscibility. Chem. Geol. 37, 29-
48.
Robb L. (2005) Introduction to Ore-Forming Processes. Blackwell Science.
Roedder E. (1984) Fluid inclusions. Reviews in Mineralogy 12, Mineral. Soc. Amer.
Romer, R. L., Martinsson, O. & Perdahl, J.-A. (1994). Geochronology of the Kiruna
iron ores and hydrothermal alteration. Econ. Geol. 89, 1249^1261.
Seo J.H., Guillong M., and Heinrich C.A. (2009) The role of sulfur in the formation of
magmatic–hydrothermal copper–gold deposits. Earth Planet. Sci. Lett. 282 323–328.
Seo J.H., Guillong M., Aerts M., Zajacz Z., and Heinrich, C.A. (2011) Microanalysis of S,
Cl, and Br in fluid inclusions by LA–ICP-MS. Chem. Geol. 284, 35–44.
Seward T.M., and Barnes H.L. (1997) Metal transport by hydrothermal ore fluids. In
Geochemistry of hydrothermal ore deposits (ed. H.L. Barnes) 3rd
ed., Wiley, New
York, 435–486.

Schmidt C. and Bodnar R.J. (2000) Synthetic fluid inclusions: XVI. PVTX properties in the
system H2O-NaCl-CO2 at elevated temperatures, pressures and salinities. Geochim.
Cosmochim. Acta 64, 3853-3869.
Shmulovich K.I., and Graham C.M. (1996) Melting of albite and dehydration of brucite in
H2O-NaCl fluids to 9 kbars and 700-900 degrees C: Implications for partial melting
and water activities during high pressure metamorphism. Contrib. Mineral. Pet. 124,
370-382.
Skiöld T. (1987) Aspects of the Proterozoic Geochronology of northern Sweden. Precam.
Res. 35, 161–167.
Smith M. P., Storey C. D., Jeffries T. E. and Ryan C. (2009) In-situ U-Pb and trace element
analysis of accessory minerals in the Kiruna district, Norrbotten, Sweden: new
constraints on the timing and origin of mineralisation. J. Petrol. 50, 2063-2094.
Span R and Wagner W. (1996) A new equation of state for carbon dioxide covering the fluid
region from the triple-point temperature to 1100 K at pressures up to 800 MPa. J.
Phys. Chem. Ref. Data 25, 1509-1596
Sterner S. M., Hall D. L. and Bodnar R. J. (1988) Synthetic fluid inclusions. V. Solubility
relations in the system NaCl–KCl–H2O under vapour-saturated conditions. Geochim.
Cosmochim. Acta 52, 989–1005.
Storey C. D., Smith M. P. and Jeffries T. E. (2007) In situ LA-ICPMS U–Pb dating of
metavolcanics of Norrbotten, Sweden: records of extended geological histories in
complex titanite grains. Chem. Geol. 240, 163–181.
Suleimenov M. and Krupp R.E. (1994) Solubility of hydrogen sulfide in pure water and in
NaCl solutions, from 20 to 320°C and at saturation pressures. Geochim. Cosmochim.
Acta 58, 2433-2444.
Ulrich T., Günther D., and Heinrich C.A. (1999) Gold concentrations of magmatic brines and
the metal budget of porphyry copper deposits. Nature, 399, 676–679.
Ulrich T., Günther D., and Heinrich C.A. (2001) Evolution of a porphyry Cu-Au deposit,
based on LA-ICP-MS analysis of fluid inclusions, Bajo de la Alumbrera, Argentina.
Econ. Geol. 96, 1743 –1774.
Walther J.V. and Helgeson H.C. (1980) Description and interpretation of metasomatic phase-
relations at high-pressures and temperatures .1. Equilibrium activities of ionic species
in nonideal mixtures of CO2 and H2O. Am. J. of Sci. 280, 575-606.
Walther J.V and Orville P.M.(1983) the extraction quench technique for determination of the
thermodynamic properties of solute complexes - application to quartz solubility in
fluid mixtures. Am. Mineral. 68, 731-741.
Wanhainen C., Billstrom K., Martinsson O., Stein H. and Nordin R. (2005) 160 Ma of
magmatic/hydrothermal and metamorphic activity in the Gallivare area: Re-Os dating
of molybdenite and U-Pb dating of titanite from the Aitik Cu-Au-Ag deposit,
northern Sweden. Mineral. Dep. 40, 435-447.
Wanhainen C., Broman C. and Martinsson O. (2003) The Aitik Cu-Au-Ag deposit in northern
Sweden: a product of high salinity fluids. Mineral. Dep. 38, 715-726.
Williams P.J., Barton M.D., Johnson D.A., Fontbote L., de Haller A., Mark G., Oliver N.H.S.,
and Marschik R. (2005) Iron oxide copper gold deposits; geology, space–time
distribution, and possible modes of origin. Econ. Geol. 100, 371–405.
Williams P.J., Dong G.Y., Ryan C.G., Pollard P.J., Rotherham J.F., Mernagh T.P. and
Chapman L.H. (2001) Geochemistry of hypersaline fluid inclusions from the Starra
(Fe oxide)-Au-Cu deposit, Cloncurry district, Queensland. Econ. Geol. 96, 875-883.
Williams-Jones A.E. and Samson I.H. (1990) Theoretical estmation of halite solubility in the
ystem NaCl-CaCl2-H2O: Applications to fluid inclusions. Can. Mineral. 28, 299-
304.
Williams-Jones A.E. and Heinrich C.A. (2005) Vapor Transport of Metals and the Formation
of Magmatic-Hydrothermal Ore Deposits. Econ. Geol. 100, 1287-1312.
Wood S.A., and Samson I. (1998) Solubility of ore minerals and complexation
of ore metals in hydrothermal solutions. Rev. Econ. Geol. 10, 33–80.
Yardley B.W.D. (2005) Metal Concentrations in Crustal Fluids and Their Relationship to Ore
Formation. Econ. Geol. 100, 613-632.
Yardley, B.W.D., Banks, D.A., and Bottrell, S.H. (1993) Post-metamorphic gold-quart veins
from N.W. Italy: the composition and origin of the ore fluid. Mineral. Mag. 57, 407-
422.
Zhang Y.G. and Frantz J.D. (1987) Determination of the homogenization temperatures and
densities of supercritical fluids in the system NaCl-KCl-CaCl2-H2O using synthetic
fluid inclusions. Chem. Geol. 64, 335-350.
Tables
Table 1: Localities and descriptions of samples used in this study. Northings and
eastings are given in Swedish National Grid Co-ordinates (RTG80).
Table 2: Summary of fluid inclusion petrography and the results of
microthermometric measurements. All measurements in ºC.
Table 3: Summary of fluid inclusion compositions determined from
microthermometry.
Table 4: Representative results of analyses of fluid inclusion leachates from vein
quartz. Fluid compositions were reconstructed by charge balance of total
cations against Cl molality determined from microthermometric data (Allen et
al., 2005). All concentrations reported in ppm.
Table 5: Table 5: Representative examples of LA-ICPMS analyses of fluid inclusions.
Compositions are shown in ppm as either total cations charge balanced against
Cl molality from microthermometry (Allen et al., 2005) or normalised to Cl
concentration in ppm where the major cations had not been analysed.Table 6:
Comparison of reconstructed fluid composition from crush-leach analyses
with mean reconstructed fluid inclusion composition from LA-ICPMS
analyses. All concentrations in ppm.
Electronic Appendix: Results of microthermometry and LA-ICPMS analyses of fluid
inclusions, reconstructed from microthermometrically determined salinity
using the method of Allan et al., (2005).
Figures
Figure 1: Geological sketch map of northern Norrbotten county, showing the locality
of the deposits and prospects used in this study. Geology adapted from
Bergman et al. (2001).
Figure 2: Meso- to microscale textures in quartz veins from the studied deposits. (a)
Quartz-actinolite vein cutting magnetite-albite altered wall rocks, Nuktus. (b)
Plane polarised, transmitted light photomicrograph of quartz-carbonate vein
cutting magnetite ore, Luossavaara. The vein hosts titanite, now partly altered
to rutile (sample L4.1). The highlighted area is magnified in (c). (c) Plane
polarised, reflected light photograph of area highlighted in (a). There is no
visible alteration of magnetite in the vein wall rock. (d) Quartz-chalcopyrite-
ankerite vein cutting magnetite-albite altered metavolcanic rock, Pahtohavare.
(e) Plane polarised, reflected light photograph of quartz-magnetite-sulphide
vein, Pahtohavare (P11). (d) Plane polarised, combined reflected and
trasnmitted light photograph of quartz-sulphide vein sample A3, Aitik.
Sulphide minerals below the surface of the sample in fractures in quartz are
visible as opaque areas. Act – Actinolite; Alb – Albite; Ank – Ankerite; Cpy –

Chalcopyrite; Prt – Pyrrhotite; Py – Pyrite; Qtz – Quartz; Mgt – Magnetite; Rt
– Rutile; Ttn – titanite.
Figure 3: Petrography of fluid inclusions in studied quartz vein samples. (a) Fragment
of polished wafer from N2.2 showing fluid inclusions along face parallel trails
and growth zones in quartz. See Gleeson and Smith (2009) for further
evidence for primary fluid inclusion origin. (b) Lw+Sh+V inclusion in quartz,
Nuktus. (c) Lw+Sh+Lc+V inclusions in quartz, Henry. (d) Lw+nS+V
inclusions in quartz, Pahtohavare. (e) Lw+nS+V inclusions in quartz,
Gruvberget. (f) Lw+Sh+V inclusion in quartz, Nautanen. (g) Lc+V inclusions
in quartz, Nautanen. (h) Lw+Sh+V in clear secondary trail, Aitik. (i) Single
secondary fluid inclusion trail bearing Lc+V and Lw+Lc+V inclusions,
Nautanen.
Figure 4: Results of fluid inclusion microthermometry in terms of ThL-V and total
salinity as wt. % NaCl eq, and NaCl-CaCl2 ratio from samples from (a) Fe
oxide-apatite deposits.; (b) IOCG deposits; and (c) Deformed deposits
associated with the NDZ.
Figure 5: Estimates of P and T at homogenisation and trapping for different deposit
types. (a)-(c) Comparison of microthermometric data from this study with
isobars of P (in MPa) at halite dissolution from Becker et al. (2008). In nearly
all cases studied here the homogenisation conditions are outside the calibrated
range. (d) Isochors for different fluid inclusion populations from Aitik sample
A3. (e) Representative isochors for fluid inclusions from the Nautanen Cu-Au

prospect. A – approximate range of P at Th for fluid inclusion homogenising
by halite dissolution. B – Zone of P at Th for the Lw+Lc+V inclusions
occupying secondary trails with Lc+V inclusions. These may indicate trapping
conditions for an immiscibility assemblage, and the conditions of at least one
stage of ore genesis. Termination of isochores for Lw+Lc+V inclusions
indicates P at Th. (f) Approximate range of P at Th, and representative
isochores for fluid inclusions from the Ferrum deposit. See text for details of
isochore location and phase boundary construction.
Figure 6: Halogen geochemistry of fluid inclusions from the Norrbotten district. (a)
Comparison of Cl and Br concentrations in reconstructed inclusion fluids with
the seawater evolution trends from Fontes and Matray (1993). (b) Molal Na/Br
and Cl/Br ratios compared with the ranges of ratios from seawater and
‘magmatic’ fluids, and the halite dissolution trend. (c) Plot of molal Cl/Br ratio
against fluid inclusion salinity determined from microthermometry.
Figure 7: Ternary plots of fluid inclusion major element chemistry (as mass %) from
crush leach and LA-ICPMS analyses. The shaded areas in each plot show the
range of Na:Ca ratios determined from microthermometry.
Figure 8: Plots of reconstructed Cu and Fe concentrations against Fe/Mn ratio of fluid
inclusion leachates and LA-ICPMS analyses.
Figure 9: Plots of reconstructed transition and precious metal concentration against
salinity as determined from microthermometry.
Figure 10: (a)-(e) Plots of metal concentration against fluid inclusion homogenisation
temperature. (f)-(h) Representative plots of molal metal/chloride ratio against
1/T. The normalisation of metal to chloride removes the effects of salinity on
concentration, and allows the effects of T to be more fully assessed.
Figure 11: Variation in key metal concentrations with sulphate content of fluid
inclusion leachates. Sulphur was not analysed by LA-ICPMS in this study.
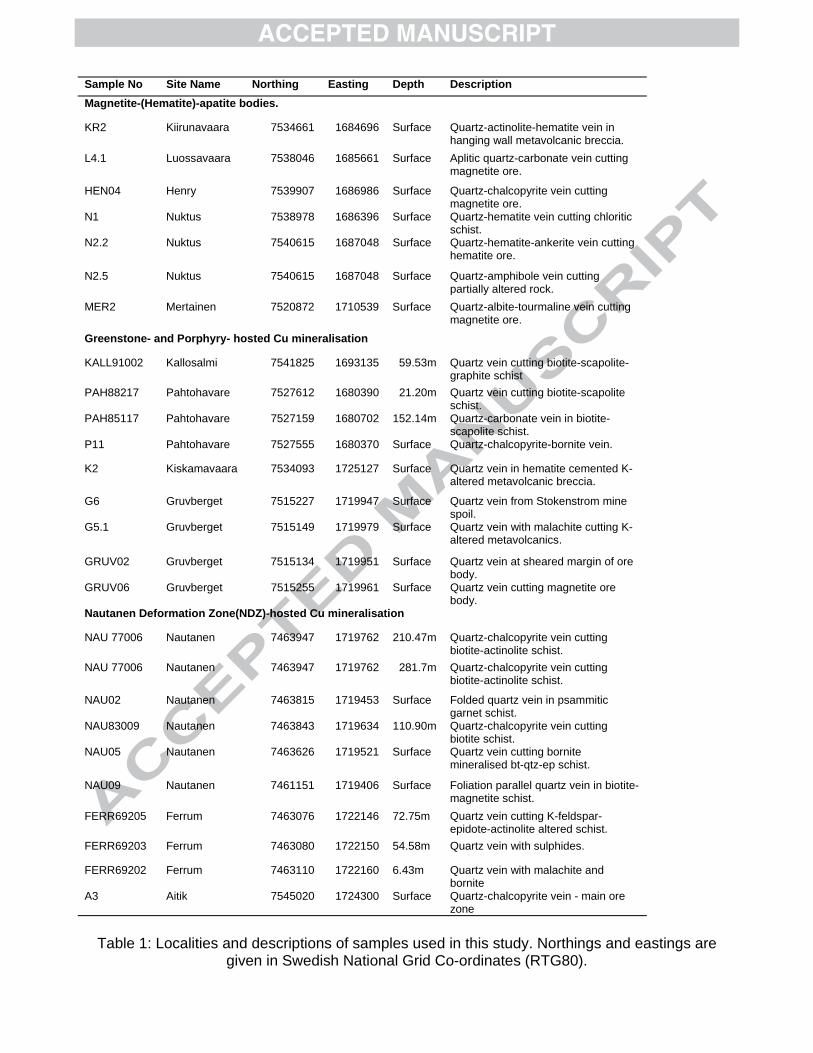
Sample No Site Name Northing Easting Depth Description
Magnetite-(Hematite)-apatite bodies.
KR2 Kiirunavaara 7534661 1684696 Surface Quartz-actinolite-hematite vein in hanging wall metavolcanic breccia.
L4.1 Luossavaara 7538046 1685661 Surface Aplitic quartz-carbonate vein cutting magnetite ore.
HEN04 Henry 7539907 1686986 Surface Quartz-chalcopyrite vein cutting magnetite ore.
N1 Nuktus 7538978 1686396 Surface Quartz-hematite vein cutting chloritic schist.
N2.2 Nuktus 7540615 1687048 Surface Quartz-hematite-ankerite vein cutting hematite ore.
N2.5 Nuktus 7540615 1687048 Surface Quartz-amphibole vein cutting partially altered rock.
MER2 Mertainen 7520872 1710539 Surface Quartz-albite-tourmaline vein cutting magnetite ore.
Greenstone- and Porphyry- hosted Cu mineralisation
KALL91002 Kallosalmi 7541825 1693135 59.53m Quartz vein cutting biotite-scapolite-graphite schist
PAH88217 Pahtohavare 7527612 1680390 21.20m Quartz vein cutting biotite-scapolite schist.
PAH85117 Pahtohavare 7527159 1680702 152.14m Quartz-carbonate vein in biotite-scapolite schist.
P11 Pahtohavare 7527555 1680370 Surface Quartz-chalcopyrite-bornite vein.
K2 Kiskamavaara 7534093 1725127 Surface Quartz vein in hematite cemented K-altered metavolcanic breccia.
G6 Gruvberget 7515227 1719947 Surface Quartz vein from Stokenstrom mine spoil.
G5.1 Gruvberget 7515149 1719979 Surface Quartz vein with malachite cutting K-altered metavolcanics.
GRUV02 Gruvberget 7515134 1719951 Surface Quartz vein at sheared margin of ore body.
GRUV06 Gruvberget 7515255 1719961 Surface Quartz vein cutting magnetite ore body.
Nautanen Deformation Zone(NDZ)-hosted Cu mineralisation
NAU 77006 Nautanen 7463947 1719762 210.47m Quartz-chalcopyrite vein cutting biotite-actinolite schist.
NAU 77006 Nautanen 7463947 1719762 281.7m Quartz-chalcopyrite vein cutting biotite-actinolite schist.
NAU02 Nautanen 7463815 1719453 Surface Folded quartz vein in psammitic garnet schist.
NAU83009 Nautanen 7463843 1719634 110.90m Quartz-chalcopyrite vein cutting biotite schist.
NAU05 Nautanen 7463626 1719521 Surface Quartz vein cutting bornite mineralised bt-qtz-ep schist.
NAU09 Nautanen 7461151 1719406 Surface Foliation parallel quartz vein in biotite-magnetite schist.
FERR69205 Ferrum 7463076 1722146 72.75m Quartz vein cutting K-feldspar-epidote-actinolite altered schist.
FERR69203 Ferrum 7463080 1722150 54.58m Quartz vein with sulphides.
FERR69202 Ferrum 7463110 1722160 6.43m Quartz vein with malachite and bornite
A3 Aitik 7545020 1724300 Surface Quartz-chalcopyrite vein - main ore zone
Table 1: Localities and descriptions of samples used in this study. Northings and eastings are given in Swedish National Grid Co-ordinates (RTG80).

N Inclusion Type
Tfm Tm Tm Tm Tm Th Th T sol
Range CO2 hh ice Clathrate CO2 L-V Halite
Magnetite-(Hematite)-apatite bodies.
KR2 28 Lw+Sh+V P/PS/S -48 to -55 6 -35 102 224
L4.1 28 Lw+Sh+V P/PS/S -52 to -62 10 -29 122 278
HEN04 16 Lw+Sh(+Lc)+V P/PS/S -44 to -68 -56.9 5 -27 24.9 118 249
10 Lw+Lc+V PS/S -28 to -51 -57.1 -26.6 -11.2 21.6 212
N1 28 Lw+Sh+V P/PS/S -52 to -67 12 -30 150 225
N2.2 24 Lw+Sh+V P/PS/S -58 to -69 12 -28.8 103 252
N2.5 21 Lw+Sh+V P/PS/S -57 to -66 10 -27.8 110 258
MER2 25 Lw+nS+V PS/S -60 to -70 14 -27.3 145 437
8 Lw+Sh+V S -32 to -62 12.8 -24.5 106 108
Greenstone- and Porphyry- hosted Cu mineralisation
KALL91002 15 Lw+nS+V P/PS ND 139 404
11 Lw+Sh+V PS/S -66 to -72 101 207
6 Lw+V PS/S -51 to -53 -22.3 120 ND
PAH88217 16 Lw+nS+V P/PS/S ND 119 452
PAH85117 19 Lw+nS+V P/PS/S -44 to -59 -15.1 161 412
Lc+V PS/S -59.7 -6.2
P11 23 Lw+nS+V P/PS/S -54 to -63 11 -25.8 137 375
K2 27 Lw+Sh+V P/PS/S -58 to -70 15 -25.9 118 229
G6 22 Lw+nS+V P/PS -45 to -65 12 -26.9 119 352
8 Lw+Sh+V PS/S 128 336
G5.1 16 Lw+nS+V P/PS 130 246
21 Lc+V PS/S -57.1 8.6
GRUV02 14 Lw+Sh+V PS/S 105 185
21 Lw+V PS/S -53 to -72 -34.5 -13.3 -8.7 137
15 Lc+V S -56.6
GRUV06 28 Lw+V PS/S -56 to -70 -43.9 -36.5 98.2
Nautanen Deformation Zone(NDZ)-hosted Cu mineralisation
NAU 77006 13 Lw+Lc+V PS/S -40 to -59 -56.8 0.2 28.1 263
40 Lw+Sh+V PS/S -52 to -65 6.1 -23.7 196 247
48 Lw+V PS/S -43 to -72 -27.9 -15.2 155
15 Lc+V PS/S -56.7 6.3
NAU 77006 29 Lw+Sh+V PS/S -52 to -66 1.6 -26.3 138 188
20 Lc+V PS/S -56.6 2.6
03NAU02 7 Lw+Sh+V PS/S 154 199
7 Lc+V PS/S -56.6 -8.4
NAU83009 30 Lw+Sh+V PS/S -63 to -73 145 158
3 Lw+Lc+V PS/S -56.6 4 29.3 269
7 Lc+V PS/S -56.7 28.5
NAU05 26 Lw+Sh+V PS/S -52 to -57 -18.3 -27 173 345
26 Lw+V PS/S -72 to -76 -41.4 -27.6 136
9 Lc+V PS/S -56.7 -6.8
NAU09 26 Lw+Sh+V PS/S -53 to -70 -10.9 -34.3 162 231
12 Lw+V PS/S -52 to -58 -29.9 -22.8 132
A3 34 Lw+Sh+V PS/S -79 to -64 12.6 -28.3 111 131
39 Lw+Lc+V S -65 to -45 -57.4 -1.3 17.6 243
11 Lw+V S -62 to -58 104
16 Lc+V S -57.8 2.7
FERR69205 3 Lw+Sh+V PS/S 141 180
18 Lw+V PS/S -52 to -69 -36.6 -18.7 152
FERR69203 13 Lw+Sh+V PS/S -59 to -63 1 -28.8 156 212
16 Lw+V PS/S -64 to -72 -35.3 -24.7 135
FERR69202 27 Lw+V S -66 to -73 -35.1 -18.9 154
7 Lw+V S -48 to -51 -0.6 160
1) P - Primary; PS - Pseudosecondary; S - Secondary
Table 2: Summary of fluid inclusion petrography and the results of microthermometric measurements. All measurements in ºC.

N Inclusion types1 XCO2 Salinity
(wt. % NaCl eq.)2
Salinity (wt. %
NaCl+CaCl2)3
Na:Ca by mass
mean range mean range mean range mean
Magnetite-(Hematite)-apatite bodies.
KR2 28 Lw+Sh+V P/PS/S ND 33.2 31.4-36.6
L4.1 28 Lw+Sh+V P/PS/S ND 36.5 33.4-41.2 41 36-46 4.1
HEN04 16 Lw+Sh(+Lc)+V P/PS/S 0.02 0.01-0.03 34.7 33.3-37.9
10 Lw+Lc+V PS/S 0.04 0.03-0.06 21.4 21.4-21.5
N1 28 Lw+Sh+V P/PS/S ND 33.3 31.5-35.3 37 34-38 2.4
N2.2 24 Lw+Sh+V P/PS/S ND 34.9 32.9-39.4 38 34-43 3.4
N2.5 21 Lw+Sh+V P/PS/S ND 35.3 31.5-38.5 38 34-43 3.7
MER2 25 Lw+nS+V PS/S ND 52.0 40.2-59.5 56 55-58 16.2
Greenstone- and Porphyry- hosted Cu mineralisation
KALL91002 15 Lw+nS+V P/PS ND 49.1 32.7-61.1 50 38-55 5.2
11 Lw+Sh+V PS/S ND 32.2 31.6-32.9
6 Lw+V PS/S ND 24.2 23.9-24.8
PAH88217 16 Lw+nS+V P/PS/S ND 53.6 46.3-57.4
PAH85117 19 Lw+nS+V P/PS/S ND 49.0 41.4-57.0
Lc+V PS/S Lc+V inclusions
P11 23 Lw+nS+V P/PS/S ND 42.0 34.1-49.1 48 44-51 14.7
K2 27 Lw+Sh+V P/PS/S ND 33.5 31.1-37.2 35 34-36 4.9
G6 22 Lw+nS+V P/PS ND 42.8 38.1-48.8 45 41-52 7.3
8 Lw+Sh+V PS/S ND 41.1 40.5-41.6
G5.1 16 Lw+nS+V P/PS ND 34.5 33.2-37.1
Lc+V PS/S Lc+V inclusions
GRUV02 14 Lw+Sh+V PS/S ND 31.3 28.9-33.3
21 Lw+V PS/S ND 16.8 10.2-23.6 16 12-22 0.4
Lc+V S Lc+V inclusions
GRUV06 28 Lw+V PS/S ND 33.1 27.1-41.2 28 24-33 0.27
Nautanen Deformation Zone(NDZ)-hosted Cu mineralisation
NAU 77006 5 Lw+Lc+V PS/S 0.18 0.17-0.20 9.1 3.7-12.4
17 Lw+Sh+V PS/S ND 34.8 31.5-41.0 36 32-43 12.3
22 Lw+V PS/S ND 19.4 12-28.3 18.6 23-23 2.4
Lc+V PS/S Lc+V inclusions
NAU 77006 18 Lw+Sh+V PS/S ND 33.2 31.3-35.0
11 Lw+Sh+V PS/S ND 28.9 27.8-29.9
Lc+V PS/S Lc+V inclusions
03NAU02 20 Lw+Sh+V PS/S ND 33.2 30.2-35.4
Lc+V PS/S Lc+V inclusions
NAU83009 30 Lw+Sh+V PS/S ND 29.3 26.2-32.3
3 Lw+Lc+V PS/S 0.23 0.19-0.29 10.3 6.7-12.9
Lc+V PS/S Lc+V inclusions
NAU05 26 Lw+Sh+V PS/S ND 43.5 31-51.8
26 Lw+V PS/S ND 27.7 21.9-32.5 25.2 22-26 0.4
9 Lc+V PS/S Lc+V inclusions
NAU09 26 Lw+Sh+V PS/S ND 33.6 32-36.5 38.7 37-42 2.5
12 Lw+V PS/S ND 24.5 21.9-26.5
A3 34 Lw+Sh+V PS/S ND 29.0 28.2-29.6
39 Lw+Lc+V S 0.1 0.05-0.29 16.0 9.7-21.1
11 Lw+V S ND 15.7 15.4-15.9
16 Lc+V S Lc+V inclusions
FERR69205 3 Lw+Sh+V PS/S ND 31.3 28.1-33.9
18 Lw+V PS/S ND 21.7 18.6-24.0
FERR69203 13 Lw+Sh+V PS/S ND 32.8 29.1-35.9 35.1 34-38 2.7
16 Lw+V PS/S ND 25.8 24.1-27.2 23.7 22-25 0.3
FERR69202 27 Lw+V S ND 21.8 19.7-25.4 19.8 19-23 0.3
7 Lw+V S ND 1.0
1) P - Primary; PS - Pseudosecondary; S - Secondary 2) Sterner et al. (1988) 3) Oakes et al. (1990)
Table 3: Summary of fluid inclusion compositions determined from microthermometry.
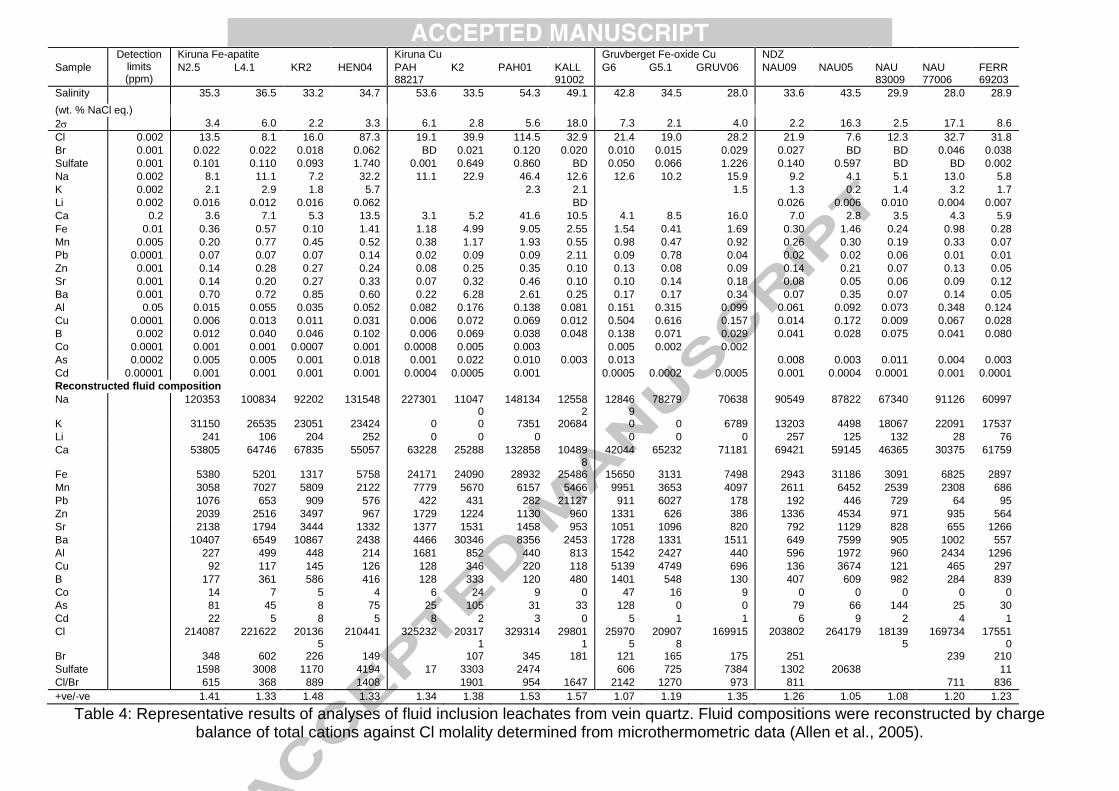
Detection limits (ppm)
Kiruna Fe-apatite Kiruna Cu Gruvberget Fe-oxide Cu NDZ
Sample N2.5 L4.1 KR2 HEN04 PAH 88217
K2 PAH01 KALL 91002
G6 G5.1 GRUV06 NAU09 NAU05 NAU 83009
NAU 77006
FERR 69203
Salinity 35.3 36.5 33.2 34.7 53.6 33.5 54.3 49.1 42.8 34.5 28.0 33.6 43.5 29.9 28.0 28.9
(wt. % NaCl eq.)
2 3.4 6.0 2.2 3.3 6.1 2.8 5.6 18.0 7.3 2.1 4.0 2.2 16.3 2.5 17.1 8.6
Cl 0.002 13.5 8.1 16.0 87.3 19.1 39.9 114.5 32.9 21.4 19.0 28.2 21.9 7.6 12.3 32.7 31.8
Br 0.001 0.022 0.022 0.018 0.062 BD 0.021 0.120 0.020 0.010 0.015 0.029 0.027 BD BD 0.046 0.038
Sulfate 0.001 0.101 0.110 0.093 1.740 0.001 0.649 0.860 BD 0.050 0.066 1.226 0.140 0.597 BD BD 0.002
Na 0.002 8.1 11.1 7.2 32.2 11.1 22.9 46.4 12.6 12.6 10.2 15.9 9.2 4.1 5.1 13.0 5.8
K 0.002 2.1 2.9 1.8 5.7 2.3 2.1 1.5 1.3 0.2 1.4 3.2 1.7
Li 0.002 0.016 0.012 0.016 0.062 BD 0.026 0.006 0.010 0.004 0.007
Ca 0.2 3.6 7.1 5.3 13.5 3.1 5.2 41.6 10.5 4.1 8.5 16.0 7.0 2.8 3.5 4.3 5.9
Fe 0.01 0.36 0.57 0.10 1.41 1.18 4.99 9.05 2.55 1.54 0.41 1.69 0.30 1.46 0.24 0.98 0.28
Mn 0.005 0.20 0.77 0.45 0.52 0.38 1.17 1.93 0.55 0.98 0.47 0.92 0.26 0.30 0.19 0.33 0.07
Pb 0.0001 0.07 0.07 0.07 0.14 0.02 0.09 0.09 2.11 0.09 0.78 0.04 0.02 0.02 0.06 0.01 0.01
Zn 0.001 0.14 0.28 0.27 0.24 0.08 0.25 0.35 0.10 0.13 0.08 0.09 0.14 0.21 0.07 0.13 0.05
Sr 0.001 0.14 0.20 0.27 0.33 0.07 0.32 0.46 0.10 0.10 0.14 0.18 0.08 0.05 0.06 0.09 0.12
Ba 0.001 0.70 0.72 0.85 0.60 0.22 6.28 2.61 0.25 0.17 0.17 0.34 0.07 0.35 0.07 0.14 0.05
Al 0.05 0.015 0.055 0.035 0.052 0.082 0.176 0.138 0.081 0.151 0.315 0.099 0.061 0.092 0.073 0.348 0.124
Cu 0.0001 0.006 0.013 0.011 0.031 0.006 0.072 0.069 0.012 0.504 0.616 0.157 0.014 0.172 0.009 0.067 0.028
B 0.002 0.012 0.040 0.046 0.102 0.006 0.069 0.038 0.048 0.138 0.071 0.029 0.041 0.028 0.075 0.041 0.080
Co 0.0001 0.001 0.001 0.0007 0.001 0.0008 0.005 0.003 0.005 0.002 0.002
As 0.0002 0.005 0.005 0.001 0.018 0.001 0.022 0.010 0.003 0.013 0.008 0.003 0.011 0.004 0.003
Cd 0.00001 0.001 0.001 0.001 0.001 0.0004 0.0005 0.001 0.0005 0.0002 0.0005 0.001 0.0004 0.0001 0.001 0.0001
Reconstructed fluid composition
Na 120353 100834 92202 131548 227301 110470
148134 125582
128469
78279 70638 90549 87822 67340 91126 60997
K 31150 26535 23051 23424 0 0 7351 20684 0 0 6789 13203 4498 18067 22091 17537
Li 241 106 204 252 0 0 0 0 0 0 257 125 132 28 76
Ca 53805 64746 67835 55057 63228 25288 132858 104898
42044 65232 71181 69421 59145 46365 30375 61759
Fe 5380 5201 1317 5758 24171 24090 28932 25486 15650 3131 7498 2943 31186 3091 6825 2897
Mn 3058 7027 5809 2122 7779 5670 6157 5466 9951 3653 4097 2611 6452 2539 2308 686
Pb 1076 653 909 576 422 431 282 21127 911 6027 178 192 446 729 64 95
Zn 2039 2516 3497 967 1729 1224 1130 960 1331 626 386 1336 4534 971 935 564
Sr 2138 1794 3444 1332 1377 1531 1458 953 1051 1096 820 792 1129 828 655 1266
Ba 10407 6549 10867 2438 4466 30346 8356 2453 1728 1331 1511 649 7599 905 1002 557
Al 227 499 448 214 1681 852 440 813 1542 2427 440 596 1972 960 2434 1296
Cu 92 117 145 126 128 346 220 118 5139 4749 696 136 3674 121 465 297
B 177 361 586 416 128 333 120 480 1401 548 130 407 609 982 284 839
Co 14 7 5 4 6 24 9 0 47 16 9 0 0 0 0 0
As 81 45 8 75 25 105 31 33 128 0 0 79 66 144 25 30
Cd 22 5 8 5 8 2 3 0 5 1 1 6 9 2 4 1
Cl 214087 221622 201365
210441 325232 203171
329314 298011
259705
209078
169915 203802 264179 181395
169734 175510
Br 348 602 226 149 107 345 181 121 165 175 251 239 210
Sulfate 1598 3008 1170 4194 17 3303 2474 606 725 7384 1302 20638 11
Cl/Br 615 368 889 1408 1901 954 1647 2142 1270 973 811 711 836
+ve/-ve 1.41 1.33 1.48 1.33 1.34 1.38 1.53 1.57 1.07 1.19 1.35 1.26 1.05 1.08 1.20 1.23
Table 4: Representative results of analyses of fluid inclusion leachates from vein quartz. Fluid compositions were reconstructed by charge balance of total cations against Cl molality determined from microthermometric data (Allen et al., 2005).
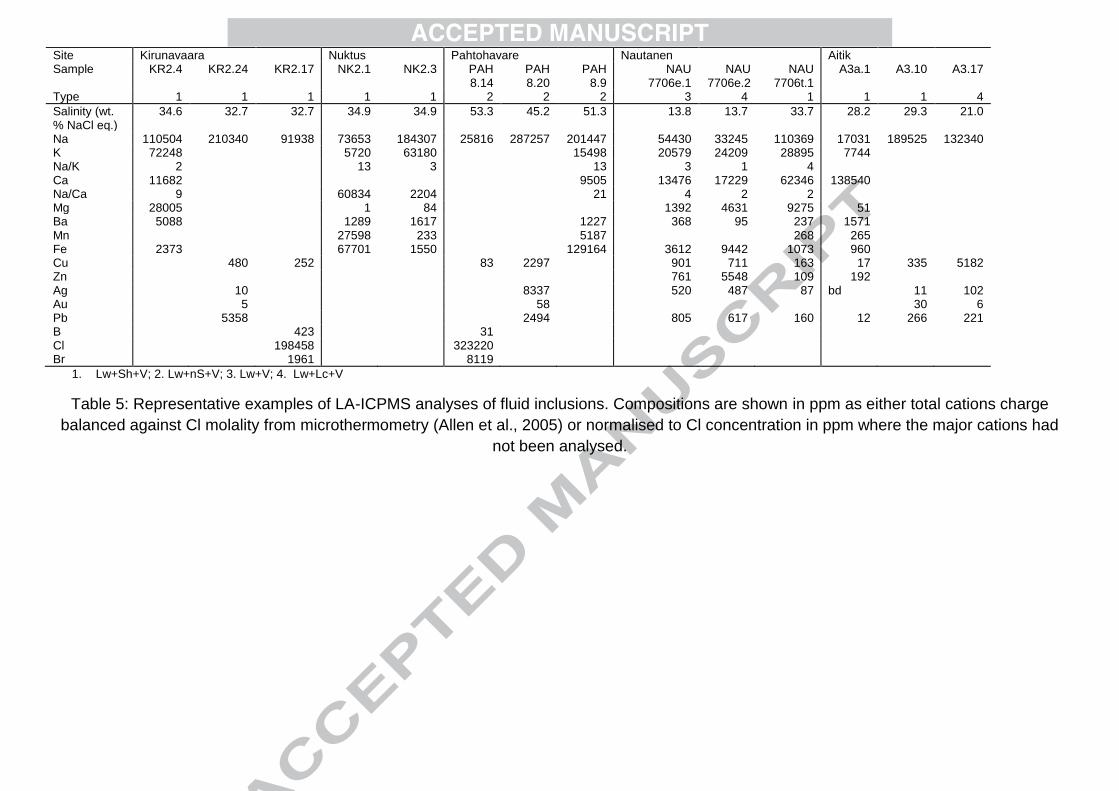
Site Kirunavaara Nuktus Pahtohavare Nautanen Aitik Sample KR2.4 KR2.24 KR2.17 NK2.1 NK2.3 PAH
8.14 PAH 8.20
PAH 8.9
NAU 7706e.1
NAU 7706e.2
NAU 7706t.1
A3a.1 A3.10 A3.17
Type 1 1 1 1 1 2 2 2 3 4 1 1 1 4
Salinity (wt. % NaCl eq.)
34.6 32.7 32.7 34.9 34.9 53.3 45.2 51.3 13.8 13.7 33.7 28.2 29.3 21.0
Na 110504 210340 91938 73653 184307 25816 287257 201447 54430 33245 110369 17031 189525 132340 K 72248 5720 63180 15498 20579 24209 28895 7744 Na/K 2 13 3 13 3 1 4 Ca 11682 9505 13476 17229 62346 138540 Na/Ca 9 60834 2204 21 4 2 2 Mg 28005 1 84 1392 4631 9275 51 Ba 5088 1289 1617 1227 368 95 237 1571 Mn 27598 233 5187 268 265 Fe 2373 67701 1550 129164 3612 9442 1073 960 Cu 480 252 83 2297 901 711 163 17 335 5182 Zn 761 5548 109 192 Ag 10 8337 520 487 87 bd 11 102 Au 5 58 30 6 Pb 5358 2494 805 617 160 12 266 221 B 423 31 Cl 198458 323220 Br 1961 8119
1. Lw+Sh+V; 2. Lw+nS+V; 3. Lw+V; 4. Lw+Lc+V
Table 5: Representative examples of LA-ICPMS analyses of fluid inclusions. Compositions are shown in ppm as either total cations charge
balanced against Cl molality from microthermometry (Allen et al., 2005) or normalised to Cl concentration in ppm where the major cations had
not been analysed.

KR2 N2.5 PAH88217
Crush LA-ICPMS Crush LA-ICPMS Crush LA-ICPMS
-Leach mean 30% RSD
n min max -Leach mean 30% RSD
n min max -Leach mean 30% RSD
n min max
Na 92202 89865 26960 15 44230 139972 120353 139282 41785 8 24140 195543 227301 173263 51979 22 12141 343311
K 23051 91107 27332 15 35434 130390 31150 42940 12882 8 4260 147576 31397 9419 13 4466 82450
Li 204 241
Ca 67835 10916 3275 15 2274 34627 53805 34487 10346 8 2204 160665 63228 43532 13060 13 6390 118877
Fe 1317 2068 620 15 160 6225 5380 20134 6040 8 1550 67701 24171 131303 39391 13 25850 284514
Mn 5809 3058 5120 1536 8 232 27598 7779 12011 3603 13 1063 30996
Pb 909 2779 834 6 432 5358 1076 422 843 253 5 8 2494
Zn 3497 2039 1729
Sr 3444 2138 1377
Ba 10867 4325 1298 15 348 8858 10407 3055 917 8 1289 6046 4466 2315 695 13 127 4503
Al 448 227 1681
Cu 145 558 167 13 36 3268 92 128 2266 680 9 1 2297
B 586 237 71 7 35 423 177 128 664 199 2 31 1298
Co 5 14 6
As 8 81 25
Cd 8 22 8
Cl 201365 191805 57542 7 187644 198458 214087 325232 314187 94256 4 304026 325479
Br 226 2484 745 6 186 1961 348 7609 2283 4 2967 16014
Sulfate 1170 1598 17
Table 6: Comparison of reconstructed fluid composition from crush-leach analyses with mean reconstructed fluid inclusion composition from LA-
ICPMS analyses. All concentrations in ppm.
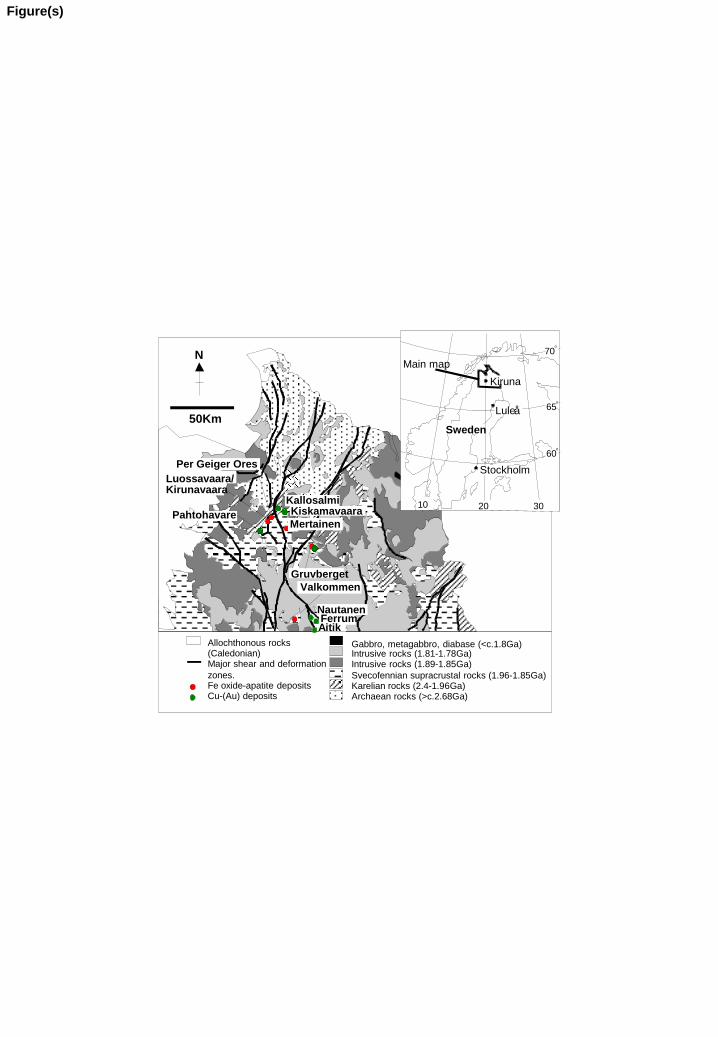
50Km
N
Gabbro, metagabbro, diabase (<c.1.8Ga) Intrusive rocks (1.81-1.78Ga) Intrusive rocks (1.89-1.85Ga)
Svecofennian supracrustal rocks (1.96-1.85Ga) Karelian rocks (2.4-1.96Ga) Archaean rocks (>c.2.68Ga)
Allochthonous rocks (Caledonian) Major shear and deformation
zones. Fe oxide-apatite deposits Cu-(Au) deposits
Luossavaara/ Kirunavaara
Valkommen
Gruvberget
10 20 30
60 o
65 o
70 o
Sweden
Kiruna
Lule å
Stockholm
Main map
Nautanen
Pahtohavare
Kallosalmi
Mertainen
Kiskamavaara
Per Geiger Ores
Ferrum Aitik
Figure(s)

Qtz
Act
Mgt
Alb+Qtz Qtz
Ttn
Rt
Mgt
Qtz Mgt
Cpy Qtz
Ank
Cpy
Mgt Py
Cpy
Qtz
Py
Prt
Qtz
1mm
200mm
500mm 500mm
A B
C D
E F
Figure(s)
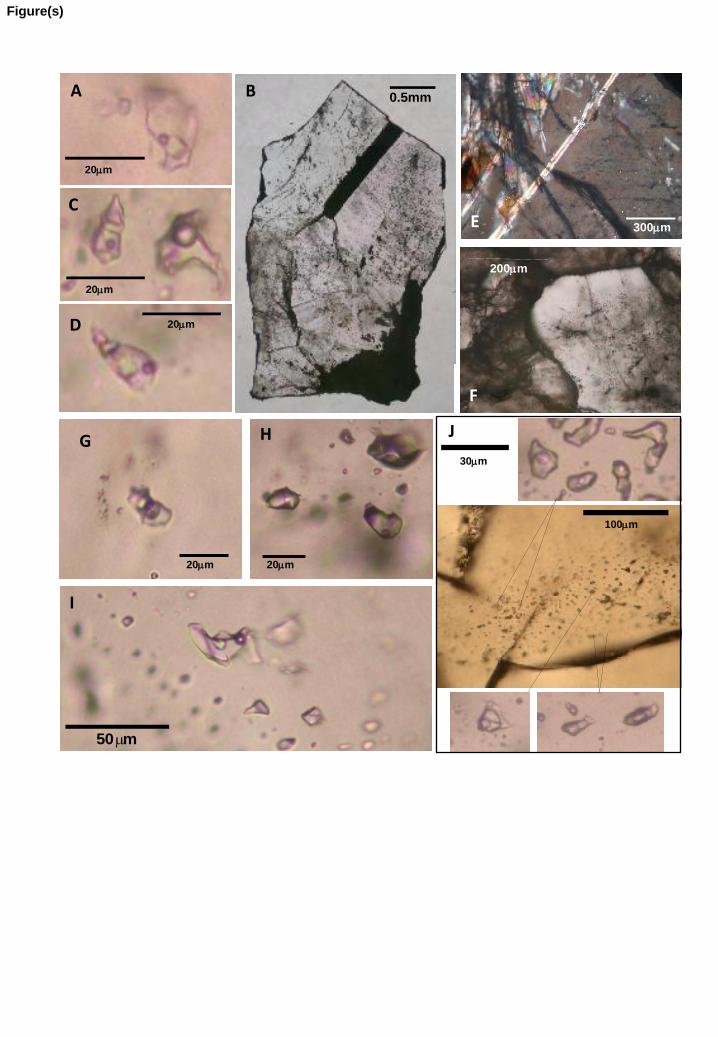
0.5mm
20mm
20mm
20mm
A B
300mm
200mm
C
D
E
F
50mm
20mm 20mm
30mm
100mm
G
I
H J
Figure(s)
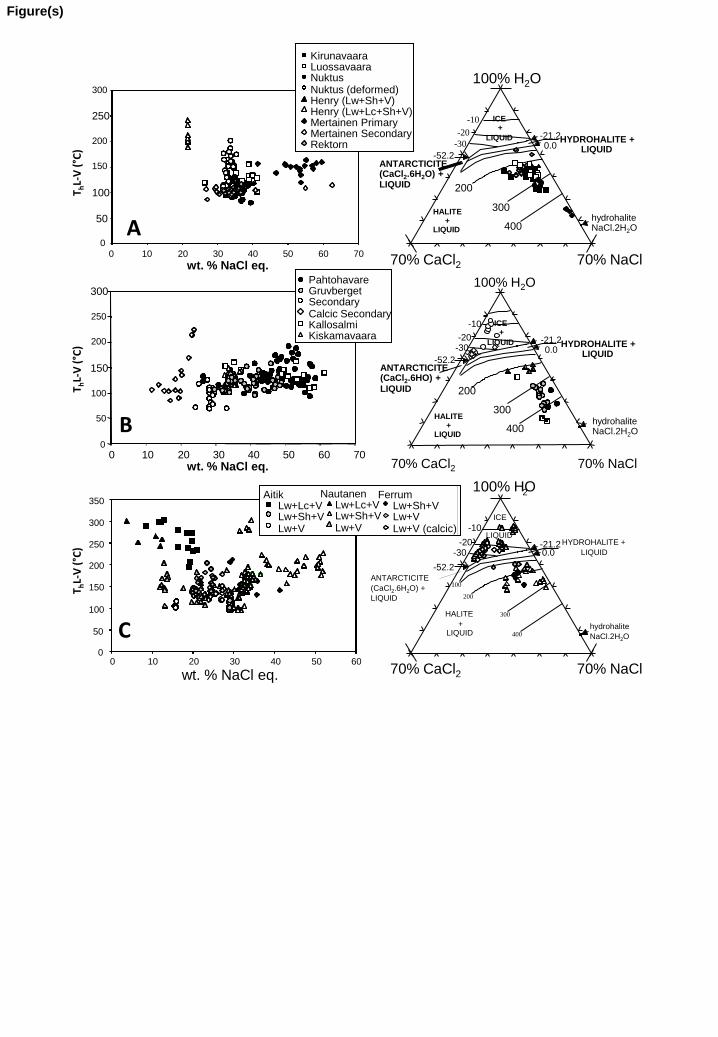
Kirunavaara Luossavaara Nuktus Nuktus (deformed) Henry (Lw+Sh+V) Henry (Lw+Lc+Sh+V) Mertainen Primary Mertainen Secondary Rektorn
hydrohalite NaCl.2H2O
0
50
100
150
200
250
300
0 10 20 30 40 50 60 70
400
300
200
-10
-20
-30 -21.2
-52.2 0.0
ICE +
LIQUID
HALITE +
LIQUID
ANTARCTICITE (CaCl2.6H2O) + LIQUID
HYDROHALITE + LIQUID
wt. % NaCl eq.
100% H2O
70% NaCl 70% CaCl2
400
300
200
0
50
100
150
200
250
300
0 10 20 30 40 50 60 70 wt. % NaCl eq.
Pahtohavare Gruvberget Secondary Calcic Secondary Kallosalmi Kiskamavaara
hydrohalite NaCl.2H2O
-10
-20 -30
-21.2
-52.2 0.0
ICE +
LIQUID
HALITE +
LIQUID
ANTARCTICITE (CaCl2.6HO) +
LIQUID
HYDROHALITE + LIQUID
100% H2O
70% NaCl 70% CaCl2
400
300
200
100
-10
-20 -30
-21.2
-52.2
0.0
hydrohalite
NaCl.2H2O
ICE +
LIQUID
HALITE
+ LIQUID
ANTARCTICITE
(CaCl2.6H2O) +
LIQUID
HYDROHALITE +
LIQUID
0
50
100
150
200
250
300
350
0 10 20 30 40 50 60
wt. % NaCl eq.
100% HO 2
70% NaCl 70% CaCl2
Aitik Lw+Lc+V Lw+Sh+V Lw+V
Nautanen Lw+Lc+V Lw+Sh+V Lw+V
Ferrum Lw+Sh+V Lw+V Lw+V (calcic)
T hL-
V (
°C)
T hL-
V (
°C)
T hL-
V (
°C)
A
B
C
Figure(s)

Ferrum
Aitik
0
50
100
150
200
250
300
350
400
450
500
0 100 200 300 400 500 600
Lw+Sh+V Lc+V
Th to Lc
Lw+Lc+V
21.0 wt % NaCl eq
XCO2=0.04
Lw+Lc+V
8.5 wt % NaCl eq
XCO2=0.08
Lw+Lc+V
19.7wt % NaCl eq
XCO2=0.3
Lc+V
Th to V
T ( C)
P (
MP
a)
0
100
200
300
400
500
600
0 100 200 300 400 500 600
Lc+V
Th to Lc
Lw+Lc+V
6.7 wt % NaCl eq
XCO2=0.22
Lw+Lc+V
12.9 wt % NaCl eq
XCO2=0.21
Lw+Lc+V
10.9 wt % NaCl eq
XCO2=0.16
Lw+Lc+V
6.5wt % NaCl eq
XCO2=0.19
Lw+V
13.0 wt % NaCl+CaCl2
Th=172
Lw+V
19.0 wt % NaCl+CaCl2
Th=144
Lw+V
26.0 wt % NaCl+CaCl2
Th=134
T ( C)
P (
MP
a)
A
B
Calcic
22.5 wt. %
NaCl+CaCl2 eq.
NaCl/CaCl2=0.36
Th=131 C Calcic
19.0 wt. %
NaCl+CaCl2 eq.
NaCl/CaCl2=0.30
Th=153 C
0
100
200
300
400
500
600
0 100 200 300 400 500 600 T ( C)
P (
MP
a)
Th L
-V (
°C)
Th L
-V (
°C) 50
100 150 200 250 300 P (Mpa)
50
100
150
200
250
300
350
400
50 100 150 200 250 300 350 400 450 500 Tsol Halite (°C)
Magnetite-apatite deposits
Kirunavaara Luossavaara Nuktus Nuktus (deformed) Henry (Lw+Sh+V) Mertainen Primary Mertainen Secondary Rektorn
50 100
200 250 300 P (Mpa)
50
100
150
200
250
300
350
400
50 100 150 200 250 300 350 400 450 500 Tsol Halite (°C)
IOCG deposits
150
Pahtohavare Kallosalmi Kiskamavaara Gruvberget
Deformed (NDZ) Cu-Au
deposits
50 100
200 250 300 P (Mpa)
50
100
150
200
250
300
350
400
50 100 150 200 250 300 350 400 450 500 Tsol Halite (°C)
Th L
-V (
°C)
150
Aitik Nautanen Ferrum
A B
C D
E F
Figure(s)
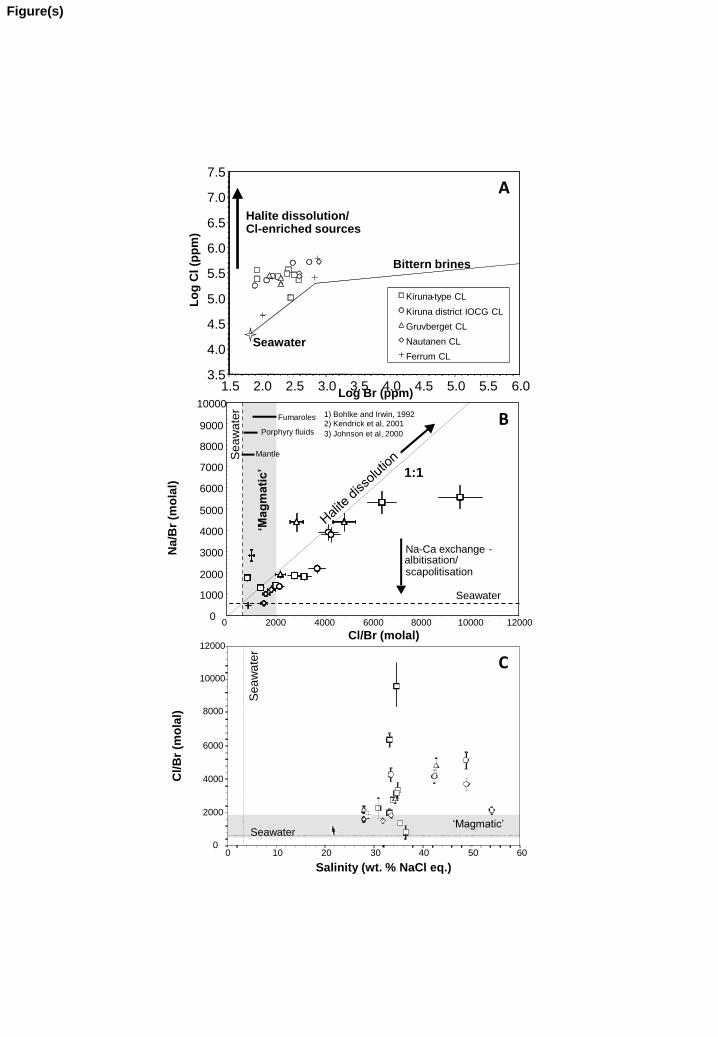
Seawater
Halite dissolution/ Cl-enriched sources
Bittern brines
Log Br (ppm)
Lo
g C
l (p
pm
)
0
1000
2000
3000
4000
5000
6000
7000
8000
9000
10000
0 2000 4000 6000 8000 10000 12000
Cl/Br (molal)
Na/B
r (m
ola
l)
Seawater
0
2000
4000
6000
8000
10000
12000
0 10 20 30 40 50 60
Salinity (wt. % NaCl eq.)
Cl/
Br
(mo
lal)
Seawater ‘Magmatic’
Se
aw
ate
r
1:1
1) Bohlke and Irwin, 1992 2) Kendrick et al, 2001
3) Johnson et al, 2000
Se
aw
ate
r
Porphyry fluids
Mantle
Fumaroles
‘Magmatic’
Na-Ca exchange - albitisation/ scapolitisation
3.5
4.0
4.5
5.0
5.5
6.0
6.5
7.0
7.5
1.5 2.0 2.5 3.0 3.5 4.0 4.5 5.0 5.5 6.0
Kiruna - type CL
Kiruna district IOCG CL
Gruvberget CL
Nautanen CL
Ferrum CL
A
B
C
Figure(s)

Na
Ca K
Na
Ca K
Na
Ca K
Kiruna (Laser Ablation) Nuktus (Laser Ablation) Kiruna type (Crush leach)
Pahtohavare (Laser ablation) IOCGs (Crush Leach) Gruvberget (Crush Leach)
Nautanen (Laser Ablation) Lw+V Lw+Lc+V Lw+Sh+V Aitik (Laser ablation) Lw+Sh+V Nautanen (Crush Leach) Ferrum (Crush Leach)
IOCGs
Gruvberget Ca-rich secondaries
A
B
C
Figure(s)

1
10
102
103
104
105
106 F
e (
pp
m)
10-2 10-1 1 10 102 103
Fe/Mn
1
10
102
103
104
Cu
(p
pm
)
10-2 10-1 1 10 102 103
Fe/Mn
B
Kiruna-type IOCG NDZ (crush leach) NDZ Lw+v NDZ Lw+Sh+V NDZ Lw+Lc+V
CL LA-ICPMS
A
Figure(s)
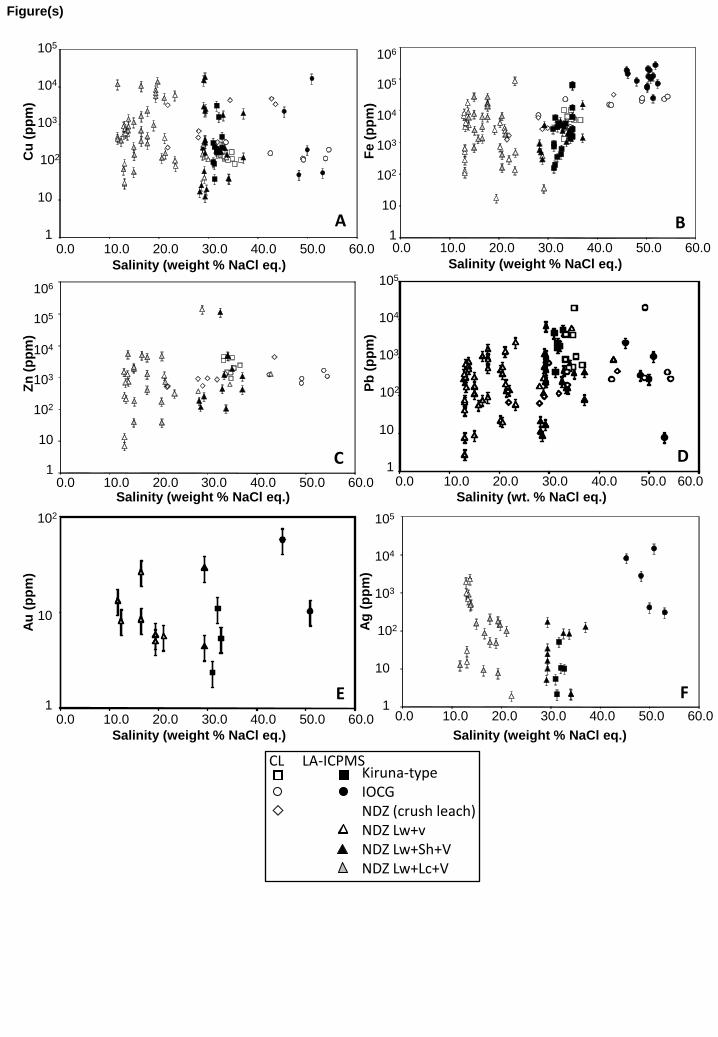
1
10
102
103
104
105
0.0 10.0 20.0 30.0 40.0 50.0 60.0
Salinity (weight % NaCl eq.)
Cu
(p
pm
)
1
10
103
104
105
Fe (
pp
m)
102
106
0.0 10.0 20.0 30.0 40.0 50.0 60.0
Salinity (weight % NaCl eq.)
0.0 10.0 20.0 30.0 40.0 50.0 60.0 Salinity (weight % NaCl eq.)
Zn
(p
pm
)
0.0 10.0 20.0 30.0 40.0 50.0 60.0
Salinity (wt. % NaCl eq.)
1
10
102
103
104
105
Pb
(p
pm
)
0.0 10.0 20.0 30.0 40.0 50.0 60.0
Salinity (weight % NaCl eq.)
1
10
102
Au
(p
pm
)
0.0 10.0 20.0 30.0 40.0 50.0 60.0
Salinity (weight % NaCl eq.)
1
10
102
103
104
105
Ag
(p
pm
)
Kiruna-type IOCG NDZ (crush leach) NDZ Lw+v NDZ Lw+Sh+V NDZ Lw+Lc+V
CL LA-ICPMS
1
10
103
104
105
102
106
A B
C D
E F
Figure(s)
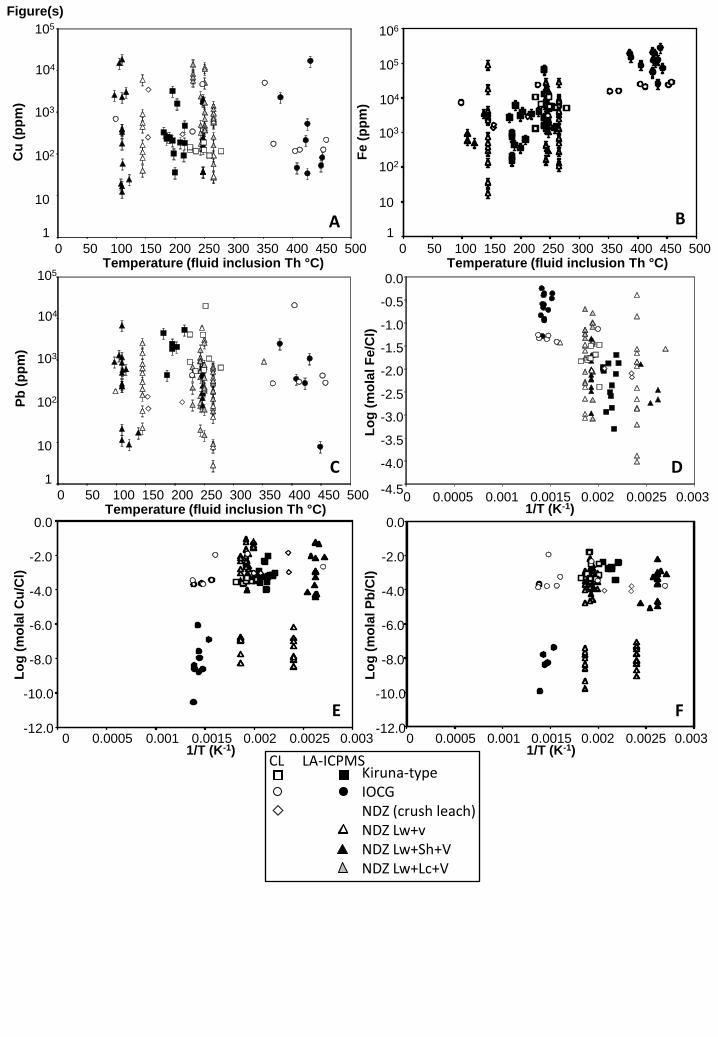
-4.5
-4.0
-3.5
-3.0
-2.5
-2.0
-1.5
-1.0
-0.5
0.0
0 0.0005 0.001 0.0015 0.002 0.0025 0.003
1
10
102
103
104
105
0 50 100 150 200 250 300 350 400 450 500 Temperature (fluid inclusion Th °C)
Cu
(p
pm
)
1
10
102
103
104
105
0 50 100 150 200 250 300 350 400 450 500 Temperature (fluid inclusion Th °C)
Fe (
pp
m)
106
1
10
102
103
104
105
0 50 100 150 200 250 300 350 400 450 500 Temperature (fluid inclusion Th °C)
Pb
(p
pm
)
1/T (K-1)
Lo
g (
mo
lal F
e/C
l)
-12.0
-10.0
-8.0
-6.0
-4.0
-2.0
0.0
Lo
g (
mo
lal C
u/C
l)
0 0.0005 0.001 0.0015 0.002 0.0025 0.003 1/T (K-1)
-12.0
-10.0
-8.0
-6.0
-4.0
-2.0
0.0
Lo
g (
mo
lal P
b/C
l)
0 0.0005 0.001 0.0015 0.002 0.0025 0.003 1/T (K-1)
Kiruna-type IOCG NDZ (crush leach) NDZ Lw+v NDZ Lw+Sh+V NDZ Lw+Lc+V
CL LA-ICPMS
A B
C D
E F
Figure(s)

102
103
104
0 5000 10000 15000 20000 25000 30000 SO4 (ppm)
Cu
(p
pm
)
102
103
104
105
0 5000 10000 15000 20000 25000 30000 SO4 (ppm)
Fe (
pp
m)
102
103
104
0 5000 10000 15000 20000 25000 30000
Zn
(p
pm
)
SO4 (ppm)
102
103
104
105
0 5000 10000 15000 20000 25000 30000
SO4 (ppm)
Pb
(p
pm
)
Kiruna type IOCG Gruveberget Nautanen Ferrum
A B
C D
Figure(s)