hypatia investor overview_jan2015
TRANSCRIPT
Hypatia©
Product Support/Aftermarket
Financial Analytics Software Tool
1
Investor Overview

Giuntini & Co. Overview
• Management consulting firm started in 1991.
• Employees a team of industry-specific Subject Matter
Experts.
• Focused on assisting commercial and military OEMs,
and their key suppliers.
• Develop business cases for supplying traditional and
innovative solutions impacting the efficiency and
effectiveness of the Product Support/Aftermarket
processes employed throughout the life of a machine.
o Configuration of solution offering.
o Financial statements.
o Channels of distributions.
o Source of resource employed.
o Value to machine user: decrease Total Ownership
Cost [TOC], increase machine availability and
mitigate risks.
2
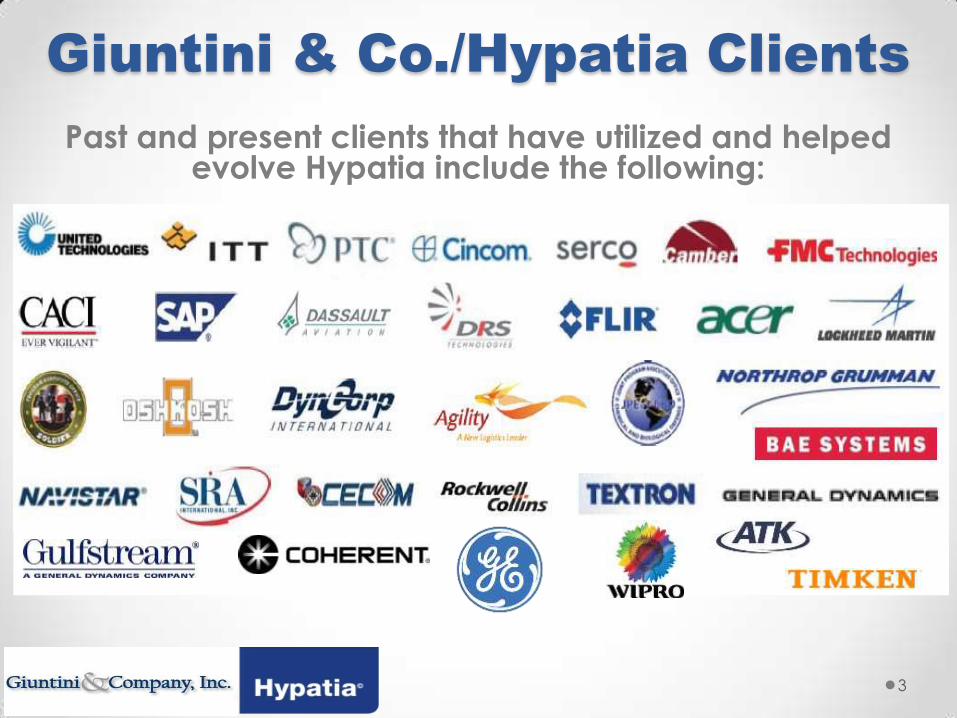
Giuntini & Co./Hypatia Clients
Past and present clients that have utilized and helped evolve Hypatia include the following:
3

Expertise
4
• WSJ: Quoted on Product Support business issues.
• IDGA: Provided a dozen lectures on the military Product Support Enterprise,
many published articles, webinars, podcasts, etc.
• Indiana University Kelley School Of Business Journal General business article
on Product Support future trends.
• Material Handling & Logistics Trade publication; advisory board expert on
Product Support, numerous articles included.
• Center for Remanufacturing: Business advisor to academic and technical Product Support community.
• Warranty Chain Management Conference: workshop leader for
international conference.
• ReedSmith: Supply Chain Management Subject Matter Expert for a $70M
lawsuit.
• Booz&Co.: Management consultant in NYC office.
• US Int. Trade commission: Provided expertise for large scale study on the
global trade of Product Support products.
• SAE: Presented Product Support, peer reviewed, whitepaper for International professional conference.

What is Hypatia?
• First-of-its-kind, scenario-based Product Support/Aftermarket (assures machine’s
Capabilities, Reliability, Availability and Capacity [CRAC] through-life)
financial analytics software tool.
• Developed and validated over 35+ years with some of the world's largest defense
and commercial capital equipment enterprises.
• Delivers an unparalleled drill-down into the deepest levels of Product
Support/Aftermarket lifecycle financials.
o Income statement
o Balance sheet
o Cash flow
5

Most Recent Hypatia Clients
and Program Costs
GE: Waukesha Engine Product Line of Power & Water Business Unit ($1B)
Hypatia function: Remanufacturing/Rebuild Product Support/Aftermarket
market sizing and prescriptive analytics
FLIR/DOD: DRSKO (Dismounted Reconnaissance Sets Kits Outfits), Joint
CBRNe Program ($500M)
Hypatia function: Lifecycle Product Support/Aftermarket
Revenue/Expenditures
CACI: WIN-T (Warfighter Information Network Tactical) ($4B)
Hypatia function: Lifecycle Product Support/Aftermarket
Revenue/Expenditures
Navistar: MRAP (Mine Resistant Ambush Protected) Vehicle Program ($4B)
Hypatia function: Lifecycle Product Support/Aftermarket
Revenue/Expenditures
6
Commercial Off The Shelf [COTS]

The Product Support Market
7
•U.S. $500 billion annual expenditures employed in Product
Support/Aftermarket processes.
• 175 US publically-held OEMs, segmented into multiple divisions.
• 500 key suppliers divisions segmented into multiple divisions.
• US global share of market is 35%.
• <10% of OEMs and suppliers segment Product Support/Aftermarket on 10K; “the invisible profit driver”.
• Product Support/Aftermarket profit margins are 50% to 100% higher than new product sales.
• Product Support/Aftermarket future profits can be financially material in the acquisition of an OEM or
a supplier; impacts goodwill.
• Existing tactical application software is considered “poor” by Product Support/Aftermarket
community; SAP has publically acknowledged their failings.
• No known Hypatia comparable software product exists, extensive research performed.
• OEM/supplier leadership often “in the dark” on overall Product Support/Aftermarket financial
performance.
• Note that Hypatia can be scaled for use by in-house maintenance teams, although not targeted.

Value of Hypatia to the Market
• Drastically reduces time to perform analytics.
• Delivers outputs that have been proven to be
accurate.
• Provides reasonable default assumptions for any data
input lapses – outputs delivered no matter what.
• Customer does not require large amounts of data to
be collected; large proprietary data base is employed.
• Provides extensive what-if capabilities.
• Provides all outputs in graphic presentation.
• Employs Monte Carlo simulations for estimating
accuracy.
• All inputs normalized.
8


10
Why Invest In Hypatia?
• Pricing Power: A unique prescriptive analytic software tool with no known
current competitor.
• High Entry Difficulty: A proprietary data base of Cost Estimating Relationships
[CER] composed over several decades.
• IP Remains in Developer’s Domain: A subscription service with a recurring
revenue pricing model.
• Low R&D Costs: Software already field tested as MS Excel workbook; SQL data
base conversion extremely efficient.
• Premium Pay for Output Access: Niche market focused upon higher level
professionals.
• Hypatia Could Be Worth $50-$100 Million Within 4-7 Years: All major
ERP software companies will want to acquire software to complete current product
line; given PTC’s recent acquisition in this area.

Projected Financials
11
Pro Forma Revenue/Expenditures
Inputs Year ($millions)
0 1 2 3 4 5
# of new projects 0 7 15 75 102 196
# of active projects 0 7 22 97 199 395
Market Penetration 0 0.2% 0.5% 2.4% 4.8% 9.6%
Consulting project initialization
fees $0.00 $0.53 $1.13 $5.63 $7.65 $14.70
Subscription fees $0.00 $0.25 $0.77 $3.40 $6.97 $13.83
Revenues Total $0.00 $0.77 $1.90 $9.02 $14.62 $28.53
Revenue Growth Rate N/A N/A 146% 376% 62% 95%
Software Development $0.45 $0.45 $0.45 $0.40 $0.40 $0.40
Marketing/ Sales $0.15 $0.18 $0.55 $1.25 $2.94 $3.75
Subject Matter Experts/
Consultants $0.10 $0.39 $0.84 $4.22 $5.74 $11.03
Management/ Indirect/ IT
infrastructure/Legal $0.18 $0.12 $0.28 $1.35 $2.19 $4.28
Expenditures Total $0.88 $1.14 $2.13 $7.22 $11.27 $19.45
Giuntini & Company, Inc. Hypatia Software
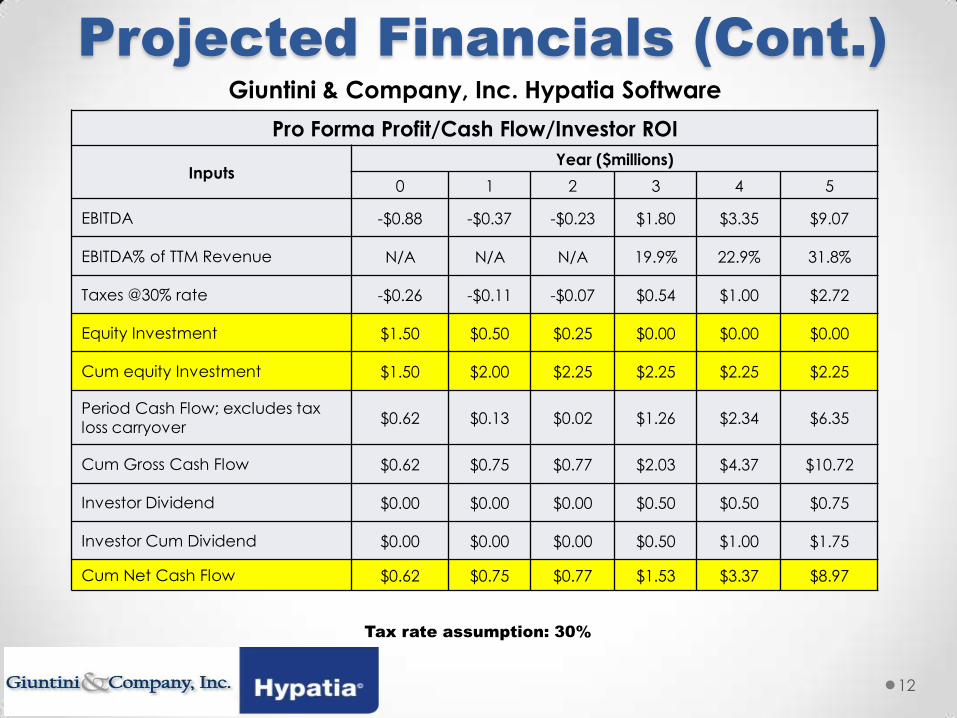
Projected Financials (Cont.)
12
Tax rate assumption: 30%
Giuntini & Company, Inc. Hypatia Software
Pro Forma Profit/Cash Flow/Investor ROI
Inputs Year ($millions)
0 1 2 3 4 5
EBITDA -$0.88 -$0.37 -$0.23 $1.80 $3.35 $9.07
EBITDA% of TTM Revenue N/A N/A N/A 19.9% 22.9% 31.8%
Taxes @30% rate -$0.26 -$0.11 -$0.07 $0.54 $1.00 $2.72
Equity Investment $1.50 $0.50 $0.25 $0.00 $0.00 $0.00
Cum equity Investment $1.50 $2.00 $2.25 $2.25 $2.25 $2.25
Period Cash Flow; excludes tax loss carryover
$0.62 $0.13 $0.02 $1.26 $2.34 $6.35
Cum Gross Cash Flow $0.62 $0.75 $0.77 $2.03 $4.37 $10.72
Investor Dividend $0.00 $0.00 $0.00 $0.50 $0.50 $0.75
Investor Cum Dividend $0.00 $0.00 $0.00 $0.50 $1.00 $1.75
Cum Net Cash Flow $0.62 $0.75 $0.77 $1.53 $3.37 $8.97

Projected Financials (Cont.)
13
6th Year Investment Exit
Estimated enterprise value ($million)
based upon projected 5th year ending:
TTM revenue, revenue growth rate and
EBITDA %
$65.00
Investor equity stake % 7.0%
Investor equity value ($million) $4.55
Simple investor annual ROI% 36.0%
Giuntini & Company, Inc. Hypatia Software

Contact Information
14
Ron Giuntini – Principal and CEO
570.713.4795
Greg Giuntini – Partner and Director of Business Development
646.280.8374
www.giuntinicompany.com


Replacement Value Breakdown
16
Current U.S. replacement
value of commercial and
military systems broken down
by industry. Figures in millions.

Hypatia Workflow
1. Baseline Inputs: o Building product library
along with Hypatia reference data down to the most granular level.
2. Baseline Outputs:
o Initial data points/calculations based on configuration entry.
3. Dynamic Simulation:
o Live simulation comparing baseline data against rapidly adjustable data points.
17


21
1. Forecast 777 Installed Base • What-if Boeing’s planned aircraft deliveries are changed?
• What-if the planned operator aircraft retirements are changed?
• What if Parker’s planned warranty program effectivity duration is changed?
• Employing a limited Monte Carlo simulation for identifying the what-if scenario that
appears to have high probability of being accurate.
2. Forecast Total Annual Product Support/Aftermarket Expenditures/Revenues Segmented
by Process Employed • What-if mod/upgrade/reman/overhaul/reset/recapitalize programs planned
frequencies are changed?
• What-if the planned transactional revenue of a program is changed?
3. Forecast Product Support/Aftermarket Global Parts Investment Employed by All
Processes • What-if parts availability levels are changed?
• What-if the flight hours of a segment of the fleet operators is changed?
Recent Boeing Hypatia Demo Simulations:
Control System Division's Boeing B777 1567700-3
Flaperon PCU Assembly
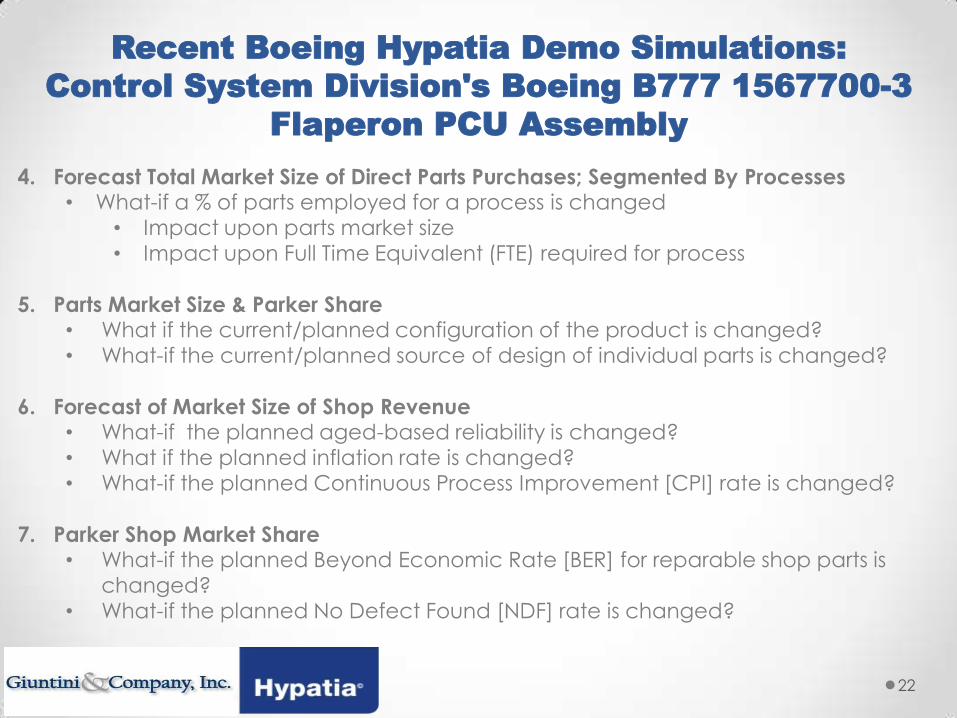
22
4. Forecast Total Market Size of Direct Parts Purchases; Segmented By Processes • What-if a % of parts employed for a process is changed
• Impact upon parts market size
• Impact upon Full Time Equivalent (FTE) required for process
5. Parts Market Size & Parker Share • What if the current/planned configuration of the product is changed?
• What-if the current/planned source of design of individual parts is changed?
6. Forecast of Market Size of Shop Revenue • What-if the planned aged-based reliability is changed?
• What if the planned inflation rate is changed?
• What-if the planned Continuous Process Improvement [CPI] rate is changed?
7. Parker Shop Market Share • What-if the planned Beyond Economic Rate [BER] for reparable shop parts is
changed?
• What-if the planned No Defect Found [NDF] rate is changed?
Recent Boeing Hypatia Demo Simulations:
Control System Division's Boeing B777 1567700-3
Flaperon PCU Assembly