hyperacute stroke asessment - sth.nhs.uk stroke... · ‘stay and play’ – the mobile stroke...
TRANSCRIPT

Hyperacute Stroke Assessment
Dr Ali Ali
Consultant Stroke and Geriatrics
Sheffield Teaching Hospitals

Objectives
• Importance of assessment
• Key aspects of the pathway
• Know where the problems are
• Enhancing efficiency

What are we aiming for?
• As many patients who suffer stroke presenting as early as possible.
• Rapid assessment by decision makers.
• Deliver thrombolysis all eligible patients with stroke.
• Deliver it as quickly as possible.
• Minimise risks to those with mimics.
• Offer mechanical thrombectomy to those patients eligible for such treatments.
• Ensure an optimised patient journey throughout.
• Improved long term outcomes.

Time dependent treatment C
BF
(m
l/100g
bra
in/m
in)
0
20
50
Normal flow, normal function
Low flow, raised O2 extraction, normal function
Reversible reduced function
Irreversible reduced function
Time

Pooled Analysis NINDS, ECASS I-III, Atlantis, EPITHET
Lees et al. Lancet 2010
NNT=14 NNT=10
NNT=4

Stroke – Worldwide burden World Deaths x 10^6 % deaths
Coronary heart dx 7.20 12.2
Stroke 5.71 9.7
Lower resp infections 4.18 7.1
COPD 3.02 5.1
Diarrhoeal diseases 2.16 3.7
HIV/AIDS 2.04 3.5
Tuberculosis 1.46 2.5
Pulmonary cancers 1.32 2.3
MVA 2.27 2.2
Prematurity/LBW 1.18 2.0
WHO 2012

Stroke – National burden
• Approx. 150,000 strokes each year in the UK
• 4th leading cause of death in the UK
• Leading cause of disability
• 30 day mortality of 15%
• 1 in 4 < 65 years old
• Costs: - £2.8 billion direct care costs
- £1.8 billion lost productivity & disability
- £2.4 billion informal care costs
At least £7 billion per year
Stroke Association

Stroke - Sheffield • ~ 450,000 people 16 yrs and over.
• Annually we see: – 400 high risk TIA’s
– 1800 admissions to stroke unit:
• 850 – stroke mimics
• 925 – stroke (2/3 new) 1/1000 1.2-1.3/1000
• ~ 11,500 stroke survivors 2.1% 1.7%
• ~ 3,500 living with severe stroke.
Incidence / prevalence Sheffield UK
SNAPP 2013-15 (https://www.strokeaudit.org/results/regional.aspx last accessed 14/07/15), SEPHO 2011

Hyperacute stroke assessment
So how do we get it right?
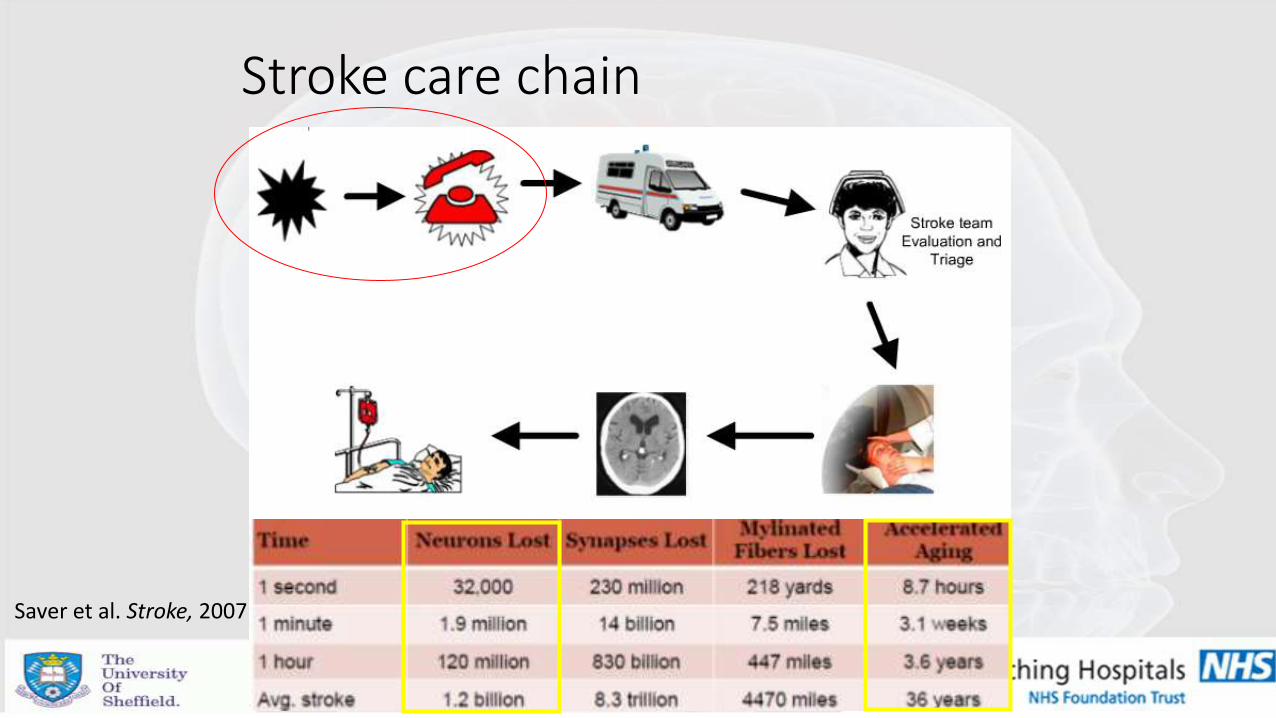
Stroke care chain
Saver et al. Stroke, 2007

Symptoms to call
• The main delay to treatment – biggest barrier to thrombolysis.
Mosely et al. Stroke, 2007

Stroke awareness campaigns – 2009 in the UK

• Many don’t remember what the acronym stands for (60%) – don’t recognise it could be a stroke.
• Some feel ‘burning brain’ is misleading.
• Possible factors that increase likelihood of early help seeking: • Increased stroke severity • Presence of witness
• Many other barriers: • No time / fear or anxiety
Stroke awareness campaigns – 2009 in the UK
Zock et al Acta Neurol Belg 2016 Mellor et al Em Med J 2015

Effect of public awareness campaigns on emergency calls
Goldstein P & Leys D, personal data on file

Assessment and transfer
Recognition / YAS
HASU or A&E
Nor AM, et al. Stroke 2004
Agreement between paramedic and
physician reported neurological signs
using FAST
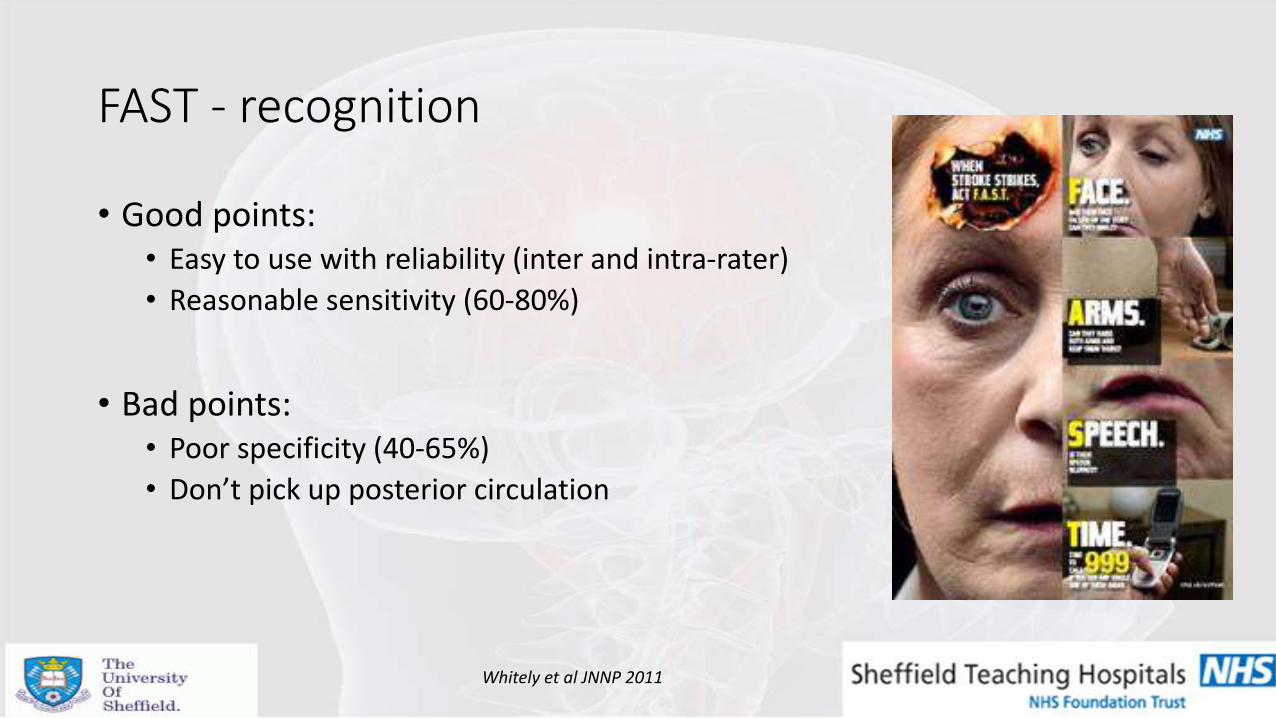
• Good points: • Easy to use with reliability (inter and intra-rater)
• Reasonable sensitivity (60-80%)
• Bad points: • Poor specificity (40-65%)
• Don’t pick up posterior circulation
FAST - recognition
Whitely et al JNNP 2011

Ambulance response times
• ORCON category A – Chest Pain
Breathing difficulty
Unconscious
Child < 2 yrs
• Unless stroke causes any of above – category B – 19 mins.
• Only ~50% of these targets are met – therefore even longer waits in reality.
• 90% of our patients arrive by ambulance.
8 mins.
Turner et al, 2006, Costs and benefits of changing ambulance service response time performance standards https://www.strokeaudit.org/results/regional.aspx last accessed 14/07/15
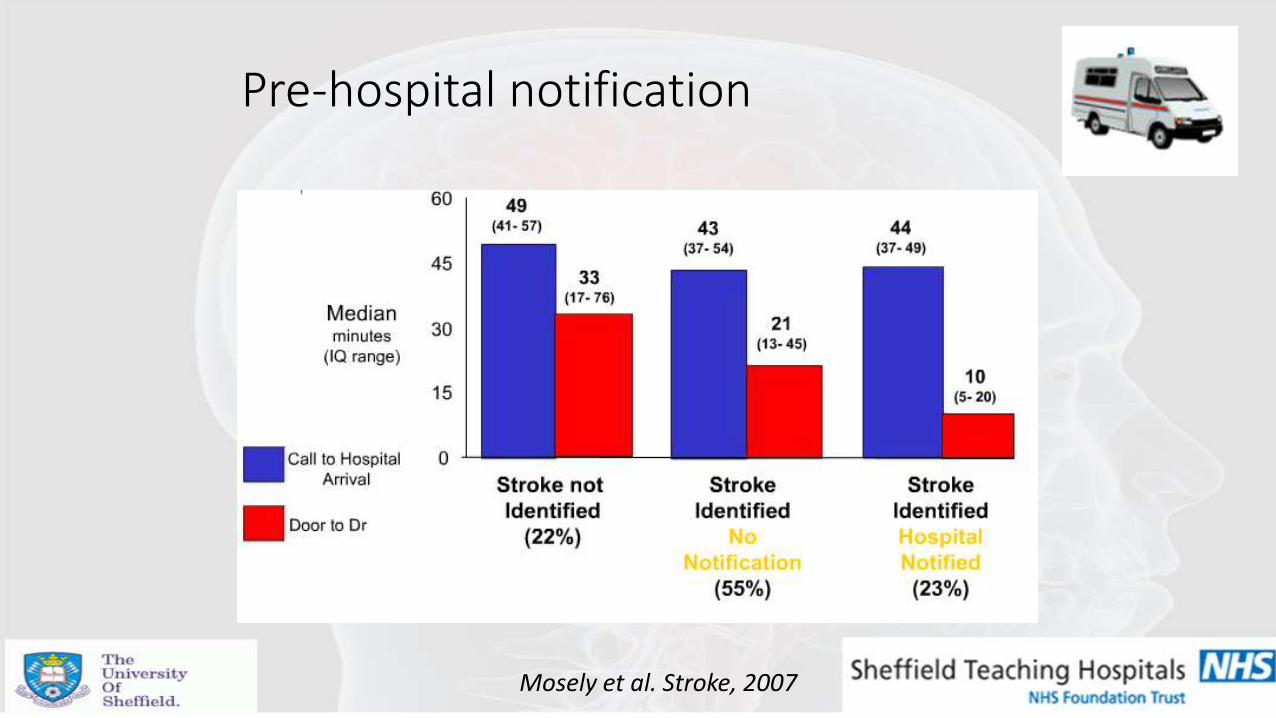
Pre-hospital notification
Mosely et al. Stroke, 2007

Paramedic triage
• Split hospital sites – HASU vs A&E – medical stability (airway)
• Suitability for endovascular treatment:
• NIHSS
• Pre-morbid function
• Onset time
NIHSS > 6
Premorbid MRS 0-2 Onset to groin likely < 6 hrs
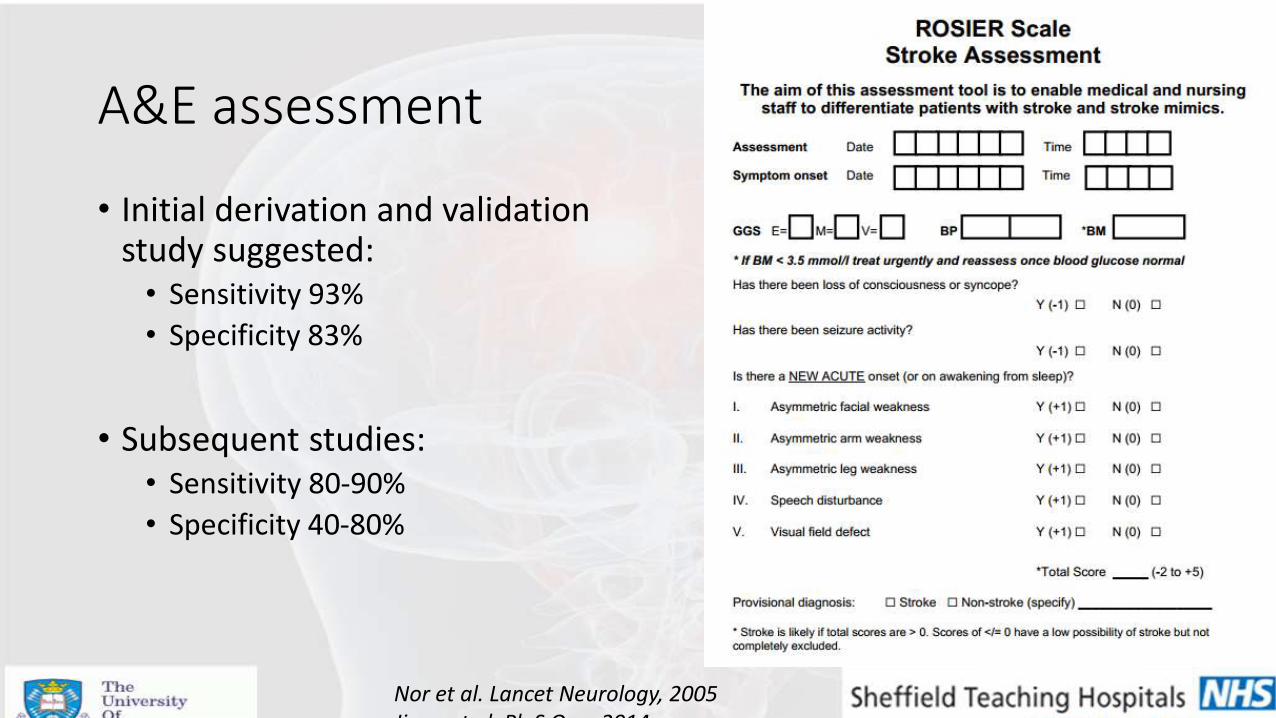
A&E assessment
• Initial derivation and validation study suggested: • Sensitivity 93%
• Specificity 83%
• Subsequent studies: • Sensitivity 80-90%
• Specificity 40-80%
Nor et al. Lancet Neurology, 2005 Jiang et al. PloS One, 2014

‘Stay and play’ or ‘Scoop and run’
• YAS: • Stabilised
• FAST
• Collateral and background
• BM
• Cannula en-route (not essential)
• Aim for rapid transfer and pre-hospital notification

‘Stay and play’ – the mobile stroke unit
• Operational mobile stroke units in Berlin since 2011.
• Consists: • Neurologist
• Paramedic
• Radiographer
• CT
• Point of care testing
• Teleradiology

‘Stay and play’ – the mobile stroke unit
• Pilot RCT - can reduce ‘call to needle time’ by 36 mins.
• Safe – similar rates ICH.
• Trend towards better outcomes – not significant.
Weber et al. Neurology, 2013. Kunz et al. Lancet Neurology, 2016.

Prehospital interventions
• Research activity:
• GTN patch – RIGHT-2 trial
• Remote ischaemic conditioning
• Oral decontamination
• Other neuroprotective agents

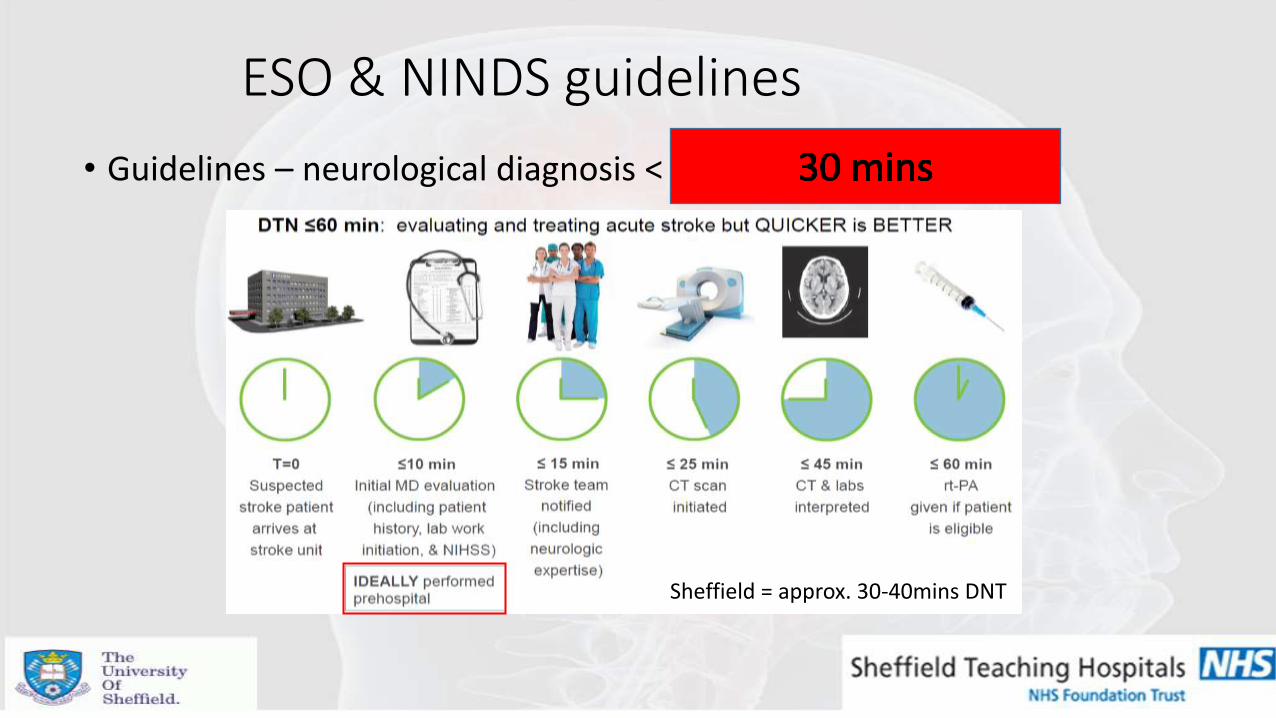
ESO & NINDS guidelines
• Guidelines – neurological diagnosis < 15 mins & DNT < 60 mins
Sheffield = approx. 30-40mins DNT

Prior to patient arrival
• Organise the team – stroke bleep
• Check bloods
• Check old neuroimaging
• Look at digitalised correspondence, ICE discharges, System One.
• Meet at the door / in CT – pre-warn CT.
• Delegate responsibilities to the team.

On arrival
• Decision to treat:
• Collateral history
• Time last seen well
• Acute onset vs staggered
• Drug history
• Contraindications to tPA
• ICE results (FBC, coag)
• Background problems
• Prior scans
• Preparation:
• BP and routine obs
• BM
• Weigh
• IV access
• Bloods – urgent
• NIHSS
• Inform senior decision maker – if not already
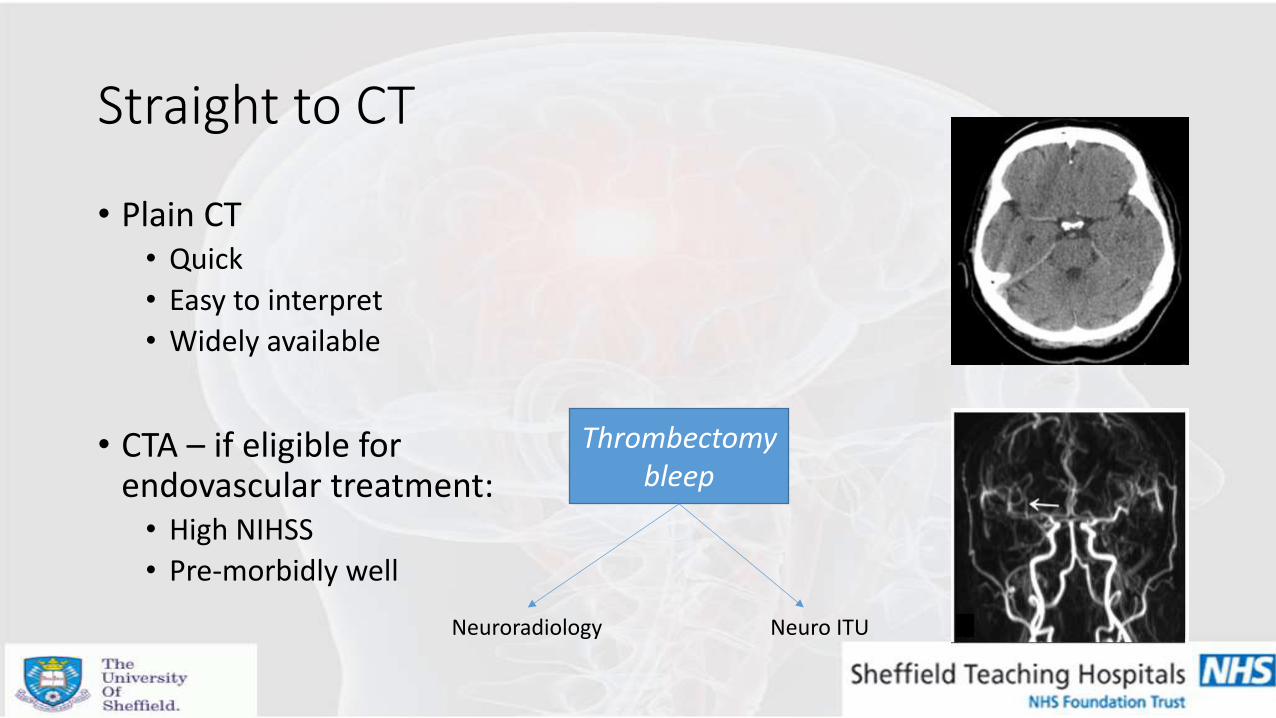
Straight to CT
• Plain CT • Quick
• Easy to interpret
• Widely available
• CTA – if eligible for endovascular treatment: • High NIHSS
• Pre-morbidly well
Thrombectomy bleep
Neuroradiology Neuro ITU

Stroke thrombolysis counselling
Risk of intracranial haemorrhage following tPA ~ 5%.
Generally speaking:
-for every 100 patients treated with tPA within 3 hrs, 33 would be better off and 3 would be worse off.
-NNT to prevent 1 dead or dependant = 10
-NNT to prevent 1 dead or dependant up to 4.5 hrs = 14
Factors that may increase the risk of ICH following tPA:
• Uncontrolled high blood pressure
• Uncontrolled high blood sugars
• More widespread ischaemic change on CT (high ASPECTS score)
• Longer OTT times
• Dual anti-platelets

Endovascular treatment counselling
• In addition to thrombolysis if found to have large vessel occlusion.
• ICH – 5% - same as IV tPA
• Groin haematoma (3-4%)
• Nearly twice the chance of independence at 3 months if LVO
2% 3-4 % <1 % 3-4 %
Badhiwala et al. JAMA, 2015

Deliver tPA
• If CT confirms no bleeding and no CI’s – deliver tPA in CT department.
• Bolus and set up infusion.
• Ensure resuscitation is available.
• Liaise with neuroradiology and anaesthetics if LVO confirmed and transfer to angio suite.
ESO & NINDS guidelines
• Guidelines – neurological diagnosis < 15 mins & DNT < 60 mins
Sheffield = approx. 30-40mins DNT
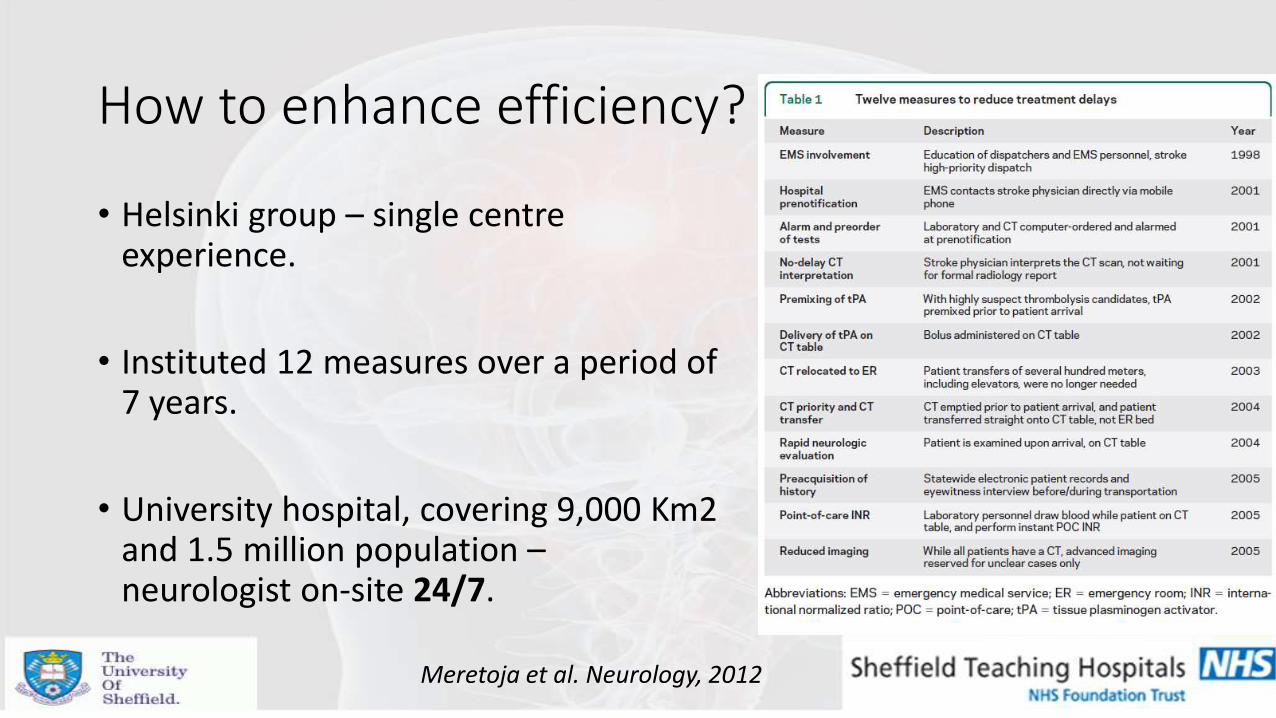
How to enhance efficiency?
• Helsinki group – single centre experience.
• Instituted 12 measures over a period of 7 years.
• University hospital, covering 9,000 Km2 and 1.5 million population – neurologist on-site 24/7.
Meretoja et al. Neurology, 2012
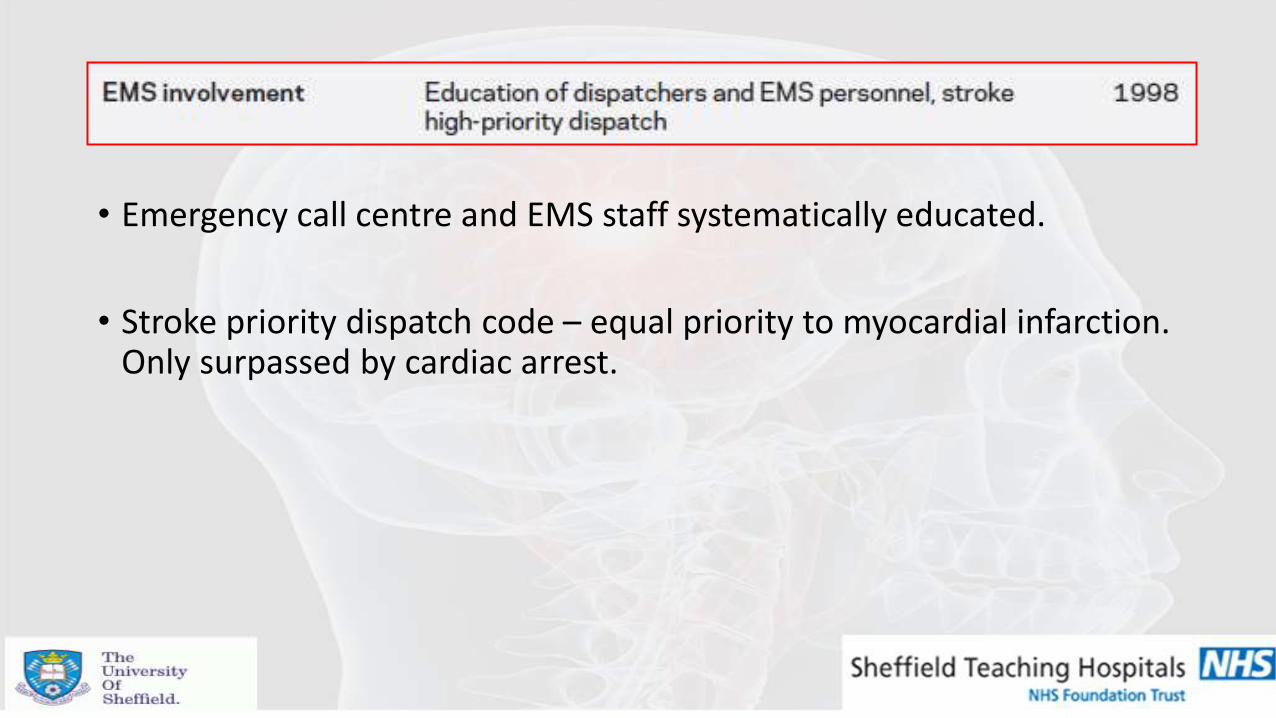
• Emergency call centre and EMS staff systematically educated.
• Stroke priority dispatch code – equal priority to myocardial infarction. Only surpassed by cardiac arrest.
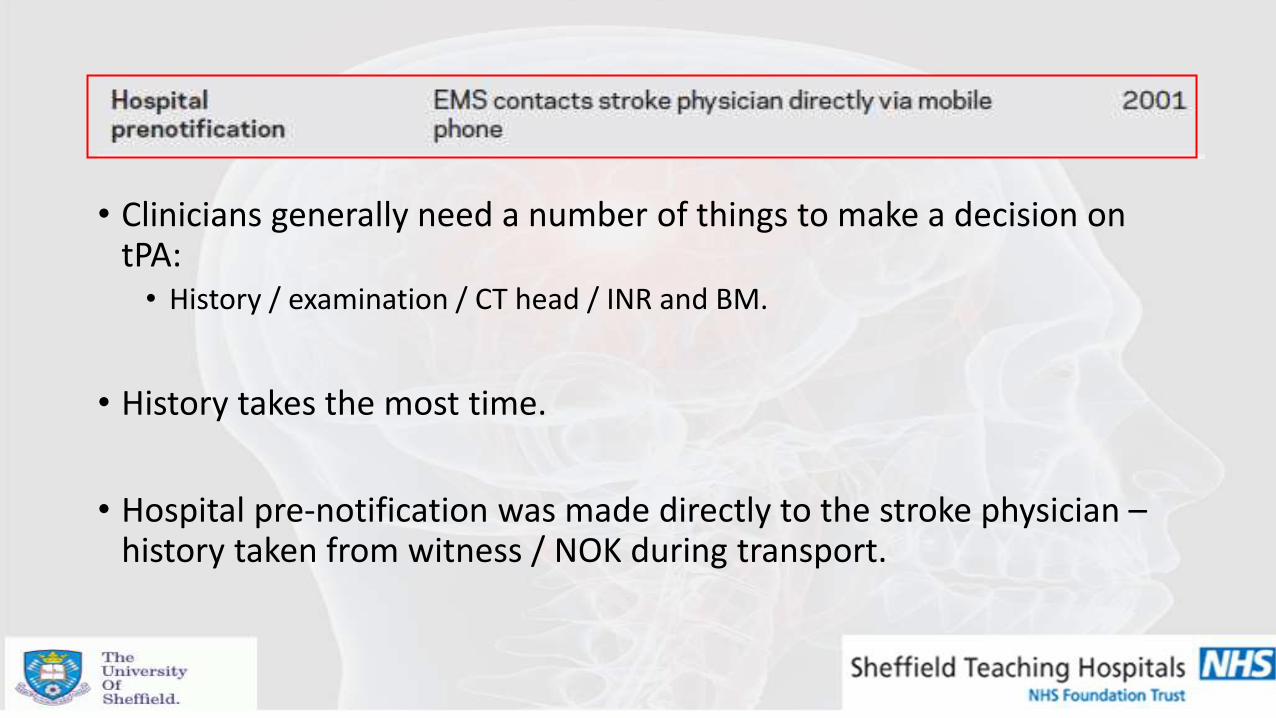
• Clinicians generally need a number of things to make a decision on tPA: • History / examination / CT head / INR and BM.
• History takes the most time.
• Hospital pre-notification was made directly to the stroke physician – history taken from witness / NOK during transport.

• Patient admitted onto hospital computer systems, bloods printed, CT ordered all prior to arrival.

• Treating stroke physician responsible for CT interpretation – oral radiology reports only utilised when immediately available or in complex cases.
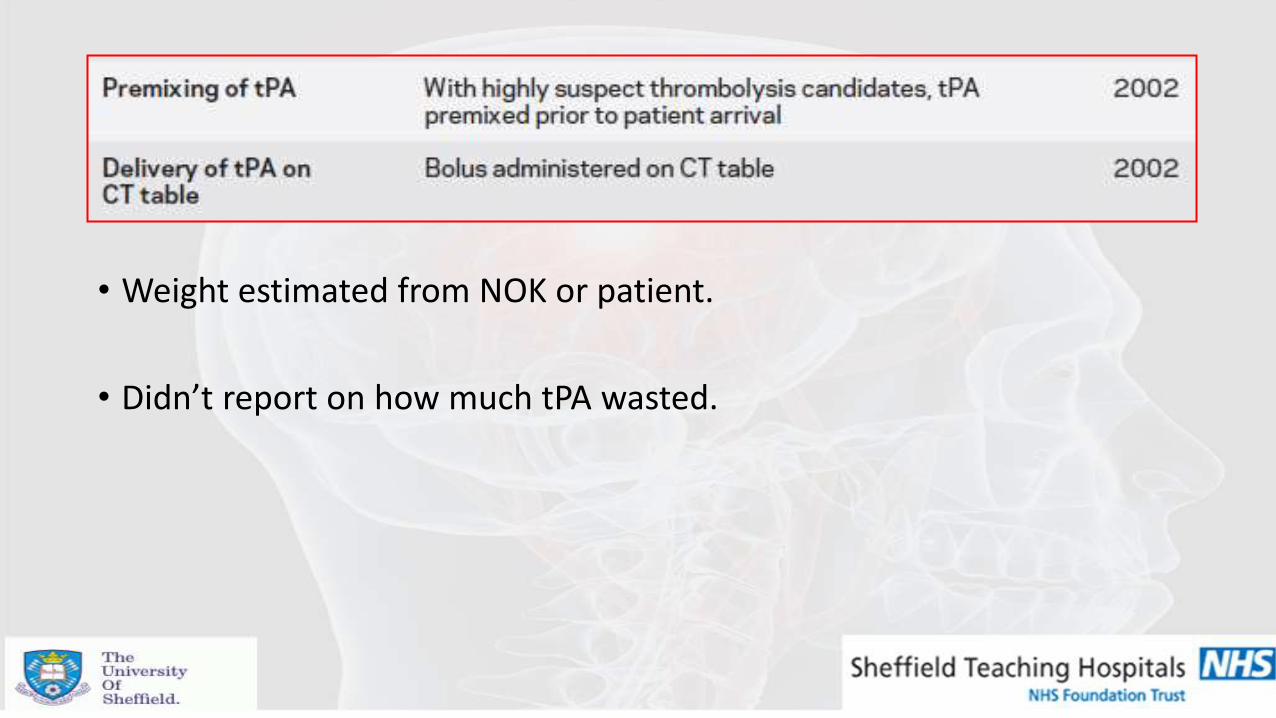
• Weight estimated from NOK or patient.
• Didn’t report on how much tPA wasted.

• Avoided estimated 10 minute delay from bed to CT transfer.
• Avoided delay in waiting for CT to become available.

• National electronic patient records reviewed prior to arrival.
• For all patients – accessible by all health professionals.

• Blood sampled for POC testing (glucose and INR) on the CT scanner.
• Proven reliability.


Outcomes
• Cannot clearly state improved outcomes for patients – design and confounders.
• 1.4% eventually turned out to be mimics: • Low rate
• Express assessment is likely to have also benefited ICH patients also.
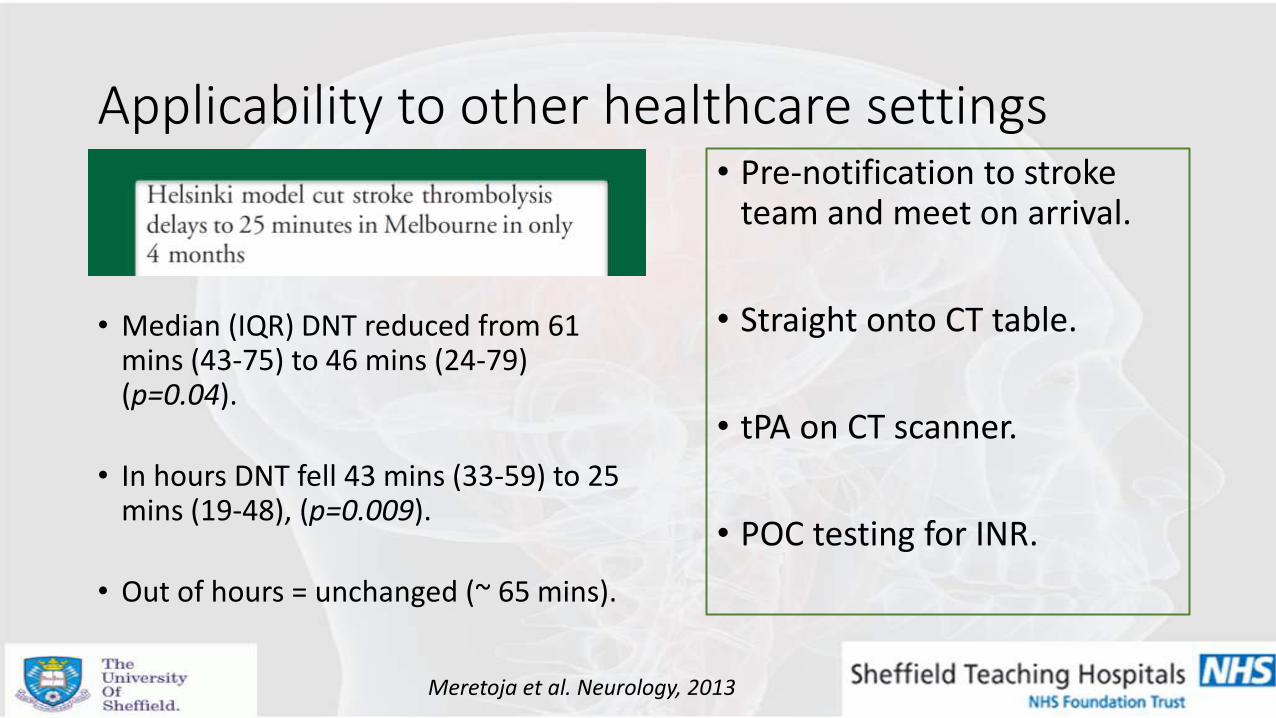
Applicability to other healthcare settings
• Median (IQR) DNT reduced from 61 mins (43-75) to 46 mins (24-79) (p=0.04).
• In hours DNT fell 43 mins (33-59) to 25 mins (19-48), (p=0.009).
• Out of hours = unchanged (~ 65 mins).
• Pre-notification to stroke team and meet on arrival.
• Straight onto CT table.
• tPA on CT scanner.
• POC testing for INR.
Meretoja et al. Neurology, 2013

Real life effect of reduced OTT
• Finnish and Australian tPA registries with outcome data at 3 months.
• Modelled to provide robust estimates of the longer term outcomes (disability and life years lost) with varying delays in tPA delivery.
Each minute OTT saved = 1.8 days healthy life.
Biggest effect in young but severely
affected (3.5 days).
Overall, each 15 minutes saved was the equivalent of 1 month of
disability-free life.
Meretoja et al. Stroke, 2014
Real life effect of reduced OTT
• US nationwide role out of best practise guidelines for tPA administration in stroke.
• Implemented 2009.
Fanarrow et al. JAMA, 2014

Real life effect of reduced OTT
Fanarrow et al. JAMA, 2014

Real life effect of reduced OTT Effects of improvement in DNT of only 15 mins – over 3 years.
Fanarrow et al. JAMA, 2014

Simple – what can go wrong?
• Unstable patient - seizures, vomiting, respiratory distress etc.
• High BP – to treat or not to treat?
• Awaiting INR for patients on warfarin – delay in labs.
• Clarifying collateral history and onset time:
• Calling family / witnesses
• Looking through texts

Stroke Mimics
• Wide variety of conditions can mimic stroke:
Fernandez et al 2013

Stroke Mimics
• Mimics are diagnosed as stroke by all professions.
Harbison et al 2003

• 350 acute ‘stroke’ presentations.
• 109 mimics (31%).
• Reviewed pre-morbid and presenting features to help identify key indicators of mimic.
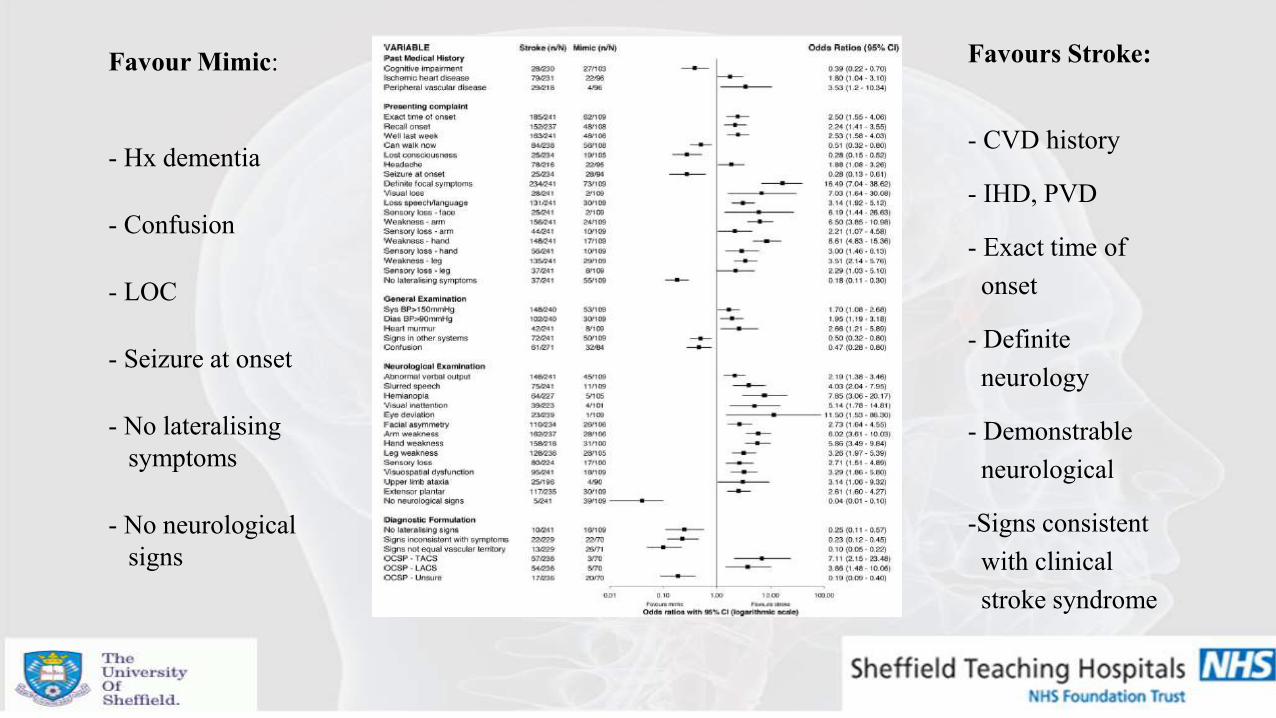
Favour Mimic:
- Hx dementia
- Confusion
- LOC
- Seizure at onset
- No lateralising
symptoms
- No neurological
signs
Favours Stroke:
- CVD history
- IHD, PVD
- Exact time of
onset
- Definite
neurology
- Demonstrable
neurological
-Signs consistent
with clinical
stroke syndrome

Stroke Mimics and Age
Vroomen et al 2008

• Nature of symptoms:
• Positive: excess of neuronal discharge – visual (flashing lights, zig-zags,
lines, shapes), sensory (pain, paraesthesia), motor (limb jerking)
• Negative: loss of neuronal function – loss of vision, hearing, sensation or power.
• Ischaemia – negative symptoms mostly – arterial territory.
• Seizure & migraine – positive symptoms particularly at the outset.
Clinical features - History

Migraine
• Hemiplegic Migraine.
• Acephalgic Migraine.
• Opthalmoplegic Migraine.
• Basillar Migraine.
• Prolonged Aura.
• Status migrainosus.
• Gradual Onset ( > 5 mins)
• Positive symptoms.
• Symptom spread over several seconds
to minutes.
• Gradual resolution - minutes to days.
• Headache – not always.
• Recurrent Stereotyped attacks.
• Typically young.

Headache and stroke
• Mild headache – relatively common in stroke (20%).
• More common in posterior ischaemia.
• Usually ipsilateral to affected carotid territory if anterior circulatory.
• Dissection / ICH / SAH.

Seizures
• Partial seizure:
• Young or middle aged adults.
• Antecendent symptoms.
• Positive neurological symptoms.
• ‘March’ of symptoms.
• Sterotypical attacks.
• +/- amnesia of event.

Seizures
• Todds paresis:
• Complicates ~ 15% of seizures.
• Mainly GTC seizures.
• Commonly causes unilateral weakness.
• Uncommonly – aphasia, sensory disturbance, visual field defect.
• Usually lasts < half an hour, but can last days.
• Collateral history very important.

Seizure
• Caution:
• 2% of strokes can have seizures at onset – mainly TACS,
PICH, SAH.
• 5% strokes complicate by seizures within first 2 weeks.
• Incidence higher in ICH/SAH.
Gaze – towards a stroke vs away from a seizure

Acute vestibular syndrome
• Dizziness / giddiness – what does this mean? • True rotational vertigo vs. presyncope vs. unsteadiness
• Population-based study – only 3% of emergency presentations for ‘dizziness’ have posterior circulation ischaemia.
• Dix-Hallpike & Head-impulse tests are specific but not sensitive.
• In those with vascular risk factors – difficult to determine.
Kerber et al 2006

Posterior circulation Ischaemia • Unlikely if isolated:
• Unsteadiness / vertigo
• Dysarthria
• Diplopia
• Drop-attacks
• Simultaneous bilateral weakness
• Sensory loss confined to one part of face / limb
Usually at least 2 of these
posterior circ. symptoms
present in true ischaemia.

HINTS
• Nystagmus – unidirectional = vestibular – bidirectional = central.
• Test of skew – abnormal vertical skew = central.
• Head impulse test – abnormal catch up saccades = vestibular / nerve
no catch up saccades = ? Central
Sensitivity for ruling out stroke 100%, specificity 96%.
Kattah et al. Stroke, 2009

Functional Disorders
• Frequently triggered – panic attack or dissociative episode.
• Non-ergonomic gait.
• Inconsistent history / neurology.
• Hoover’s sign / give way weakness.
• Indifferent appearance.
• Can be very difficult – ‘soft ware’ problem vs ‘hard ware’.
• Benefit from CBT, psychological input.
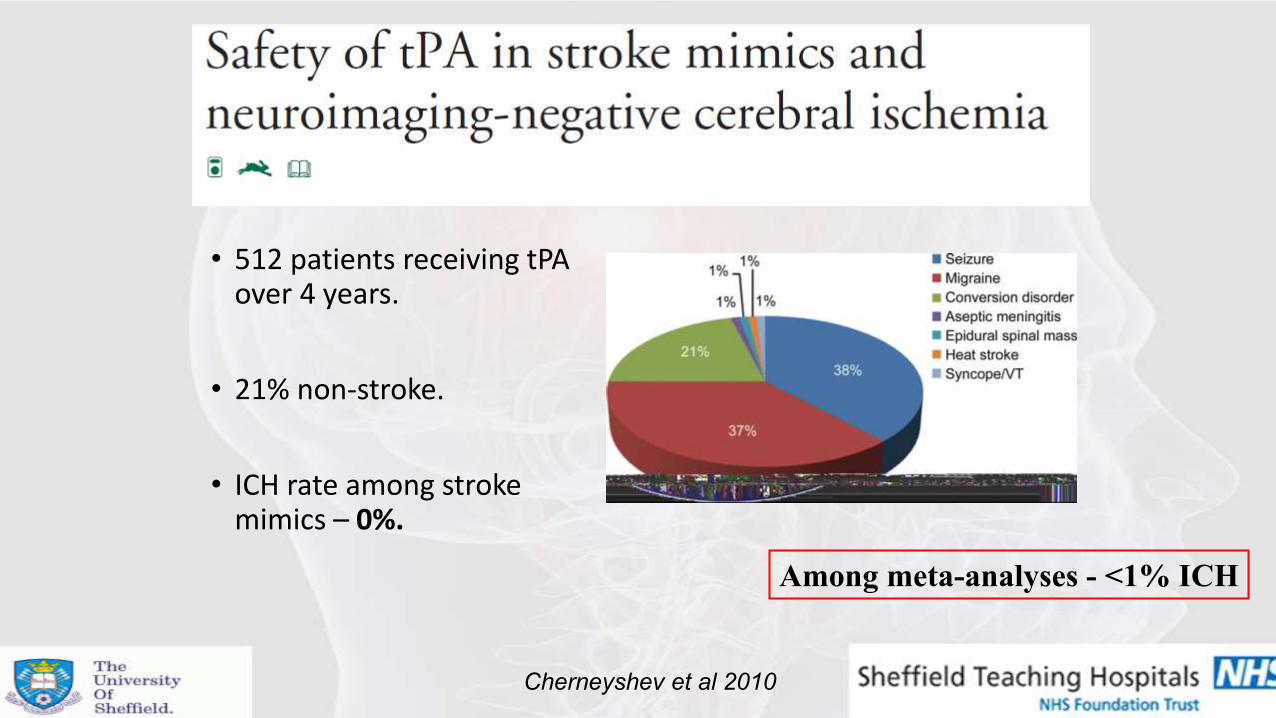
• 512 patients receiving tPA over 4 years.
• 21% non-stroke.
• ICH rate among stroke mimics – 0%.
Cherneyshev et al 2010
Among meta-analyses - <1% ICH

Out of hours (OOH) thrombolysis
• Often employs telemedicine.
• Reliable and safe.
• Often incurs extra delays: • NZ – 33 mins
• Australian – 15 mins
• Most patients admitted OOHs!
Thorne et al. NZ Med J, 2012 Fang et al. J Stroke Cerebro Dis, 2014

Early presenters
• Effect seen in a number of studies.
• Early presentation – ‘lots of time before 4.5 hours is up’.
• Results in unnecessarily increased DNT’s.
•Often the most to gain!

Conclusions
• Rapid recognition and assessment of patients with stroke can be challenging.
• Improved and enhanced patient pathways can result in quicker delivery of urgent and time dependent treatments.
• Do as much before the patient arrives to hospital and as little as required once the patient has arrived.

Conclusions
• Thrombolysis of stroke mimics is difficult to avoid – risks are very low.
• Main challenges ahead will be: • To incorporate triage mechanisms for patients eligible for thrombectomy.
• Ensure low DNTs in ‘out of hours’.
• Improved treatment times will benefit individual patients and society as a whole.

Thank You
Questions?