hyperbolic boiler tube leak location based on quaternary ... · hyperbolic boiler tube leak...
TRANSCRIPT

lable at ScienceDirect
Applied Thermal Engineering 31 (2011) 3428e3436
Contents lists avai
Applied Thermal Engineering
journal homepage: www.elsevier .com/locate/apthermeng
Hyperbolic boiler tube leak location based on quaternary acoustic array
Liansuo An a, Peng Wang a,*, Augusto Sarti b, Fabio Antonacci b, Jie Shi a
aKey Laboratory of Condition Monitoring and Control for Power Plant Equipment Ministry of Education, North China Electric Power University, No.2 BeiNong Road, HuiLongGuan,ChangPing, 102206 Beijing, Chinab Image and Sound Processing Group, Department of Electronics and Information, Politecnico di Milan, 20133 Milan, Italy
a r t i c l e i n f o
Article history:Received 20 April 2011Accepted 21 June 2011Available online 30 June 2011
Keywords:Boiler leakageHyperbolic locationQuaternary acoustic arrayTime differences of arrival (TDOA)Maximum likelihood (ML) estimatorGenetic algorithm (GA)
* Corresponding author. Tel.: þ39 3891034708.E-mail address: [email protected] (
1359-4311/$ e see front matter � 2011 Elsevier Ltd.doi:10.1016/j.applthermaleng.2011.06.028
a b s t r a c t
Early detection and location of a boiler leak help reduce possible equipment damage and productivityloss. In the present study, a four-element acoustic array and a set of hyperbolic equations were used tolocate a power plant boiler leak.
Maximum likelihood (ML) and phase transformation (PHAT) estimators were used to localize the leaksource. Error rate and root mean square error (RMSE) evaluation revealed the superiority of ML overPHAT in the noisy and lowly reverberant boiler environment.
To avoid distant source assumption, a genetic algorithm (GA) modified by an adaptive Gaussianmutation operator was used to search for the global hyperbolic optimum by probability calculations. TheGA slightly outperformed the quasi-Newton method and required more time to converge. However,selecting a starting point near the true position is not simple in practice, and iterative process conver-gence is not assured in the quasi-Newton method.
Time delay estimator errors greatly influence localization accuracy. The quaternary plane arraylocalization error was within the permitted range of 0.01 ms, whereas that of the stereo array was 0.1 ms.Compared with the quaternary plane, the stereo array was more robust and accurate, but required moretime to converge.
� 2011 Elsevier Ltd. All rights reserved.
1. Introduction
Utility and industrial power plants are very important in today’selectricity-dependent world. Boiler Tube Failures (BTF), whichcauses approximately 60% of boiler outages, may be prevented byearly boiler tube leak detection during operation. Early detectionhelps reduce secondary damage to pressure parts and the resultingproductivity loss caused by unscheduled boiler shutdowns. Moreimportantly, the safety of operators is ensured.
Acoustic leak detection is predominantly used in largecommercial boilers due to its many advantages, such as real-timedetection, remote monitoring capability, and high sensitivity [1,2].The main technique in acoustic leak detection involves positioningmicrophones at specific boiler areas to detect sound pressureamplitude. The amplitude obtained from each microphone is thencompared with frequency domain data. These acoustic data canfurther be refined for comparing with historical threshold data todetermine the probability of a leak. For instance, if a microphonesignals an alarm, the leakage source can be deduced within 10 m-
P. Wang).
All rights reserved.
radius hemisphere. Therefore, the acoustic technique plays a majorrole in identifying the heating surface, which is impossible to locatein a specific tube-row [3e5]. A manpower search of a boiler aper-ture even as small as 1e4 mm is very time consuming. Accurateleak location is also a crucial issue in a manual search [6].
In the present study, we focused on the relationships among themicrophone sensor data using the time differences of arrival(TDOA) strategy. A model of hyperbolic leak location is first estab-lished in Section 2. In Section 3, the TDOA of the passive signalsreceived by the specifically positioned sensors are measured usingthe maximum likelihood (ML) estimator. A genetic algorithm (GA)modified by an adaptive Gaussian mutation operator is used tosearch for the globally optimum parameters. In Section 4, highlynonlinear hyperbolic equations are constructed from the TDOAmeasurements. Section 5 discusses the effects of time delay esti-mator errors on localization accuracy. Conclusions are drawn inSection 6.
2. Model of leakage localization using a four-element array
A leakage localization method, which designs the acoustic arrayfor the TDOA source location, is critical. Linear sensor arrays canlocate a leak position only in two dimensions [7]. Plane and stereo
Nomenclature
sij time difference of arrival4 sound pressure attenuation coefficientNp population sizepr probabilities of reproductionPc probability of crossoverPm probability of mutationRssðnÞ cross-correlation functionhi(n) acoustical transfer functionW(u) frequency weighting functionGssðuÞ power spectrum functiong(u) modular square coherence functionSNR signal to noise ratio, dBRT reverberation time, sRMSE root mean square error
SubscriptsM microphones sourcep populationr reproductionc crossoverm mutation
L. An et al. / Applied Thermal Engineering 31 (2011) 3428e3436 3429
arrays can accurately pinpoint leak positions, but the stereo algo-rithm is more complex [8]. A cross array can more accurately locatea leak using five or more elements depending on the number ofsensors, but with increased computational costs. Circle [9], sphere,and cylinder arrays show favorable measurement performances,but their structures restrict them to furnace chamber applications.
Four-element plane and stereo arrays were adopted in thepresent study to localize leakage. The distribution of sensors isschematically illustrated in Fig. 1. The distribution can be modifiedaccordingly depending on the boiler situation.
The four-element microphone array geometry used for fixingthe leakage position is shown in Fig. 2 (Suppose Mic. 1 to be thereferencemicrophone.). The leakage source S is assumed to be at anunknown position (x, y, z), whereas the sensors M1, M2, M3 and M4
are at known locations. sij stands for the TDOA between the signalradiations from the source to Mi and Mj.
The leakage source is associated with the following hyperboliclocation equation:
kMi � Sk � ��Mj � S�� ¼ csij (1)
We applied the four-element array in a 1025 t/h circulating fluidizedbed boiler in a domestic power plant. The boiler has the followingfeatures: a ¼ 12 m and b ¼ 14.6 m. To provide an explicit solution tothe hyperbolic curves defined by the TDOA, far-field r[a;b, rrepresents the range between source and array center, was assumedand was subsequently utilized for linearization [10,11]. Carter [12]derived an exact formula for sonar and radar source range andbearing. Although the formula is valid for distant sources, thecondition r[a; b is not satisfied in theboiler, as illustratedby theSG-1025/17.5-M723 typical boiler (depth ¼ 13.64 m, width ¼ 14.022 m,sensor detection range ¼ w20 m). Therefore, far-field assumptioncan have a significant influence on the position fixing. In the field ofcellularmobile communications, the Taylor seriesmethod [13] startswith an initial estimate, which is improved at each step by deter-mining the local linear least-squares solution. An initial estimate isclose to the local minima. Chan [14] proposed a two-step weightedleast-squares algorithm, wherein the first step solves the linear
equations, and the second utilizes the known relationship betweenthe introduced variable and the position. However, this algorithm isrestricted to the two-dimensional plane only. The Newton method,which requires the specification of the Hessian matrix of secondderivatives for function optimization, is more commonly used insimilar studies. The convergence and performance characteristics ofthe Newton method can be highly sensitive to the initial estimate ofthe solution provided for the method.
3. Approximation of the ML estimator
To localize the source, the TDOA of the signal received by the twosensors is firstly estimated. Background noise types in the boilerfurnace during operation include combustion, burner jet, cross-flowtube rows, and soot blower noises, as well as other mechanicalnoises. The frequencies mainly centralize within the 250e1000 Hzband. The sound pressure level (SPL) roughly ranges from 110 to120 dB [15]. Furthermore, given that the furnace is an enclosedspace, sound waves from the pressurized tubes are continuouslyreflected and absorbed by the wall and tube rows surface simulta-neously the sound waves then attenuate gradually. Therefore, thesignal received by the sensors is a reverberant signal. Consideringthe existence of both reverberant and noise inferences in the boilerfurnace, the leak signals received by the two microphones are:
xiðnÞ ¼ 4isðn� sÞ þ hiðnÞ*sðnÞ þ niðnÞxjðnÞ ¼ 4jsðnÞ þ hjðnÞ*sðnÞ þ njðnÞ (2)
where s is the TDOA, 4i and 4j are signal attenuation, ni(n) and nj(n)are the additive noises, and hiðnÞ*sðnÞ and hjðnÞ*sðnÞ are thereverberations. If the cross-correlation RssðnÞ or its Fourier trans-form equivalent GssðuÞ (according to the WienereKhinchintheorem) can be recovered, s can then be estimated as follows:
s ¼ arg maxsRsisjðnÞ (3)
In practice, GssðuÞ is replaced by Gxixj ðuÞ. Various frequenciesweighing functions are proposed to deal with the approximation:
Rs1s2ðsÞ ¼12p
Zp
�p
Gs1s2ðuÞejusduz12p
Zp
�p
WðuÞGx1x2ðuÞejusdu (4)
where W(u) is the frequency weighting function. In practice,choosing the right weighting function is greatly significant. Aprevious research [16] suggests that the normalized generalizedcross-correlation (GCC), i.e., the phase transformation (PHAT)weighing function, deals better with reverberation, as shown in thefollowing equation:
WPHATðuÞ ¼ 1��GxixjðuÞ��2 (5)
On the other hand, ML weight function can be defined as:
WMLðuÞ ¼��gðuÞ��2
jGxixjðuÞ���1� ��gðuÞ��2� (6)
In the above equation, jgðuÞj2 is the modular square coherencefunction expressed as:
��gðuÞ��2 ¼��Gxixj
ðuÞ��2GxixiðuÞGxjxjðuÞ
(7)
where Gxixi ðuÞ, Gxjxj ðuÞ, and Gxixj ðuÞ represent the noise auto-powerspectrum signal i and the cross-power spectrum signal j.

Fig. 1. Distribution of plane and stereo quaternary arrays within the furnace chamber.
L. An et al. / Applied Thermal Engineering 31 (2011) 3428e34363430
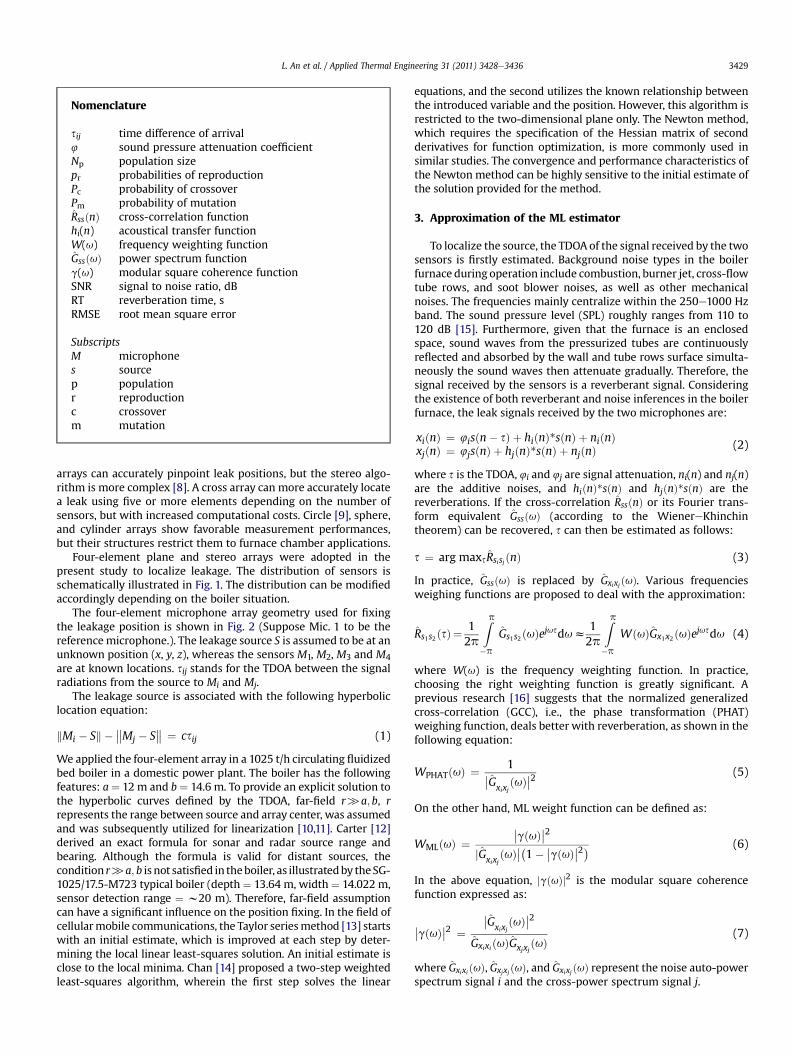
We conducted an experiment to evaluate the accuracy of the MLand PHAT estimation methods at various signal-to-noise ratios(SNRs) and low reverberation conditions. The two sensors are M11(7.3, 6, 50.7) as well as M9 (�7.3, 6, 50.7) in Floor C, and the leaksource is at the front wall position (0, 6, 55) (Fig. 1). We simulatedthe working fluid by air-jet noise instead of water vapor noise. Asillustrated in Fig. 3, the leak noise is a continuous broadband signal,and the energy distributes to various frequency components. Inconditions of similar outlet pressure and backpressure, the SPLincreases with aperture enlargement. A weak frequency peak canbe observed between 11 and 16 kHz. The imaging method [17] wasused to produce reverberant signals, and the parameters are set tosampling frequency Fs ¼ 102400 Hz, sampling frame length ¼ 512,and overlap ¼ 50%.
Fig. 4 shows the normalized frequency (vertical axis), whichdescribes how well the true delay is estimated around the zone ofinterest. The red dashed line at TDOA ¼ 0 ms is the true delay. Theleakage signal is under favorable noise and reverberation conditionsin the furnace, where SNR ¼ 10 dB and reverberation time(RT) ¼ 0.2 s. Generally, both ML and PHAT algorithms perform welland have small biases and variances. However, in the present study,when the leakage signal level decreases (SNR ¼ �10 dB),
Fig. 2. Four-element array leak
PHAT performance rapidly deteriorates, and anomalies remarkablyappear. Therefore, theMLmethodmakesmore accurate estimations.
We calculated error percentage and root mean square error(RMSE) in milliseconds. The RMSE of each estimator is consideredasmore appropriate than the estimator’s variance or bias alone. TheRMSE is defined by:
RMSE½s� ¼ffiffiffiffiffiffiffiffiffiffiffiffiffiffiffiffiffiffiffiffiffiffiffiffiffiffiffiffiffiffiffiffiffiffiffiffibaisfsg2þvarfsg
q(8)
where s is the estimate of the true value s. The RMSE value is onlyobtained from non-anomalous estimates.
After the error rate and RMSE evaluations, the ML estimatorwas found to possess a distinct performance advantage over PHATunder less favorable noise and low reverberation conditions(Fig. 5).
For practicality, the GCC-based ML estimation was carried outusing the LabVIEW software and an NI PXI-6133 data acquisitioncard under cold boiler conditions. The air-jet noise time domainwaveforms are illustrated in Fig. 6. As different leak sound pressurereceived by four microphones descending: Mic.4 > Mic. 3 > Mic.1 > Mic.2, caused by the leakage range.
age localization geometry.
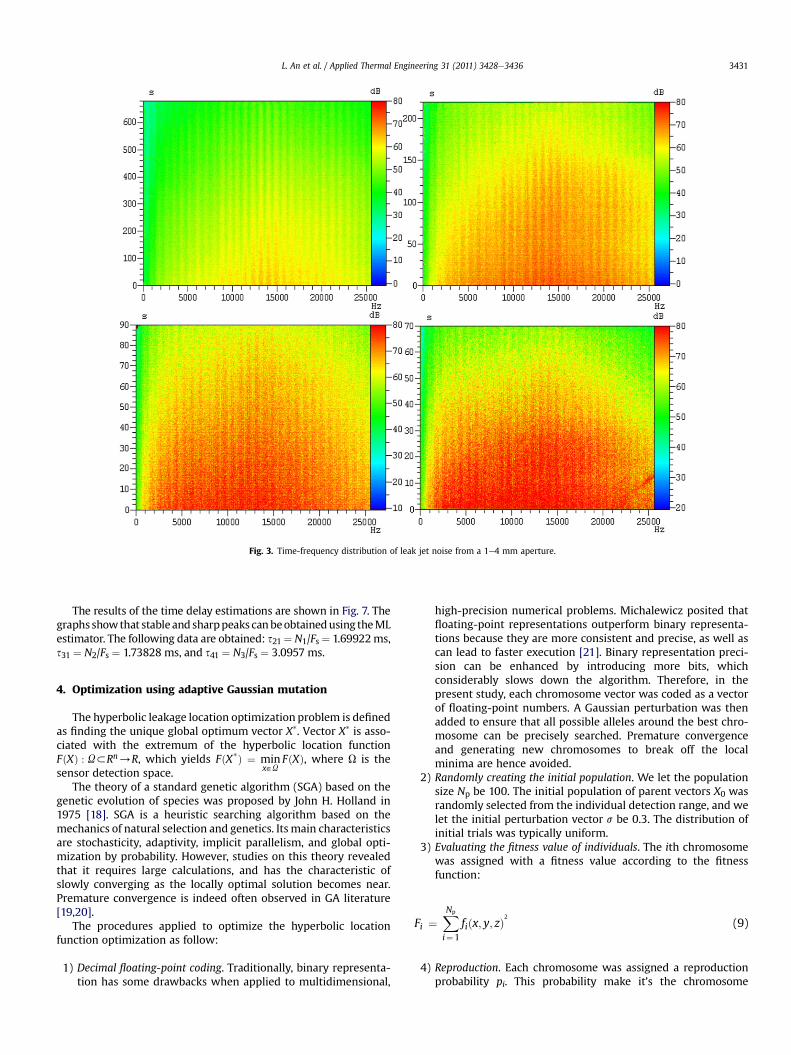
Fig. 3. Time-frequency distribution of leak jet noise from a 1e4 mm aperture.
L. An et al. / Applied Thermal Engineering 31 (2011) 3428e3436 3431
The results of the time delay estimations are shown in Fig. 7. Thegraphs showthat stableand sharppeaks canbeobtainedusing theMLestimator. The following data are obtained: s21¼ N1/Fs¼ 1.69922ms,s31 ¼ N2/Fs ¼ 1.73828 ms, and s41 ¼ N3/Fs ¼ 3.0957 ms.
4. Optimization using adaptive Gaussian mutation
The hyperbolic leakage location optimization problem is definedas finding the unique global optimum vector X*. Vector X* is asso-ciated with the extremum of the hyperbolic location functionFðXÞ : U3Rn/R, which yields FðX*Þ ¼ min
x˛UFðXÞ, where U is the
sensor detection space.The theory of a standard genetic algorithm (SGA) based on the
genetic evolution of species was proposed by John H. Holland in1975 [18]. SGA is a heuristic searching algorithm based on themechanics of natural selection and genetics. Its main characteristicsare stochasticity, adaptivity, implicit parallelism, and global opti-mization by probability. However, studies on this theory revealedthat it requires large calculations, and has the characteristic ofslowly converging as the locally optimal solution becomes near.Premature convergence is indeed often observed in GA literature[19,20].
The procedures applied to optimize the hyperbolic locationfunction optimization as follow:
1) Decimal floating-point coding. Traditionally, binary representa-tion has some drawbacks when applied to multidimensional,
high-precision numerical problems. Michalewicz posited thatfloating-point representations outperform binary representa-tions because they are more consistent and precise, as well ascan lead to faster execution [21]. Binary representation preci-sion can be enhanced by introducing more bits, whichconsiderably slows down the algorithm. Therefore, in thepresent study, each chromosome vector was coded as a vectorof floating-point numbers. A Gaussian perturbation was thenadded to ensure that all possible alleles around the best chro-mosome can be precisely searched. Premature convergenceand generating new chromosomes to break off the localminima are hence avoided.
2) Randomly creating the initial population. We let the populationsize Np be 100. The initial population of parent vectors X0 wasrandomly selected from the individual detection range, and welet the initial perturbation vector s be 0.3. The distribution ofinitial trials was typically uniform.
3) Evaluating the fitness value of individuals. The ith chromosomewas assigned with a fitness value according to the fitnessfunction:
F ¼XNp
f ðx; y; zÞ2 (9)
ii¼1i
4) Reproduction. Each chromosome was assigned a reproductionprobability pi. This probability make it’s the chromosome

Fig. 4. ML and PHAT estimator histograms at various SNR and RT ¼ 0.2 s conditions.
Fig. 5. ML and PHAT estimator error rate and RMSE comparison at various SNR and RT ¼ 0.2 conditions.
L. An et al. / Applied Thermal Engineering 31 (2011) 3428e34363432
selection likelihood proportional to its fitness relative to theother chromosomes in the population. This can be illustrated as:
pr ¼ FiPNp
(10)
i¼1Fi
5) Crossover. According to the assigned probabilities of repro-duction pr, a new chromosome population was generated by
probabilistically selecting strings from the current pop-ulation. With the probability of crossover Pc being 0.8,a crossover operator was applied to two parent chromo-somes, resulting in the creation of two offspring chromo-somes. This was done by selecting a uniform distributionrandom position integer jc [1,2]. The section that appearsafter the position jc (in the first string) was spliced with thesection appearing before the selected position jc (in thesecond string), and vice versa.

Fig. 6. Time domain waveforms of receivers.
Fig. 7. Time delay ML estimations.
L. An et al. / Applied Thermal Engineering 31 (2011) 3428e3436 3433
6) Mutation. The mutation operator plays a significant role inzooming in on solutions closer to the global optimum, and inzooming out from the local optimum in a heuristic search. Themutation alleles are roughly the same as the genes by a higherprobability, and are different by a certain probability. The bitmutation operator universally accepted in the SGA is clearly notsuitable for decimal floating-point representations. Therefore,we proposed that each solution vector comprise not only the
trial vector X, but also a perturbation vector s ¼ ½sx; sy;sz�T ,which provides instructions on how to mutate x, and is itselfsubject to mutation. The mutation was applied to the parentvector, with the probability of mutation Pm being 0.3. Theoffspring solution vector ðX0;s0Þ could be described as:
s0i ¼ siexp½aNð0;1Þ þ bNið0;1Þ� (11)
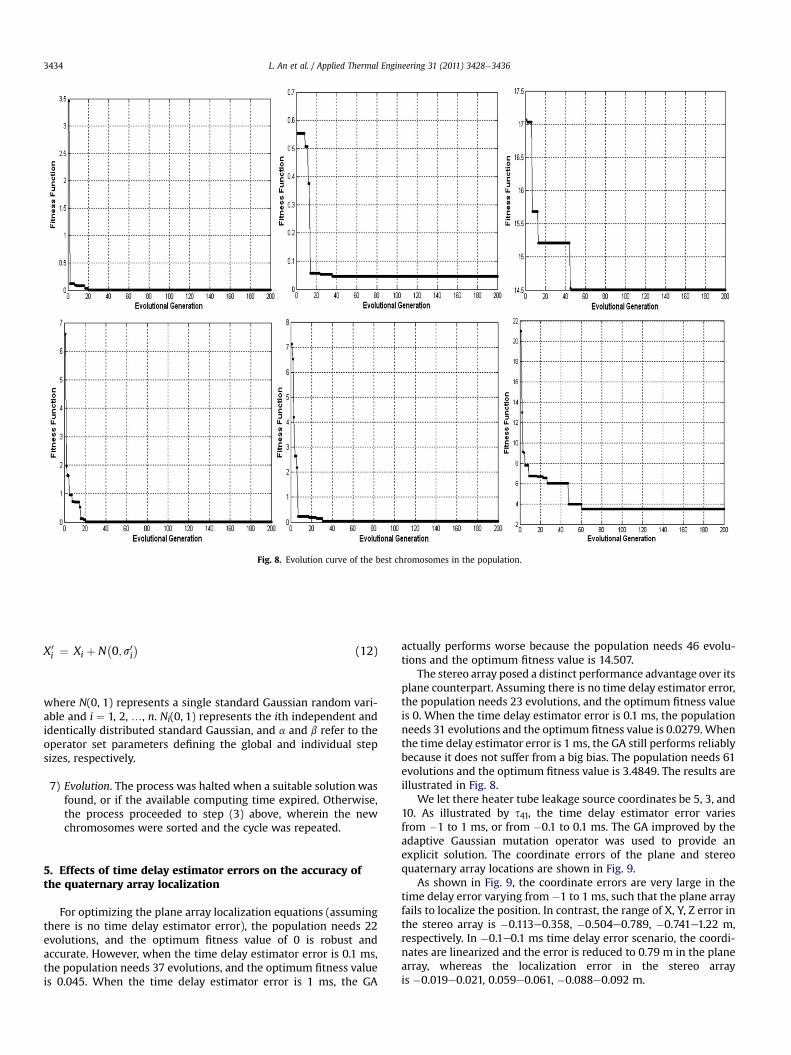
Fig. 8. Evolution curve of the best chromosomes in the population.
L. An et al. / Applied Thermal Engineering 31 (2011) 3428e34363434
X0i ¼ Xi þ N
�0; s0i
�(12)
where N(0, 1) represents a single standard Gaussian random vari-able and i ¼ 1, 2, ., n. Ni(0, 1) represents the ith independent andidentically distributed standard Gaussian, and a and b refer to theoperator set parameters defining the global and individual stepsizes, respectively.
7) Evolution. The process was halted when a suitable solution wasfound, or if the available computing time expired. Otherwise,the process proceeded to step (3) above, wherein the newchromosomes were sorted and the cycle was repeated.
5. Effects of time delay estimator errors on the accuracy ofthe quaternary array localization
For optimizing the plane array localization equations (assumingthere is no time delay estimator error), the population needs 22evolutions, and the optimum fitness value of 0 is robust andaccurate. However, when the time delay estimator error is 0.1 ms,the population needs 37 evolutions, and the optimum fitness valueis 0.045. When the time delay estimator error is 1 ms, the GA
actually performs worse because the population needs 46 evolu-tions and the optimum fitness value is 14.507.
The stereo array posed a distinct performance advantage over itsplane counterpart. Assuming there is no time delay estimator error,the population needs 23 evolutions, and the optimum fitness valueis 0. When the time delay estimator error is 0.1 ms, the populationneeds 31 evolutions and the optimum fitness value is 0.0279. Whenthe time delay estimator error is 1 ms, the GA still performs reliablybecause it does not suffer from a big bias. The population needs 61evolutions and the optimum fitness value is 3.4849. The results areillustrated in Fig. 8.
We let there heater tube leakage source coordinates be 5, 3, and10. As illustrated by s41, the time delay estimator error variesfrom �1 to 1 ms, or from �0.1 to 0.1 ms. The GA improved by theadaptive Gaussian mutation operator was used to provide anexplicit solution. The coordinate errors of the plane and stereoquaternary array locations are shown in Fig. 9.
As shown in Fig. 9, the coordinate errors are very large in thetime delay error varying from�1 to 1 ms, such that the plane arrayfails to localize the position. In contrast, the range of X, Y, Z error inthe stereo array is �0.113e0.358, �0.504e0.789, �0.741e1.22 m,respectively. In �0.1e0.1 ms time delay error scenario, the coordi-nates are linearized and the error is reduced to 0.79 m in the planearray, whereas the localization error in the stereo arrayis �0.019e0.021, 0.059e0.061, �0.088e0.092 m.

Fig. 9. Comparing the plane to stereo array error curves of the hyperbolic location optimization.
L. An et al. / Applied Thermal Engineering 31 (2011) 3428e3436 3435
6. Conclusions
Using the quaternary acoustic array for receiving the signal ofthe boiler tube leakage, the TDOA is obtained using a GCC-basedML estimator. The GA was employed to give an iterative solutionbased on the set of hyperbolic equations constructed fromthe TDOA information. The accurate leak position is thenlocated. The following conclusions are derived based on theexperiments:
1) The four-element array is suitable for application in a furnacechamber.
2) Based on error rate and RMSE evaluations, the ML estimator isdistinctly advantageous over PHAT under noise and favorablereverberation conditions. Stable and sharp peaks can beobtained using the GCC-based ML estimator.
3) The adaptive Gaussian mutation operator used in the GA(encoded as a floating-point) can be used to search for theglobal optimum parameters by probability calculations.Initial guesses and distant source assumptions are henceavoided.
4) Time delay estimator errors greatly affect the accuracy oflocalization. The stereo array can fix the leak position in thetime delay estimator error permitted range of 0.1 ms, whereasthat for the plane array is 0.01 ms. Compared with plane array,the stereo array is more robust and accurate but requires moretime to converge.
Acknowledgement
The work described in this paper was supported by a grant fromNational Natural Science Foundation of China: Researches onAcoustic Passive Recognition and Location with Two Arrays DataFusion for Explosive Leakage of Power Plant Boiler “Four Tubes”(Project no. 50976034).
The authors thank I.S.P.G, Politecnico di Milano research staff fortheir valuable discussions, comments and support.
References
[1] Björn Widarsson, Erik Dotzauer, Bayesian network-based early-warning forleakage in recovery boilers, Appl. Thermal Eng. 28 (7) (2008) 754e760.doi:10.1016/j.applthermaleng.2007.06.016.
[2] N. Afgan, P.J. Coelho, M.G. Carvalho, Boiler tube leakage detection expertsystem, Appl. Thermal Eng. 18 (5) (1998) 317e326. doi:10.1016/S1359-4311(97)00054-9.
[3] G.S. Jiang, L.S. An, Y.D. Lu, Numerical study on the sound wave propagationthrough a row of heat-exchanger tubes in boilers, Proc. Chin. Soc. for ElectricalEng. 26 (12) (2006) 156e160 doi: CNKI: ISSN:0258-8013.0.2006-12-027.
[4] G.S. Jiang, L.S. An, T. Jing, Numerical study on the sound wave propagationthrough two rows of heat-exchanger tubes in boilers, Proc. Chin. Soc. forElectrical Eng. 26 (17) (2006) 106e111 doi: CNKI: ISSN: 0258-8013 CN: 11-2107/TM.
[5] G.S. Jiang, L.S. An, G.Q. Shen, Numerical study on the sound wave propaga-tion through many rows of heat-exchanger tubes in boilers, Proc. Chin. Soc.for Electrical Eng. 27 (20) (2007) 81e85 doi: CNKI: SUN:ZGDC.0.2007-20-016.
[6] G.S. Jiang, Acoustic behavior of steam leakage from boiler tubes. Ph.D. thesis,North China Electric Power University, 2006.

L. An et al. / Applied Thermal Engineering 31 (2011) 3428e34363436
[7] M.L. Moran, R.J. Greenfield, D.K. Wilson, Acoustic array tracking performanceunder moderately complex environmental conditions, Appl. Acoust. 68 (2007)1241e1262. doi:10.1016/j.apacoust.2006.08.008.
[8] L. Jia, The Research on Acoustic Source localization Based on microphonearrays. Master thesis, Tianjin University, 2008.
[9] S.L. Zhu, An extended KALMAN filtering algorithm based on circular arraymeasurement, Acta Armamentarii 22 (2001) 492e495 doi: CNKI: ISSN:1000-1093.0.2001-04-015.
[10] A.N. Bishop, B. Fidan, K. Dogancay, B.D.O. Anderson, P.N. Pathirana,Exploiting geometry for improved hybrid AOA/TDOA based localization,Signal Process. 88 (2008) 1775e1791. doi:10.1016/j.sigpro.2008.01.015.
[11] Raghu N. Challa, Sanyogita Shamsunder, Passive near-field localizationof multiple non-Gaussian sources in 3-D using cumulants, Signal Process. 65(2009) 39e53. doi:10.1016/S0165-1684(97)00206-5.
[12] G.C. Carter, Time delay estimation for passive sonar signal processing, IEEETrans. Acoust. Speech Signal Process. 29 (1981) 463e470. doi:10.1109/TASSP.1981.1163560.
[13] J. Liu, Q.M. Cuiand, X.F. Tao, Improved Taylor series location algorithm forcooperation networks, J. China Univ. Posts Telecommun. 14 (2007) 38e44.doi:10.1016/S1005-8885(07)60123-X.
[14] Y.T. Chan, K.C. Ho, A simple and efficient estimator for hyperboliclocation, IEEE Trans. Signal Process. 42 (1994) 1905e1915. doi:10.1109/78.301830.
[15] G.Q. Shen, L.S. An, G.S. Jiang, Simulation of time delay estimation in acousticpyrometry in power plant boiler, Proc. Chin. Soc. Electrical Eng. 27 (11) (2007)57e61 doi: CNKI: SUN:ZGDC.0.2007-11-010.
[16] J. Allen, D. Berkley, Image method for efficiently simulating small-roomacoustics, J. Acoust. Soc. America 65 (1979) 943e950.
[17] M. Brandstein, H. Silverman, A Practical Methodology For SpeechLocalization With Microphone Arrays Technical Report. Brown University,1996.
[18] J.H. Holland, Adaptation in Natural and Artificial Systems. University ofMichigan Press, Ann Arbor, 1975.
[19] D.B. Fogel, An introduction to simulated evolutionary optimization, IEEETrans. Neural Netw. 5 (1994) 3e14. doi:10.1109/72.265956.
[20] E. Sidiropoulos, P. Tolikasa, Genetic algorithms and cellular automata inaquifer management, Appl. Math. Model. 32 (4) (2008) 617e640. doi:10.1016/j.apm.2007.01.005.
[21] Z. Michalewicz, Genetic Algorithms þ Data Structures ¼ Evolution Programs.Springer-Verlag, New York, 1992.