hyperbolic browser for erp accounting system …
TRANSCRIPT

Global Perspectives on Accounting EducationVolume 11, 2014, 25-39
HYPERBOLIC BROWSER FOR ERPACCOUNTING SYSTEM PEDAGOGYAND CURRICULUM MANAGEMENT
Zane L. SwansonCollege of Business Administration
University of Central OklahomaEdmond, Oklahoma
USA
ABSTRACTThis study introduces the application of a hyperbolic browser for (1) classroompedagogy and (2) curriculum administration of university accounting programs. Akey pedagogy benefit for students is a tool which provides information visualizationof accounting processes and facilitates the development of information acquisitionskills. This approach gives faculty organizational coursework knowledgemanagement control. The hyperbolic browser can also be adapted to knowledgemanagement of academic accounting department curriculum.
Key words: Hyperbolic browser, ERP, Curriculum, Knowledge Management.
Data availability: Data / Javascript program code is available upon request.
INTRODUCTION
This is a developmental work of incorporating hyperbolic browsers in a knowledgemanagement accounting systems and curriculum framework in university education. Thestudy will work through the development theoretically and by way of example. Hyperbolic
browsers can benefit academics in two respects: curriculum management; and informationvisualization of accounting in the classroom. Every accounting department faces issues ofcurriculum management. Over time, the accounting information/curriculum has become morecomplex. With increasing complexity comes a greater difficulty of administration with respect tocoverage and control. A means to the end of better administration is application of knowledgemanagement (Swanson and Hepner, 2011) in which hyperbolic browsers can be used as theinformation organizer. The motivation is efficiency within administration and the generation of well-defined documentation.
25

26 Swanson
Information visualization is an issue in classroom accounting education. Instructors knowaccounting cycles and information systems but must convey them to students who many timescannot see the forest for the trees. Hyperbolic browsers give a big-picture overview and facilitatethe mapping of transactions through an accounting system and accounting cycle. This mappingfeature is of particular instructive value for ERP systems which are used in all top firms and mostmiddle level firms. Due to the complexity of ERP, knowledge management then becomes a usefulmeans to administer ERP and its application to various educational competencies (i.e., as evidencedby learning objectives). A substantive issue is: How does one navigate within the specific (detail)transactions in regards to the general (overall) reporting? One answer is information visualizationwith hyperbolic browsers. Hyperbolic browsers bring to the table the capability of making a graphicpresentation of the ERP conduct of business (e.g., Microsoft Dynamics GP) and then followingthrough the numbers to the financial statements.
The remaining sections of the development cover: a literature review of relevant informationvisualization including hyperbolic background, an ERP curriculum hyperbolic example, a classroomdesign formulation, and conclusions with future directions.
LITERATURE OVERVIEWThe literature overview has two areas of discussion. One addresses the idea of information
visualization and the other specifically addresses knowledge management in accounting pedagogy.
Information VisualizationTwo approaches to information visualization are discussed here. One is the approach
commonly known as mind mapping. Wikipedia (Wikipedia, 2012) has a list of freeware mind mapsoftware at their web site http://en.wikipedia.org/wiki/List_of_concept-_and_mind-mapping_software. Mind mapping is generic and not a rigorous graphical methodology, but it doesenhance student learning (Farrand et al., 2002). The Wikipedia site has several example pictures,and it is possible to make a graphic organization of any particular accounting system with one of thesoftware packages. Note that individual users’ preferences may affect whether one of the freewareprograms meets a need or not.
The second alternative, which is utilized in the following analyses and examples, uses ahyperbolic browser methodology. Hyperbolic browsers are best defined by their purpose andapplication to facilitate the database navigation of hyperbolic space of data trees (Swanson, 2010).An axiom postulates that as the database becomes larger, the advantage of a hyperbolic browserbecomes greater. This axiom is particularly applicable to large ERP accounting systems. Inhierarchical databases of accounting information, as the number of nodes of tree structures grow,the visualization of the information becomes more difficult to comprehend for students. Similarly,curriculum management become challenging to manage with large/highly detailed programs. Thehyperbolic tree permits the viewer to focus upon the immediate links and nodes while the otherinformation is deliberately placed out of focus at the extremities (Lamping and Rao, 1996a). Figures1A and 1B demonstrates a hyperbolic tree example series based upon the Poincare disk model(Wikipedia, 2010). This example is an organizational chart. Figure 1A places the president in thecenter and then navigates in Figure 1B to show the upper section of the organizational chart ingreater detail. The miniscule attributes of the reduced view toward the edge change perspective ifa particular node near an edge was brought to the center, because it becomes a larger size makingit understandable to the user.

Hyperbolic Browser 27
FIGURE 1A
Hyperbolic Browser Diagram Transitions (Lamping et al., 1995)
The advantage of a hyperbolic browser in curriculum knowledge management and ERPcourse work centers around features that accomplish the mapping of a hierarchical tree structure intoa hyperbolic presentation. Allen (2002) focuses on two hyperbolic browser features from Lampingand Rao (1996a):

28 Swanson
FIGURE 1BHyperbolic Browser Diagram Transitions (Lamping et al., 1995)
“1.The nodes or components of the tree diminish in size the farther away they are from the centerof the display.2.The number of nodes or components grows exponentially from parent to child.”
These features work to the advantage of hyperbolic browsers over hierarchy browsers. The principaladvantages are that navigation is more effective and hyperbolic browsers display up to 10 times asmany nodes than hierarchy browsers (Lamping and Rao, 1996b).

Hyperbolic Browser 29
With respect to mapping the accounting curriculum in general or mapping ERP accountingas it would apply to specific classwork problems, the hyperbolic browser focuses on the key issues,and its information visualization facilitates navigation between data items. With that generalcharacteristic in mind, the specific next step is an appropriately constructed ontology of accountingthat can be theoretically represented with a hyperbolic browser. This activity can be accomplishedas is shown in general terms by a paper (Eklund et al., 2002) which presents a hyperbolic browsertool representing ontologies in general terms, which means that it can be done specifically foraccounting applications. The next section develops an example design knowledge managementsystem of an accounting ERP curriculum. The following section also discusses ERP systems at thevalue-chain level and gives a hyperbolic browser illustration of a cash conversion cycle set oftransactions. The same system design process which would be done for any other informationtechnology project will apply to a hyperbolic browser application.
HYPERBOLIC BROWSER APPLICATION DEVELOPMENTThis section provides: 1) a theoretical basis in the literature for the application of knowledge
management to accounting curriculum with ERP coursework in particular and 2) a hyperbolicbrowser information visualization example of a cash conversion cycle.
Curriculum Program Knowledge ManagementKnowledge management has to be based upon an information structure. In this situation,
ontology1 provides the framework. In practice, academic curriculum is developed on an ad hoc basiswhere faculty responds to the latest development (e.g. ASC coding or IFRS) with a modification ofexisting courses. Only when there is a demand for a systematic approach (e.g., AACSB
FIGURE 2ERP Project Curriculum Design (Swanson and Hepner, 2011 Figure 3)
1Ontology is a branch of philosophical science whose objective is the study of structures and their characteristics inevery area of reality.

30 Swanson
accreditation) is there a systems type activity. In a system design, one looks to flowchart the processand to identify the attributes which must be reported. In order to be efficient and successful,accounting departments should periodically review their curriculum. Knowledge management isideally suited to the task within the concept of an ontological framework.
The work of Swanson and Hepner (2011) shows a flow chart design (see their Figure 3, thisworks’ Figure 2) for an ERP accounting curriculum example. Once the curriculum ontology andknowledge management characteristics have been formulated, then the department needs aninformation management system to run the program. That is where the hyperbolic browser entersthe picture.
It is a fairly simple matter to translate Figure 2 into a hyperbolic browser informationvisualization system as in Figure 3. This knowledge management program setup and the classroomexample in the next section were created from Javascript code particularly modified for thesesituations. Generic code may be downloaded from the internet. This example is a demonstration ofthe nature of multiple learning objective aspects from Figure 2 which can be addressed with aknowledge management design to administrate a curriculum.
FIGURE 3Accounting Department Curriculum Map as Portrayed with a Hyperbolic Browser
Part 1: Department Starting Position

Hyperbolic Browser 31
FIGURE 3, continuedPart 2: Consolidated Statements
Let’s suppose a new chair of an accounting department is asked: What are the ERPobjectives of a particular class (e.g. consolidated statements)? Utilizing a curriculum informationsystem with a hyperbolic browser, the chair would start at the department control point which wouldbe at the center of the system. See Figure 3 Part I. Then, move to the class name. See Figure 3 PartII. The ERP project objectives for the class are detailed.
Hyperbolic Browser Classwork Application DevelopmentPrior research (Swanson and Freeze, 2009) describes the financial reporting Generally
Accepted Accounting Principles (GAAP) in terms of ontology. The research shows how thefinancial statement structured outputs, which are the result of firm transactions based on a valuechain model, can be fitted into an ontological theory specification. Accounting is the processing andreporting of entity economic information that will facilitate decision making and is to be conductedunder GAAP. The highly organized nature of GAAP codification fits a knowledge managementproject mode. Other analysis (Swanson and Hepner, 2011) demonstrates that, within accountingcourse work, general ledger and financial accounting can be structured in terms of ontologies. Thefollowing development is consistent with the incorporation of ontologies into hyperbolic browsers.
A defining feature of this work is the visualization of accounting in a hyperbolic browser.The development also provides a theoretical basis for the synergistic combination of ERP and ahyperbolic browser. In the current study, an operating cycle (Weygandt, 2011) (illustrated in Figure4) is presented within the ERP context of a simple firm as a value chain diagramed in Figure 5.

32 Swanson
FIGURE 4Cash Conversion Cycle Diagram
FIGURE 5
Example of Value Chain of Simple Manufacturing Company
RawMaterials
ö Manufacturing öFinishedInventory
ö Sales
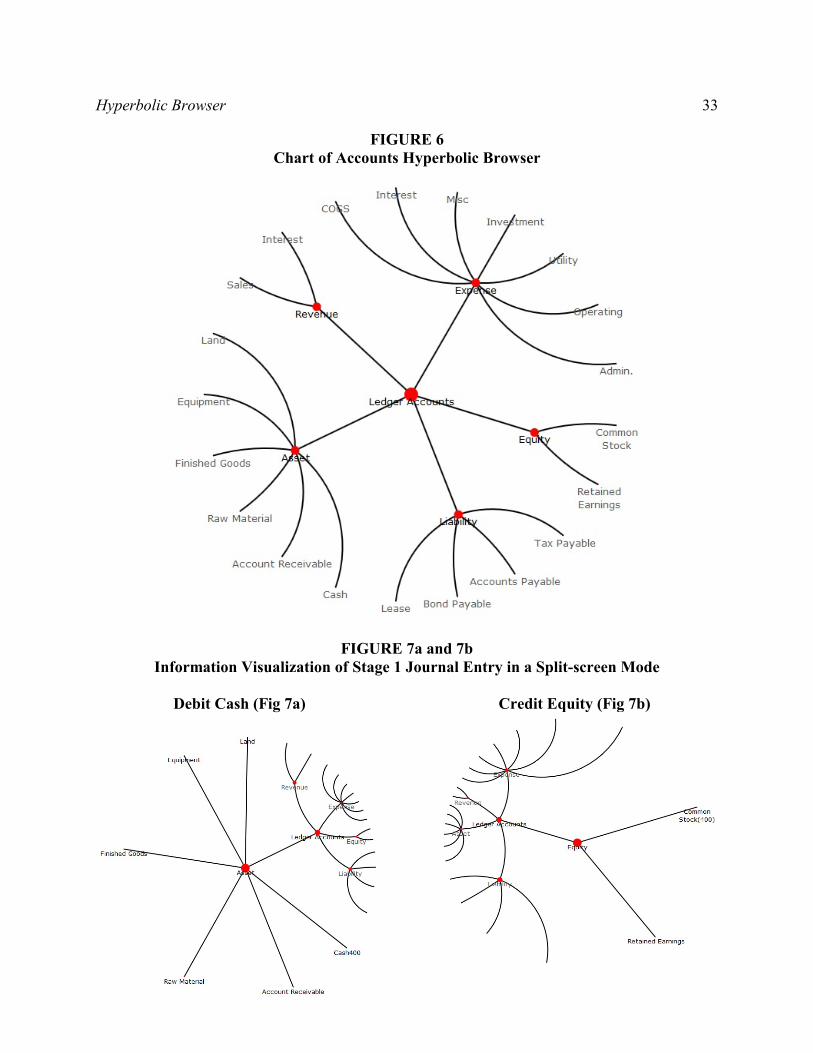
The accounting cash conversion cycle example (shown in Figure 4) is described first withthe traditional journal entries and then illustrated in terms of a hyperbolic browser (See Figure 6).In the classroom, one presentation strategy is to work through the traditional journal entries on ablackboard (or whiteboard) and then demonstrate them with a hyperbolic browser on a computerprojection system. Another presentation strategy is to put the traditional journal entry on ablackboard, and then open two versions of the hyperbolic browser on the computer overhead wherethe instructor runs them side-by-side with one showing the debit information and the other showingthe credit information. The second approach is taken here. For each stage, the data is loaded onlyonce into the browser and then the instructor would move node to node demonstrating the valuesin the respective chart of account line items.
The stage 1 transaction is represented with the following journal entry of supply of cash fromstockholders. See Figure 7 for a side by side view of both the Cash and Stockholders’ EquityAccounts.
Debit CreditCash 400
Stockholders’ Equity 400
Hyperbolic Browser 33
FIGURE 6Chart of Accounts Hyperbolic Browser
FIGURE 7a and 7bInformation Visualization of Stage 1 Journal Entry in a Split-screen Mode
Debit Cash (Fig 7a) Credit Equity (Fig 7b)

34 Swanson
Material AcquisitionDebit Credit
Raw Material 100Cash 100
Product ManufacturingDebit Credit
Finished Goods 300Raw Material 100Cash 200
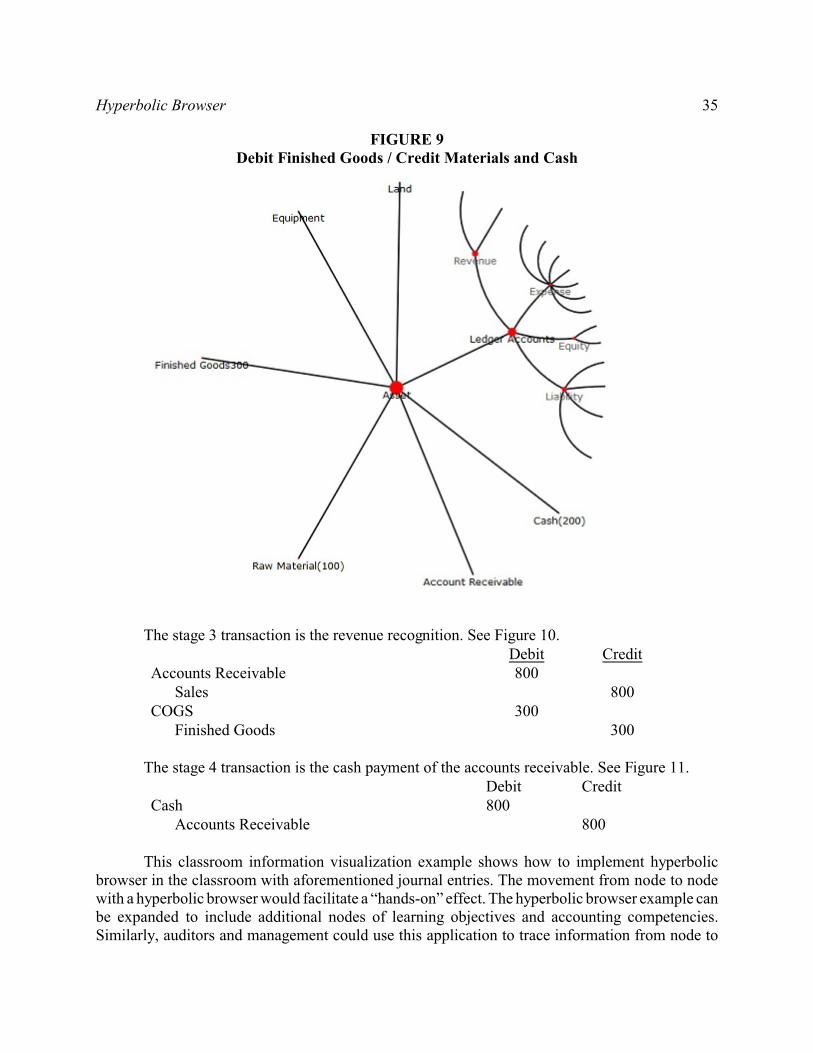
The stage 2 transaction is represented with the following journal entry of the ERP systemcreating valued-added product of the purchase of raw material and its transformation intofinished goods. For the hyperbolic browser presentation, see Figure 8 for material acquisitionand Figure 9 for manufacturing.
FIGURE 8Debit Raw Materials and Credit Cash
Hyperbolic Browser 35
FIGURE 9Debit Finished Goods / Credit Materials and Cash
The stage 3 transaction is the revenue recognition. See Figure 10.Debit Credit
Accounts Receivable 800Sales 800
COGS 300Finished Goods 300
The stage 4 transaction is the cash payment of the accounts receivable. See Figure 11.Debit Credit
Cash 800Accounts Receivable 800
This classroom information visualization example shows how to implement hyperbolicbrowser in the classroom with aforementioned journal entries. The movement from node to nodewith a hyperbolic browser would facilitate a “hands-on” effect. The hyperbolic browser example canbe expanded to include additional nodes of learning objectives and accounting competencies.Similarly, auditors and management could use this application to trace information from node to

36 Swanson
FIGURE 10a and 10bInformation Visualization of Stage 3 Journal Entry in a Split-screen Mode
Debit AR and COGS (Fig 10a) Credit Sales and Finish. Goods (Fig 10b)
node in an ERP system. Also, the curriculum knowledge management function can be utilized toreference the documentation for accreditation purposes, etc.
CONCLUSIONS AND FUTURE DIRECTIONSThis study demonstrates (theoretically) and represents (by way of example) two aspects of
how accounting education can benefit from the use of a hyperbolic browser. These applications are:

Hyperbolic Browser 37
FIGURE 11Debit Cash and Credit Accounts Receivable
1) curriculum management and 2) information visualization of accounting systems and transactions.The work discusses how ERP accounting information systems and knowledge management canfunction with a hyperbolic browser. A positive aspect of this synergy is a mapping mechanism thatpermits navigation from node to node of business processes and facilitates the view of large ERPinformation systems in a way in which users can visualize the value chain and financial statementreports with more clarity. The navigation between nodes could also be a significant benefit tocurriculum knowledge management. For those that want to experiment on their own, the originalweb source used in this study is: http://philogb.github.io/jit/static/v20/Jit/Examples/Hypertree/example1.code.html.
Accounting information system courses use data flow diagrams. See figure 12 (Gelinas et.al., 2011) for a basic example. As the data flow diagrams become more complex, students may losethe big picture, and this issue could be addressed by a “focus + context” (Herman et. al., 2000) typehyperbolic browser approach. However, contrasted with the tree structure of the present work, dataflow diagrams have multi-node networks (See Figure 12). Future research could investigate how toincorporate hyperbolic-browser information visualization approaches to do multi-node networkaccounting data flow diagrams.

38 Swanson
FIGURE 12Data Flow Diagram
Every idea has benefits and costs. The organization and information visualization can bring
efficiency and clarity. A negative aspect is the cost to superimpose the hyperbolic browser on the
accounting information system. JavaScript computer code used in this study does facilitate the
hyperbolic information visualization, but does not directly link with ERP systems. Future research
can further investigate how to link ERP systems to hyperbolic browsers. From a usage perspective,
future research could also compare access times, ease of use, etc. of existing curriculum
management systems with hyperbolic browsers. There is also the opportunity to do student
performance comparisons between the traditional instructional method and a hyperbolic browser-
enhanced instructional approach.
Hyperbolic Browser 39
REFERENCES
Allen, M. 2002. The Hype Over Hyperbolic Browsers. Online.
Eklund, P., N. Roberts, and S. Green. 2002. OntoRama: Browsing RDF Ontologies Using a
Hyperbolic-Style. First International Symposium on Cyber Worlds. IEEE Computer Society.
Farrand, P., F. Hussain, and E. Hennessy. 2002. The Efficacy of the ‘Mind Map’ Study Technique.
Medical Education 426-431.
Gelinas, U., R. Dull, and P. Wheeler. 2011. Powerpoint Supplement for Accounting Information
Systems 9e (Stamford, CT: Centage Learning).
Herman I., G. Melançon, and M. Marshall. 2000. Graph Visualization and Navigation in Information
Visualization: A Survey. IEEE Transactions on Visualization and Computer Graphics (Vol. 6,
No. 1) 24-43.
Lamping, J., and R. Rao. 1996a. Visualizing Large Trees Using the Hyperbolic Browser.
Proceedings of the Conference on Human Factors in Computing Systems. [http://dl.acm.org./
citation.cfm?id=257089.257389&coll=DL&dl=GUIDE].
_______, and _______. 1996b. The Hyperbolic Browser : A Focus+Context Technique for
Visualizing Large Hierarchies. Journal of Visual Languages and Computing 33-55.
_______, _______, and P. Pirolli. 1995. A Focus+Context Technique Based on Hyperbolic
Geometry for Visualizing Large Hierachies. ACM Conference Human Factors in Computing
Systems 401-408.
Swanson, Z. 2010. ERP and Financial Statement Rendering with a Hyperbolic Browser. American
Accounting Association Annual Meeting.
_______, and M. Hepner. 2011. Knowledge Management ERP Curriculum Design/Mapping.
Decision Sciences Journal of Innovative Education 209-226.
_______, and R. Freeze. 2009 GAAP Codification: An Ontological Perspective. www.ssrn.com
(http://ssrn.com/abstract=1262059).
Weygandt J., P. Kimmel, and D. Kieso. 2011 Financial Accounting. (Hoboken, NJ: Wiley & Sons,
Inc.).
Wikipedia. 2012 List_of_concept-_and_mind-mapping_software. http://en.wikipedia.org/wikiList_
of_concept-_and_mind-mapping_software (accessed 2012).
_______. 2010. Poincare disk model. (March 20). http://en.wikipedia.org/wiki/Poincar%C3%A9_
disc_model (accessed March 20, 2010).