hyperosmotic stress and the impact on metabolite · pdf fileredox balance in saccharomyces...
TRANSCRIPT

Hyperosmotic Stress and the Impact on Metabolite Formation and
Redox Balance in Saccharomyces cerevisiae and Saccharomyces bayanus strains
Caitlin Heit, B.Sc. Hon.
Biotechnology
Submitted to the Centre for Biotechnology in partial fulfillment
of the requirements for the degree of Master of Science
Faculty of Mathematics and Science, Brock University
St. Catharines, Ontario
December 2013
©Caitlin Heit, 2014
i
Abstract
Wine produced using an appassimento-type process represents a new and exciting
innovation for the Ontario wine industry. This process involves drying grapes that have
already been picked from the vine, which increases the sugar content due to dehydration
and induces a variety of changes both within and on the surface of the grapes. Increasing
sugar contents in musts subject wine yeast to conditions of high osmolarity during alcoholic
fermentations. Under these conditions, yeast growth can be inhibited, target alcohol levels
may not be attained and metabolic by-products of the hyperosmotic stress response,
including glycerol and acetic acid, may impact wine composition. The further metabolism
of acetic acid to acetylCoA by yeast facilitates the synthesis of ethyl acetate, a volatile
compound that can also impact wine quality if present in sufficiently high concentrations.
The first objective of this project was to understand the effect of yeast strain and
sugar concentration on fermentation kinetics and metabolite formation, notably acetic acid
and ethyl acetate, during fermentation in appassimento-type must. Our working hypotheses
were that (1) the natural isolate Saccharomyces bayanus would produce less acetic acid
and ethyl acetate compared to Saccharomyces cerevisiae strain EC-1118 fermenting the
high and low sugar juices; (2) the wine produced using the appassimento process would
contain higher levels of acetic acid and lower levels of ethyl acetate compared to table
wine; (3) and the strains would be similar in the kinetic behavior of their fermentation
performances in the high sugar must.
This study determined that the S. bayanus strain produced significantly less acetic
acid and ethyl acetate in the appassimento wine and table wine fermentations. Differences
in acetic acid and ethyl acetate production were also observed within strains fermenting the
two sugar conditions. Acetic acid production was higher in table wine fermented by S.

ii
bayanus as no acetic acid was produced in appassimento-style wine, and 1.4-times higher
in appassimento wine fermented by EC-1118 over that found in table wine. Ethyl acetate
production was 27.6-times higher in table wine fermented by S. bayanus, and 5.2-times
higher by EC-1118, compared to that in appassimento wine. Sugar utilization and ethanol
production were comparable between strains as no significant differences were determined.
The second objective of this project was to bring a method in-house for measuring
the concentration of pyridine nucleotides, NAD+, NADP+, NADH and NADPH, in yeast
cytosolic extract. Development of this method is of applicative interest for our lab group
as it will enable the redox balance of the NAD+/ NADH and NADP+/ NADPH systems to
be assessed during high sugar fermentations to determine their respective roles as
metabolic triggers for acetic acid production. Two methods were evaluated in this study
including a UV-endpoint method using a set of enzymatic assay protocols outlined in
Bergmeyer (1974) and a colorimetric enzyme cycling method developed by Sigma-
Aldrich® using commercial kits. The former was determined to be limited by its low
sensitivity following application to yeast extract and subsequent coenzyme analyses, while
the latter was shown to exhibit greater sensitivity. The results obtained from the kits
indicated high linearity, accuracy and precision of the analytical method for measuring
NADH and NADPH, and that it was sensitive enough to measure the low coenzyme
concentrations present in yeast extract samples. NADtotal and NADPtotal concentrations
were determined to be above the lower limit of quantification and within the range of the
respective calibration curves, making this method suitable for our research purposes.
iii
Acknowledgments
I would like to express my appreciation to my supervisor, Dr. Inglis, for giving me
the opportunity to pursue my thesis project under her advisement. Throughout my research,
you provided good teaching, sound advice and support, all of which I am incredibly
grateful for. Your guidance and encouragement allowed me to develop my laboratory,
problem-solving and communication skills, and perhaps more importantly, have
confidence in my own research abilities. Special thanks to Dr. Atkinson, Dr. van der Merwe
and Dr. Liang for your time, participation and guidance. It was all very much appreciated.
To everyone in the IH210 lab group (Candace, Fei, Ian, Lisa, Cristina, Matilda,
Tony and Jen) and Mary, you are a wonderful collection of bright minds and souls, all of
whom are exceptionally kind, funny, warm-hearted, understanding and best of all,
supportive. It was a pleasure to work with each and every one of you. I am especially
indebted to Fei and Candace for their constant support and encouragement during my time
in the lab. To both of you, your assistance was truly invaluable and your friendship even
more so. I would also like to extend my gratitude to Ian for his unconditional support over
these two years. Your wit, intellect and kindness are truly astounding, and it has been a
privilege to know you. Special thanks to Linda Tremblay, Lynda van Zuiden and Fred Di
Profio for your assistance. I was lucky to have help from people like you.
Lastly, I would like to thank my family. My mom, dad and sisters always made sure
I felt their encouragement and love a distance away, and I am forever grateful for their
support. And a loving thanks to you, Kristy for being a wonderful friend. Knowing you has
been an absolute pleasure. Accordingly, I dedicate this thesis to all of you.
iv
Table of Contents
Chapter 1 ................................................................................................................. 1
1. Introduction and Literature Review .......................................................................1
1.1. Responding to Hyperosmotic Stress and Osmoadaptation in S. cerevisiae ..................1
1.1.1. Hyperosmotic stress: cellular effects, consequences and responses .......................1
1.1.2. Overview of the HOG response: signalling ............................................................3
1.1.3. Overview of the HOG response: sensing osmotic stress ........................................4
1.1.4. Overview of the HOG response: glycerol production and redox implications .......8
1.1.5. Acetic acid formation and redox balance ..............................................................10
1.2. Formation of other metabolites and relationship to acetic acid and wine quality ......16
1.2.1. Formation of acetaldehyde ....................................................................................16
1.2.2. Formation of acetylCoA .......................................................................................16
1.2.3. Formation of ethyl acetate ....................................................................................19
1.3. Introduction to wine yeast: Saccharomyces cerevisiae and Saccharomyces bayanus
............................................................................................................................................24
1.4. Literature Cited ...........................................................................................................28
Chapter 2 ............................................................................................................... 39
2. Acetic Acid and Ethyl Acetate Formation during Fermentation in
Appassimento-Type Must: Effect of Yeast Strain and Sugar Concentration.39
2.1. Abstract .......................................................................................................................39
2.2. Introduction .................................................................................................................40
2.3. Materials and Methods ................................................................................................47
2.3.1. Yeast strains ..........................................................................................................47
2.3.2. Grape musts ..........................................................................................................47
2.3.3. Grape harvesting and withering ............................................................................47
2.3.4. Chemical analyses of initial juices ........................................................................48
2.3.5. Must fermentation and sampling ..........................................................................49
2.3.6. Yeast inoculation procedure for fermentations .....................................................49
2.3.7. Experimental winemaking and fermentation monitoring .....................................50
2.3.8. Statistical analysis .................................................................................................52

v
2.4. Results .........................................................................................................................53
2.4.1. Initial appassimento-type must .............................................................................53
2.4.2. Fermentation kinetics ............................................................................................55
2.4.3. Acetic acid production ..........................................................................................60
2.4.4. Ethyl acetate production .......................................................................................63
2.4.5. Metabolomics analysis towards understanding acetic acid and ethyl acetate
formation ...............................................................................................................66
2.4.5.1. S. cerevisiae EC-1118 fermenting under high and low sugar stress ...............66
2.4.5.2. S. bayanus fermenting under high and low sugar stress .................................69
2.5. Discussion ...................................................................................................................72
2.5.1. Understanding acetic acid and ethyl acetate formation during fermentation .......72
2.5.2. Acetic acid production during fermentation .........................................................72
2.5.3. Ethyl acetate production during fermentation.......................................................75
2.5.4. Strain differences in acetic acid and ethyl acetate production ..............................76
2.5.5. Application of S. bayanus to appassimento-style winemaking ............................79
2.6. Conclusions .................................................................................................................80
2.7. Literature Cited ...........................................................................................................81
Chapter 3 ............................................................................................................... 83
3. Evaluation of a UV-Endpoint Method for Nicotinamide Coenzyme
Determination in Wine Yeast Cell Lysate .......................................................... 85
3.1. Abstract .......................................................................................................................85
3.2. Introduction .................................................................................................................86
3.3. Materials and Methods ................................................................................................90
3.3.1. Yeast strain............................................................................................................90
3.3.2. Culture media ........................................................................................................90
3.3.3. Yeast inoculation procedure and growth conditions for batch cultures ................91
3.3.4. Determination of yeast wet weight .......................................................................91
3.3.5. Determinaton of yeast dry weight .........................................................................92
3.3.6. Preparation of yeast extracts for assays ................................................................92
3.3.7. Inactivation of proteases in yeast extract using a protease inhibitor cocktail .......94
3.3.8. Deproteinization of yeast cell extract with spin filters .........................................94
vi
3.3.9. Overview: Determination of cellular NAD(P)+ and NAD(P)H concentrations ....95
3.3.9.1. Assay procedure for the determination of NAD+ ...........................................95
3.3.9.2. Assay procedure for the determination of NADP+ .........................................96
3.3.9.3. Assay procedure for the determination of NADH and NADPH.....................98
3.3.10. Enzymatic assay method for nucleotide determination in yeast cell extract ...99
3.3.10.1. Linearity, precision, sensitivity and accuracy provided by the method ......100
3.4. Results .......................................................................................................................102
3.4.1. In-study validation of assays ...............................................................................102
3.4.1.1. Evaluation of Bergmeyer (1974) assay using standards in water .................102
3.4.1.2. Recovery of NADP+ standards made up in yeast extraction buffer ..............104
3.4.1.3. NAD+ assay in Buffer 2 ................................................................................106
3.4.1.4. Measurement of nucleotide content in yeast cell lysate (without protein
inhibition or removal) ...................................................................................108
3.4.1.5. Effect of protease inhibition on nucleotide determination in yeast cell lysate
samples: evaluation of Complete Ultra Tablets (EDTA-free) ......................109
3.4.1.6. Effect of deproteinization on nucleotide determination in yeast cell lysate
samples: evaluation of 10 kDa spin filter .....................................................110
3.4.1.7. Measurement of nucleotide content in yeast cell lysate samples: investigation
of the use of spin filters and membrane pre-treatment .................................110
3.5. Discussion .................................................................................................................112
3.5.1. Method for preparing yeast cell extracts for enzymatic analyses .......................114
3.5.2. Method development of enzyme assays .............................................................114
3.6. Conclusions ...............................................................................................................119
3.7. Literature Cited .........................................................................................................120
Chapter 4 ............................................................................................................. 124
4. Evaluation of Two Commercial Assay Kits for the Colorimetric Detection
of Nicotinamide Coenzymes in Wine Yeast Cell Lysate ................................. 124
4.1. Abstract .....................................................................................................................124
4.2. Introduction ...............................................................................................................125
4.3. Materials and Methods ..............................................................................................128
4.3.1. Yeast strain..........................................................................................................128
4.3.2. Culture media ......................................................................................................128
vii
4.3.3. Yeast inoculation procedure and growth conditions for batch cultures ..............128
4.3.4. Determination of yeast wet weight .....................................................................128
4.3.5. Determination of yeast dry weight ......................................................................129
4.3.6. Preparation of yeast extracts for assays ..............................................................129
4.3.7. Deproteinization of cell extract with spin filters.................................................129
4.3.8. Overview: Determination of intracellular NAD(P)+ and NAD(P)H
concentrations .....................................................................................................129
4.3.8.1. Assay procedure for NAD+/ NADH and NADP+/ NADPH determination ..130
4.3.9. Establishing an enzymatic assay method for nucleotide determination .............131
4.3.9.1. Linearity, precision, sensitivity and accuracy provided by the method ........132
4.4. Results .......................................................................................................................134
4.4.1. In-study validation of assays ...............................................................................134
4.4.1.1. Evaluation of commerical test kits for nucleotide determination .................134
4.4.1.2. Evaluation of commerical test kits using yeast cell breaking buffer in place of
the cofactor extraction buffer........................................................................136
4.4.1.3. Calibration of assay incubation times ...........................................................138
4.4.1.3.1. Calibration of NAD+/ NADH assay incubation times ............................138
4.4.1.3.2. Calibration of NADP+/ NADPH assay incubation times ........................139
4.4.1.4. Measurement of nucleotide contents in cell lysate .......................................140
4.5. Discussion .................................................................................................................142
4.5.1. Method for preparing yeast cell extracts for enzymatic analyses ..........................142
4.5.2. Method development of enzyme assays ................................................................142
4.6. Conclusions ...............................................................................................................145
4.7. Literature Cited .........................................................................................................146
Chapter 5 ............................................................................................................. 149
Discussion and Conclusions ............................................................................... 149
5.1. Overall discussion and future research directions ....................................................149
5.1.1. Osmostress induced by appassimento-type must reduced the fermentation
capacity of wine yeast and increased glycerol and acetic acid formation in
S.cerevisiae .........................................................................................................150
5.1.2. Acetic acid formation in S. cerevisiae during high sugar fermentations and
relationship to acetylCoA ...................................................................................151
viii
5.1.3. Ethyl acetate formation in S. cerevisiae during high sugar fermentations and
relationship to acetylCoA ...................................................................................154
5.1.4. Strain-related differences in acetic acid and ethyl acetate formation .................155
5.2. Conclusions ...............................................................................................................157
5.3. Literature Cited .........................................................................................................158
Appendix I ........................................................................................................... 161
Appendix II ......................................................................................................... 171
Appendix III ........................................................................................................ 174

ix
List of Tables
Chapter 2
Table 2.1. Chemical composition of Cabernet franc musts prior to fermentation (mean ±
SD) ....................................................................................................................54
Chapter 3
Table 3.1. Percent recoveries of buffer samples spiked with 50 µM of NADP+ standard
stock (n = 1) ....................................................................................................105
Table 3.2. Percent recoveries of authentic standard solutions spiked into yeast cell
extract samples deproteinized using a 10 kDa spin filter ...............................111
Table 3.3. Percent recoveries of authentic standard solutions spiked into yeast cell extract
samples prior to centrifugation .......................................................................113
Table 3.4. Concentration of coenzyme determined in yeast cell extract (deproteinized
using a 10 kDa filter) ......................................................................................113
Chapter 4
Table 4.1. Concentration of NADtotal and NADPtotal determined in cell extract samples
deproteinized using a 10 kDa spin filter, and the LLOQ of each standard
curve……………………………………………………………………………………………………….…141
Table 4.2. Percent recoveries of yeast cell extract samples spiked with 0.8 µM NADH or
NADPH standard stock………………………………..……………………141

x
List of Illustrations
Chapter 1
Figure 1.1: Schematic diagram of the HOG pathway and its components in S. cerevisiae.7
Figure 1.2: Osmo-induced glycerol formation in S. cerevisiae during Icewine
fermentation and its relationship to acetic acid production .............................12
Figure 1.3: Relationship of metabolites formed by S. cerevisiae during fermentation .....19
Chapter 2
Figure 2.1: Sugar consumption during fermentation of table wine must and appassimento-
type must..........................................................................................................57
Figure 2.2: Ethanol production during fermentation of table wine must and apassimento-
type must..........................................................................................................58
Figure 2.3: Ethanol produced/ sugar consumed during fermentation of table wine must
and appassimento-type must ............................................................................59
Figure 2.4: Total colony forming units during fermentation .............................................59
Figure 2.5: Acetic acid production during fermentation of table wine must and
appassimento-type must ..................................................................................61
Figure 2.6: Acetic acid produced/ sugar consumed during fermentation of table wine
must and appassimento-type must ...................................................................62
Figure 2.7: Ethyl acetate production during fermentation of table wine must and
appassimeno-type must....................................................................................64
Figure 2.8: Ethyl acetate produced/ sugar consumed during fermentation of table wine
must and appassimeno-type must ....................................................................65
Figure 2.9: Metabolite production during fermentation by S. cerevisiae EC-1118 ...........68
Figure 2.10: Metabolite production during fermentation by S. bayanus ...........................71
Figure 2.11: Relationship of metabolites formed by S. cerevisiae during fermentation ...73
Chapter 3
Figure 3.1: Best-fit calibration curve of NAD+ and NADP+ with cofactor dissolved in
water ..............................................................................................................103
Figure 3.2: Best-fit calibration curves of nicotinamide cofactors in cell breaking
buffer .............................................................................................................107

xi
Chapter 4
Figure 4.1: Best-fit calibration curve of NADH and NADPH with cofactor dissolved in
extraction buffer ............................................................................................135
Figure 4.2: Best-fit calibration curve of NADH and NADPH with cofactor dissolved in
yeast cell breaking buffer ..............................................................................137
xii
List of Abbreviations
ACH: acetylCoA hydrolase
ACS: acetylCoA synthetase
ADH: alcohol dehydrogenase
ALD: aldehyde dehydrogenase
ANOVA: analysis of variance
ATF: alcohol acetyltransferase
ATP: adenine triphosphate
AWRI: Australian Wine Research Institute
BSA: bovine serum albumin
CCOVI: Cool Climate Oenology and Viticulture Institute
CDC: cell division cycle
CFU: colony forming unit
CoA: coenzyme A
CV: coefficient of variation
C6: carbon-six
DAP: diammonium phosphate
DHAP: dihydroxyacetone phosphate
DNA: deoxyribonucleic acid
DTT: dithiolthreitol
EDTA: ethylendiaminetetraacetic acid
EGTA: ethyleneglycoltetraacetic acid
FID: flame ionization detector
GC: gas chromatography
GDP: glycerol-3-phosphate dehydrogenase
GlDH: glutamate dehydrogenase
GPDH: glucose-6-phosphate dehydrogenase
GPP: glycerol-3-phosphatase
GTP: guanosine-5'-triphosphate
Gly-3-P: glycerol-3-phosphate

xiii
Glyceraldehyde-3-P: glyceraldehyde-3-phosphate
G6P-DH: glucose-6-phosphate dehydrogenase
HCl: hydrochloric acid
HEPES: 4-(2-hydroxyethyl)-1-piperazineethanesulfonic acid
HOG: high osmolarity glycerol
KCl: potassium chloride
KOH: potassium hydroxide
LiCl: lithium chloride
LLOQ: lower limit of quantification
Lg: lager-type genome
LSD: least significant difference
MAPK: mitogen activated protein kinase
MAPKK: mitogen activated protein kinase kinase
MAPKK: mitogen activated protein kinase kinase kinase
MWCO: molecular weight cut-off
NAD+: nicotinamide adenine dinucleotide
NADH: nicotinamide adenine dinucleotide, reduced
NADP+: nicotinamide adenine dinucleotide phosphate
NADPH: nicotinamide adenine dinucleotide phosphate, reduced
NaCl: sodium chloride
NaOH: sodium hydroxide
N: nitrogen
PAN: primary amino nitrogen
PBS: polymyxin B resistance
PDC: pyruvate decarboxylase
PDH: pyruvate dehydrogenase
PMSF: phenylmethylsulfonylfluoride
PPP: pentose phosphate pathway
OD: optical density
RH: relative humidity
RNA: ribonucleic acid

xiv
SD: standard deviation
SLN: snythetic lethal of N-end rule
STE: sterile (α motif)
SSK: suppressor of sensor kinase
TA: titratable acidity
Tris: tris(hydroxymethyl)aminomethane
ULOQ: upper limit of quantification
UV: ultraviolet
VA: volatile acidity
Vis: visible
VQA: Vintners Quality Alliance
YANC: yeast assimilable nitrogen content
YPD: yeast peptone dextrose
YPD: tyrosine (y) phosphatase dependent

1
1. Introduction and Literature Review
1.1. Responding to Hyperosmotic Stress and Osmoadaptation in S. cerevisiae
1.1.1. Hyperosmotic stress: cellular effects, consequences and responses
Yeast live in a continually changing environment where the intracellular water
activity can fluctuate considerably over the lifetime of the cell due to changes in the
extracellular water activity. When yeast cells are exposed to conditions of high osmolarity,
the immediate effect is the loss of cytosolic water by osmosis. This process is driven by
the osmotic pressure difference across the cell membrane (Logothetis et al. 2007), and
eventually leads to changes in cell volume and shape, loss of turgor pressure and cell
polarity, compression of the cytoplasm and changes in metabolism (Blomberg and Adler
1992; Varela and Mager 1996; Billi and Potts 2002; Tamás and Hohmann 2003). For these
reasons, maintaining a constant internal environment under high osmolarity growth
conditions is important for cell function and survival.
Yeast have evolved specialized biochemical pathways to adapt to stressful, often
changing environments. Within the cell, specialized sets of sensing and signalling proteins
form modules that function to monitor the environmental conditions of the cell (Miermont
et al. 2011), and to mediate appropriate stress responses including altered gene expression,
metabolism, secretion, proliferation and apoptosis (Furukawa and Hohmann 2013).
Osmoadaptation is a cellular survival mechanism used by yeast to adjust to changes in
fluctuations in external osmotic pressure by re-establishing the osmotic gradient across the
plasma membrane (Martin et al. 1999). This response is associated with the increased
intracellular accumulation of compatible solutes to counteract dehydration caused by water
efflux, thereby restoring cell shape and turgor pressure, and to ensure the proteins within
2
the cellular environment remain hydrated (Mollapour and Piper 2006). During this
response, biomass production is also reduced to help cells in diverting the carbon flux away
from growth and metabolism and towards combating the osmotic stress (Parmar et al.
2011).
In addition to the aforementioned physiological effects, exposure to sudden
changes in environmental tonicity alters the internal concentrations of compounds,
possibly shifting the equilibrium of ongoing biochemical reactions occurring within the
cell (Petelenz-Kuedziel et al. 2011). This consequence can be detrimental for overall
cellular function, making it essential that yeast possess an active defense mechanism to
mitigate the negative effects of water loss. Glycerol plays an essential role in osmo-
adaptation and osmoregulation (reviewed in Nevoigt and Stahl 1997), and is the main
osmolyte produced by S. cerevisiae under hyperosmotic stress.
Adaptation to increased osmolarity is an active process dependent on sensing
osmotic changes and activating appropriate cellular responses to protect cells against
physiological stress (reviewed in Hohmann 2002). The principal cellular response in yeast
is the activation of the high osmolarity glycerol (HOG) pathway (Brewster et al. 1993).
The HOG pathway is a mitogen-activated protein kinase (MAPK) cascade that, when
stimulated, results in both transcriptional and non-transcriptional responses to allow cells
to cope with changes in the extracellular environment (Hohmann 2002). In addition to the
HOG response, yeast also possess a general stress response which has an important role in
stress adaptation and survival, allowing cells to cope with stresses under a range of
conditions including exposure to hyperosmolarity.

3
1.1.2. Overview of the HOG response: signalling
Adaptation to high osmotic stress in S. cerevisiae is controlled, in part, by an
osmosensing and signalling network called the HOG (High Osmolarity Glycerol) MAPK
pathway. MAPK pathways are well conserved among eukaryotes and are involved in many
cellular processes such as stress response, the regulation of differentiation and proliferation
(Miermont et al. 2011). In addition to the HOG pathway, the genome of S. cerevisiae
encodes four other distinct MAPK signal transduction pathways, each of which is catalyzed
by a specific MAP kinase possessing distinguishing features of this enzyme class (Chen
and Thorner 2007). These include: (i) the mating pheromone response pathway (MAP
kinase Fus2p); (ii) the pseudohyphal development pathway (Kss1p); (iii) the protein kinase
C or cell wall integrity pathway (Slt2/ Mpk1p); (iv) and the spore wall assembly pathway
(Smk1p) (Hohmann 2002).
The core of the HOG pathway is the Hog1 cascade. This cascade contains a three-
component signal relay based on the successive phosphorylation of the enzymes MAP
kinase kinase kinase (MAPKKK), MAP kinase kinase (MAPKK), and MAP kinase
(MAPK). To initiate MAPK cascades, the MAPKKK must first be activated in response to
a stimulus, typically by interactions with a small GTPase or other activator proteins and/
or phosphorylation by protein kinases downstream from cell surface receptors, depending
on the pathway (Cuevas et al. 2007). Upon stimulation, the MAPKKK activates the
MAPKK, a dual-specific protein kinase, by directly phosphorylating the two serine and
threonine residues residing in the activation loop of the MAPKK catalytic domain. The
activated MAPKK in turn phosphorylates a threonine or serine residue and a tyrosine
residue located within the activation segment of its target MAPK. Dual phosphorylation of

4
the tripeptide motif is required for MAP kinase activation, where it is subsequently
translocated from the cytosol into the nucleus to mount a response to the stimulus. In the
case of the HOG pathway and hyperosmotic environments, this response includes the
induction or repression of the expression of various genes, regulation of protein translation
and glycerol synthesis (reviewed in Hohmann 2002; Saito and Tatebayashi 2004). Once
osmotic balance is restored, either through intracellular changes due to osmolyte
accumulation or from alternations in the external environment, cascade activity terminates,
and Hog1p nuclear enrichment is reduced (Mettetal et al. 2008).
1.1.3. Overview of the HOG response: sensing osmotic stress
Within the HOG MAPK pathway of S. cerevisiae, the MAP kinases appear to be
activated via two distinct transmembrane proteins, Sln1p (Ostrander and Gorman 1999)
and Sho1p (Reiser et al. 2000), both initiating two independently operating branches which
provide two signals as inputs to the pathway (Thorne et al. 2011). These proteins, or
osmosensors, have been implicated in detecting osmotic stress and in regulating the activity
of the Hog1 MAPK (Hohmann 2009). Mutations in the genes encoding for Sln1p (Maeda
et al. 1994) and Sho1p (Posas and Saito 1997) were determined to affect the activity of the
HOG pathway as both proteins are localized in the plasma membrane, thereby placing the
sensors upstream of all the other pathway components. Although the molecular details of
the mechanism for activating Sln1p and Sho1p are not fully understood, the sensors appear
to be stimulated by osmotic shock, specifically in response to turgor-induced stress of the
cell membrane resulting from high extracellular osmolarity (reviewed in Hohmann 2002;
Tamas et al. 2000).
5
However, both branches of the HOG pathway were reported to be differently
activated in response to varying degrees of osmotic stress, specifically when induced by
salt (KCl). Using transcriptional profiling, O’Rourke and Herskowitz (2004) showed no
redundancy in the Sln1 and Sho1 branches for regulating gene induction at lower
osmolarity to exist as the transcription of genes associated with only the S1n1-branch were
induced in yeast exposed to solute concentrations <0.125 M KCl. In contrast, redundancy
between the Sln1 and Sho1 branches exposed to moderately high osmolarity (>0.5 M KCl)
was determined as genes associated with both pathways were induced under higher solute
conditions. At higher osmolarities, both branches of the HOG pathway as well as the
general stress response were involved in the response to osmotic stress. However, blocking
either branch of the pathway still permits phosphorylation and activation of Hog1p upon
exposure to high osmolarity (Maeda et al. 1995).
In general, the Sln1p and Sho1p branches function in regulating the HOG pathway
and activating the MAPK Hog1p, MAPKK Pbs2p, and MAPKKK Ssk2p (Fig. 1.1). Both
the Sln1 and Sho1 branches are located upstream from Pbs2p and Hog1p, and link the HOG
cascade through Pbs2p. Of the two branches, the first is initiated by the Sho1p adaptor
protein, while the second is initiated by Sln1p, a histidine kinase receptor (Boisnard et al.
2008). Activation of the HOG pathway via the Sho1p branch commences with the
formation of a transient multi-protein complex at the cell surface in response to osmotic
shock, which ultimately interacts with a proline-rich region on Pbs2p (Cheetham et al.
2007). Under these conditions, signal transduction from the osmosensor to Pbs2p requires
Cdc42p, Ste20p and Ste50p to activate Ste11p (Posas and Saito 1997; O’Rourke and
Herskowitz 2004; Posas et al. 1998; Raitt et al. 2000; Reiser et al. 2000). Of these branch

6
components, Cdc42p is a GTPase that binds and activates Ste20p, a p21-activated protein
kinase homologue, which, in turn, phosphorylates and activates the MAPKKK Ste11p
(Reiser et al. 2000; reviewed in O’Rourke et al. 2002). Ste11p is putively associated with
the SAM-domain containing protein Ste50p (Posas et al. 1998; Jansen et al. 2001), and
once activated, it subsequently phosphorylates the MAPKK Pbs2p.
Differently from Sho1p, Sln1p relays a signal to Pbs2p via the proteins Ypd1p,
Ssk1p and Ssk2p/ Ssk22p. While Sho1p positively regulates the HOG response, Sln1p,
along with Ypd1p, negatively regulate this pathway. These differences have been discerned
through deletion experiments of SLN1and YPD1, where disruption of the respective genes
encoding for these proteins resulted in lethal phenotypes, notably in abnormal and
deleterious osmoregulatory responses, due to the constitutive expression of the MAPK
cascade (Maeda et al. 1994). Furthermore, Sln1p also functions differently under low and
high osmolarity conditions. Under low osmotic stress, the histidine kinase domain of Sln1p
is activated, allowing the protein to phosphorylate itself and subsequently phosphorylate
Ypd1p and Ssk1p (reviewed in Posas et al. 1996). Phosphorylation of these proteins
inactivates Ssk1p, causing the HOG pathway to cease as the protein is unable to bind and
activate the final MAPKKKs in the cascade, Ssk2p and Ssk22p (Posas and Saito 1998).
However, when cells are osmotically stressed the histidine kinase domain of Sln1p
is inactivated, which allows the Sln1p-Ypd1p-Ssk1p phosphorelay to continue as
phosphotransfer of Ssk1p is diminished. As a consequence, unphosphorylated Ssk1p
accumulates within the cell, where it is able to bind and activate Ssk2p/ Ssk22p. Activation
of these MAPKKKs enables the pathway to be maintained as the subsequent
phosphorylation of Pbs2p MAPKK leads to the nuclear translocation of Hog1p (Ferrigno
7
et al. 1998). Within the nucleus, dually phosphorylated Hog1p regulates the transcription
of osmo-induced genes, including those which encode enzymes involved in glycerol
production (Rep et al. 1999; 2000). The up-regulation of glycerol-3-phosphate
dehydrogenase (GDP1/2) and glycerol-3-phosphatase (GPP1/2) alters the metabolic state
of S. cerevisiae, allowing the osmotic stress to be counteracted through the synthesis and
accumulation of glycerol as a compatible solute, and regulation of the internal osmotic
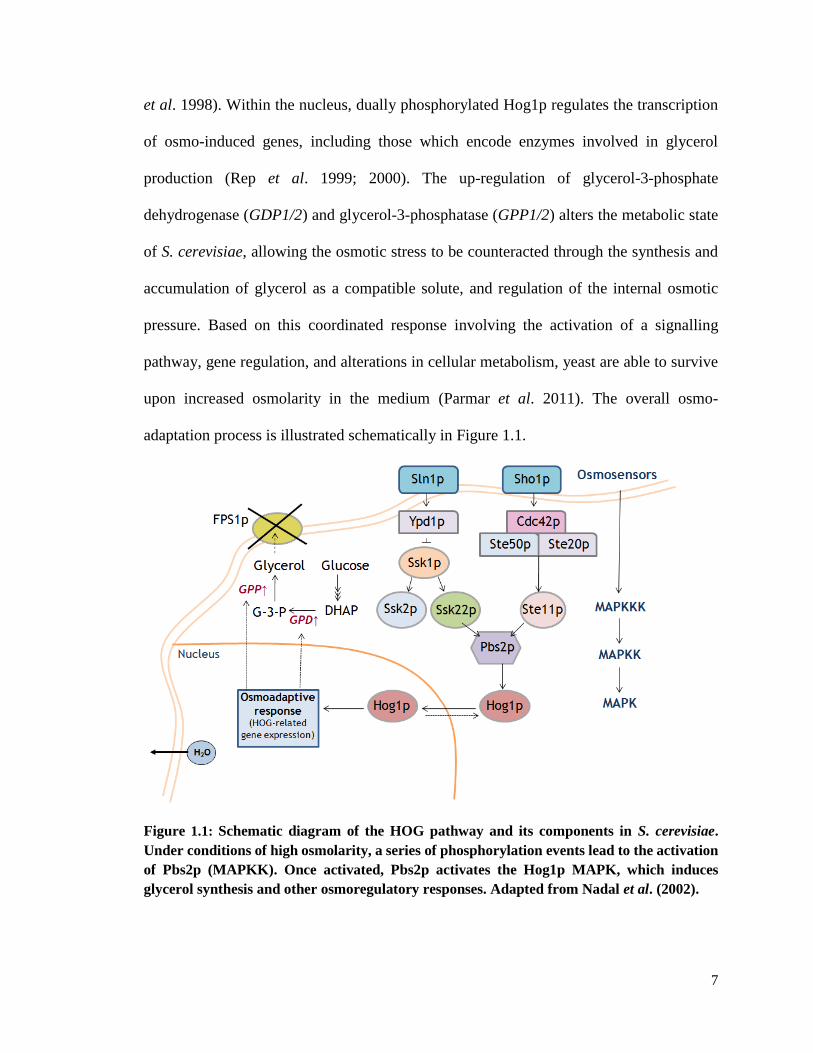
pressure. Based on this coordinated response involving the activation of a signalling
pathway, gene regulation, and alterations in cellular metabolism, yeast are able to survive
upon increased osmolarity in the medium (Parmar et al. 2011). The overall osmo-
adaptation process is illustrated schematically in Figure 1.1.
Figure 1.1: Schematic diagram of the HOG pathway and its components in S. cerevisiae.
Under conditions of high osmolarity, a series of phosphorylation events lead to the activation
of Pbs2p (MAPKK). Once activated, Pbs2p activates the Hog1p MAPK, which induces
glycerol synthesis and other osmoregulatory responses. Adapted from Nadal et al. (2002).

8
1.1.4. Overview of the HOG response: glycerol production and redox implications
Intracellular accumulation of glycerol, the major compatible solute in yeast, is
essential for cell survival when yeast are subjected to hyperosmotic stress under high
osmolarity conditions (Blomberg and Alder 1989; Blomberg 2000). In S. cerevisiae,
glycerol is synthesized from dihydroxyacetone phosphate (DHAP), a glycolytic
intermediate, in two enzymatic reactions. The first reaction, and also the rate-limiting step
in glycerol synthesis, requires the reduction of DHAP to glycerol-3-phosphate, along with
the oxidation of NADH to NAD+. This step is catalyzed by a NAD+-dependent glycerol-3-
phosphate dehydrogenase encoded by two isogenes, GPD1 and GPD2. In the second and
final reaction, glycerol-3-phosphate is dephosphorylated to glycerol via glycerol-3-
phosphatases, encoded by GPP1 and GPP2 (Påhlman et al. 2001).
The genes encoding for the isoforms of glycerol-3-phosphate dehydrogenase and
glycerol-3-phosphatase are differentially expressed under conditions of osmotic and
anaerobic stress, allowing yeast cells to adapt to altered growth conditions (Påhlman et al.
2001). In response to hyperosmotic stress, increased glycerol production has been shown
to be mainly due to enhanced GPD1 and GPP2 expression (Tamás and Hohmann 2003).
Of the isogenes, GPD1 has been demonstrated to be majorly responsible for glycerol
formation under high osmolarity conditions as its expression was up-regulated in response
to hyperosmotic stress (Larsson et al. 1993; Albertyn et al. 1994). In comparison, GPD2
has been determined to have no role in the osmoregulatory response (Eriksson et al. 1995),
as it is slightly repressed under hyperosmotic conditions, and to be up-regulated in the
absence of oxygen (Ansell et al. 1997). Under anaerobic conditions, expression of GPD2

9
is to maintain intracellular redox balance between reducing equivalents, NAD+ and NADH
(Påhlman et al. 2001).
Under different conditions of sugar-induced osmotic stress, the expression of these
genes has been measured. During fermentation in chaptalized Riesling grape juice (400 g
l-1 sugar), both GPD1 and GPP2 were shown to respond to sugar-induced osmotic stress,
although strain differences in the expression of GPD1 existed (Erasmus et al. 2003).
During fermentation in Icewine juice (400 g l-1 sugar), Pigeau and Inglis (2005) showed an
increase in the expression of only GPD1, which corresponded to an increase in glycerol
production by the wine yeast. Subsequent to this study, Pigeau and Inglis (2007)
determined the expression of GPD2 to be unaffected by changes in osmolarity as the gene
was not differentially expressed in high and low sugar conditions. Thus, only GPD1 was
found to have a role in osmotically-induced glycerol biosynthesis during Icewine
fermentation. In contrast to the GPD isoforms, both GPP1 and GPP2 are involved in the
osmoregulatory glycerol response (Påhlman et al. 2001). Although these genes are up-
regulated in response to osmotic shock, GPP2 expression is more strongly induced than
GPP1 under conditions of high osmolarity (Hirayarna et al. 1995; Norbeck et al. 1996).
However, when transferred to anaerobic conditions, GPP1 expression is transiently up-
regulated, while GPP2 expression remains unaffected (Påhlman et al. 2001).
Glycolysis with subsequent alcoholic fermentation represents a redox-neutral
metabolic sequence whereby the NADH generated during glycolysis is re-oxidized during
alcoholic fermentation, thereby allowing glycolysis to continue (Kukec et al. 2003). (Fig.
1.2). Glycerol biosynthesis, however, is not a redox-neutral process, so a potential
imbalance in the NAD+/ NADH coenzyme system is established as osmotically-stressed
10
wine yeast ferment sugar into alcohol. For osmotic adjustment to occur within cells,
glycerol production requires the oxidation of NADH to NAD+, as DHAP is reduced to
glycerol-3-phosphate, which results in the production of high NAD+ levels as NADH
consumption continues (van Dijken and Scheffers 1986).
Yeast cells lack the transhydrogenase activity to convert reducing equivalents
between coenzyme systems (van Dijken and Scheffers 1986) and depend on metabolite
formation to balance the NAD+ formed in glycerol biosynthesis. Production of many yeast
metabolites, including organic acids, esters, volatile fatty acids and higher alcohols, is
thought to impact or be impacted by the ratio of NAD+/ NADH, and therefore may
contribute to maintaining intracellular redox balance (van Dijken and Scheffers1986;
Schoondermark-Stolk et al. 2005; Jain et al. 2012). Of these metabolites, acetic acid
biosynthesis has been suggested as a mechanism that yeast can use to balance excess NAD+
produced in response to hyperosmotic stress and glycerol overproduction by regenerating
NADH (Blomberg and Alder 1989). The NADH consumed during DHAP reduction could
be provided by the NAD+-dependent oxidation of acetaldehyde to acetic acid by an
aldehyde dehydrogenase, which results in the concomitant reduction of NAD+ to NADH
(Pigeau and Inglis 2007). In addition to this redox sink, there is also a direct correlation
between the sugar concentration in juice and the amount of glycerol and acetic acid
produced by yeast (Erasmus et al. 2004; Pigeau et al. 2007).
1.1.5. Acetic acid formation and redox balance
Within the S. cerevisiae genome, there are five genes which encode aldehyde
dehydrogenases that are capable of catalyzing this reaction: ALD2, ALD3 and ALD6
correspond to the cytoplasmic isoforms, and ALD4 and ALD5 correspond to the
11
mitochondrial isoforms (Navarro-Avino et al. 1999). Of the cytoplasmic isoforms, ALD2
and ALD3 encode NAD+-dependent isoforms and ALD6 encodes a NADP+-dependent
isoform, while the coenzyme requirements for the mitochondrial isoforms are NAD+/
NADP+ for ALD4 and NADP+ for ALD5. Based on the coenzyme dependency of each
isoform, only ALD2, ALD3 and ALD4, all of which are specific to NAD+, may solve a
redox imbalance issue resulting from glycerol production, although only ALD2 and ALD3
encode for enzymes localized in the cytosol, the site of glycerol biosynthesis.
Yeast cells respond to increases in extracellular osmolarity by activating the HOG
pathway and increasing glycerol synthesis and NAD+ formation (Posas et al. 1998). If it is
correct that acetic acid is formed under conditions of osmotic stress as a mechanism to
maintain intracellular redox potential balance within the NAD+/ NADH coenzyme system,
then cytosolic Ald2p and/ or Ald3p are assumed to be the main enzymes responsible for its
biosynthesis as both are dependent on NAD+ for catalysis (Pigeau and Inglis 2005; 2007).
However, the NADP+-dependent Ald6p was determined to be the main aldehyde
dehydrogenase responsible for acetic acid production in laboratory S. cerevisiae strains
fermenting glucose media (Remize et al. 1999; Eglinton et al. 2002), while Ald5p has also
been found to contribute to acetate formation from acetaldehyde during glucose
fermentation, as determined through single and double deletion mutant experiments using
lab and wine yeast-derived strains of S. cerevisiae (Saint-Prix et al. 2004).
In this study, the deletion of ALD5 decreased acetic acid formation in both strains
examined, while the additional deletion of ALD5 slightly reduced acetate formation in the
ald4∆ mutant and delayed growth in the ald6∆ald4∆ mutant. Of the two isoforms, only
ALD6 was up-regulated under salt stress, and its induction required activation of the HOG

12
Figure 1.2: Osmo-induced glycerol formation in S. cerevisiae during Icewine fermentation and its
relationship to acetic acid production.
MAPK pathway (Akhtar et al. 1997; Rep et al. 2000). Furthermore, deletion of ALD6 in
synthetic medium simulating a standard grape juice containing 20% glucose resulted in a
decrease in acetic acid formation compared to the wild-type strain and a marked increase
in glycerol concentration, along with compounds such as 2,3-butanediol and succinate.
Although the major findings from these studies suggest a role for Ald6p in acetic acid
biosynthesis during fermentation, its involvement in resolving cytosolic redox imbalance
during osmo-induced glycerol biosynthesis remains unclear due to its NADP+-specificity.
Furthermore, the precise roles for the homologous ALD2 and ALD3 are also
unknown to date. Of the isoforms, ALD3, encoding a cytosolic NAD+-dependent isoform,
was found up-regulated under salt stress (Norbeck and Blomberg 2000). Within the strains
examined, all exhibited induced expression of ALD3, and at the transcript level, during
13
growth under osmotic stress, while the ALD2 transcript appeared to be unaffected by
osmotic stress. Based on these results, ALD3 was determined to be the osmoregulated form
of the two isogenes. However, Navarro-Avino et al. (1999) determined the expression of
both ALD2 and ALD3 to be induced by salt stress, and the regulation of these genes to be
mediated by a Hog1-independent pathway. Under normal growth conditions, no expression
of ALD2 and ALD3 was determined in wild-type and ald2∆ald3∆ mutant cells, while Ald2p
and Ald3p activity levels increased in wild-type cells exposed to salt-induced osmotic
stress, but remained unchanged in the double null mutant.
To differentiate the specific roles of these isoforms in this study, ALD2-lacZ and
ALD3-lacZ reporter fusions were used, and the expression of β-galactosidase driven by the
ALD2 and ALD3 promoters was induced by osmotic stress through various solutes,
including KCl, NaCl and sorbitol (Navarro-Avino et al. 1999). The basal and induced
expression levels in each condition were measured and compared between isogenes. In all
conditions, ALD2 exhibited lower expression levels compared with ALD3, suggesting a
potentially larger role for Ald3p in yeast adaptation to osmo-induced stress. In addition,
more recent evidence suggests that Ald2p and Ald3p may play a role in beta-alanine
synthesis and in the cellular biosynthesis of coenzyme A (White et al. 2003).
However, in conditions that stimulated glycerol and acetic acid production in S.
cerevisiae though LiCl stress, GPD1, ALD2 and ALD3 were increased in expression at the
mRNA and protein levels, whereas ALD6 was down-regulated (Bro et al. 2003). During
fermentation of sake, another high sugar matrix, ALD2 and ALD3 were the only ALD
isogenes determined to be up-regulated in an S. cerevisiae sake yeast strain, correlating
with an increase in acetate production (Akamatsu et al. 2000). Contrary to these findings,

14
ALD2, ALD3, ALD4 and ALD6 were all up-regulated in response to sugar-induced osmotic
stress 2 hours following exposure to the high osmolarity conditions (Erasmus et al. 2003;
Erasmus and van Vuuren 2009). The transcription of the ALD isogenes, along with 585
other genes in an industrial strain of S. cerevisiae, were affected more than two-fold in
chaptalized Riesling grape juice containing 40% (w/ v) sugars, including glycolytic and
pentose phosphate genes. However, only the initial response of yeast to the osmo-induced
sugar stress was monitored and it is not known whether the initial expression was transient
or sustained throughout the length of the fermentation, which typically lasts for an
additional 400-500 hours (Kontkanen et al. 2004; Pigeau and Inglis 2005).
Furthermore, yeast grown in the 40% (w/ v) sugar conditions expectantly produced
higher levels of acetic acid (4.5-fold increase) compared to yeast fermenting at the lower
sugar concentration containing 22% (w/ v) sugar (Erasmus et al. 2004). Of the isogenes
that were up-regulated, ALD6 was expressed at the highest level in both strains examined,
followed by ALD4 (Erasmus et al. 2009), which is a result consistent with the findings of
Remize et al. (2000). If transcript levels do correlate with enzyme activity levels, these
results suggest Ald6p to have a major role in acetic acid production during high sugar
ferments, although it uses NADP+ and not NAD+ as a coenzyme in acetic acid formation
(Wang et al. 1998). As a concluding remark, Erasmus and van Vuuren (2009) linked the
high levels of acetic acid generated under osmotic stress to NADPH production, possibly
as a way to compensate for the down-regulation of NADPH generated through the pentose
phosphate pathway (PPP) (Bro et al. 2003; Erasmus and van Vuuren 2009). Erasmus et al.
(2003) showed the transcription of several genes encoding enzymes in the oxidative and
non-oxidative parts of the PPP was affected when S. cerevisiae was hyperosmotically

15
stressed, which altered metabolic flux through the pathway. Under these conditions, a
potential shortage in NADPH could result, establishing the need to regenerate it through
acetic acid biosynthesis via an NADP+-dependent Aldp isoform such as Ald6p (Erasmus
and van Vuuren 2009).
In contrast to these results, ALD3 was the only ALD isogene increased in expression
during fermentation in Icewine juice over that found throughout table wine production,
which corresponded to an increase in acetaldehyde and acetic acid production (Pigeau and
Inglis 2005; 2007). The results indicated ALD3 displayed a 6.2-fold up-regulation on day
4 of fermentation compared to the table wine juice, which could account for the elevated
level of acetic acid found in Icewine. ALD3 was also found to be the only ALD further up-
regulated by acetaldehyde stress during fermentation (Pigeau et al. 2007), although the
enzyme activity levels have not yet been measured.
The findings of Erasmus et al. (2003; 2004) and Erasmus and van Vuuren (2009),
question the linkage of acetic acid production under hyperosmotic stress to glycerol
production and NADH requirements. Thus, important answers concerning the involvement
of each ALD isogene in acetic acid formation and cofactor balance remain unclear, and
additional research needs to be conducted to determine the metabolic role of acetic acid in
the yeast hyperosmotic stress response and to define the contribution of each Aldp isoform
to elevated acetic acid and intracellular redox balance during high sugar fermentations. A
fundamental topic that has not been addressed during high sugar fermentations pertains to
understanding the altered redox state of the cells during fermentation and specifically
questions the ratio of NAD+/ NADH versus NADP+/ NADPH in wine yeast before and after
exposure to hyperosmotic stress. Thus, it will be important in future research to assess the

16
redox balance of the coenzyme systems in cells under high versus low osmotic stress and
to determine their roles as metabolic triggers for acetic acid production.
1.2. Formation of other metabolites and the relationship to acetic acid and wine
quality
1.2.1. Formation of acetaldehyde
Acetaldehyde is an early metabolic by-product of fermentation produced from
pyruvate, the end product of glycolysis in S. cerevisiae (Romano et al. 2004).
Organoleptically, acetaldehyde is one of the most important sensory carbonyl compounds
formed during fermentation and has an important impact on wine quality. At low levels,
the compound contributes pleasant fruity aromas to wine, whereas at high levels it elicits
an aroma reminiscent of bruised apples (Liu and Pilone 2000). Once formed, acetaldehyde
can be secreted from the cell and remain in wine or be used intracellularly as a precursor
for the formation of other metabolites such as ethanol and acetic acid (Fig 1.2 and 1.3).
Functionally, acetaldehyde serves as the electron acceptor used for NADH re-oxidation
during fermentative growth and is reduced to ethanol by alcohol dehydrogenase (Voet and
Voet 2004), while acetic acid can form from the oxidation of acetaldehyde by aldehyde
dehydrogenase, with the concomitant reduction of NAD(P)+ to NAD(P)H.
1.2.2. Formation of acetylCoA
Via the pyruvate dehydrogenase (PDH) bypass, acetylCoA can form during
fermentation from acetic acid (reviewed in Pronk et al. 1996). In this pathway, pyruvate is
decarboxylated by pyvuvate decarboxylase (Pdcp) to acetaldehyde, which is then oxidized
to acetate via aldehyde dehydrogenase (Aldp). In the final reaction, acetylCoA synthetase
(Acsp) catalyzes the formation of acetylCoA from acetate and Coenzyme A (CoA). CoA

17
can also be regenerated from the activity of acetylCoA hydrolyase (Achp), which catalyzes
the hydrolysis of acetylCoA (Lee et al. 1996). Through this reaction sequence, the
availability of acetylCoA increases in the cytosol where it can be used in anabolic reactions
including lipid, sterol and amino acid biosynthesis (reviewed in Pronk et al. 1996), as well
as ester synthesis (Verstrepen et al. 2004). For ester biosynthesis to take place, the
carboxylic acid moiety needs to be activated with CoA prior to reaction, and energy is
required from the thioester linkage of acetylCoA (Verstrepen et al. 2004).
In S. cerevisiae, two genes (ACS1 and ACS2) have been identified for encoding for
proteins responsible for catalyzing the formation of acetylCoA from acetate via the PDH
bypass and are reported to differ with respect to their cellular localization, substrate
specificity and kinetic properties (Satyanarayana and Klein 1974). Of the enzymes, Acs1p
is the mitochondrial isoform required for respiratory growth on non-fermentable carbon
sources and is glucose repressed (Kratzer and Schüller 1995; Van den Berg et al. 1996),
while Acs2p is the cytosolic isoform required for growth on glucose under fermentation
conditions and is constituently expressed (Van den Berg and Steensma 1995).
Akamatsu et al. (2000) determined that genes encoding for acetylCoA synthetases
(ACS1/ 2) and acetylCoA hydrolyase (ACH1) were expressed by an S. cerevisiae sake yeast
strain fermenting sake mash, along with ALD2/3 encoding for cytosolic aldehyde
dehydrogenases. The transcription of these genes was limited to the early stage of normal
sake mash and was induced by high osmolarity under fermentative conditions in the
presence of high glucose, which corresponded to an increase in acetate production.
Akamatsu et al. (2000) also reported that overexpression of ACS2 resulted in low acetate
18
production during small-scale sake fermentations, while overexpression of ACS1 did not
significantly change acetate productivity.
The work of Akamatsu et al. (2000) suggests a possible connection between
aldehyde dehydrogenase and acetylCoA synthetase activity on acetic acid production by
yeast during fermentation. This connection was further investigated under Icewine
fermentation conditions to determine whether the expression of genes involved in acetic
acid synthesis and degradation may contribute to the overall levels produced by wine yeast
as they adapt to hyperosmotic stress. Martin (2008) showed through microarray and
Northern Blot analysis of acetylCoA synthetases that both ACS isoforms were strongly
down-regulated in Icewine juice fermenting yeast cells in comparison to yeast fermenting
table wine juice. Since ACS1 is glucose repressed and present during respiratory growth, it
unlikely contributes to acetylCoA formation during fermentation (Pigeau and Inglis 2007).
In contrast, the expression level of ACS2 greatly influences acetylCoA biosynthesis and
acetic acid degradation. Low expression of ACS2 reduces the need for acetate as a substrate
for acetylCoA synthetase, thereby reducing the formation of acetylCoA from acetate. Thus,
it is possible that the high levels of acetic acid formed during Icewine fermentation could
be the consequence of a decrease in acetylCoA formation due to low ACS2 expression
(Martin 2008).
Furthermore, since acetylCoA is a substrate for alcohol acetyltransferases,
acetylCoA levels formed during Icewine fermentation may affect the amount of ethyl
acetate produced in Icewine or other high sugar fermentations (Fig. 1.3). Lower acetylCoA
levels would reduce the amount of substrate available to acetyltransferases for catalysis,
thereby reducing the amount of ethyl acetate formed during fermentation. Heit (2011) and
19
Heit and Inglis (2012) determined no positive correlation between ethyl acetate production
and increased osmotic stress to exist during Icewine fermentation as higher levels of ethyl
acetate were produced by wine yeast fermenting table wine juice compared to Icewine
juice. Down-regulation of ACS genes not only agree with the lower ethyl acetate levels
formed during Icewine fermentation, but also with the down-regulation of fatty acid
synthesis genes and reduced yeast cell growth in this matrix (Martin 2008).
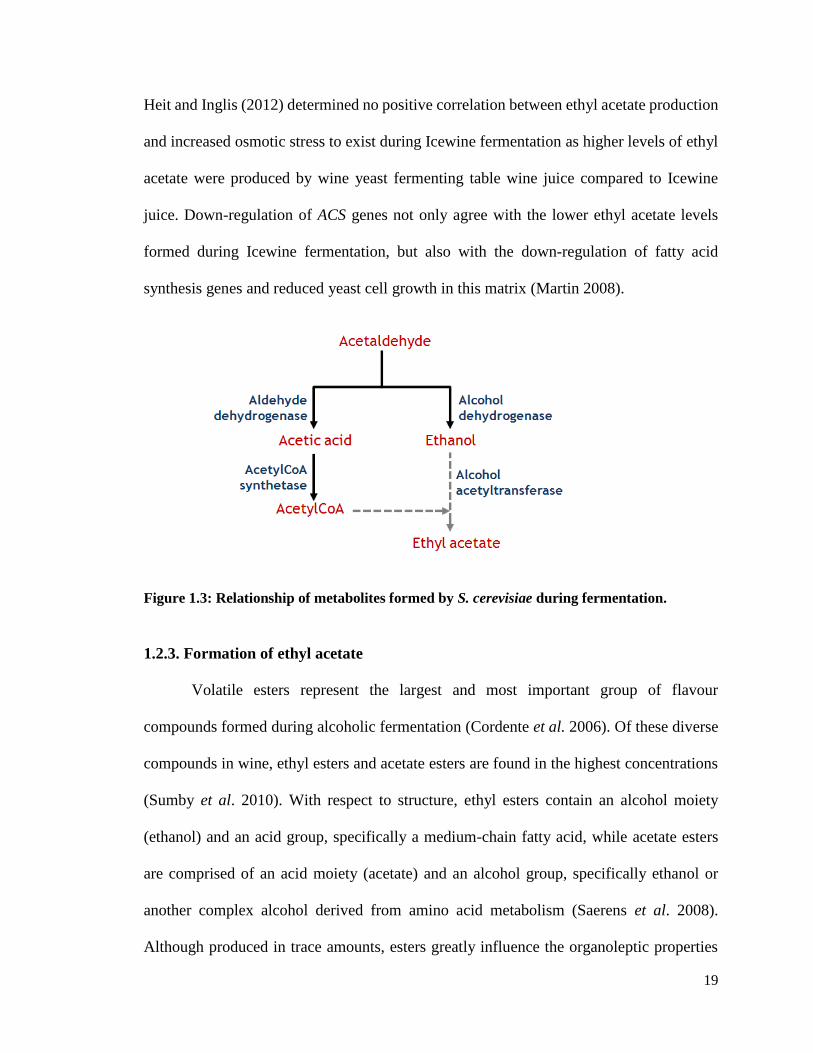
Figure 1.3: Relationship of metabolites formed by S. cerevisiae during fermentation.
1.2.3. Formation of ethyl acetate
Volatile esters represent the largest and most important group of flavour
compounds formed during alcoholic fermentation (Cordente et al. 2006). Of these diverse
compounds in wine, ethyl esters and acetate esters are found in the highest concentrations
(Sumby et al. 2010). With respect to structure, ethyl esters contain an alcohol moiety
(ethanol) and an acid group, specifically a medium-chain fatty acid, while acetate esters
are comprised of an acid moiety (acetate) and an alcohol group, specifically ethanol or
another complex alcohol derived from amino acid metabolism (Saerens et al. 2008).
Although produced in trace amounts, esters greatly influence the organoleptic properties
20
of wine, affecting both composition and quality. Volatile esters are responsible for the
fruity and candy-like characteristics of wine, and include notable compounds such as ethyl
acetate (nail polish, solvent-like aroma), phenyl ethyl acetate (flowery, rose aroma) and
isoamyl acetate (banana aroma), all of which are acetate esters, and ethyl caprylate (sour
apple aroma), a (C6) short chain fatty acid ethyl ester (Dufour et al. 2002; Lambrechts and
Pretorius 2000).
Plata et al. (2003) indicates acetate esters to be formed biochemically through an
enzyme-catalyzed condensation reaction between an activated acylCoA component and a
higher alcohol, and chemically through an esterification reaction between a carboxylic acid
and an alcohol. However, the reaction rate of its chemical synthesis has been suggested to
be too slow to account for the ester concentrations measured in alcoholic beverages (Mason
and Dufour 2000), thereby attributing the majority of these compounds formed to the
biochemical activity of the yeast cells. During fermentation, the enzymatic synthesis of
esters is known to result primarily from alcohol acyltransferases, although esterases may
also contribute, albeit to a much lesser extent (Lilly et al. 2000; Mason and Dufour 2000;
Verstrepen et al. 2003).
Ester formation is primarily influenced by two factors: the concentration of the co-
substrates and the activity level(s) of the ester synthetase(s) involved in catalysis. For ethyl
acetate specifically, its formation is determined by the availability of acetylCoA and
ethanol in the fermenting medium (Plata et al. 2003; Mason and Dufour 2000), and the
activity levels of alcohol acyltransfereases (Verstrepen et al. 2003). At low levels, less
acetylCoA and/ or ethanol is available to bind to the catalytic site of an alcohol
acyltransferase, thereby limiting the amount of product that can be formed. Yeast growth
21
and cell requirements for lipid and sterol biosynthesis also influence acetylCoA levels, and
therefore substrate availability and overall ester formation. Once fermentation commences,
ester synthesis is initially slow due to the intracellular demand for acetylCoA to support
yeast growth and metabolism (Thurston et al. 1992). As a consequence, little acetylCoA is
diverted away from lipid and sterol biosynthesis and towards other metabolic processes,
such as ester synthesis, at this time, resulting in low ethyl acetate levels. However, when
lipid and sterol biosynthesis decreases, the large increase in cellular acetylCoA levels and
acyltransferase activities leads to an increase in ester biosynthesis in yeast.
Alcohol acetyltransferases are the most well-known enzymes involved in ester
synthesis and function in catalyzing the transfer of CoA-bound acetyls to an alcohol
molecule (Nordstrom 1962; 1963; 1964; Malcorps and Dufour 1992; Yoshimoto et al.
1998). To date, three alcohol acetyltransferases capable of catalyzing this reaction have
been identified in yeast and include Atf1p (encoded by ATF1), its closely related
homologue Lg-Atf1p (encoded by Lg-ATF1) and Atf2p (encoded by ATF2) (Yoshioka and
Hashimoto 1984; Yoshimoto et al. 1998; 1999). Atf1p and Atf2p have been reported to be
present in S. cerevisiae and the lager yeast S. pastorianus, while Lg-Atf1p is found only in
S. pastorianus (Malcorps and Dufour 1992; Saerens et al. 2006). Of these enzymes, Atf1p
has been researched in the greatest detail and has been shown to be majorly involved in
ethyl acetate and isoamyl acetate production (Lilly et al. 2000).
Verstrepen et al. (2003) investigated and compared the roles of the known S.
cerevisiae alcohol acetyltransferases in volatile ester production by deleting or
overexpressing ATF1, Lg-ATF1 and ATF2 in a laboratory strain and a commercial brewing
strain. The resulting expression levels of ATF1 and ATF2 were determined to affect the

22
formation of both ethyl acetate and isoamyl acetate during fermentation. Overexpression
of ATF1 resulted in a 30-fold increase in ethyl acetate production and a 180-fold increase
in isoamyl acetate production compared to wild-type cells. For most other esters analyzed,
ATF1 deletion resulted in a 60 to 90% reduction compared to wild-type levels. On the other
hand, overexpression and deletion of ATF2 produced more modest increases and decreases
in ester concentration, respectively, whereas the contribution of Lg-ATF1 was determined
to be very limited, indicating the respective gene products to have only minor roles in ester
formation compared to that of Atf1p.
Although the physiological roles of esters in yeast metabolism have yet to be
completely elucidated, current literature suggests a variety of functions for this family of
compounds. Verstrepen et al. (2003) indicates ester synthesis may be used as a mechanism
to recycle free CoA under conditions in which normal regeneration of acetylCoA is
prevented, while Bardi et al. (1998) suggests its formation to be related to an intracellular
necessity for CoA from acylCoAs. Ester formation may also be used as a detoxification
strategy against high levels of medium-chain fatty acids, acetic acid and ethanol (Bardi et
al. 1998), all of which can negatively affect the metabolic activity and longevity of the
fermenting yeast cells (Casal et al. 1996).
Despite the important roles esters may play in yeast, the formation of ethyl acetate
during alcoholic fermentation can have a negative impact on wine composition and overall
wine quality when produced in sufficient concentrations or above the sensory detection
threshold (Heit and Inglis 2013). Along with other minor volatile acids, ethyl acetate and
its precursor, acetic acid, make up volatile acidity. In Canada, Vintners Quality Alliance
(VQA) regulates VA levels in all wine styles and defines the permissible concentration to
23
be 2.1 g l-1 in Icewine and 1.3 g l-1 acetic acid in table wine (VQA 2013). Although these
maximal levels are rarely surpassed following chemical analyses, these compounds do
contribute to wine aroma when their concentrations are present above the respective
sensory threshold levels. Nurgel et al. (2004) reports the levels of acetic acid and ethyl
acetate in Canadian Icewine to range from 0.49 to 2.29 g l-1 and 0.086 to 0.369 g l-1,
respectively. Although produced in higher concentration than ethyl acetate, the level of
acetic acid in Icewine is lower than its sensory threshold, which was determined to be 3.185
g l-1 (Cliff and Pickering 2006). In contrast, the threshold level of ethyl acetate (0.198 g l-
1) falls within the range produced in Canadian Icewines currently on the market, enabling
its perception in Icewine to be easier than acetic acid.
Since the concentration of ethyl acetate formed during Icewine fermentation is
close to its sensory threshold level, minor concentration changes can majorly impact the
sensory profile of a wine, potentially implicating its overall quality. Since a wine must also
undergo sensory analysis prior to receiving the VQA designation, ethyl acetate formation
is a ubiquitous concern within the wine industry for producers requiring their wines
sufficiently meet the quality standards stipulated by VQA. As a consequence of these
concerns, it is important that the production of ethyl acetate be controlled during
fermentation in order to mitigate its negative effect on wine composition and quality due
to its association with spoilage. Such control will require a better understanding of its
biochemical formation during high and low sugar fermentations, focusing on both the
availability of substrates and the activity levels of enzymes directly and indirectly involved
in ethyl acetate synthesis in fermenting wine yeast cells.
24
1.3. Introduction to wine yeast: Saccharomyces cerevisiae and Saccharomyces bayanus
Although the development of certain management strategies for controlling VA
production will rely on understanding the mechanisms for both acetic acid and ethyl acetate
formation during fermentation, an alternative method for controlling high VA levels has
been evaluated in the interim. Recent studies have focused on assessing the different acetic
acid and ethyl acetate production capacities of specific wine yeast strains (Heit 2011; Heit
and Inglis 2012; 2013; Yang 2010), and comparing their abilities to affect the chemical
composition and aroma profile of the resulting wine (Eglinton et al. 2000; Antonelli et al.
1999). Of these yeasts, the majority of commercial strains belong to Saccharomyces
cerevisiae and are widely used in the fermentation industry for wine, beer and sake
production. Despite S. cerevisiae being primarily responsible for alcoholic fermentation
(Pretorius 2000), other species of the genus Saccharomyces have been isolated from wine
(Naumov et al. 2000; Masneuf-Pomarede et al. 2010; Gonzalez et al. 2006) and beer
fermentations (Nguyen and Gaillardin 2005), as well as cider production (Naumov et al.
2001), which has generated substantial interest amongst producers for their potential use
in commercial fermentations.
Unlike natural Saccharomyces strains, industrial strains have been domesticated
through human activity, resulting in the development of an array of individual strains that
have been selected for phenotypically desired traits (Borneman et al. 2011). Such
characteristics include their fermentation properties, physiological adaptation to different
environments and stress conditions, and ability to efficiently ferment glucose into ethanol
and carbon dioxide without adversely affecting sensory quality through the production of
unwanted flavour compounds (Pretorius 2000). As expected from these diverse
25
characteristics, genetic differences between species and strains of Saccharomyces, both
industrial and natural, inevitably result in altered metabolism and stress responses to
perturbed environmental conditions, including high osmotic pressure, hypoxia, high
concentrations of sugar and ethanol and low nitrogen levels (Marks et al. 2008). Due to
such trait variation among strains, yeasts produce phenotypically distinct outcomes from
each other as they behave differently during the fermentation course, varying not only in
their fermentation performances, but also in their production of certain metabolic by-
products and overall contribution to wine flavour and aroma.
Of the non-Saccharomyces cerevisiae yeast strains, S. bayanus is a species involved
in beer fermentation that has recently gained interest for use in sweet wine production due
to its cryotolerance property and ability to produce flavour and aroma compounds distinct
from industrial strains of S. cerevisiae. Previous studies have determined differences exist
in the chemical composition of wines fermented by either S. bayanus or S. cerevisiae
strains (Castellari et al. 1992; 1994; Kishimoto 1994; Massoutier et al. 1998; Antonelli et
al. 1999), where wines made with S. bayanus generally contained higher concentrations of
glycerol and succinic acid, and lower levels of acetic acid and ethanol. Malic acid levels in
wines fermented by cryotolerant versus non-cryotolerant strains of S. cerevisiae, S. uvarum
and S. bayanus were also observed to differ as the cryotolerant strains were found to
degrade rather than synthesize this compound, resulting in lower levels in the final wine
(Castellari et al. 1992). As a consequence of such traits, the fermentative capabilities of
cryotolerant strains, and more specifically of S. bayanus, can result in wines with not only
a distinct chemical composition, but also more unique organoleptic properties than those
produced from ordinary non-cryotolerant and S. cerevisiae strains (Castellari et al. 1992).

26
To assess the suitability of two selected S. bayanus strains (AWRI 1176 and AWRI
1375) for winemaking, Eglinton et al. (2000) investigated their chemical and sensory
impact on wine. Detailed chemical analysis of wine composition combined with sensory
descriptive analysis elucidated differences between the S. cerevisiae (AWRI 838) and two
S. bayanus isolates investigated following fermentation in Chardonnay table wine juice.
When compared to S. cerevisiae, wine fermented by S. bayanus contained higher levels of
glycerol, succinic acid and acetaldehyde, and lower levels of malic acid, acetic acid,
ethanol and ethyl acetate. The work presented from this study also determined the aroma
profiles of the resulting S. bayanus wines to be distinctly different from those fermented
by S. cerevisiae. S. bayanus strains were associated with aroma attributes such as ‘cooked
orange peel’, ‘yeasty’, ‘honey’, ‘nutty’ and ‘aldehyde’, whereas the S. cerevisiae isolate
was associated with ‘estery’, ‘pineapple’, ‘peach’ and ‘citrus’ aromas.
Furthermore, Anotonelli et al. (1999) investigated the abilities of different yeast
strains to form volatile compounds during the fermentation of Trebbiano table wine must.
In total, nine strains of S. cerevisiae and four strains of S. bayanus were evaluated in the
study and generated results similar to that of Eglinton et al. (2000) as the strains were
significantly different in their production of certain compounds. The results of the chemical
analyses indicated strains of S. bayanus produced higher levels of malic acid, glycerol and
volatile compounds, mainly in the form of phenylethanol and ethyl lactate, compared to S.
cerevisiae, which formed higher levels of acetic acid and SO2, and lower levels of succinic
acid. In addition, all S. bayanus strains produced low quantities of acetic acid while some
S. cerevisiae strains reached the highest quantities. Due to the low acetic acid levels
formed, along with other undesirable compounds such as sulfur anhydride, S. bayanus was

27
considered to be of applicative interest to the wine industry. Eglinton et al. (2000)
acknowledges the importance of strain differences in winemaking, indicating that the
different chemical composition and sensory profile of S. bayanus-fermented wine could be
used to produce wines distinct from those of S. cerevisiae.
Since acetic acid and ethyl acetate are two concerning compounds in Icewine, the
ability of S. bayanus to form low levels of acetic acid, the precursor to ethyl acetate, would
be of benefit to the wine industry as it may provide a way to control or reduce their levels
in wine. Heit (2011) and Heit and Inglis (2013) assessed the ability of a natural isolate of
S. bayanus to ferment Icewine as compared to the commercial yeast S. cerevisiae K1-
V1116, and evaluated differences in acetic acid and ethyl acetate production between the
strains. Although the yeasts differed in the amount of sugar consumed during the
fermentation course, S. bayanus produced significantly less acetic acid per gram of sugar
metabolized than K1-V1116, with no significant difference in glycerol production (Heit
and Inglis 2013). This finding is consistent with past studies demonstrating that acetic acid
production is strain dependent (Patel and Shibamoto 2002; Torrens et al. 2008; Erasmus et
al. 2004). Furthermore, S. bayanus demonstrated trends consistent with lower ethyl acetate
production compared to S. cerevisiae. Although S. bayanus exhibited fermentation
difficulties in the high sugar condition, as demonstrated by its slower sugar consumption
and fermentation time, and lower cell concentration, its ability to generate low levels of
acetic acid and ethyl acetate during the fermentation course and in the final wines shows
potential for its use in less osmotically stressful environments such as that resulting from
the concentrated sugars in semi-dried grapes used to produce appassimento-style wine.

28
1.4. Literature Cited
Albertyn, J., S. Hohmann, J.M. Thevelein and B.A. Prior. 1994. GPD1, which encodes
glycerol-3-phosphate dehydrogenase is essential for growth in Saccharomyces cerevisiae
and its expression is regulated by the high-osmolarity glycerol response pathway. Mole
Cell Biol. 14:4135-4144.
Akamatsu, S., K. Kamiya, N. Yamashita, T. Motoyoshi, N. Goto-Yamamoto, T. Ishikawa,
N. Okazaki and A. Nishimura. 2000. Effect of aldehyde dehydrogenase and acetyl-CoA
synthetases on acetate formation in sake mash. J Biosci Bioeng. 90:555-560.
Akhtar, N., A. Blomberg and L. Alder. 1997. Osmoregulation and protein expression in a
pbs2J1 mutant of Saccharomyces cerevisiae during adaptation to hypersaline stress. FEBS
Lett. 403:173-180.
Ansell, R., K. Granath, J.M. Thevelein and L. Adler. 1997. The two isozymes for yeast
NAD+-dependent glycerol-3-phosphate dehydrogenase encoded by GPD1 and GPD2 have
distinct roles in osmoadaptation and redox regulation. EMBO J. 16:2333-2340.
Antonelli, A., L. Castellari, C. Zambonelli and A. Carnacini. 1999. Yeast influence on
volatile composition of wine. J Agric Food Chem. 47:1139-1144.
Bardi, L., C. Crivelli and M. Marzona. 1998. Esterase activity and release of ethyl esters
of medium chain fatty acids by Saccharomyces cerevisiae during anaerobic growth. J
Microbial. 44:1171-1176.
Billi, D. and M. Potts. 2002. Life and death of dried prokaryotes. Res Microbiol. 153:7-12.
Blomberg, A. 2000. Metabolic surprises in Saccharomyces cerevisiae during adaptation to
saline conditions: questions, some answers, and a model. FEMS Microbiol Lett. 182:1-8.
Blomberg, A. and L. Alder. 1992. Physiology of osmotolerance in fungi. Adv Microb
Physiol. 33:145-212.
Blomberg, A. and L. Alder. 1989. Roles of glycerol and glycerol-3-phosphate
dehydrogenase (NAD+) in acquired osmotolerance of Saccharomyces cerevisiae. J
Bacteriol. 171:1087-1092.
Boisnard, S., G. Ruprich-Robert, M. Florent, B. Da Silva, F. Chapeland-Leclerc and N.
Papon. 2008. Insight into the role of HOG pathway components Ssk2p, Pbs2p, and Hog1p
in the opportunistic yeast Candida lusitaniae. Eukaryotic Cell. 7:2179-2183.
Borneman, A., B.A. Desany, D. Riches, J.P. Affourtit, A.H. Forgan, I.S. Pretorius, M.
Egholm and P.J. Chambers. 2011. Whole genome comparison reveals novel genetic

29
elements that characterize the genome of industrial strains of Saccharomyces cerevisiae.
Plos Genetics. 7:1-10.
Brewster, J.L., T. de Valoir, N.D. Dwyer, E. Winter and M.C. Gustin. 1993. An
osmosensing signal transduction pathway in yeast. Science. 259:1760-1763.
Bro, C., B. Regenberg, G. Lagniel, J. Labarre, M. Montero-Lomeli and J. Nielsen. 2003.
Transcriptional, proteonomic, and metabolic responses to lithium in galactose-grown yeast
cells. J Biol Chem. 278:31141-32149.
Casal, M., H. Cardosa and C. Leão. 1996. Mechanisms regulating the transport of acetic
acid in Saccharomyces cerevisiae. Microbiol. 142:1385-1390.
Castellari, L., G. Pacchioli, C. Zambonelli, V. Tini and L. Grazia. 1992. Isolation and initial
characterization of cryotolerant Saccharomyces strains. Ital J Food Sci. 4:179-186.
Castellari, L., M. Ferruzzi, A. Magrini, P. Giudici, P. Passarelli and C. Zambonelli. 1994.
Unbalanced wine fermentation by cryotolerant vs. non-cryotolerant Saccharomyces
strains. Vitis 33:49-52.
Cheetham, J., D.A. Smith, A. Silva Dantas, K.S. Doris, M.J. Patterson, C.R. Bruce and J.
Quinn. 2007. A single MAPKKK regulates the Hog1 MAPK pathway in the pathogenic
fungus Candida albicans. Mol Biol Cell. 18:4603-4614.
Chen, R.E. and J. Thorner. 2007. Function and regulation in MAPK signaling pathways:
Lessons learned from the yeast Saccharomyces cerevisiae. Biochim Biophys Acta.
1773:1311-1340.
Cliff, M.A. and G.J. Pickering. 2006. Determination of odor detection thresholds for acetic
acid and ethyl acetate in ice wine. Aust J Wine Res. 17:45-52
Cordente, A., J.H. Sweigers, F.G. Hergardt and I.S. Pretorius. 2006. Modulating aroma
compounds during wine fermentation by manipulating carnitine acetyltransferases in
Saccharomyces cerevisiae. FEMS Microbial Lett. 267:159-166.
Cuevas, B.D., A.N. Abell and G.L. Johnson. 2007. Role of mitogen-activated protein
kinase kinase kinases in signal integration. Oncogene. 26:3159-3171.
Dufour, J.P., K.J. Verstrepen and G. Derdelinckx. Brewing yeasts. 2002. In Yeasts in food,
T. Boekhour, V. Robert (eds). Behr’s Verlag: Hamburg; 347-388.
Eglinton, J.M., A.J. Heinrich, A.P. Pollmitz, P. Langridge, P.A. Henschke and M. De
Barros Lopes. 2002. Decreasing acetic acid accumulation by a glycerol overproducing
30
strain of Saccharomyces cerevisiae by deleting the ALD6 aldehyde dehydrogenase gene.
Yeast. 19:295-301.
Eglinton, J.M., S.J. McWilliams, M.W. Fogarty, I.L. Francis, M.J. Kwiatkowski, P.B. Høj
and P.A. Henschke. 2000. The effect of Saccharomyces bayanus-mediated fermentation
on the chemical composition and aroma profile of Chardonnay wine. Aust J Wine Res.
6:190-196.
Erasmus, D.J., G.K. van der Merwe and H.J. van Vuuren. 2003. Genome-wide expression
analyses: metabolic adaptation of Saccharomyces cerevisiae to high sugar stress. FEMS.
34:375-399.
Erasmus, D.J. and H.J.J. van Vuuren. 2009. Genetic basis for osmosensitivity and genetic
instability of the wine yeast Saccharomyces cerevisiae V1N7. Am J Enol Vitic. 60:145-
154.
Erasmus, D.J., M. Cliff and H.J.J. van Vuuren. 2004. Impact of yeast strain on the
production of acetic acid, glycerol, and the sensory attributes of Icewine. Am J Enol Vitic.
55:371-378.
Eriksson, P., L. Andre, R. Ansell, A. Blomberg and L. Adler. 1995. Cloning and
characterization of GPD2, a second gene encoding sn-glycerol 3-phosphate dehydrogenase
(NAD+) in Saccharomyces cerevisiae, and its comparison with GPD1. Mol Microbiol.
17:95-107.
Ferrigno, P., F. Posas, D. Koepp, H. Saito and P.A. Silver. 1998. Regulated nucleo/
cytoplasmic exchange of HOG1 MAPK requires the importin b homologs NMD5 and
XPO1. EMBO J. 17:5606-5614.
Furukawa, K. and S. Hohmann. 2013. Synthetic biology: lessons from engineering yeast
MAPK signalling pathways. Mol Microbiol. 88:5-19.
Gonzalez S., E. Barrio, J. Gafner and A. Querol. 2006. Natural hybrids from
Saccharomyces cerevisiae, Saccharomyces bayanus and Saccharomyces kudriavzevii in
wine fermentations. FEMS Yeast Res. 6:1221-1234.
Heit, C. and D. Inglis. 2013. Acetic acid and ethyl acetate production during high brix
fermentations: effect of yeast strain. Am J Enol Vitic. 64:4.
Heit, C. and D. Inglis. 2012. An investigation of the relationship between ethyl acetate
production and osmotic stress in Saccharomyces cerevisiae K1-V1116 during high brix
fermentations. Am J Enol Vitic. 63:4.

31
Heit, C. 2011. Effect of yeast strain and sugar concentration on ethyl acetate production in
Icewine juice. BSc Hons Thesis. Brock University, ON.
Hirayama, T., T. Maeda, H. Saito and K. Shinozaki. 1995. Cloning and characterization of
seven cDNAs for hyperosmolarity-responsive (HOR) genes of Saccharomyces cerevisiae.
Mol Gen Genet. 249:127-138.
Hohmann, S. 2002. Osmotic stress signaling and osmoadaptation in yeasts. Microbiol Mol
Biol Rev. 66:300-371.
Hohmann, S. 2009. Control of high osmolarity signaling in the yeast Saccharomyces
cerevisiae. FEBS Lett. 583:4025-4029.
Jain, V.K., B. Divol, B.A. Prior and F.F. Bauer. 2012. Effect of alternative NAD+-
regenerating pathways on the formation and primary and secondary aroma compounds in
Saccharomyces cerevisiae glycerol-defective mutant. Appl Microbiol Biotechnol. 93:131-
141.
Jansen, G., F. Buhring, C.P. Hollenberg and M. Ramezani Rad. 2001. Mutations in the
SAM domain of STE50 differentially influence the MAP kinase-mediated pathways for
mating, filamentous growth and osmotolerance in Saccharomyces cerevisiae. Mol Genet
Genom. 265: 102-117.
Kishimoto, M. 1994. Fermentation characteristics of hybrids between the cryophilic wine
yeast Saccharomyces bayanus and the mesophilic wine yeast Saccharomyces cerevisiae. J
Ferment Bioeng. 77:432-435.
Kontkanen, D., D. Inglis, G. Pickering and A. Reynolds. 2004. Effect of yeast inoculation
rate, acclimatization, and nutrient addition on Icewine fermentation. Am J Enol Vitic.
55:363-370.
Kratzer, S. and H. J. Schüller. 1995. Carbon source-dependent regulation of the acetyl
coenzyme A synthetases-encoding gene ACS1 from Saccharomyces cerevisiae. Gene.
161:75-79.
Kukec, A., M. Berovic, M. Wondra, S. Celan and T. Kosmerl. 2003. Influence of
temperature shock on the glycerol production in cv. Sauvignon blanc fermentation. Vitis.
42:205-206.
Lambrechts, M.G. and I.S. Pretorius. 2000. Yeast and its importance to wine aroma: a
review. S Aft J Enol Vitic. 21:97-129.

32
Larsson, C., I.L. Påhlman, R. Ansell, M. Rigoulet, L. Adler and L. Gustafsson. 1998. The
importance of the glycerol-3-phosphate shuttle during aerobic growth of S. cerevisiae.
Yeast. 14:347-357.
Lee, F., L. Lin and J.A. Smith. 1996. Acetyl-CoA hydrolase involved in acetate utilization
in Saccharomyces cerevisiae. Biochim Biophys Acta. 1297:99-104.
Lilly, M., M.G. Lambrechts and I.S. Pretorius. 2000. Effect of increased acetyltransferase
activity on flavour profiles of wine and distillates. Appl Environ. Microbiol. 66:744-753.
Liu, S.Q. and G.J. Pilone. 2000. An overview of formation and roles of acetaldehyde in
winemaking with emphasis on microbiological implications. Int J Food Sci Technol.
35:49-61.
Logothetis, S., G. Walker and E.T. Nerantzis. 2007. Effect of salt hyperosmotic stress on
yeast cell viability. Proc Natl Sci. 113:171-184.
Maeda, T., M. Takekawa and H. Saito. 1995. Activation of yeast PBS2 MAPKK by
MAPKKKs or by binding of an SH3-containing osmosensor. Science. 269:554-558.
Maeda, T., S.M. Wurgler-Murphy and H. Saito. 1994. A two-component system that
regulates osmosensing MAP kinase cascade in yeast. Nature. 369:242-245.
Malcorps, P. and J.P. Dufour. 1992. Short-chain and medium chain aliphatic ester synthesis
in Saccharomyces cerevisiae. Eur J Biochem. 210:1015-1022.
Marks, V.D., S.J. Ho Suiz, D. Erasmus, G.K. van der Merwe, J. Brumm, W.W. Wasserman,
J. Bryan and H.J.J. van Vuuren. 2008. Dynamics of the yeast transcriptome during wine
fermentation reveals a novel fermentation stress response. FEMS Yeast Res. 8:35-52.
Martin, D.D., R.A. Ciulla and M.F. Roberts. 1999. Osmoadaptation in archaea. Appl
Environ Microbial. 65:1815-1825.
Martin, S.J. 2008. The osmoadaptive response of the wine yeast S. cerevisiae K1-V1116
during Icewine fermentation. PhD Thesis. Brock University, ON.
Masneuf-Pomarede, I., M. Bely, P. Marullo, A. Lonvaud-Funel and D. Dubourdieu. 2010.
Reassessment of phenotypic traits for Saccharomyces bayanus var. uvarum wine yeast
strains. Int J Food Microbiol. 139:79-86.
Mason, A.B. and J.P. Dufour. 2000. Alcohol acetyltransferases and the significance of ester
synthesis in yeast. Yeast. 16:1287-1298.
33
Massoutier, C., H. Alexandre, M. Feuillat and C. Charpentier. 1998. Isolation and
characterization of cryotolerant Saccharomyces strains. Vitis. 37:55-59.
Mettetal, J.T., D. Muzzey, C. Gómez-Uribe and A. van Oudenaardem. 2008. The frequency
dependence of osmo-adaptation in Saccharomyces cerevisiae. Science. 319:482-484.
Miermont, A., J. Uhlendorf, M. McClean and P. Hersen. 2011. The dynamical systems
properties of the HOG signaling cascade. J Signal Transduct. 2011:1-12.
Mollapour, M. and P.W. Piper. 2006. Hog1p mitogen-activated protein kinase determines
acetic acid resistance in Saccharomyces cerevisiae. FEMS Yeast Res. 6:1274-1280.
Nadal, E., P.M. Alepuz and F. Posas. 2002. Dealing with osmostress through MAP kinase
activation. Euro Mol Biol Org. 3:735-740.
Naumov, G., I. Masneuf, E.S. Naumova, M. Aigle and D. Dubourdieu. 2000. Association
of Saccharomyces bayanus var. uvarum with some French wines: genetic analysis of
yeast populations. Res Microbiol. 151: 683-691.
Naumov, G.I., H.V. Nguyen, E.S. Naumova, A. Michel, M. Aigle and C. Gaillardin.
2001. Genetic identification of Saccharomyces bayanus var. uvarum, a cider-fermenting
yeast. Int J Food Microbiol. 65:163-171.
Nguyen, H.V. and C. Gaillardin. 2005. Evolutionary relationships between the former
species Saccharomyces uvarum and the hybrids Saccharomyces bayanus and
Saccharomyces pastorianus; reinstatement of Saccharomyces uvarum (Beijerinck) as a
distinct species. FEMS Yeast Res. 5:471-483.
Navarro-Avino, J.P., R. Prasad, V.J. Miralles, R.M. Benito and R. Serreno. 1999. A
proposal of nomenclature of aldehyde dehydrogenases in Saccharomyces cerevisiae and
characterization of the stress-inducible ALD2 and ALD3 genes. Yeast. 15:829-842.
Neviogt, E. and U. Stahl. 1997. Osmoregulation and glycerol metabolism in the yeast
Saccharomyces cerevisiae. FEMS Microbiol Rev. 213:231-271.
Norbeck, J. and A. Blomberg. 2000. The level of cAMP-dependent protein kinase A
activity strongly affects osmotolerance and osmo-instigated gene expression in S.
cerevisiae. Yeast. 16:121-137.
Norbeck, J., A. Påhlman, N. Akhtar, A. Blomberg and L. Adler. 1996. Purification and
characterization of two isoenzymes of DL-glycerol-3-phosphatase from Saccharomyces
cerevisiae. J Biol Chem. 271:13875-13881.

34
Nordström, K. 1964. Formation of esters from alcohols by brewer’s yeast. J Inst Brew.
70:328-336.
Nordström, K. 1962. Formation of ethyl acetate in fermentation with brewer’s yeast III:
participation of coenzyme A. J Inst Brew. 68:398-407.
Nordström, K. 1963. Formation of ethyl acetate in fermentation with brewer’s yeast IV:
metabolism of acetyl coenzyme A. J Inst Brew. 69:142-153.
Nurgel, C., G.J. Pickering and D.L. Inglis. 2004. Sensory and chemical characteristics of
Canadian ice wines. J Sci Food Agric. 84:1675-1684.
O’Rourke, S.M. and I. Herskowitz. 2004. Unique and redundant roles for HOG MAPK
pathway components as revealed by whole-genome expression analysis. Mol Biol Cell.
15:532-542.
O’Rourke, S.M., I. Herskowitz and E.K. O’Shea. 2002. Yeast go the whole HOG for the
hyperosmotic stress response. Trends Genet. 18:405-412.
Ostrander, D.B. and J.A. Gorman. 1999. The extracellular domain of the Saccharomyces
cerevisiae Sln1p membrane osmolarity sensor is necessary for kinase activity. J Bacteriol.
181:2527-2534.
Påhlman, A.K., K. Granath, R. Ansell, S. Hohmann and L. Alder. 2001. The yeast glycerol
3-phosphatases Gpp1p and Gpp2p are required for glycerol biosynthesis and differentially
involved in the cellular responses to osmotic, anaerobic, and oxidative stress. Biol Chem.
276:3555-3563.
Parmar, J.H., S. Bhartiya and K.V. Venkatesh. 2011. Characterization of the adaptive
response and growth upon hyperosmotic shock in Saccharomyces cerevisiae. Mole
BioSyst. 7:1138-1148.
Patel, S. and S. Shibamoto. 2002. Effect of different strains of Saccharomyces cerevisiae
on production of volatiles in Napa Gamay wine and Petit sirah wine. J Agric Food Chem.
50:5649-5653.
Petelenz-Kurdzuel, E., E. Eriksson, M. Smedh, C. Beck, S. Hohmann and M. Gokso.
2011. Quantification of cell volume changes upon hyperosmotic stress in Saccharomyces
cerevisiae. Integr Biol. 3:1120-1126.
Pigeau, G.M. and D.L. Inglis. 2007. Response of wine yeast (Saccharomyces cerevisiae)
aldehyde dehydrogenase to acetaldehyde stress during Icewine fermentation. J Appl
Microbiol. 103:1576-1586.
35
Pigeau, G.M. and D.L. Inglis. 2005. Upregulation of ALD3 and GPD1 in Saccharomyces
cerevisiae during Icewine fermentation. J Appl Microbiol. 99:112-125.
Pigeau, G.M., E. Bozza, K. Kaiser and D.L. Inglis. 2007. Concentration effect of Riesling
Icewine juice on yeast performance and wine acidity. J Appl Microbiol. 103:1961-1698.
Plata, C., C. Millán, J.C. Mauricio and J.M. Ortega. 2003. Formation of ethyl acetate and
isoamyl acetate by various species of wine yeasts. Food Microbiol. 20:217-224.
Posas, F. and H. Saito. 1998. Activation of the yeast SSK2 MAP kinase kinase kinase by
the SSK1 two-component response regulator. EBMO. 17:1385-1394.
Posas, F. and H. Saito. 1997. Osmotic activation of the HOG MAPK pathway via Ste11p
MAPKKK: scaffold role of Pbs2p MAPKK. Science. 276:1702-1705.
Posa, F., S.M. Wurgler-Murphy, T. Maeda, E.A. Witten, T.C. Thai and H. Saito. 1996.
Yeast HOG1 MAP kinase cascade is regulated by a multistep phophorelay mechanism in
the SLNI-YPDI-SSK1 “two-component” osmosensor. Cell. 86:865-875.
Pretorius, I.S. 2000. Tailoring wine yeast for the new millennium: novel approaches to the
ancient art of winemaking. Yeast. 16:675-729.
Pronk, J.T., H.Y. Steensma and J.P. van Dijken. 1996. Pyruvate metabolism in
Saccharomyces cerevisiae. Yeast. 12:1607-1633.
Raitt, D.C., F. Posas and H. Saito. 2000. Yeast Cdc42 GTPase and Ste20 PAK-like
kinase regulate Shol-dependent activation of the Hogl MAPK pathway. EMBO J.
19:4623-4631.
Reiser, V., S.M. Salah and G. Ammerer. 2000. Polarized localization of yeast Pbs2 depends
on osmostress, the membrane protein Sho1 and Cdc42. Nat Cell Biol. 2:620-627.
Rep, M., J. Albertyn, J.M. Thevelein, B.A. Prior and S. Hohmann. 1999. Different
signalling pathways contribute to the control of GPD1 expression by osmotic stress in
Saccharomyces cerevisiae. Microbiol. 145:715-727.
Rep, M., M. Krantz, J.M. Thevelein and S. Hohmann. (2000). The transcriptional
response of Saccharomyces cerevisiae to osmotic shock. J Biol Chem. 275: 8290-8300.
Remize, F., E. Andrieu and S. Dequin. 2000. Engineering of the pyruvate dehydrogenase
bypass in Saccharomyces cerevisiae: role of the cytosolic Mg2+ and mitochondrial K+
acetaldehyde dehydrogenases Ald6p and Ald4p in acetate formation during alcoholic
fermentation. Appl and Environ Microbiol. 66:3151-3159.

36
Remize, F., J.L. Roustan, J.M. Sablayrolles, P. Barre, and S. Dequin. 1999. Glycerol
overproduction by engineered Saccharomyces cerevisiae wine yeast strains leads to
substantial changes in by-product formation and to a stimulation of fermentation rate in
stationary phase. Appl Environ Microbiol. 65:143-149.
Romano, P., G. Suzzi, L. Turbani and M. Polsinelli. 1994. Acetaldehyde production in
Saccharomyces cerevisiae wine yeasts. FEMS Microbiol Lett. 118:213-218.
Saint-Prix. F., L. Bönquist and S. Dequin. 2004. Functional analysis of the ALD gene
family of Saccharomyces cerevisiae during anaerobic growth on glucose: the NADP+-
dependent Ald6p and Ald5p isoforms play a major role in acetate formation. Microbiol.
150:2209-2220.
Saito, H. and K. Tatebayashi. 2004. Regulation of the osmoregulatory HOG MAPK
cascade in yeast. J Biochem. 136: 267-272.
Saerens, S.M.G., P.J. Verbelen, N. Vanbeneden, J.M. Thevelein and F.R. Delvaux. 2008.
Monitoring the influence of high-gravity brewing and fermentation temperature on flavour
formation by analysis of gene expression levels in brewing yeast. Appl Microbiol
Biotechnol. 80:1039-1051.
Saerens, S.M.G., K.J. Verstrepen, S.D.M. Van Laere, A.R.D. Voet, P. Van Dijck, F.R.
Delvaux and J.M. Thevelein. 2006. The Saccharomyces cerevisiae EHT1 and EEB1 genes
encode novel enzymes with medium-chain fatty acid ethyl ester synthesis and hydrolysis
capacity. Biol Chem. 281:4446-4456.
Satyanarayana, T., A.D. Mandel and H.P. Klein. 1974. Evidence for two immunologically
distinct acetyl-coenzyme A synthetases in yeast. Biochem Biophys Acta. 341:396-401.
Schoodermark-Stolk, S.A., M. Tabernero, J. Chapman, E.G. Ter Schure, C.T. Verrips, A.J.
Verkleij and J. Boonstra. 2005. Bat2p is essential in Saccharomyces cerevisiae for fusel
alcohol production on the non-fermentable carbon source ethanol. FEMS Yeast Res. 5:757-
766.
Sumby, K.M., P.R. Grbin and V. Jiranek. 2010. Microbial modulation of aromatic esters
in wine: current knowledge and future prospects. Food Chem. 121:1-16.
Tamas, M.J., M. Rep, J.M. Thevelein and S. Hohmann. 2000. Stimulation of the yeast
high osmolarity glycerol (HOG) pathway: evidence for a signal generated by a change in
turgor rather than by water stress. FEBS Lett. 472:159-165.
Tamás, M.J. and S. Hohmann. 2003. The osmotic stress response of Saccharomyces
cerevisiae. Yeast stress response. Springer-Verlag, Berlin. 199.

37
Thorne, T.W., H. Ho, M. Huvet, K. Haynes and M.P.H. Stumpf. 2011. Prediction of
putative protein interactions through evolutionary analysis of osmotic stress response in
the model yeast Saccharomyces cerevisiae. Fungal Genet Biol. 48:504-511.
Thursten, P.A., D.E. Quain and R.S. Tubb. 1992. Lipid metabolism and the regulation of
volatile ester synthesis in Saccharomyces cerevisiae. J Inst Brew. 88:90-94.
Torrens, J., P. Urpi, M. Riu-Aumatell, S. Vichi, E. Lopez-Tamanes and S. Buxaderas.
2008. Different commercial yeast strains affecting volatile and sensory profile of cava base
wine. Int J Food Microbiol. 124:48-57.
Van den Berg, M.A. and H.Y. Steensma. 1995. ACS2, a Saccharomyces cerevisiae gene
encoding acetyl-coenzyme A synthetase, essential for growth on glucose. Eur J Biochem.
231:704-713.
Van den Berg, M.A., P. de Jong-Gubbels, C.J. Kortland, J.P. van Dijken, J.T. Pronk and
H.Y. Steensma. 1996. The two acetyl-coenzyme A synthetases of Saccharomyces
cerevisiae differ with respect to kinetic properties and transcriptional regulation. Biol
Chem. 271:28953-28959.
van Dijken, J. and W. Sheffers. 1986. Redox balances in the metabolism of sugars by
yeasts. FEMS Microbiol Rev. 32:199-224.
Varela, J.C.S. and W. H. Mager. 1996. Response of Saccharomyces cerevisiae to changes
in external osmolarity. Microbiol. 142:721-731.
Verduyn, C., E. Postma, A. Scheffers and J.P. van Dijken. 1990. Physiology of
Saccharomyces cerevisiae in anaerobic glucose-limited chemostat culture. J Gen
Microbiol. 136:395-403.
Verstrepen, K.J., G. Derdelinckx, J.P. Dufour, J. Winderickx, J.M. Thevelein, J. Pretorius
and F.R. Delvaux. 2003. Adding fruitiness to beer. J Biosci Bioeng. 96:110-118.
Verstrepen, K.J., S.D.M. Van Laere, B.M.P. Vanderhaegen, G. Derdelinckx, J.P. Dufour,
I.S. Pretorius, J. Winderickx, J.M. Thevelein and F.R. Delvaux. 2003. Expression levels of
the yeast alcohol acetyltransferase genes ATF1, Lg-ATF1, and ATF2 control of the
formation of a broad range of volatile esters. Appl and Environ Microbiol. 69:5228-5237.
Verstrepen, K.J., S.D.M. Van Laere, J. Vercammen, G. Derdelinckx, J.P. Dufour, I.S.
Pretorius, J. Winderickx, J.M. Thevelein and F.R. Delvaux. 2004. The Saccharomyces
cerevisiae alcohol acetyltransferase Atf1p is localized in lipid particles. Yeast. 21:367-377.
Voet and Voet. 2004. Biochemistry. John Wiley & Sons, New York. 1392.
38
VQA Ontario. 2013. Wine standards. Retrieved from:
http://www.vqaontario.com/Regulations/Standards
Wang, X.P., C.J. Mann, Y.L. Bai, L. Ni and H. Weiner. 1998. Molecular cloning,
characterization, and potential rules of cytosolic and mitochondrial aldehyde
dehydrogenases in ethanol metabolism in Saccharomyces cerevisiae. J Bacteriol. 180:822-
830.
White, W.H., P.L. Skatrud, Z. Xue and J.H. Toyn. 2003. Specialization of function among
aldehyde dehydrogenases: the ALD2 and ALD3 genes are required for beta-alanine
biosynthesis in Saccharomyces cerevisiae. Genetics. 163:69-77.
Yang, F. 2011. Study of new yeast strains as novel starter cultures for Riesling Icewine
production. MSc Thesis. Brock University, ON.
Yoshimoto, H., D. Fujiwara, T. Momma, K. Tanaka, H. Sone, N. Nagasawa and T.
Tamai. 1999. Isolation and characterization of the ATF2 gene alcohol acetyltransferase II
in the bottom fermenting yeast Saccharomyces pastorianus. Yeast. 15:409-417.
Yoshimoto, H., T. Momma, D. Fujiwara, H. Sone, Y. Kaneko and T. Tamai. 1998.
Characterization of the AFT1 and Lg-ATF1 genes encoding alcohol acetyltransferases in
the bottom fermenting yeast Saccharomyces pastorianus. J. Ferment Bioeng. 86:15-20.
Yoshioka, K. and N. Hashimoto. 1984. Acetyl-CoA of brewer’s yeast and formation of
acetate esters. Agric Biol Chem. 48:207-209.

39
Chapter 2
2. Acetic Acid and Ethyl Acetate Formation during Fermentation in
Appassimento-Type Must: Effect of Yeast Strain and Sugar Concentration
Heit, C.1,2 and D.L. Inglis1,2,3
1 Cool Climate Oenology and Viticulture Institute, Brock University, St. Catharines, ON,
Canada
2 Centre for Biotechnology, Brock University, St. Catharines, ON, Canada
3 Department of Biological Sciences, Brock University, St. Catharines, ON, Canada
Formatted for the Journal of Applied Microbiology
2.1. Abstract
Aims: To study the metabolomics and fermentation performances of Saccharomyces
cerevisiae and Saccharomyces bayanus strains under high sugar stress during the
vinification of partially dried grapes. The production of glycerol, acetaldehyde, ethanol,
acetic acid and ethyl acetate were followed to relate metabolites in wine involved in the
yeast’s osmotic stress response to acetic acid and ethyl acetate production during high sugar
fermentations. Kinetic and metabolic differences between the wine yeast strains were also
compared to evaluate their abilities to form acetic acid and ethyl acetate, and to ferment
must produced using an appassimento-type process.
Methods and Results: Appassimento-type must (27°Brix; 244 ± 19 g l-1 sugar) and table
wine must (18°Brix; 179 ± 5 g l-1 sugar) were fermented in triplicate using the commercial
wine yeast S. cerevisiae strain EC-1118 and a natural strain of S. bayanus. Acetic acid
production increased 41.2% in the 27°Brix condition in comparison to the 18°Brix
condition fermented by EC-1118, accompanied by an 80.6% decrease in ethyl acetate
production over that determined in table wine. Acetic acid production by S. bayanus in the
27°Brix must was lower than that observed in the 18°Brix condition, although starting
levels were higher as a result of the drying process. Ethyl acetate production was also lower
in the concentrated grape must, resulting in a 96.4% decrease over that found in the
reference condition. The fermentation performances and kinetic behavior of the wine
yeasts were similar in the high and low sugar conditions. Between strains, sugar utilization
and ethanol production were comparable as no significant differences were determined,
although differences in viable cell concentrations existed.
Conclusions: This study investigated the different acetic acid and ethyl acetate production
capacities of two wine yeasts fermenting under high and low sugar conditions. Higher
acetic acid and lower ethyl acetate levels were formed by EC-1118 in appassimento-style
wine compared to table wine, while lower levels of both metabolites were formed by S.

40
bayanus fermenting under high sugar stress. Of the two strains studied, S. bayanus
produced less acetic acid and ethyl acetate compared to EC-1118 fermenting the high and
low sugar musts, which is consistent with our previous studies. In light of the differences
in metabolite formation between yeasts, both strains displayed appreciable capabilities to
overcome osmotic stress and to yield ethanol after fermenting the concentrated grape must.
Significance and Impact: The results provided insights on the abilities of two wine yeasts
to ferment high sugar must produced using an appassimento-type process, and strain
differences in the production of metabolites involved in the stress response leading to acetic
acid and ethyl acetate formation. Taken together, this work assisted in our understanding
of the stress response of wine yeasts to solutes concentrated in grape juices and of possible
factors contributing to the formation of yeast metabolites, namely acetic acid and ethyl
acetate, under these conditions. This investigation is of applicative interest for the wine
industry that uses high sugar musts.
Keywords: Saccharomyces cerevisiae, Saccharomyces bayanus, appassimento process,
hyperosmotic stress, glycerol, acetaldehyde, ethanol, acetic acid, ethyl acetate, aldehyde
dehydrogenase, redox balance.
2.2. Introduction
Ontario’s wine appellations include the Niagara Peninsula and the adjacent regions
of Lake Erie Northshore, now including Pelee Island, and Prince Edward County (VQA
2013A). Of these appellations, the Niagara Peninsula is the largest and most diverse
Viticultural Area in Canada, and is denoted as a cool-climate region as it is situated at
approximately N43°latitude, with relatively high changes in day-night temperature and
considerable sunshine during the growing season, lasting from April through to October
(VQA 2013A). On average, the number of growing degree days within the region is
reported to be 1413, while the number of frost-free days is 198 (VQA 2013A). Due to its
climatic characteristics, Niagara supports the quality production of selected wine grape
varieties including Vitis vinifera varietals such as Pinot noir, Cabernet franc, Sauvignon
blanc and Riesling (VQA 2013A), although its cool and relatively humid climate and short

41
growing season impact both grape composition and wine quality (Jackson and Lombard
1993).
Meso-climate site characteristics, including temperature, relative humidity and
rain, combined with good canopy management and crop control, are critical in capturing
sufficient heat to fully ripen fruit, thereby allowing it to reach maturity (Jones and Hellman
2002). Aside from basic climatic constraints in Niagara, annual weather variability within
the region and extreme climatic events, including early freezes, mid-winter thaws and
spring frosts, pose additional challenges for the Ontario wine industry as these factors also
influence grape and wine quality (Hakimi Rezaei and Reynolds 2010; Shaw 2005).
Climatic variation can further result in insufficient heat units to fully ripen some varieties,
and fall weather may include excessive rain, potentially precluding the fruit from reaching
its full flavour potential through ripening on-vine (Jackson and Lombard 1993; Winkler
1954). However, ripening the fruit off-vine postharvest using an appassimento-type
process represents a new and exciting innovation for the Ontario wine industry to overcome
this climatic barrier and to produce high quality wines. This process involves drying grapes
already picked from the vine, which increases the sugar content due to water loss, resulting
in berry dry weight reductions of 10 to 40%, and induces changes both within and on the
grape surface that alter flavour (Rizzini et al. 2009).
Traditionally, the “passito” method has been employed in Mediterranean
civilizations with hot climates using grapes that have either been dried naturally through
withering or dehydrated using a particular drying process (Barbanti et al. 2008). Under
dehydration conditions, postharvest water stress and subsequent over-ripening can be
achieved in berries by placing them in shady, dry or ventilated areas or in closed

42
environments where the temperature, relative humidity and airflow are artificially
controlled (Bellincontro et al. 2004). Controlled environmental conditions have been
shown to be important for obtaining high-quality dehydrated berries as they permit more
uniform dehydration and postponed water stress compared to traditional, uncontrolled
conditions (Chkaibain et al. 2007). In addition to sugar concentration, research conducted
for wine production has also shown organic acid, phenolic and aroma compounds to be
produced or concentrated, suggesting positive postharvest flavour development can occur
as a consequence of the drying process (Bellincontro et al. 2004; Constantini et al. 2006;
Moreno et al. 2008). Ratios of tartaric/ malic acid have been shown to increase due to a
loss off malic acid from increased respiration (Rizzini et al. 2009), along with phenolics,
including stilbenes (trans-resveratrol, trans-piceid) and catechins (Mencarelli et al. 2010),
acetaldehyde and ethyl acetate (Constanti et al. 2006).
However, fermenting must from dried grapes presents many challenges for wine
yeast (López de Lerma and Peinado 2011). The high solute concentrations expose yeast to
extreme conditions of hyperosmotic stress, leading to altered metabolism, growth, and
fermentation difficulties (Pigeau and Inglis 2005; 2007; Heit 2011). Under these
conditions, target alcohol levels may not be attained and metabolic by-products of stress
responses such as glycerol and acetic acid may impact wine composition (Heit and Inglis
2013). Both glycerol and acetic acid have been implicated in allowing yeast to maintain
cytosolic osmotic and redox balance, respectively, under high osmolarity (Pigeau and
Inglis 2005; Erasmus et al. 2004). The further metabolism of acetic acid to acetylCoA by
an acetylCoA synthetase (Mason and Dufour 2000) facilitates the biosynthesis of ethyl
acetate, a volatile compound that can further impact the chemical composition and overall
43
quality of the resulting wine (Heit and Inglis 2013). When present in sufficient
concentrations, ethyl acetate and acetic acid affect the organoleptic properties of wine and
may cause the volatile acid levels to exceed legal limits. Alcohol acetyltransferases are the
most well-known enzymes involved in ester synthesis and catalyze the condensation of
acetylCoA and ethanol (Nordstrom 1962; 1963).
The mechanisms (both transcriptional and non-transcriptional) involved in yeast
osmoregulation and osmoadaptation have been extensively studied in laboratory strains of
S. cerevisiae in response to salt-induced osmotic stress (Hohmann et al. 2002), and to a
lesser extent in wine S. cerevisiae in response to sugar-induced osmotic stress during
fermentation (Pigeau and Inglis 2005; Erasmus et al. 2003). However, aerobically grown
S. cerevisiae have been shown to synthesize glycerol under salt stress accompanied by
acetic acid production (Blomberg and Alder 1989), which is consistent for S. cerevisiae
exposed to sugar stress during wine fermentation, with a linear correlation between
glycerol and acetic acid production (Pigeau and Inglis 2007). Glycerol is the main osmolyte
in S. cerevisiae and is synthesized under osmotic stress (Blomberg and Alder 1989;
Brewster et al. 1993; Nevoigt and Stahl 1997; Blomberg 2000). The rate-limiting step in
its biosynthesis is the expression of glycerol-3-phosphate dehydrogenase (encoded by
GPD1 and GPD2), which catalyzes the reduction of dihydroxyacetone phosphate (DHAP)
to glyceraldehyde-3-phosphate, with the oxidation of NADH (Remize et al. 2001). In a
subsequent reaction, glycerol-3-phosphate is dephosphorylated by glycerol-3-
phosphatases (encoded by GPP1 and GPP2) to form glycerol (Påhlman et al. 2001).
Since yeast lack a transhydrogenase to convert reducing equivalents between
coenzyme systems (NAD+/ NADH, NADP+/ NADPH) (Bruinenberg et al. 1983), they rely

44
on metabolite formation to maintain the intracellular redox balance, specifically through
redox reactions that can reduce the excess NAD+ produced during glycerol synthesis.
Acetic acid biosynthesis has been suggested as a mechanism that yeast can use to balance
NAD+ produced in response to osmotic stress by regenerating NADH (Blomberg and Alder
1989). The NADH consumed during DHAP reduction could be provided by the NAD+-
dependent oxidation of acetaldehyde to acetic acid by a cytosolic aldehyde dehydrogenase
(Aldp), resulting in the reduction of NAD+ to NADH (Pigeau and Inglis 2007). In S.
cerevisiae, there are five Aldp isoforms that are capable of catalyzing this reaction, two of
which are cytosolic and NAD+-dependent (encoded by ALD2 and ALD3) (Navarro-Avino
et al. 1999) and one of which is cytosolic and NADP+-dependent (encoded by ALD6)
(Meaden et al. 1997). To date it remains unclear which cofactor system and Aldp isoform
is responsible for acetic acid production during high sugar fermentations and the linkage
to hyperosmotic stress and NADH requirements (Pigeau and Inglis 2005; 2007; Erasmus
et al. 2003; 2004).
Since acetic acid is a precursor to ethyl acetate, understanding the factors
contributing to their biosynthesis is important for ultimately determining what controls
acetic acid and ethyl acetate formation by wine yeast fermenting under high sugar stress.
With respect to substrate availability for the Aldp isozymes, acetaldehyde levels have been
shown to quickly increase during Icewine fermentation over that found in table wine juice
(Pigeau and Inglis 2005; Heit 2011; Heit and Inglis 2012; 2013), which was followed by a
decrease in acetaldehyde and a large increase in acetic acid (Pigeau and Inglis 2005; Heit
2011; Heit and Inglis 2012; 2103). Of the ALD isogenes, Pigeau and Inglis (2005; 2007)
reported only ALD3 to be differentially up-regulated in response to osmotic stress during

45
Icewine fermentation, which corresponded to a large-fold increase in acetic acid. They
concluded that Ald3p contributes, in part, to the elevated acetic acid found in Icewines. In
contrast, Erasmus et al. (2003) found ALD2, ALD3, ALD4 and ALD6 to all be up-regulated
under high osmolarity 2 hours after exposure to 40% (w/ v) sugar, also corresponding to an
increase in acetic acid produced days later during the fermentation. However, NADP+-
dependent Ald6p was recently reported to be responsible for the majority of acetic acid
generated in a laboratory S. cerevisiae strain grown under aerobic conditions exposed to
40% (w/v) glucose, linking acetic acid generation under osmotic stress to NADPH
production, possibly as a way to compensate for the down-regulation of NADPH generated
through the pentose phosphate pathway (Bro et al. 2003; Erasmus and van Vuuren 2009).
Elevated acetic acid in Icewine also appears due to lack of conversion to acetylCoA
from the down-regulation in gene expression of acetylCoA sythetases encoded by ACS2
and ACS1 (Martin and Inglis 2006; Martin 2008). Under these conditions, low expression
of ACS2 in osmotically stressed cells may also reduce the formation of acetylCoA from
acetate, thereby reducing the amount of substrate available to acetyltransferases for ethyl
acetate formation. The down-regulation of ACS genes corresponded to a down-regulation
of fatty acid synthesis genes and reduced growth in the Icewine condition (Martin 2008) as
acetylCoA is required for lipid, sterol and amino acid biosynthesis (Pronk et al. 1996). This
result was further substantiated by the lower ethyl acetate levels measured in Icewine
compared to table wine, whereby acetylCoA is required for the esterification to ethanol by
alcohol acetyltransferase (Heit 2011; Heit and Inglis 2012). Lower ethyl acetate levels in
Icewine could also be due to the reduced acetyltransferase activity, although this variable
has not been measured.
46
In Ontario and elsewhere, the high sugar musts associated with Icewine and
appassimento-type wine production pose challenges in the management of volatile acidity
(VA) (Heit and Inglis 2013). With the maximum allowable limit of VA at 2.1 g l-1 and 1.3
g l-1 acetic acid in Icewine and table wine (VQA 2013B), respectively, it is important to
understand the fermenting yeast’s adapted response during high sugar fermentation to
determine how and why acetic acid is produced and the controlling factors of ethyl acetate
formation due to their impact on wine quality. In addition, investigating the use of wine
yeast strains as control agents for acetic acid and ethyl acetate production during high sugar
ferments will be important for developing a strategy for managing VA levels during
fermentation.
To address VA concerns in high sugar wines, this research sought to achieve three
objectives: (1) to use appassimeto-type must and table wine must to evaluate differences
in the produced yeast metabolites involved in the stress response leading to acetic acid and
ethyl acetate formation; (2) to evaluate differences in metabolites produced between two
wine yeast strains, commercial S. cerevisiae EC-1118 and a natural isolate of S. bayanus,
in appassimento-type must containing high starting concentrations of acetaldehyde and
acetic acid; (3) and to assess the ability of S. bayanus to ferment wine using the
appassimento process. To achieve these objectives, we followed the time course of
glycerol, acetaldehyde, ethanol, acetic acid and ethyl acetate produced in wines during the
fermentation of appassimento-type must and compared these profiles with that found in
yeast fermenting table wine must. Along with the metabolomics, the overall production of
each metabolite was also compared between strains fermenting under high and low sugar
stress to ascertain differences in the concentrations generated during fermentation.

47
2.3. Materials and Methods
2.3.1. Yeast strains. Two yeast strains were used in this study for wine fermentations: the
commercial yeast S. cerevisiae strain EC-1118 was supplied by Lallemand Inc. (Montreal,
QC, Canada) and the natural yeast strain S. bayanus was isolated from Brock University
from the bloom of Riesling Icewine grapes (St. Catharines, ON, Canada).
2.3.2. Grape musts. To investigate the impact of hyperosmotic stress on wine yeast,
appassimento-type must was produced from V. vinifera L.cv. Cabernet franc grapes
harvested at Cherry Avenue Research Station (Vineland, ON, Canada) and dried using a
modern tobacco kiln at Reif Estate Winery (Niagara-on-the-Lake, ON, Canada). Two
fermentation conditions were investigated using the control and dried grapes: table wine
must at 18°Brix (179 ± 5 g l-1) and appassimento-type must at 27°Brix (244 ± 19 g l-1).
2.3.3. Grape harvesting and withering. Grape clusters from the Cherry Avenue vineyard
were harvested in the 2011 season at a soluble solids content of 18°Brix. Five-hundred and
seventeen kilograms were handpicked, with any diseased fruit culled after inspection, and
placed in plastic, perforated drying containers in a single layer. After picking, the grapes
were divided into two lots. One lot (207 kg) was taken to the Cool Climate Oenology and
Viticulture Institute (CCOVI) to be processed and used for wine production (Teaching
Winery, Brock University). Upon arrival at CCOVI, the grapes were stored at room
temperature overnight to allow them to warm, and were processed the following day. The
remaining lot (310 kg) was placed inside a tobacco kiln with control of temperature and
relative humidity (RH). The starting temperature and RH of the kiln were recorded as
20.9°C and 64.8%, respectively, as determined by a data logger, and appeared to fluctuate
throughout the drying period, averaging values of 32.1°C and 26.6%, respectively. Grapes

48
were sampled every day during the drying period. At each sampling time, 15 clusters were
selected at random from trays arranged in the tobacco kiln. On receipt of the samples, 7
berries per cluster were randomly selected, removed from the rachis and weighed for berry
weight determination. The extra berries were manually crushed inside the bag and filtered
using a metal strainer. The grape juice obtained was immediately subjected to chemical
analysis of soluble solids, titratable acidity and pH. The remaining juice samples for
analysis of glucose, fructose, glycerol, acetaldehyde, ethanol, acetic acid and ethyl acetate
were centrifuged at 10 000 rpm for 5 min at 4°C (Sorvall RC5C Plus, rotor model SLA-
1500; Newtown, CT, USA) to remove microorganisms and grape particulate matter. The
supernatant was recovered and a 5 ml-1 sample was removed and centrifuged at 12 000 rpm
for 4 min at room temperature using a microcentrifuge (Sorvall MC12). Samples were
decanted and supernatants were stored at -30°C until analyzed. After 114 hours of drying
(over 5 days) the grapes reached 27°Brix and were ready for vinification and removed from
the kiln for processing.
2.3.4. Chemical analyses of initial juices. Soluble solids of the starting unfermented juices
were determined using an ABBE bench top refractometer (Model 10450, American
Optical). Reducing sugar content was determined using the commercial enzyme assay kit
for glucose and fructose (K-FRUGL) according to the manufacturer’s instructions
(Megazyme International Ireland, Ltd.; Bray Co., Wicklow, IRE). Juice acidity was
determined by measuring pH using a Corning pH meter (model 455) first calibrated to pH
4.0, pH 7.0 and pH 10.0, and titratable acidity by titration with 0.1 N NaOH to an endpoint
of pH 8.2 (Zoecklein et al. 1996). Ammonia and amino nitrogen levels were assayed by

49
the enzymatic method (K-AMIAR and K-PANOPA, Megazyme).Yeast assimilable
nitrogen content (YANC) was the sum of the two concentrations.
2.3.5. Must fermentation and sampling: A total of four fermentation treatments were
studied in this experiment, with each performed in triplicate. These included: wine
produced from fruit harvested at approximately 18°Brix and inoculated with EC-1118 (1)
and S. bayanus (2); and fruit harvested at approximately 18°Brix and kiln-dried to
approximately 27°Brix and inoculated with EC-1118 (3) and S. bayanus (4). Before
processing, control and semi-dried grapes were divided randomly and equally into three
replicates based on weight (25 kg grapes/ replicate), and each replicate was processed
separately through the crusher/ destemmer. Musts were aliquoted into plastic pails (30 l),
blanketed with carbon dioxide, sealed with a plastic lid and stored at 22°C to increase the
temperature prior to yeast inoculation. To the starting musts, 0.75 g l-1 of DAP was added
prior to inoculation, and on day 3 of fermentation 0.25 g l-1 was added, totalling 1 g l-1.
2.3.6. Yeast inoculation procedure for fermentations. Five grams of active freeze dried
wine yeast (S. cerevisiae EC-1118) were rehydrated in 50 ml of sterile, 40°C water (RiOs-
16; Millipore, Etobicoke, ON, Canada) for 15 minutes, gently swirling every 5 minutes to
encourage aeration. Thirty microlitres of the EC-1118 starter culture and frozen (-80°C)
working cell bank of S. bayanus were subsequently plated on YPD media (1% yeast
extract, 2% peptone, 2% dextrose, 2% agar) and incubated in a growth chamber at 30°C
before use in the fermentations. Yeast starter cultures were prepared using a step-wise
acclimatization method outlined by Kontkanen et al. (2004). For the appassimento
fermentations, juice required for the starter cultures was clarified prior to use via racking
and centrifugation at 10 000 rpm for 5 min at 4°C (Sorvall RC5C Plus, rotor model SLA-
50
1500). To prepare the growth media to build up the starter cultures, Cabernet franc table
wine juice was first diluted from 18°Brix to 10°Brix with sterile, distilled water (RiOs-16,
Millipore) and 2 g l-1 of diammonium phosphate (DAP) was added to 450 ml of the dilute
juice. Using a sterile wire loop, a loop-full of each yeast strain was inoculated from the
YPD plate into the respective growth medium. These cultures were grown aerobically at
25°C with shaking at 130 rpm in a temperature controlled orbital shaker (Weiss
Gallenkamp) until the total cell concentration reached 2 x 10⁸ cells ml-1, as determined
using a haemocytometer counting chamber, light microscope (40x magnification) and
methylene blue indicator. The three starter cultures of each strain were combined in a 2 l
Erlenmeyer flask, gently swirled to homogenize the sample, and aliquoted into new, sterile
flasks. To acclimatize the yeasts to the two growth mediums, an equal volume of 18°Brix
juice was added to each culture. The starter cultures were incubated at 25°C in a water bath
for 1 h, swirling gently every 30 min. For the controls, a 900 ml starter culture was used to
inoculate 18.75 l of each replicate to achieve a total cell concentration of 4.78 x 10⁶ cells
ml-1 and inoculum rate of 0.35 g l-1, in a final volume of approximately 19.65 l. To
acclimatize the remaining cultures to the high Brix juice, an equal volume of appassimento
juice was added to each starter culture. The cultures were held at 20°C for 2 h, swirling
gently every 30 min. A 800 ml starter culture was then used to inoculate 11 l of
appassimento must to achieve a total cell concentration of 4.8 x 10⁶ cells ml-1 and an
inoculum rate of 0.35 g l-1 in a final volume of 11.80 l. After inoculation, the culture and
skins were mixed back into the juice using a punch-down tool to initiate fermentation.
2.3.7. Experimental winemaking and fermentation monitoring. Fermentations were
carried out in a temperature controlled room at 22°C and were monitored by sugar
51
consumption. The fermentations continued to dryness (less than 3 g l-1 reducing sugar, as
determined by the FOSS WineScan™; Hillerød, Denmark) or until the yeast stopped
consuming sugar, as determined by no further change in sugar concentration for three days.
When all fermentations were complete, individual replicates from each treatment were
pressed using a pneumatic bladder press that applied a constant pressure up to 1 bar for 2
minutes, allowing consistent pressing. Wines had 50 ppm SO2 added before being settled
at room temperature, racked, and cold stored at -2°C. Sampling of the fermentations
occurred daily after mixing to ensure homogeneity, which was performed by moving the
punch-down disc up and down. During the fermentation course, replicates received two
sets of plunges per day. Beginning the morning after yeast inoculation, replicates received
20 plunges per set, and as the fermentation progressed, plunging replicates were reduced
and did not exceed 4 per set by the end of fermentation. The punch-down tool was washed
with water and sprayed with 70% ethanol and wiped down before and after mixing to
prevent contamination. After mixing, a 60 ml sample from each replicate was removed and
immediately assessed for soluble solids, temperature, and yeast cell concentration. Soluble
solids were measured using a degree Brix hydrometer, temperature was determined using
a thermometer labeled in degree Celsius, and viable cell concentrations were monitored by
CFU counts on YPD agar after appropriate dilutions. The remaining samples were
centrifuged at 10 000 rpm for 5 min at 4°C (Sorvall RC5C Plus, rotor model SLA-1500)
to remove fermenting yeast cells and grape particulate matter. Samples (5 ml) for
metabolite analysis were removed from the supernatant and centrifuged again at 12 000
rpm for 4 min at room temperature using a microcentrifuge (Sorvall MC12), and
subsequently stored in sterile Eppendorf tubes at -30°C until analyzed. Enzymatic UV test

52
kits for determination of glucose, fructose, glycerol, acetaldehyde, ethanol and acetic acid
by an enzymatic reaction and spectrophotometric quantification were supplied by
Megazyme (K-FRUGL, K-GCROL, K-ACHD, K-ETOH, K-ACET). Ethyl acetate was
evaluated by gas chromatography against an ethyl acetate standard curve using a Hewlett-
Packard 6890 series gas chromatograph (Agilent Technologies Inc.; Palo Alto, CA, USA).
The GC was equipped with a flame ionization detector (FID), split/ split-less injector, and
Chemstation software. Separations were carried out with a DB®-WAX (30 m, 0.25 mm,
0.25 µm) GC column (122-7032 model; Agilent) with helium as the carrier gas at a flow
rate of 1.5 ml min-1. Samples were not diluted and contained 5% 4-methyl-2-pentanol as
the internal standard. All juice and wine measurements were tested in duplicate. In all
treatments, yeast strains were evaluated for their generation of each metabolite, which was
determined by subtracting the metabolite concentration measured on day 0 of fermentation
(the day of inoculation) from the level determined on the final day of fermentation. The
resulting value was used to calculate the normalized production of each metabolite, which
was determined by dividing the amount of metabolite produced by the grams of sugar
consumed by the respective yeast strain during the fermentation course. The final
concentration of each metabolite was also determined by measuring the amount present in
the resulting wines after pressing.
2.3.8. Statistical analysis. Differences between variables were determined by XLSTAT
statistical software package released by Addinsoft (Version 7.1; New York, NY).
Statistical methods used were analysis of variance (ANOVA) with mean separation by
Fisher’s Least Significant Difference (LSD) test (p< 0.05).
53
2.4. Results
2.4.1. Initial appassimento-type must. The chemical compositions of Cabernet franc
musts, 18˚Brix and 27˚Brix, are given in Table 2.1. As a consequence of the drying process,
the non-sterile appassimento-type juice had higher starting concentrations of glycerol,
acetaldehyde and acetic acid compared to the table wine must, and a lower ethanol
concentration, while the ethyl acetate content was not detectable in both. In addition to
concentrating grape sugars, thereby increasing the glucose and fructose content in the
berries, the concentration of titratable acids was also higher in the 27°Brix musts, as was
the pH. By comparison, the total assimilable nitrogen (N) content to support yeast growth
was low, hence the necessity to supplement the musts with DAP. As an entirety, the high
concentration of fermentable sugars, high titratable acidity and low pH in the starting must
created a stressful environment for yeast growth and fermentation as demonstrated by their
slower sugar utilization and prolonged fermentation times.

54
Table 2.1: Chemical composition of Cabernet franc musts prior to fermentation (mean ±
SD).
18°Brix
27°Brix
Soluble solids (°Brix)
18.4 ± 0.1
27.2 ± 0.1
Glucose + fructose (g l-1) 179 ± 5 244 ± 19
Titratable acidity (g l-1) 6.69 ± 0.22 7.18 ± 0.20
pH 3.25 ± 0.02 3.54 ± 0.02
Free amino acid nitrogen (mg N l-1) 26 ± 2 46 ± 1
Ammonia nitrogen (mg N l-1) 5 ± 4 6 ± 1
Glycerol (g l-1) 0.21 ± 0.03 0.25 ± 0.02
Acetaldehyde (mg l-1) 4.8 ± 1.0 11.7 ± 0.0
Ethanol (% v/v) 0.2 ± 0.0 0.1 ± 0.0
Acetic acid (g l-1) 0.01 ± 0.00 0.05 ± 0.00
Ethyl acetate (mg l-1) *ND *ND
This measurement does not include proline.
*ND= Not detected.
55
2.4.2. Fermentation kinetics. Yeast fermenting the table wine must and appassimento-
type must began to consume sugar almost immediately following inoculation, with
consumption differences existing between the strains in each fermentation condition (Fig.
2.1A). In the high sugar ferments (27°Brix), all of the available fermentable sugars were
consumed by EC-1118 after 291.5 hours (12 days), while only 1± 0 g l-1 remained in the
wines fermented by S. bayanus after 339.5 hours (14 days) (Fig. 2.1A and 2.1B). These
results differ from the low sugar ferments (18°Brix), where the yeast exhibited a more rapid
fermentation rate. Under these conditions, the fermentation lengths were shorter, lasting
only 162 hours (7 days), and both EC-1118 and S. bayanus were able to consume all of the
available fermentable sugars in this time (Fig. 2.1A and 2.1B). Although the strains took
the same amount of time to complete fermentation, S. bayanus fermented the low sugar
must more rapidly than EC-1118, consuming more grams of reducing sugar per liter of
solution at any sampling hour (Fig. 2.1A). A similar result was observed in the high sugar
condition, but the robustness of the S. bayanus strain appeared to diminish around 120
hours, allowing EC-1118 to complete the fermentation first.
As sugar concentration decreased during the fermentations, ethanol production
increased (Fig. 2.2A). Of the two sugar conditions, higher levels of ethanol were produced
in the 27°Brix ferments compared to the 18°Brix ferments as the starting musts had higher
initial sugar concentrations and were fermented to dryness. Although the ethanol levels
between sugar conditions differed significantly, there were no statistically significant
differences between strains within each condition. For the amount of sugar consumed by
EC-1118 and S. bayanus during fermentation, similar amounts of ethanol were produced
in the two sugar conditions (Fig. 2.3). As expected, yeast strains fermenting appassimento-

56
type must took longer to complete the fermentation as this condition contained
approximately 100 g l-1 more reducing sugar compared to the table wine condition.
Unexpectedly, however, yeast strains grew to higher peak cell concentrations in the
27°Brix condition compared to the 18°Brix condition, although the higher cell density was
not enough to shorten the overall fermentation time (Fig. 2.4). Residual nitrogenous
compounds were measured in all four treatments and found to be 19 ± 2 mg N l-1 and 26 ±
7 mg N l-1 in the table wines fermented by EC-1118 and S. bayanus, respectively, and 26
± 1 mg N l-1 and 45 ± 2 mg N l-1 in the appassimento-style wines fermented by EC-1118
and S. bayanus, respectively (Appendix I, Table 1).

57
Figure 2.1: Sugar consumption during fermentation of table wine must and appassimento-
type must. Sugar consumption was followed throughout the course of the fermentations (A), and
the total sugar consumed was compared between yeast strains in high versus low sugar
environments (B). Fermentations were performed in triplicate and samples from each treatment
were analyzed in duplicate, for an n = 6 for each measurement. The mean values (± SD) of the
triplicate fermentations are shown; where the error bars are not visible, they are within the symbol.
Treatments were compared to each other and analyzed statistically using analysis of variance
(ANOVA) with mean separation by Fisher’s Least Significant Difference (LSD) test (p< 0.05). In
descending order, lowercase letters indicate a unique group based on statistical difference using
Fisher’s LSD0.05.
-50
0
50
100
150
200
250
300
0 50 100 150 200 250 300 350 400
Red
uci
ng
su
ga
rs (
g l⁻¹
)
Fermentation time (h)
EC-1118 18B S. bayanus 18B EC-1118 27B S. bayanus 27B
A
0
50
100
150
200
250
300
EC-1118 (18°Brix) S. bayanus (18°Brix) EC-1118 (27°Brix) S. bayanus (27°Brix)
Su
ga
r co
nsu
med
(g
lˉ¹
)
B
b b
a a

58
Figure 2.2: Ethanol production during fermentation of table wine must and appassimento-
type must. Ethanol was measured throughout the course of the fermentations (A) and the total
ethanol production was compared between yeast strains in high versus low sugar environments (B).
Metabolite production was determined by substracting the concentration measured on day 0 of
fermentation (inoculation day) from the level determined on the final day of fermentation.
Fermentations were performed in triplicate and samples from each treatment were analyzed in
duplicate, for an n = 6 for each measurement. The mean values (± SD) of the triplicate fermentations
are shown; where the error bars are not visible, they are within the symbol. Treatments were
compared to each other and analyzed statistically using analysis of variance (ANOVA) with mean
separation by Fisher’s Least Significant Difference (LSD) test (p< 0.05). In descending order,
lowercase letters indicate a unique group based on statistical difference using Fisher’s LSD0.05.
0.0
2.0
4.0
6.0
8.0
10.0
12.0
14.0
16.0
0 50 100 150 200 250 300 350 400
Eth
an
ol
(% v
/v)
Fermentation time (h)
EC-1118 18B S. bayanus 18B EC-1118 27B S. bayanus 27B
A
0.0
2.0
4.0
6.0
8.0
10.0
12.0
14.0
16.0
EC-1118 (18°Brix) S. bayanus (18°Brix) EC-1118 (27°Brix) S. bayanus (27°Brix)
Eth
an
ol
gen
era
ted
(%
v/v
)
B
b b
a a

59
Figure 2.3: Ethanol produced/ sugar consumed during fermentation of table wine must and
appassimento-type must. Total ethanol production was normalized to the amount of sugar
consumed during the course of the fermentations, and compared between yeast strains.
Fermentations were performed in triplicate and samples from each treatment were analyzed in
duplicate (n = 6). Ethanol values represent the average ± standard deviation of the mean from
duplicate fermentations. The statistical method used was analysis of variance (ANOVA).
Figure 2.4: Total colony forming units during fermentation. Total colony forming units were
measured throughout the course of the fermentations. Fermentations were performed in triplicate
and samples were tested in singlet (n = 3). The mean values (± SD) of the triplicate fermentations
are shown; where the error bars are not visible, they are within the symbol.
0.000
0.010
0.020
0.030
0.040
0.050
0.060
EC-1118 (18°Brix) S. bayanus (18°Brix) EC-1118 (27°Brix) S. bayanus (27°Brix)
Eth
an
ol
(% v
/v)/
Su
gar
con
sum
ed (
g l⁻¹
)
0
5
10
15
20
25
30
0 50 100 150 200 250
To
tal
co
lon
y f
orm
ing
un
iits
(*1
0⁷
cfu
ml⁻
¹)
Fermentation time (h)
EC-1118 18B S. bayanus 18B EC-1118 27B S. bayanus 27B

60
2.4.3. Acetic acid production
Acetic acid production differed between strains in the two fermentation conditions.
In both the 18°Brix and 27°Brix musts, acetic acid was produced in significantly higher
concentrations during the fermentation by EC-1118 compared to S. bayanus. In the 18°Brix
ferments, acetic acid concentrations increased during the first 23-56 hours of fermentation,
after which levels proceeded to decrease once the peak concentration was reached (Fig.
2.5A). As sugar consumption continued, acetic acid levels fluctuated slightly and gradually
increased towards the end of fermentation from the minimum concentration that was
achieved. In the 27°Brix ferments, starting levels of acetic acid at time zero were 5.7 times
higher than those observed in the low sugar treatments. During fermentation, acetic acid
levels decreased from the high starting concentrations after which levels increased and
remained relatively constant as sugar consumption continued.
With respect to yeast strain, fermentations by S. bayanus in the 18°Brix and 27°Brix
musts displayed the lowest acetic acid production during the process and in the final wine,
followed by EC-1118 in the low and high sugar conditions, respectively (Fig. 2.5B). As
yeast fermenting the two sugar conditions consumed different amounts of sugar, and yeast
metabolites are by-products of sugar consumption, the acetic acid produced was
normalized to the grams of sugar consumed and compared between strains in each
condition. Similar to the unnormalized data, S. bayanus produced significantly lower levels
of acetic acid in both the 18°Brix and 27°Brix conditions compared to EC-1118 fermenting
under the same sugar conditions (Fig. 2.6).

61
Figure 2.5: Acetic acid production during fermentation of table wine must and appassimento-
type must. Acetic acid was measured throughout the course of the fermentations (A), and the total
acetic acid production was compared between yeast strains in high versus low sugar environments
(B). Metabolite production was determined by substracting the concentration measured on day 0
of fermentation (inoculation day) from the level determined on the final day of fermentation.
Fermentations were performed in triplicate and samples from each treatment were analyzed in
duplicate, for an n = 6 for each measurement. The mean values (± SD) of the triplicate fermentations
are shown; where the error bars are not visible, they are within the symbol. Treatments were
compared to each other and analyzed statistically using analysis of variance (ANOVA) with mean
separation by Fisher’s Least Significant Difference (LSD) test (p< 0.05). In descending order,
lowercase letters indicate a unique group based on statistical difference using Fisher’s LSD0.05.
0.00
0.10
0.20
0.30
0.40
0.50
0 50 100 150 200 250 300 350 400
Ace
tic
aci
d (
g l⁻¹
)
Fermentation time (h)
EC-1118 18B S. bayanus 18B EC-1118 27B S. bayanus 27B
A
0.00
0.05
0.10
0.15
0.20
0.25
0.30
EC-1118 (18°Brix) S. bayanus (18°Brix) EC-1118 (27°Brix) S. bayanus (27°Brix)
Ace
tic
aci
d g
ener
ate
d (
g l⁻¹
)
B
b
c
a
d

62
Figure 2.6: Acetic acid produced/ sugar consumed during fermentation of table wine must
and appassimento-type must. Total acetic acid production was normalized to the amount of sugar
consumed during the course of the fermentations, and compared between yeast strains.
Fermentations were performed in triplicate and samples from each treatment were analyzed in
duplicate, for an n = 6 for each measurement. The mean values (± SD) of the triplicate fermentations
are shown. Treatments were compared to each other and analyzed statistically using analysis of
variance (ANOVA) with mean separation by Fisher’s Least Significant Difference (LSD) test (p<
0.05). In descending order, lowercase letters indicate a unique group based on statistical difference
using Fisher’s LSD0.05.
.
0.0000
0.0002
0.0004
0.0006
0.0008
0.0010
0.0012
0.0014
EC-1118 (18°Brix) S. bayanus (18°Brix) EC-1118 (27°Brix) S. bayanus (27°Brix)
Ace
tic
aci
d (
g l⁻¹
)/ S
ug
ar
con
sum
ed (
g l⁻¹
) a
b
a
c

63
2.4.4. Ethyl acetate production
Ethyl acetate production differed between strains in the two fermentation
conditions. As a general trend in most treatments, ethyl acetate production increased to a
peak concentration after which levels subsequently decreased as sugar consumption
continued (Fig. 2.7A). However, in the 27°Brix must fermented by S. bayanus, ethyl
acetate accumulation continued to increase slowly throughout the fermentation course,
reaching its peak concentration by only the final day of fermentation. Higher peak ethyl
acetate levels were obtained in the low sugar musts fermented by S. bayanus and EC-1118.
In the 18°Brix condition specifically, peak ethyl acetate production was 9.0-times higher
in the fermentation by S. bayanus and 3.7-times higher in the fermentation by EC-1118
compared to the same strains fermenting in the 27°Brix condition.
With respect to yeast strain, fermentation by S. bayanus in the 27°Brix must
displayed the lowest ethyl acetate production during the fermentation course and in the
final wine, followed by EC-1118 in the 27°Brix must, and S. bayanus and EC-1118,
respectively, in the 18°Brix must (Fig. 2.7B). Since ethyl acetate is a by-product of sugar
consumption, the ethyl acetate produced was normalized to the grams of sugar consumed
and compared between yeast strains in each fermentation condition. Similar to the
unnormalized data, S. bayanus tended to produce lower levels of ethyl acetate in both the
18°Brix must and 27°Brix must compared to EC-1118 fermenting under the same sugar
conditions (Fig. 2.8).
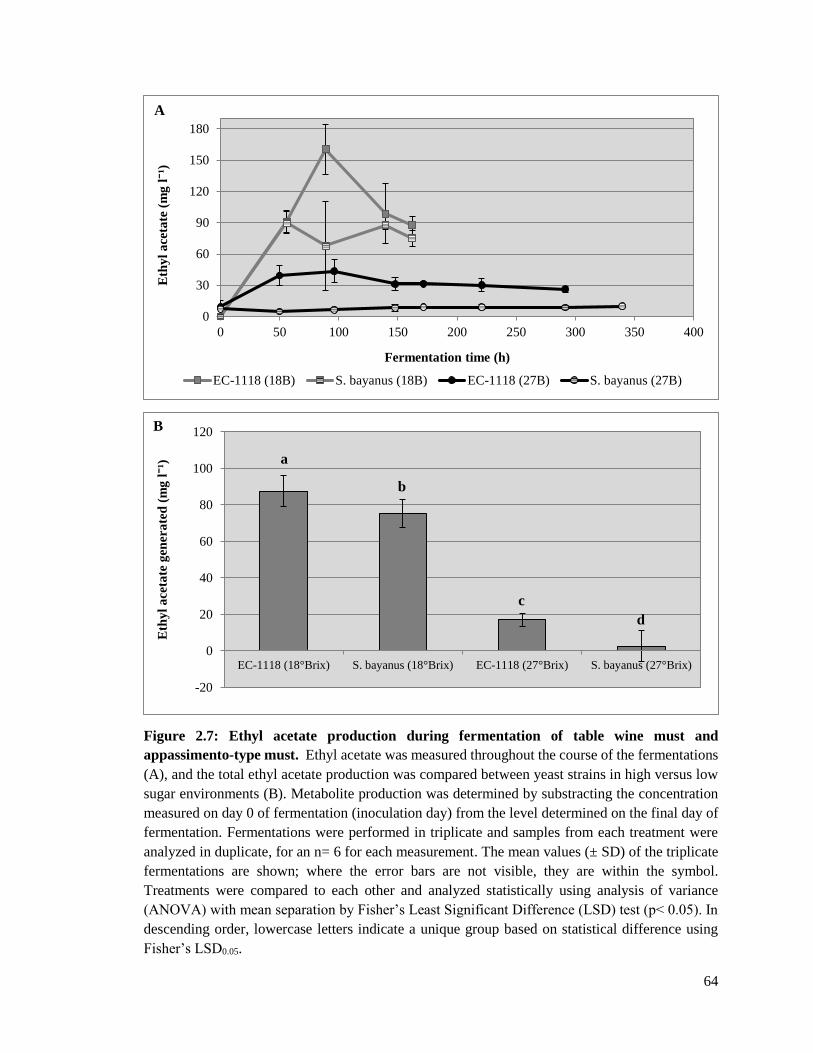
64
Figure 2.7: Ethyl acetate production during fermentation of table wine must and
appassimento-type must. Ethyl acetate was measured throughout the course of the fermentations
(A), and the total ethyl acetate production was compared between yeast strains in high versus low
sugar environments (B). Metabolite production was determined by substracting the concentration
measured on day 0 of fermentation (inoculation day) from the level determined on the final day of
fermentation. Fermentations were performed in triplicate and samples from each treatment were
analyzed in duplicate, for an n= 6 for each measurement. The mean values (± SD) of the triplicate
fermentations are shown; where the error bars are not visible, they are within the symbol.
Treatments were compared to each other and analyzed statistically using analysis of variance
(ANOVA) with mean separation by Fisher’s Least Significant Difference (LSD) test (p< 0.05). In
descending order, lowercase letters indicate a unique group based on statistical difference using
Fisher’s LSD0.05.
0
30
60
90
120
150
180
0 50 100 150 200 250 300 350 400
Eth
yl
ace
tate
(m
g l⁻¹
)
Fermentation time (h)
EC-1118 (18B) S. bayanus (18B) EC-1118 (27B) S. bayanus (27B)
A
-20
0
20
40
60
80
100
120
EC-1118 (18°Brix) S. bayanus (18°Brix) EC-1118 (27°Brix) S. bayanus (27°Brix)
Eth
yl
ace
tate
gen
era
ted
(m
g l⁻¹
)
B
a
b
c
d

65
Figure 2.8: Ethyl acetate produced/ sugar consumed during fermentation of table wine must
and appassimento-type must. Total ethyl acetate production was normalized to the amount of
sugar consumed during the course of the fermentations, and compared between yeast strains.
Fermentations were performed in triplicate and samples from each treatment were analyzed in
duplicate, for an n= 6 for each measurement. The mean values (± SD) of the triplicate fermentations
are shown. Treatments were compared to each other and analyzed statistically using analysis of
variance (ANOVA) with mean separation by Fisher’s Least Significant Difference (LSD) test (p<
0.05). In descending order, lowercase letters indicate a unique group based on statistical difference
using Fisher’s LSD0.05.
-0.100
0.000
0.100
0.200
0.300
0.400
0.500
0.600
EC-1118 (18°Brix) S. bayanus (18°Brix) EC-1118 (27°Brix) S. bayanus (27°Brix)
Eth
yl
ace
tate
(m
g l⁻¹
)/ S
ug
ar
con
sum
ed
(g
l⁻¹
)
a
b
cc

66
2.4.5. Metabolomics analysis towards understanding acetic acid and ethyl acetate
formation
2.4.5.1. S. cerevisiae EC-1118 fermenting under high and low sugar stress
Ethyl acetate production was compared amongst yeast strains in high versus low
sugar environments to determine its relationship to the stress response of wine yeast to high
sugar conditions (Fig. 2.7B). Lower levels of ethyl acetate were produced by both yeast
strains fermenting the 27˚Brix must compared to the 18˚Brix must.
The kinetics of metabolite formation during fermentation in the high and low sugar
conditions were compared within yeast strains strains to understand the factors contributing
to acetic acid and ethyl acetate production (Fig 2.9). In brief, 27˚Brix must fermented by
EC-1118 formed higher levels of glycerol, acetaldehyde, ethanol and acetic acid during the
fermentation course, and lower levels of ethyl acetate compared to EC-1118 fermenting
the 18˚Brix must (Fig. 2.9). In both conditions, an initial increase in glycerol concentration
was followed by a plateau, resulting in final levels 1.6-times higher in the 27˚Brix condition
(12.14 ± 0.34 g l-1) compared to the 18˚Brix condition (7.79 ± 0.22 g l-1).
As glycerol continued to form, acetaldehyde was also produced as one of the early
metabolic by-products of fermentation. Acetaldehyde production occurred between 0 and
89 hours of fermentation in the low sugar must, and between 0 to 50 hours in the high sugar
must. Peak acetaldehyde levels were determined to be the highest in the 27˚Brix condition,
measuring 90.6 ± 5.1 mg l-1. Concentrations in both sugar conditions eventually decreased
and then plateaued, resulting in levels 1.7-times higher in the appassimento-style wine
(81.9 ± 8.9 mg l-1) compared to the table wine (48.8 ± 4.0 mg l-1).
67
At the same time as acetaldehyde levels were decreasing, an increase in ethanol,
acetic acid, and ethyl acetate occurred in both fermentations. Ethanol was produced more
rapidly in the table wine must condition in comparison to the appassimento-type must
condition, although a higher production level was measured in the latter (Fig. 2.2B). As
yeast fermenting the two sugar conditions consumed different amounts of sugar and yeast
metabolites are by-products of sugar consumption, ethanol production was normalized to
the grams of sugar consumed. For the amount of sugar consumed by EC-1118 in each
fermentation condition, ethanol production was not significantly different (Fig 2.3).
As ethanol continued to increase, acetic acid was simultaneously produced. In the
18˚Brix must, acetic acid reached its peak concentration within 56 hours of fermentation
(0.32 ± 0.03 g l-1), after which levels decreased and fluctuated between concentrations of
0.19 ± 0.03 g l-1 and 0.21 ± 0.01 g l-1 as sugar consumption continued. In contrast, in the
27˚Brix must, acetic acid levels initially decreased in the first 56 hours of fermentation,
after which an increase was observed up until the final day of fermentation when a peak
concentration of 0.41 ± 0.03 g l-1 was determined in the wine. By the end of fermentation,
acetic acid production was 2.1-times higher in the 27˚Brix condition (0.41 ± 0.03 g l-1)
compared to the 18˚Brix condition (0.20 ± 0.04 g l-1).
Ethyl acetate production was also found to differ between the two sugar conditions.
In contrast to ethanol and acetic acid production, ethyl acetate formed to a much lower
level during fermentation in the 27˚Brix must versus the 18˚Brix must, although production
trends were similar. Ethyl acetate production was 5.2-times lower in the 27˚Brix condition
in comparison to the 18˚Brix condition, resulting in 26 ± 3 mg l-1 and 88 ± 9 mg l-1,
respectively, on the final day of fermentation.

68
Figure 2.9: Metabolite production during fermentation by S. cerevisiae EC-1118.
Fermentations of appassimento-type must () and table wine must () were monitored for (a)
glycerol, (b) acetaldehyde, (c) ethanol, (d) acetic acid and (e) ethyl acetate formation during
fermentation, and compared between sugar conditions. Metabolite production was determined by
substracting the concentration measured on day 0 of fermentation (inoculation day) from the level
determined on the final day of fermentation. Fermentations were performed in triplicate and
samples from each treatment were analyzed in duplicate, for an n = 6 for each measurement. The
mean values (± SD) of the triplicate fermentations are shown; where the error bars are not visible,
they are within the symbol.

69
2.4.5.2. S. bayanus fermenting under high and low sugar stress
Appassimento-type must fermented by S. bayanus formed higher levels of glycerol
and ethanol during the course of the fermentation, and lower levels of acetaldehyde, acetic
acid and ethyl acetate (Fig. 2.10) in comparison to table wine. In both fermentation
conditions, an initial increase in glycerol was followed by a plateau, resulting in levels 1.6-
times higher in the 27˚Brix condition (14.53 ± 0.16 g l-1) compared to the 18˚Brix condition
(9.33 ± 0.43 g l-1) on the final day of fermentation.
As glycerol continued to form, acetaldehyde was also produced as one of the early
metabolic by-products of fermentation. Acetaldehyde production occurred between 0 and
65 hours of fermentation in the low sugar must, and between 0 to 89 hours in the high sugar
must. Peak levels were the highest in the 27˚Brix ferment, measuring 101.9 ± 1.0 mg l-1.
Acetaldehyde levels in both sugar conditions eventually decreased and then plateaued,
resulting in levels 1.3-times higher in the appassimento-style wine (58.9 ± 3.7 mg l-1)
compared to the table wine (46.9 ± 0.9 mg l-1).
At the same time as acetaldehyde levels were decreasing, an increase in ethanol and
ethyl acetate production occurred in both fermentations. Ethanol was produced more
rapidly in the 18˚Brix condition in comparison to the 27˚Brix condition, although a higher
production level was measured in the latter (Fig. 2.2B). As yeast fermenting the two sugar
conditions consumed different amounts of sugar and yeast metabolites are by-products of
sugar consumption, ethanol production was normalized to the grams of sugar consumed.
For the amount of sugar consumed by S. bayanus in each fermentation condition, ethanol
production was not significantly different (Fig 2.3).

70
As ethanol concentration continued to increase, acetic acid was simultaneously
produced. Acetic acid levels decreased from the high starting concentration measured at
time zero in the 27˚Brix condition and then plateaued, while concentrations were observed
to increase at the beginning of fermentation in the 18˚Brix must. In this condition, acetic
acid reached its peak concentration within 23 hours of fermentation (0.14 ± 0.00 g l-1) after
which levels decreased and then fluctuated between concentrations of 0.03 ± 0.01 g l-1 and
0.09 ± 0.01 g l-1 as sugar consumption continued. However, acetic acid levels were
determined to be 1.3-times higher in the 27˚Brix must condition (0.12 ± 0.01 g l-1)
compared to the 18˚Brix must (0.09 ± 0.01 g l-1) by the end of fermentation.
Ethyl acetate production was also found to differ between the two sugar conditions.
Similar to the result determined for acetic acid production, ethyl acetate formed to a much
lower level during fermentation in 27˚Brix must versus 18˚Brix must. Ethyl acetate
production was 27.6-times lower in the 27˚Brix condition in comparison to the 18˚Brix
condition, resulting in 10 ± 1 mg l-1 and 75 ± 3 mg l-1, respectively, measured on the final
day of fermentation.

71
Figure 2.10: Metabolite production during fermentation by S. bayanus. Fermentations of
appassimento-type must () and table wine must () were monitored for (a) glycerol, (b)
acetaldehyde, (c) ethanol, (d) acetic acid and (e) ethyl acetate formation during fermentation, and
compared between sugar conditions. Metabolite production was determined by substracting the
concentration measured on day 0 of fermentation (inoculation day) from the level determined on
the final day of fermentation. Fermentations were performed in triplicate and samples from each
treatment were analyzed in duplicate, for an n = 6 for each measurement. The mean values (± SD)
of the triplicate fermentations are shown; where the error bars are not visible, they are within the
symbol.
72
2.5. Discussion
2.5.1. Understanding acetic acid and ethyl acetate formation during fermentation
In enzyme-catalyzed reactions, the amount of product can be controlled by
substrate availability, the enzyme activity or a combination of both. Increased substrate
availability or enzyme activity will increase the amount of product formed in the 27°Brix
condition, while limited substrate availability or decreased enzyme activity will reduce the
amount of product. In order to understand the factors controlling acetic acid and ethyl
acetate formation during fermentation in high sugar grape must, such as that produced
using an appassimento-type process, factors contributing to the production of these
metabolites were measured and will be discussed.
2.5.2. Acetic acid production during fermentation
Higher levels of acetic acid were produced in the appassimento-style wine
fermented by EC-1118 in comparison to the table wine. During the fermentation by S.
bayanus, acetic acid levels also reached higher concentrations in the 27˚Brix condition
compared to that in the 18˚Brix condition. However, lower levels of acetic acid were
produced by the final day of the 27°Brix fermentation due to the high starting concentration
measured at time zero in this condition and the low levels that formed as the fermentation
progressed. The reason for elevated acetic acid production by wine yeast under
hyperosmotic stress is still unresolved, but may be due to a combination of metabolic and
transcriptional regulation, leading to a build-up of acetic acid due to a lack of further
conversion to acetylCoA (Pigeau and Inglis 2005; 2007; Martin 2008).
From Figure 2.11, acetaldehyde can be reduced to ethanol by alcohol
dehydrogenase or oxidized to acetic acid by aldehyde dehydrogenase. During fermentation
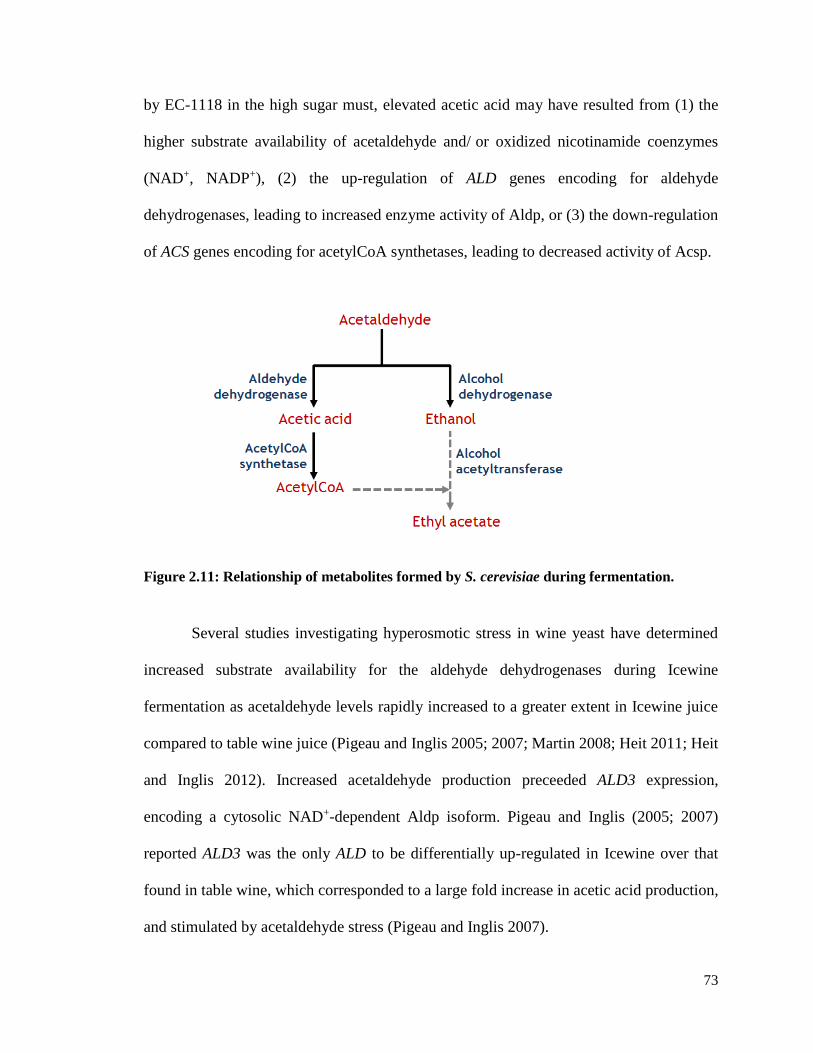
73
by EC-1118 in the high sugar must, elevated acetic acid may have resulted from (1) the
higher substrate availability of acetaldehyde and/ or oxidized nicotinamide coenzymes
(NAD+, NADP+), (2) the up-regulation of ALD genes encoding for aldehyde
dehydrogenases, leading to increased enzyme activity of Aldp, or (3) the down-regulation
of ACS genes encoding for acetylCoA synthetases, leading to decreased activity of Acsp.
Figure 2.11: Relationship of metabolites formed by S. cerevisiae during fermentation.
Several studies investigating hyperosmotic stress in wine yeast have determined
increased substrate availability for the aldehyde dehydrogenases during Icewine
fermentation as acetaldehyde levels rapidly increased to a greater extent in Icewine juice
compared to table wine juice (Pigeau and Inglis 2005; 2007; Martin 2008; Heit 2011; Heit
and Inglis 2012). Increased acetaldehyde production preceeded ALD3 expression,
encoding a cytosolic NAD+-dependent Aldp isoform. Pigeau and Inglis (2005; 2007)
reported ALD3 was the only ALD to be differentially up-regulated in Icewine over that
found in table wine, which corresponded to a large fold increase in acetic acid production,
and stimulated by acetaldehyde stress (Pigeau and Inglis 2007).

74
Furthermore, Martin (2008) determined two acetylCoA synthestaes, encoded by
ACS1 and ACS2, to be strongly down-regulated during fermentation in Icewine juice over
that found in table wine juice, resulting in a 19-fold and 11-fold reduction in ACS1 and
ACS2 expression, respectively. In addition, two-fold lower levels of ethyl acetate were
determined in Icewine (60 mg l-1) compared to that found in table wine (120 mg l-1) (Heit
2011; Heit and Inglis 2012; 2013), whereby acetylCoA is required for esterification to
ethanol by alcohol acetyltransferases in yeast-catalyzed ethyl acetate production (Fig.
2.11). Thus, lower ethyl acetate formation in appassimento-style wine by S. cerevisiae may
be due to lower acetylCoA levels resulting from lower Acsp activity, which would reduce
the amount of substrate available to alcohol acetyltransferases for catalysis.
In agreement with these findings, S. cerevisiae EC-1118 showed a 41.2% increase
in acetic acid concentration in appassimento-style wine compared to table wine (Appendix
1, Table 1). Taken together, the increased expression of ALD3 in conjunction with the
down-regulation of ACS genes, as observed in the Icewine fermentation studies, may
contribute to the elevated levels of acetic acid in appassimento-style wine. The increased
gene expression of ALD3 should increase the activity level of the corresponding enzyme,
leading to increased conversion of acetaldehyde to acetic acid with the concomitant
reduction of NAD+ to NADH. On the other hand, the decreased gene expression of ACS2
would reduce the activity level of Acs2p, resulting in a decrease in the transformation of
acetic acid to acetylCoA and the accumulation of acetic acid.

75
2.5.3. Ethyl acetate production during fermentation
Lower levels of ethyl acetate were produced in appassimento-style wine in
comparison to table wine. From Figure 2.11, ethyl acetate can be formed from the
esterification of acetylCoA with ethanol by alcohol acetyltransferases. During the high
sugar fermentations, lower levels of ethyl acetate may have formed as a consequence of
(1) the decreased expression of ACS genes encoding for acetylCoA synthetases, leading to
decreased enzyme activity of Acsp, (2) the lower substrate availability of acetylCoA and/
or ethanol in fermenting yeast cells, or (3) the decreased expression of ATF genes encoding
for alcohol acetyltranferases, leading to decreased Atfp activity.
Martin (2008) showed a decrease in the expression levels of ACS1 and ACS2 during
fermentation in Icewine juice. Under Icewine fermentation conditions, low ACS2
expression in osmotically stressed cells may reduce the concentration of acetylCoA
available to alcohol acetyltransferases for ethyl acetate formation as a result of its lack of
conversion from acetate. When considering substrate availability further, ethanol
production was significantly higher in strains fermenting under high sugar stress versus
low sugar stress as the apasssimento-type must contained higher initial sugar
concentrations as a result of the kiln-drying process and the yeasts fermented these wines
to dryness. The higher ethanol levels in the resulting appassimento-style wines would, if
anything, provide higher substrate availability for ethyl acetate formation, but lower ethyl
acetate levels were determined. However, the ethanol obtained in the 27˚Brix ferments
would unlikely be a limiting substrate contributing to low ethyl acetate formation in the
appassimento-style wines because its concentration was so high. Likely, the limiting
substrate was acetylCoA, although levels were not measured to verify this.
76
2.5.4. Strain differences in acetic acid and ethyl acetate production
Significantly lower levels of acetic acid and ethyl acetate were produced in
appassimento-style wine fermented by S. bayanus. In comparison to S. cerevisiae EC-1118,
S. bayanus displayed lower acetic acid and ethyl acetate production as a function of time
(Appendix 1, Figure 8) and in the final wine (Appendix 1, Table 1). S. bayanus also
displayed lower ratios of acetic acid and ethyl acetate production to sugar consumed,
indicating that each metabolite was produced at different concentrations across the two
strains when the same amount of sugar was consumed (Appendix 1, Table 3). Differences
in acetic acid and ethyl acetate production between wine yeasts may be due to (1) substrate
availability or (2) enzyme activity.
During alcoholic fermentation, acetic acid can form from the oxidation of
acetaldehyde by aldehyde dehydrogenase, along with the concomitant reduction of
NAD(P)+ to NAD(P)H (Fig. 2.11). With respect to substrate availability for aldehyde
dehydrogenase, yeast strains differed in the concentrations of acetaldehyde produced in the
appassimento-style wines, with S. bayanus producing significantly lower levels in
comparison to EC-1118. Thus, it is possible that the lower acetaldehyde levels produced
by S. bayanus contributed to lower acetic acid formation during fermentation. At lower
concentrations, less acetaldehyde would be available as a substrate for aldehyde
dehydrogenase reducing the level of acetic acid formed. Yeast-catalyzed acetic acid
biosynthesis is also influenced by NAD(P)+ availability and aldehyde dehydrogenase
activity, both of which at low levels would also reduce acetic acid formation. However,
these variables were not measured to define their contributions to higher acetic acid
formation by S. cerevisiae and lower acetic acid formation by S. bayanus.

77
As alcoholic fermentation progresses, acetylCoA can form from acetic acid via the
pyruvate dehydrogenase bypass in a reaction catalyzed by acetylCoA synthetase (Fig.
2.11). In a subsequent reaction, acetylCoA can esterify with ethanol to form ethyl acetate
in a reaction catalyzed by alcohol acetyltransferase. With respect to substrate availability,
S. bayanus and S. cerevisiae strains differed in the concentrations of acetic acid produced.
Of the two strains, S. bayanus displayed lower acetic acid production during the
fermentation course and in the final wine compared to EC-1118. Although significant
differences in acetic acid production existed between strains, no significant differences in
ethanol concentration were determined. In addition, the ethanol obtained in the 27˚Brix
ferments would unlikely be a limiting substrate contributing to lower ethyl acetate
formation by S. bayanus because its concentration was high in all treatments. Likely, the
limiting substrate was acetylCoA, but differences in its availability between strains were
not measured to verify this. Although it is possible that the lower acetic acid produced by
S. bayanus contributed to lower ethyl acetate formation, the activity levels of acetylCoA
synthetases and alcohol acetyltransferases were also not measured, and therefore their
contributions are unclear.
Furthermore, it is possible that S. cerevisiae and S. bayanus strans differed in their
biosynthetic requirements for acetic acid and in its conversion to other metabolites. Viable
cell concentrations differed between strains fermenting under increased osmotic stress as
the EC-1118 ferment reached a higher peak cell concentration compared to that obtained
in the S. bayanus ferment (Fig. 2.4). As a result of differences in viable cell density, yeast
strains may have differed in their metabolic needs for various biosynthetic reactions, such
as those involved in lipid and ergosterol synthesis, which require the input of acetylCoA,
78
as well as ester synthesis. A higher demand for acetylCoA to support yeast cell growth
would increase acetic acid degradation, while also decreasing its availability for ethyl
acetate formation. One of the aforementioned limitations of this study was that yeast strains
were not evaluated for their metabolic production of acetylCoA. As a result, the kinetics of
this metabolite could not be compared between wine yeasts to determine its contribution
to acetic acid and ethyl acetate formation during fermentation in high sugar grape must.
Moreover, it is also possible that S. cerevisiae and S. bayanus strains differed in
their hyperosmotic stress response to the high sugar environment. During fermentation in
appassimento-type must, S. bayanus produced a higher concentration of glycerol in
comparision to EC-1118, indicating that this strain may require more glycerol to act as a
compatible solute for adaptation to the high osmotic stress, or that they have decreased
ability to retain glycerol as an osmolyte in the cytoplasm upon hyperosmotic shock, hence
the higher levels measured in the final wine (Erasmus et al. 2004).
However, the higher concentration of glycerol produced by S. bayanus did not
result in a higher level of acetic acid when compared to the level produced by EC-11118.
Under high osmolarity, higher acetic acid production would be expected as it has been
implicated in NADH regeneration in response to glycerol overproduction by yeast
fermenting under increased osmotic stress, possibly to compensate for the high levels of
NAD+ produced. The results obtained herein demonstrate that yeast strains fermenting
under the same condition of osmotic pressure may respond differently to the stress,
producing different concentrations of glycerol and acetic acid for cytosolic osmotic and
redox balance, respectively. However, the higher glycerol and lower acetic acid levels
produced by S. bayanus in comparison to EC-1118 in the 27°Brix ferments also suggest
79
that S. bayanus cells may not depend on acetic acid biosynthesis for NADH regeneration
under high osmolarity, but instead rely on a different mechanism for maintaining redox
balance within the NAD+: NADH coenzyme system during adaptation to high sugar stress.
2.5.5. Application of S. bayanus to appassimento-style winemaking
Wine yeasts can produce acetic acid as a by-product of the hyperosmotic stress
response resulting from high sugar concentrations in grape must. In the presence of ethanol,
acetic acid can lead to the formation of ethyl acetate, another volatile compound that can
further impact wine quality, often causing volatile acid levels to exceed legal limits
(Erasmus et al. 2004). Prior to this study, strain differences in fermentation performance
and metabolite formation between S. cerevisiae and S. bayanus strains had only been
evaluated in Icewine (Heit 2011; Heit and Inglis 2013). These Icewine studies illustrated
the effect of wine yeast on the production of high volatile acidity during Icewine
fermentation and emphasized the importance of the choice of yeast strain. Although S.
bayanus produced significantly less acetic acid per gram of sugar metabolized compared
to S. cerevisiae K1-V1116 fermenting Icewine juice and demonstrated trends consistent
with lower ethyl acetate production, it exhibited fermentation difficulties during Icewine
fermentation (Heit 2011; Heit and Inglis 2013). The increased osmotic stress placed on S.
bayanus negatively impacted cell growth and sugar consumption, as reflected in the longer
lag phase at the start of fermentation, the lower cell population, the prolonged fermentation
time, and the lower ethanol production, thereby making it a poorer fermenter in Icewine
juice in comparison to S. cerevisiae.
In contrast to the Icewine studies, the results reported in this appassimento study
demonstrated S. cerevisiae EC-1118 and S. bayanus to be similar in their kinetic behaviour

80
during fermentation. Between strains, sugar consumption and ethanol production levels
were comparable, and fermentation lengths only differed by approximately two days, with
S. bayanus lagging behind. However, S. bayanus produced significantly lower levels of
acetic acid and ethyl acetate compared to S. cerevisiae fermenting appassimento-type must.
Thus, the strong fermentation capability of S. bayanus, in combination with its low VA
generation in response to increased osmotic stress, make it a suitable yeast strain for the
production of appassimento-style wine and a possible candidate for commercialization, at
least over the sugar concentration range tested in the 27°Brix condition. Future studies
should target the optimal sugar concentration range over which S. bayanus is able to
complete the fermentation and/ or to reach the desired ethanol level for the wine style.
2.6. Conclusions
This study investigated the different acetic acid and ethyl acetate production
capacities of two wine yeasts fermenting under high and low sugar conditions. S. cerevisiae
EC-1118 formed higher levels of acetic acid and lower levels of ethyl acetate in
appassimento-style wine compared to table wine, while S. bayanus formed lower levels of
both metabolites under increased sugar stress. Between strains, S. bayanus produced less
acetic acid and ethyl acetate compared to EC-1118 in both fermentation conditions. In light
of strain differences in metabolite formation, wine yeasts displayed appreciable capability
to overcome osmotic stress and to yield ethanol fermenting the concentrated grape must.
Between strains, sugar utilization and ethanol production levels were comparable as no
significant differences were determined, although differences in viable cell concentration
existed.

81
2.7. Literature Cited
Barbanti, D., B. Mora, R. Ferrarini, G.B. Torniella and M. Cipriani. 2008. Effect of various
thermo-hygrometric conditions on the withering kinetics of grapes used from the
production of “Amarone” and “Recioto” wines. J Food Eng. 85:350-358.
Bellincontro, A., D. De Santis, R. Botondi, I. Villa and F. Mencarelli. 2004. Different
postharvest dehydration rates affect quality characteristics and volatile compounds of
Malvasia, Trebbiano and Sangiovese grapes for wine production. J of the Sci Food Agr.
84:1791-1800.
Blomberg, A. and L. Alder. 1989. Roles of glycerol and glycerol-3-phosphate
dehydrogenase (NAD+) in acquired osmotolerance of Saccharomyces cerevisiae. J
Bacteriol. 171:1087-1092.
Blomberg, A. 2000. Metabolic surprises in Saccharomyces cerevisiae during adaptation to
saline conditions: questions, some answers, and a model. FEMS Microbiol Lett. 182:1-8.
Brewster, J.L., T. de Valoir, N.D. Dwyer, E. Winter and M.C. Gustin. 1993. An
osmosensing signal transduction pathway in yeast. Science. 259:1760-1763.
Bro, C., B. Regenberg, G. Lagniel, J. Labarre, M. Montero-Lomeli and J. Nielsen. 2003.
Transcriptional, proteonomic, and metabolic responses to lithium in galactose-grown yeast
cells. J Biol Chem. 278:31141-32149.
Bruinenberg, P.M., J.P. van Dijken, and W.A. Scheffers. 1983. A theoretical analysis of
NADPH production and consumption in yeasts. J. Gen Microbiol. 129:953-964.
Chkaiban, L., R. Botondi, A. Bellincontro, D. De Santis, P. Kefalas and F. Mencarelli.
2007. Influence of post-harvest water stress on lipoxygenase and alcohol dehydrogense
activities, and on the composition of some volatile compounds in Gewürztraminer grapes
dehydrated under controlled and uncontrolled thermohygrometric conditions. Aust J Grape
Wine Res. 13:142-149.
Constantini, V., A. Bellicontro, D. De Santis, R. Botondi and F. Mencarelli. 2006.
Metabolic changes of Malvasia grapes for wine production during postharvest drying. J
Agric Food Chem. 54:3334-3340.
Erasmus, D.J., G.K. van der Merwe and H.J. van Vuuren. 2003. Genome-wide expression
analyses: metabolic adaptation of Saccharomyces cerevisiae to high sugar stress. FEMS.
34:375-399.

82
Erasmus, D.J. and H.J.J. van Vuuren. 2009. Genetic basis for osmosensitivity and genetic
instability of the wine yeast Saccharomyces cerevisiae V1N7. Am J Enol Vitic. 60:145-
154.
Erasmus, D.J., M. Cliff and H.J.J. van Vuuren. 2004. Impact of yeast strain on the
production of acetic acid, glycerol, and the sensory attributes of Icewine. Am J Enol Vitic.
55:371-378.
Hakimi Rezaei, J. and A.G. Reynolds. 2010. Characterization of Niagara peninsula
Cabernet franc wines by sensory analysis. Am J Enol Vitic. 61:1-14.
Heit, C. and D. Inglis. 2013. Acetic acid and ethyl acetate production during high brix
fermentations: effect of yeast strain. Am J Enol Vitic. 64:4.
Heit, C. and D. Inglis. 2012. An investigation of the relationship between ethyl acetate
production and osmotics in Saccharomyces cerevisiae K1-V1116 during high brix
fermentations. Am J Enol Vitic. 63:4.
Heit, C. 2011. Effect of yeast strain and sugar concentration on ethyl acetate production in
Icewine juice. BSc Hons Thesis. Brock University, ON.
Hohmann, S. 2002. Osmotic stress signaling and osmoadaptation in yeasts. Microbiol Mol
Biol Rev. 66:300-371.
Jackson, D.I. and P.B. Lombard. 1993. Environmental and management practices affecting
grape composition and wine quality- a review. Am J Enol Vitic. 44:409-430.
Jones G.V. and E. Hellman. 2002. “Site assessment” in Oregon Viticulture. Edward
Hellman, Editor, 5th Edition, OSU Press, 2002.
Kontkanen, D., D. Inglis, G. Pickering and A. Reynolds. 2004. Effect of yeast inoculation
rate, acclimatization, and nutrient addition on Icewine fermentation. Am J Enol Vitic.
55:363-370.
López de Lerma, N. and R.A. Peinado. 2011. Use of two osmoethanol tolerant yeast strain
to ferment from Tempranillo dried grapes: effect on wine composition. Int J Food
Microbiol. 145:342-348.
Martin, S.J. and D. Inglis. 2006. Yeast osmoadaptive response during Icewine
fermentation. Am J Enol Vitic. 57:527.
Martin, S.J. 2008. The osmoadaptive response of the wine yeast S. cerevisiae K1-V1116
during Icewine fermentation. PhD Thesis. Brock University, ON.
83
Meaden, P.G., F.M. Dickinson, A. Misfud, W. Tessier, J. Westwater, H. Bussey and M.
Midgley. 1997. The ALD6 gene of Saccharomyces cerevisiae encodes a cytosolic, Mg2+-
activated acetaldehyde dehydrogenase. Yeast. 13:1319-1327.
Mencarelli, F., A. Bellincontro, I. Nicoletti, M. Cirilli, R. Muleo and D. Corradini. 2010.
Chemical and biochemical change of healthy phenolic fractions in winegrape by means of
postharvest dehydration. J Agric Food Chem. 58:7557-7564.
Mollapour, M. and P.W. Piper. 2007. Hog1 mitogen-activated kinase phosphorylation
targets the yeast Fps1 aquaglyceroporin for endocytosis, thereby rendering cells resistant
to acetic acid. Mol Cell Biol. 27:6446-6456.
Moreno, J.J., F. Cerpa-Calderón, S.D. Cohen, Y. Fang, M. Qian and J.A. Kennedy. 2008.
Effect of postharvest dehydration on the composition of Pinot noir grapes (Vitis vinifera
L.) and wine. Food Chem. 1009:755-762.
Navarro-Avino, J.P., R. Prasad, V.J. Miralles, R.M. Benito and R. Serreno. 1999. A
proposal of nomenclature of aldehyde dehydrogenases in Saccharomyces cerevisiae and
characterization of the stress-inducible ALD2 and ALD3 genes. Yeast. 15:829-842.
Neviogt, E. and U. Stahl. 1997. Osmoregulation and glycerol metabolism in the yeast
Saccharomyces cerevisiae. FEMS Microbiol Rev. 213:231-271.
Nordström, K. 1962. Formation of ethyl acetate in fermentation with brewer’s yeast III:
participation of coenzyme A. J Inst Brew. 68:398-407.
Nordström, K. 1963. Formation of ethyl acetate in fermentation with brewer’s yeast IV:
metabolism of acetyl coenzyme A. J Inst Brew. 69:142-153.
Påhlman, A.K., K. Granath, R. Ansell., S. Hohmann and L. Alder. 2001. The yeast glycerol
3-phosphatases Gpp1p and Gpp2p are required for glycerol biosynthesis and differentially
involved in the cellular responses to osmotic, anaerobic, and oxidative stress. Biol Chem.
276:3555-3563.
Pigeau, G.M. and D.L. Inglis. 2007. Response of wine yeast (Saccharomyces cerevisiae)
aldehyde dehydrogenase to acetaldehyde stress during Icewine fermentation. J Appl
Microbiol. 103:1576-1586.
Pigeau, G.M. and D.L. Inglis. 2005. Upregulation of ALD3 and GPD1 in Saccharomyces
cerevisiae during Icewine fermentation. J Appl Microbiol. 99:112-125.
Pigeau, G.M., E. Bozza, K. Kaiser and D.L. Inglis. 2007. Concentration effect of Riesling
Icewine juice on yeast performance and wine acidity. J Appl Microbiol. 103:1961-1698.

84
Pronk, J.T., H.Y. Steensma and J.P. van Dijken. 1996. Pyruvate metabolism in
Saccharomyces cerevisiae. Yeast. 12:1607-1633.
Rep, M., M. Krantz, J.M. Thevelein and S. Hohmann. (2000) The transcriptional
response of Saccharomyces cerevisiae to osmotic shock. J Biol Chem. 275:8290-8300.
Remize, F., E. Andrieu and S. Dequin. 2000. Engineering of the pyruvate dehydrogenase
bypass in Saccharomyces cerevisiae: role of the cytosolic Mg2+ and mitochondrial K+
acetaldehyde dehydrogenases Ald6p and Ald4p in acetate formation during alcoholic
fermentation. Appl and Environ Microbiol. 66:3151-3159.
Remize, F., J.L. Roustan, J.M. Sablayrolles, P. Barre and S. Dequin. 1999. Glycerol
overproduction by engineered Saccharomyces cerevisiae wine yeast strains leads to
substantial changes in by-product formation and to a stimulation of fermentation rate in
stationary phase. Appl Environ Microbiol. 65:143-149.
Remize, F., L. Barnavon and S. Dequin. 2001. Glycerol export and glycerol-3-phosphate
dehydrogenase, but not glycerol phosphatase, are rate limiting for glycerol production in
Saccharomyces cerevisiae. Metab Eng. 3:300-312.
Rizzini, F.M., C. Bonghia and P. Tonittib. 2009. Postharvest water loss induces marked
changed in transcript profiling in skins of wine grape berries. Postharvest Biol Technol.
52:247-253.
Saint-Prix. F., L. Bönquist and S. Dequin. 2004. Functional analysis of the ALD gene
family of Saccharomyces cerevisiae during anaerobic growth on glucose: the NADP+-
dependent Ald6p and Ald5p isoforms play a major role in acetate formation. Microbiol.
150:2209-2220.
Shaw, A. 2005. The Niagara peninsula viticultural area: a climatic analysis of Canada’s
largest wine region. J Wine Res. 16:85-103.
VQA Ontario. 2013A. The Niagara peninsula. Retrieved from:
http://www.vqaontario.com/Appellations/NiagaraPeninsula
VQA Ontario. 2013B. Wine standards. Retrieved from:
http://www.vqaontario.com/Regulations/Standards
Winkler, A.J. 1954. Effects of overcropping. Am J Enol Vitic. 5:4-12.
Zoecklein, B.W. 1994. Wine analysis and production. Chapman and Hall, New York.

85
Chapter 3
Evaluation of a UV Endpoint Enzymatic Method for Nicotinamide Coenzyme
Determination in Wine Yeast Cell Lysate
Heit, C.1,2 and D.L. Inglis1,2,3
1 Cool Climate Oenology and Viticulture Institute, Brock University, St. Catharines, ON,
Canada
2 Centre for Biotechnology, Brock University, St. Catharines, ON, Canada
3 Department of Biological Sciences, Brock University, St. Catharines, ON, Canada
Formatted for the Journal of Applied Microbiology
3.1. Abstract
Aims: This study describes an evaluation of nicotinamide coenzyme determinations by the
UV-endpoint method using a set of assay protocols outlined in Bergmeyer (1974) and the
enzymes alcohol dehydrogenase (ADH, NAD+ assay), glycerol-3-phosphate
dehydrogenase (GPDH, NADH assay), glucose-6-phosphate dehydrogenase (G6P-DH,
NADP+ assay), and glutamate dehydrogenase (GlDH, NADPH assay). The biochemical
interest of this determination lies in assessing the redox balance of the NAD+/ NADH and
NADP+/ NADPH coenzyme systems to determine their respective roles as metabolic
triggers for yeast-catalyzed acetic acid production.
Methods: The oxidized cofactors, NAD+ and NADP+, were quantified using pure ADH
and G6P-DH, respectively. ADH catalyzed the reduction of NAD+ to NADH and H+ by
the oxidation of ethanol to acetaldehyde, while G6P-DH catalyzed the oxidation of
glucose-6-phosphate to gluconate-6-phosphate, with the concomitant reduction of NADP+
to NADPH and H+. The amount of NADH or NADPH formed was followed at 340 nm
using a UV-Vis spectrophotometer, and directly proportional to the NAD+ or NADP+
concentration, respectively, present in the sample. The reduced cofactors, NADH and
NADPH, were quantified using pure GPDH and GlDH, respectively. GPDH catalyzed the
reduction of dihydroxyacetone phosophate to glycerol-3-phosphate, with the oxidation of
NADH to NAD+, while GlDH catalyzed the reductive amination of 2-oxoglutarate by
ammonia to form glutamate, with the reduction of NADPH to NADP+. The NADH or
NADPH content was evaluated spectrophotometrically at 340 nm.
Results and Comments: During development of the assay here, we report that working
assays for the measurement of NAD+, NADH, NADP+ and NADPH were established based
on a set of protocols outlined in Bergmeyer (1974). The method was optimized to include
a cell lysis buffer that was compatible with all assays, as well as filtration step to
86
deproteinize the lysate prior to coenzyme analyses. All assays underwent validation to
ensure the established protocols were accurate and reproducible.
Conclusions: The adapted technique indicated high linearity, accuracy and precision of
the analytical method but insufficient sensitivity for yeast extracts as the assays were
unable to accurately quantify the low concentrations present in the cell lysate samples.
Although the method was relatively simple, fast and inexpensive, further work is required
to increase the sensitivity of the coenzyme detection and quantification in yeast extract.
Keywords: Nicotinamide coenzymes, enzyme assays, UV-Vis spectrophotometer,
Saccharomyces cerevisiae, alcohol dehydrogenase, glycerol-3-phosphate dehydrogenase,
glucose-6-phosphate dehydrogenase, glutamate dehydrogenase.
3.2. Introduction
β-Nicotinamide adenine dinucleotide (NAD+) and β-Nicotinamide adenine
dinucleotide phosphate (NADP+) and their reduced forms (NADH and NADPH,
respectively) are ubiquitous biomolecules found in eukaryotic and prokaryotic organisms
(Xie 2008). In Saccharomyces cerevisiae, these coenzyme pairs play important roles as
electron acceptors/ donors in over 300 biochemical reactions involving oxidation and
reduction (Lui and Chen 2011; Forster et al. 2003), allowing them to have a critical effect
on the metabolic status and redox state of the cell (Heux et al. 2006). Enzymes involved in
these reactions are some of the most abundant and well-studied enzymes involved in energy
metabolism, including glycolysis and the tricarboxylic acid cycle, and the pentose
phosphate pathway (Kasimova et al. 2006). Due to the participation of coenzymes in these
metabolic reaction networks, maintaining redox homeostasis is an important requirement
for sustained metabolism and growth in all living cells (Vemuri et al. 2007).
Two pyridine nucleotide systems, NADH/ NAD+ and NADPH/ NADP+, determine
the intracellular redox state, primarily through the NADH: NAD+ ratio and to a lesser extent
by the NADPH: NADP+ ratio. Of the coenzymes, NADH is preferentially used as a
reducing equivalent that is produced and consumed mainly in catabolic reactions, while
87
NADPH functions mainly as a reducing equivalent in anabolic processes (Bakker et al.
2001; van Dijken and Scheffers 1986). Since NADH is highly involved in the metabolic
network, changes in the redox state of the NADH/ NAD+ system results in extensive
changes in yeast metabolism (Nielson 2003). Within the cell, carbon and nitrogen
metabolism are responsible for the biosynthesis of building blocks and macromolecules,
including proteins, lipids, DNA, RNA and carbohydrates (Nielson 2011). Therefore,
changes within the redox state negatively impacting cellular metabolic processes can affect
yeast cell function, growth and survival if balance is not restored.
To avoid nucleotide depletion and disruption of cellular redox balance, intracellular
rates of formation and consumption of NADH/ NAD+ and NADPH/ NADP+ must be
balanced (Nissen et al. 2001). Yeast redox metabolism is characterized by the absence of
transhydrogenase activity (van Dijken and Scheffers 1986), making it necessary for the
coenzyme systems to be separated within the yeast cell. As a consequence, maintenance of
intracellular redox balance demands that reduced coenzymes be re-oxidized in the
compartment where they are produced using distinct enzymatic mechanisms (Bakker et al.
2001) as opposed to transferring reducing equivalents between the coenzyme systems (van
Dijken and Scheffers 1986).
During sugar metabolism in yeast under anaerobic conditions, NADH generated in
glycolysis can be re-oxidized in the conversion of pyruvate to ethanol and carbon dioxide
during alcoholic fermentation, thereby making the process redox-neutral (Kukec et al.
2003). However, when yeast cells are subjected to conditions of high osmolarity, redox
balance within the NADH/ NAD+ coenzyme system is offset as their stress response leads
to the production of high levels of glycerol, the main osmolyte in S. cerevisiae (Blomberg
88
and Alder 1989; Brewster et al. 1993; Nevoigt and Stahl 1997; Blomberg 2000) while
alcoholic fermentation still progresses. The rate-limiting step in its biosynthesis is the
expression of glycerol-3-phosphate dehydrogenase (encoded by GPD1 and GPD2), which
catalyzes the reduction of dihydroxyacetone phosphate (DHAP) to glyceraldehyde-3-
phosphate, with the oxidation of NADH to NAD+ (Remize et al. 2001). In a subsequent
reaction, glycerol-3-phosphate is dephosphorylated by glycerol-3-phosphatases (encoded
by GPP1 and GPP2) to form glycerol (Påhlman et al. 2001).
Under hyperosmotic stress, yeast rely on metabolite formation to maintain
intracellular redox balance, specifically through redox reactions that can reduce the excess
NAD+ formed during glycerol biosynthesis. Acetic acid biosynthesis has been suggested
as a mechanism that yeast can use to balance excess NAD+ formed in response to
hyperosmotic stress by regenerating NADH (Blomberg and Alder 1989). The NADH
consumed during DHAP reduction could be provided by the NAD+-dependent oxidation
of acetaldehyde to acetic acid by a cytosolic aldehyde dehydrogenase (Aldp), resulting in
the reduction of NAD+ to NADH (Pigeau and Inglis 2007). But the main aldehyde
dehydrogenase to produce acetic acid has been reported as an NADP+-dependent form,
challenging the role of acetic acid production for balance of the NAD+/ NADH ratio
(Remize et al. 1999; Englinton et al. 2002; Erasmus and van Vuuren 2009).
To date, it remains unclear which cofactor system and Aldp isoform is responsible
for acetic acid production during high sugar fermentations. There are three cytosolic Aldp
isoforms in S. cerevisisae that can catalyze this reaction, two of which are NAD+-dependent
(encoded by ALD2 and ALD3) (Navarro-Avino et al. 1999) and one of which is NADP+-
dependent (encoded by ALD6) (Meaden et al. 1997). Previous research questions the
89
linkage of acetic acid production under hyperosmotic stress to glycerol production for
maintaining intracellular redox balance (Erasmus et al. 2003; Erasmus and van Vuuren
2009), and thus additional studies need to be conducted to define the contribution of each
isozyme to both elevated acetic acid and redox balance.
Current literature pertaining to elevated acetic acid during high sugar fermentations
is confusing and controversial as different Aldp isoforms with distinct cofactor specificities
have been suggested to be majorly responsible. Throughout Icewine fermentation, Pigeau
and Inglis (2005) found only ALD3 to be up-regulated in response to hyperosmotic shock,
which corresponded to an increase in acetaldehyde and acetic acid production. ALD3
displayed a 6.2-fold up-regulation on day 4 of fermentation over that found in the table
wine juice, and was the only ALD further up-regulated by acetaldehyde stress during
fermentation (Pigeau and Inglis 2007). Contrary to these findings, ALD2, -3, -4 and -6 were
all up-regulated in response to sugar-induced osmotic stress after brief exposure to
chaptalized grape juice (40% w/ v sugar) (Erasmus et al. 2003; Erasmus and van Vuuren
2009). ALD6 was expressed at the highest level, followed by ALD4 (Erasmus and van
Vuuren 2009), which is consistent with the findings of Remize et al. (2000). If transcript
levels do correlate with enzyme activity levels, Ald6p is suggested to have a major role in
acetic acid production, possibly as a way to compensate for the down-regulation of
NADPH generated through the pentose phosphate pathway (Bro et al. 2003; Erasmus and
van Vuuren 2009). However, coenzyme levels have not yet been measured in fermenting
yeast cells and will be fundamental in determining their impact on the metabolic regulation
of acetic acid production.
90
An essential part of the research lies in understanding the altered redox state of the
yeast cells during fermentation and elucidating their roles as metabolic triggers for acetic
acid production. For these determinations to be made, the ratio of NAD+/ NADH versus
NADP+/ NADPH in yeast before and after hyperosmotic stress under fermentative
conditions needs to be measured, which will enable the redox status of both coenzyme
systems to be assessed. The objective of this research was to develop a series of enzymatic
assays for measuring NAD+, NADP+, NADH and NADPH content in yeast cytosolic
extract using a UV-endpoint method based on a method outlined in Bergmeyer (1974), and
to critically evaluate the use of these assays for application to Icewine and other wine styles
involving high sugar juices.
3.3. Materials and Methods
3.3.1. Yeast strain. The commercial yeast Saccharomyces cerevisiae strain EC-1118 was
used for the analysis of assay methods for quantifying NAD+, NADH, NADP+ and NADPH
in cell extract and was acquired from Lallemand Inc. (Montreal, QB, Canada).
3.3.2. Culture media. For batch cultures, yeast cells were grown in a defined medium
made up of minerals and vitamins according to Verduyn et al. (1992) and supplemented
with glucose (20 g l-1) (Agrimi et al. 2011). The mineral concentrations per liter included:
(NH4)2SO4, 5 g; KH2PO4, 3 g; EDTA, 15 mg; MgSO4∙7H2O, 0.5 g; ZnSO4∙7H2O, 4.5 mg;
CoCl2∙6H2O, 0.3 mg; MnCl2∙4H2O, 1 mg; H3BO3, 1 mg; CuSO4∙5H2O, 0.3 mg;
CaCl2∙2H2O, 4.5 mg; FeSO4∙7H2O, 3 mg; NaMoO4∙2H2O, 0.4 mg; and KI, 0.1 mg. The
vitamin concentrations per liter included: biotin, 0.05 mg; nicotinic acid, 1 mg; calcium
pantothenate, 1 mg; inositol, 25 mg; thiamine HCl, 1 mg; pyridoxine HCl, 1 mg; and para-
amino benzoic acid, 0.2 mg. All individual stock solutions of the mineral components were
91
heat sterilized (120ºC) for 20 minutes and the vitamin mixture was filtered-sterilized
through a 0.22 µm grade filter (Millipore) prior to storage at 4°C. To prepare a 1x working
solution, appropriate volumes of the concentrated stock solutions were diluted with Milli-
RiOs water (RiOs-16; Millipore, Etobicoke, ON, Canada). The final solution was adjusted
to pH 5.0 with 1 N NaOH and filtered-sterilized through a 0.22 µm grade filter (Millipore)
under a vacuum.
3.3.3. Yeast inoculation procedure and growth conditions for batch cultures. Five
grams of active freeze dried yeast (S. cerevisiae EC-1118) were rehydrated in 50 ml of
sterile, 40°C water (RiOs-16; Millipore) for 15 minutes, gently swirling every 5 minutes
to encourage aeration. Thirty microliters of the EC-1118 starter culture were subsequently
plated on YPD media (1% yeast extract, 2% peptone, 2% dextrose, 2% agar) and incubated
in a growth chamber at 30°C before use (MIR-262; SANYO Electric Co., Ltd.). To prepare
the pre-culture, a loop-full of the yeast from a freshly streaked plate was inoculated into 50
ml of defined medium contained in a 500 ml Erlenmeyer flask. The pre-culture was grown
aerobically at 30°C with shaking at 160 rpm in a temperature-controlled orbital shaker
(Weiss Gallenkamp) until an optical density at 600 nm (OD600) of 0.4 to 0.7 was reached,
as determined using a UV-Vis Spectrophotometer (Spectronic Genesys™ 2). One milliliter
of the starter culture was then used to inoculate 100 ml batch cultures in 500 ml Erlenmeyer
flasks to a starting OD600 of ~0.002-0.010. Cultures were incubated at 30°C and 160 rpm
until an OD600 of 0.7 to 1.0 was reached to achieve approximately 1 g cell weight per 100
ml of culture.
3.3.4. Determination of yeast wet weight. Yeast wet weight was measured by the cell
pellet weight after centrifugation of the cell culture. A pre-determined volume of yeast

92
culture was removed from each batch culture, combined, and added to pre-weighed
centrifugation tubes. The cell suspensions were pelleted at 5000 rpm for 10 min at 4ºC
using a Sorvall RC5C Plus ultra-centrifuge (rotor model SS-34; Newtown, CT, USA), after
which the supernatants were decanted. The pellets were resuspended in sterile Milli-RiOs
water (RiOs-16; Millipore) and pelleted as before. After centrifugation, the supernatant
was decanted and the wet weight of the cells was determined by the difference in mass.
3.3.5. Determination of yeast dry weight. Yeast dry weight was determined using a filter
retention assay. A pre-determined volume of yeast culture was removed from each batch
culture, combined, and passed through a sterile, pre-weighed 0.22 µm grade filter
(Millipore) under a vacuum. Filters were washed twice with Milli-RiOs water (RiOs-16;
Millipore) and then dried at 60ºC for 2 days in an oven (MIR-212; SANYO Electric Co.,
Ltd.), after which time they were re-weighed. Dry weight was determined by the difference
in mass.
3.3.6. Preparation of yeast extracts for assays. To obtain a cytosolic yeast extract, the
following extraction protocol, modified from a procedure developed by Murdza-Inglis
(1995) and Agrimi et al. (2011), was followed. Once an OD600 of 0.7 to 1.0 was reached,
yeast cells were harvested in the late exponential phase by centrifugation using a Sorvall
RC5C Plus ultracentrifuge (rotor model SLA-3000). Yeast cells were pelleted at 5500 rpm
for 10 min at 4 ºC, washed once with 2 ml sterile Milli-RiOs water (RiOs-16; Millipore),
and were centrifuged as before. To prepare the whole cells for cell wall digestion, the pellet
was resuspended in 2 ml/ g (wet weight) of Tris-dithiothreitol (DTT) buffer (100 mM Tris-
H2SO4, pH 9.4; 10 mM DTT) and incubated for 20 minutes at 30 ºC in a temperature-
controlled orbital shaker (Weiss Gallenkamp) with gentle shaking (90 rpm). The treated

93
cells were then collected by centrifugation at 3500 rpm for 5 min at 4ºC using an SS-34
rotor. The pellet was resuspended in 2 ml spheroplast buffer (1.2 M sorbitol; 20 mM
potassium phosphate, pH 7.4) and the cells were centrifuged as before. After washing,
spheroplasts were prepared using Zymolyase-100T (Cedarlane Labs Ltd., Burlington, ON,
Canada), a cell-wall hydrolyzing enzyme. Cells were added to a mixture containing 1 mg
of Zymolyase-100T/ g (wet weight) and 4 ml spheroplast buffer. The mixture was
incubated for 45 minutes at 30 ºC in an orbital shaker (Weiss Gallenkamp) with gentle
shaking (90 rpm). Spheroplast conversion was monitored by diluting 10 µl of the cell
suspension in 990 µl of spheroplast buffer or Milli-RiOs water (RiOs-16; Millipore) and
examining the cells using a light microscope (40x magnification) and haemocytometer
counting chamber. Spheroplasts formation was considered complete when 80-90% of the
cells suspended in water appeared ghost-like due to the loss of their cell walls and rapidly
burst into cell debris in water. Spheroplasts are osmotically fragile and will lyse when
transferred from a hypertonic to hypotonic medium. Following Zymolyase digestion,
spheroplasts were collected by centrifugation at 3500 rpm for 5 min at 4 ºC (rotor model
SS-34), washed twice in spheroplast buffer, and were pelleted as before. The spheroplasts
were resuspended in 3.5 ml ice-cold cell breaking buffer (0.6 M mannitol; 20 mM HEPES-
KOH, pH 7.4; 1 mM phenylmethylsulfonylfluoride [PMSF]; 0.1% w/v fatty acid free-
Bovine Serum Albumin [BSA]) and were disrupted with 20 up-and-down strokes of the
tight-fitting pestle of a pre-chilled Dounce homogenizer. Throughout this process, the
Dounce homogenizer was kept on ice. The extent of cell lysis was determined by diluting
10 µl of the cell suspension in 990 µl spheroplast buffer and examining the cells using a
light microscope (40x magnification) and haemocytometer counting chamber. After

94
homogenization, the lysate was transferred to pre-chilled microcentrifuge tubes and
fractionated using differential centrifugation. The nuclear fraction was recovered at 3500
rpm for 5 min at 4ºC using an SS-34 rotor, and the mitochondrial fraction was recovered
from the supernatant at 9000 rpm for 10 min at 4ºC. After centrifugation, the supernatant
containing the cytosolic fraction was removed and kept on ice until analyzed for its
nucleotide concentration.
3.3.7. Inactivation of proteases in yeast cell extract using a protease inhibitor cocktail.
Prior to performing the enzymatic assays, cytosolic extract samples were inactivated using
a protease inhibitor cocktail manufactured by Roche Applied Science (Complete Ultra
Tablets, EDTA-free, glass vials, catalogue no. 05892953001). To prepare a 1x stock
solution, 1 tablet was added directly to 50 ml of extraction medium, according to the
manufacturer’s instructions. All stock solutions were stirred on a stir plate until the tablets
dissolved, and the solution was considered ready to use even if fine particles were visible
in solution. The stock solutions were used for preparation of the calibration standards for
NAD+, NADH, NADP+ and NADPH determination, as described in Section 3.3.9., and as
the buffer for cell lysis.
3.3.8. Deproteinization of yeast cell extract with spin filters. Prior to enzymatic analysis,
cytosolic extract samples were deproteinized using molecular weight cut-off (MWCO) spin
filters manufactured by Pall Life Sciences (Microsep™ Centrifugal Device; catalogue no.
OD010C46 (10 kDa) or Microsep™ Advance spin filter; catalogue no. OD010C33 (10
kDa) and OD030C3310 (30 kDa); Mississauga, ON, CAN). After cytosolic extraction, a
measured volume of the sample was added to each centrifugation tube. Samples in the
Microsep™ Advance tubes were centrifuged at 7920 rpm (as specified by the

95
manufacturer) at 4 ºC using the Sorvall RC5C Plus. All samples were centrifuged until the
volume of filtrate did not change, indicating more sample was able to be filtered through.
Prior to performing the assays, the volume of sample recovered was determined so that the
nucleotide content could be normalized to this value.
3.3.9. Overview: Determination of intracellular NAD(P)+ and NAD(P)H
concentrations. Intracellular nucleotide concentrations were measured in standard and
yeast cell extract samples using a UV-Vis spectrophotometer (Spectronic Genesys™ 2)
and endpoint assay method outlined in Bergmeyer (1974). Reactions were prepared in
semi-micro UV/ Vis cuvettes (1.5 ml, 10 mm optical path length, Fisher Scientific), and
coenzymes were measured by monitoring changes in UV absorption of NADH and
NADPH at 340 nm. Each standard curve was used to determine the respective coenzyme
concentration in yeast cytosolic extract by comparing the absorbance of the extract sample
with the standard solutions.
3.3.9.1. Assay procedure for the determination of NAD+. The quantification of NAD+
required a reaction catalyzed by alcohol dehydrogenase (ADH; EC1.1.1.1). In this reaction,
ADH catalyzed the reduction of NAD+ to NADH and H+ by oxidation of ethanol to
acetaldehyde (1). As a net result, the oxidation of ethanol generated an excess of NADH,
allowing the reaction to be followed by measuring the increase in absorbance of the
solution at 340 nm as the reaction reached equilibrium. The amount of NADH produced
was proportional to the amount of NAD+ in the cell lysate sample and was used as an
indicator of the cellular NAD+ concentration.
ADH
(1) ethanol + NAD+ ⇌ acetaldehyde + NADH + H+

96
The NAD+ content was determined in a 2.02 ml reaction medium containing pyro-
phosphate buffer (pH 8.8) consisting of 50 mM tetrasodium pyrophosphate and 22 mM
semicarbazide, and 1 ml of yeast cell extract or standard sample. To initiate the reaction,
10 µl of ethanol were added to the reaction cuvette, giving a final ethanol concentration of
85 mM, and an equal volume of water was added to the blank cuvette. The contents in each
were thoroughly mixed via inversion and the reaction was left to incubate at room
temperature. Prior to taking the first absorbance reading (A1), the spectrophotometer was
zeroed at 340 nm with the blank cuvette, and after 15 minutes the absorbance of the sample
or standard was measured. Ten microliters of freshly prepared 1.2 mg/ ml ADH (409 U mg-
1, catalogue no.10127558001; Roche Applied Science, Laval, QB, Canada) were then
added to the cuvette and the reaction was left to incubate for 6 minutes, after which time
the A2 reading was taken. The change in absorbance (∆A) due to the addition of ADH was
determined, and the NAD+ content was interpolated from the standard curve using the
equation of the standard. Standard solutions for the determination of NAD+ were prepared
in water or cell breaking buffer from a 10 mM NAD+ stock (β-Nicotinamide adenine
dinucleotide hydrate, catalogue no. N7004, Sigma-Aldrich®) prepared in Milli- RiOs water
(RiOs-16; Millipore) and included: 0 µM, 100 µM, 300 µM, 500 µM, 750 µM, 1000 µM
and 1500 µM. Standards were tested in duplicate and the mean concentration (± SD) was
plotted on the calibration curve. Yeast cell lysate samples were tested in singlet.
3.3.9.2. Assay procedure for the determination of NADP+. The quantification of NADP+
required a reaction catalyzed by glucose-6-phosphate dehydrogenase (G6P-DH;
EC1.1.1.49). In this reaction, G6P-DH catalyzed the oxidation of glucose-6-phosphate to
gluconate-6-phosphate, along with the concomitant reduction of NADP+ to NADPH and

97
H+ (2). The reaction was followed by measuring the increase in absorbance of the solution
at 340 nm as NADPH formed and the reaction reached equilibrium. The NADPH formed
was stoichiometric with the amount of NADP+ in the cell lysate and was used as an
indicator of the cellular NADP+ content.
G6P-DH
(2) glucose-6-phosphate + NADP+ ⇌ gluconate-6-P + NADPH + H+
The NADP+ was determined in a 2.07 ml reaction medium containing 5mM magnesium
sulfate and 2 ml of yeast cell extract or standard sample. To initiate the reaction, 50 µl of
glucose-6-phosphate were added to the reaction cuvette, giving a final glucose-6-phosphate
concentration of 5 mM, and an equal volume of Milli-RiOs water (RiOs-16; Millipore) was
added to the blank cuvette. The contents of the cuvette were thoroughly mixed via inversion
and the reaction was left to incubate at room temperature. Prior to taking the first
absorbance reading (A1), the spectrophotometer was zeroed at 340 nm with the blank
cuvette, and after 15 minutes the absorbance of the sample was measured. Ten microliters
of freshly prepared 2 mg/ ml G6P-DH (463 U mg-1, catalogue no.10127655001; Roche
Applied Science) were then added to the cuvette and the reaction was left to incubate for
15 minutes, after which time the A2 reading was taken. The change in absorbance (∆A) due
to the addition of G6P-DH was determined, and the NADP+ content was interpolated from
the standard curve using the equation of the standard. Standard solutions for the
determination of NADP+ were prepared in water or cell breaking buffer from a 10 mM
NADP+ stock (β-Nicotinamide adenine dinucleotide phosphate hydrate, catalogue no.
N5755, Sigma-Aldrich®) and included: 0 µM, 10, µM, 25 µM, 40 µM, 50 µM, and 75 µM.
The pH of each standard and sample was adjusted to 7.2-7.4 if necessary with 1N NaOH.

98
Standards were tested in duplicate and the mean concentration (± SD) was plotted on the
calibration curve. Yeast cell lysate samples were tested in singlet.
3.3.9.3. Assay procedure for the determination of NADH and NADPH. The
quantification of NADH and NADPH required two enzymatic reactions; in the first
reaction catalyzed by glycerol-3-phosphate dehydrogenase (GPDH; EC1.1.1.8),
dihydroxyacetone phosophate (DHAP) was reduced to glycerol-3-phosphate by NADH
(3). The oxidation of NADH in the previous reaction was followed by the determination of
NADPH with glutamate dehydrogenase (GlDH; EC 1.4.1.3) (4). In this pathway, GlDH
catalyzed the reductive amination of 2-oxoglutarate by ammonia to form glutamate in a
reaction utilizing NADPH. Both reactions were followed by measuring the decrease in
absorbance of the solution at 340 nm as NADH and NADPH were oxidized to NAD+ and
NADP+ in the respective reactions.
GPDH
(3) DHAP + NADH + H+ ⇌ glycerol-3-phosphate + NAD+
GlDH
(4) 2-oxoglutarate + NH4+ + NADPH ⇌ glutamate + H2O + NADP+
The NADH and NADPH contents were determined in a reaction medium containing 0.5
mM dihydroxyacetone phosphate, 2.5 mM 2-oxoglutarate and 5 mM ammonium, all of
which comprised the ‘substrate mixture’, and 2 ml of yeast cell extract or standard sample
in a final volume of 2.01 ml for NADH determination and 2.02 ml for NADPH
determination. To initiate the reaction, 50 µl of the substrate mixture were added to the
reaction cuvette and an equal volume of water was added to the blank cuvette. The contents
of the cuvette were thoroughly mixed via inversion and the reaction was left to incubate.
Prior to taking the first absorbance reading (A1), the spectrophotometer was zeroed at 340
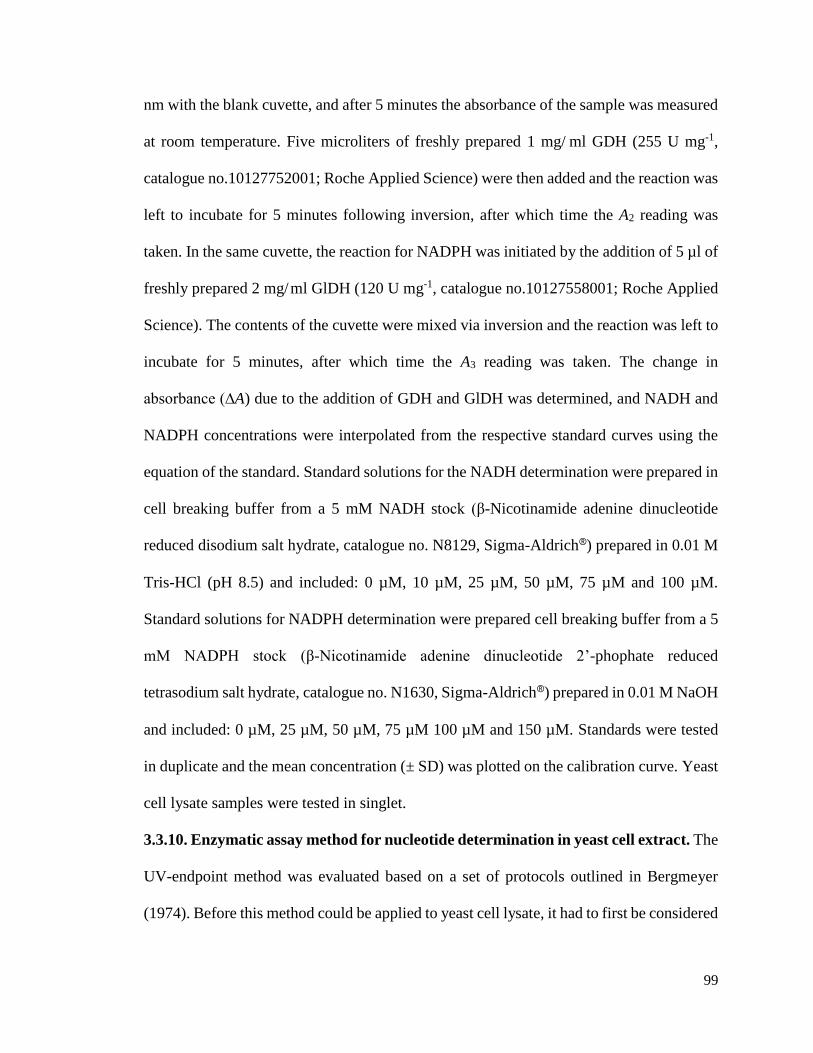
99
nm with the blank cuvette, and after 5 minutes the absorbance of the sample was measured
at room temperature. Five microliters of freshly prepared 1 mg/ ml GDH (255 U mg-1,
catalogue no.10127752001; Roche Applied Science) were then added and the reaction was
left to incubate for 5 minutes following inversion, after which time the A2 reading was
taken. In the same cuvette, the reaction for NADPH was initiated by the addition of 5 µl of
freshly prepared 2 mg/ ml GlDH (120 U mg-1, catalogue no.10127558001; Roche Applied
Science). The contents of the cuvette were mixed via inversion and the reaction was left to
incubate for 5 minutes, after which time the A3 reading was taken. The change in
absorbance (∆A) due to the addition of GDH and GlDH was determined, and NADH and
NADPH concentrations were interpolated from the respective standard curves using the
equation of the standard. Standard solutions for the NADH determination were prepared in
cell breaking buffer from a 5 mM NADH stock (β-Nicotinamide adenine dinucleotide
reduced disodium salt hydrate, catalogue no. N8129, Sigma-Aldrich®) prepared in 0.01 M
Tris-HCl (pH 8.5) and included: 0 µM, 10 µM, 25 µM, 50 µM, 75 µM and 100 µM.
Standard solutions for NADPH determination were prepared cell breaking buffer from a 5
mM NADPH stock (β-Nicotinamide adenine dinucleotide 2’-phophate reduced
tetrasodium salt hydrate, catalogue no. N1630, Sigma-Aldrich®) prepared in 0.01 M NaOH
and included: 0 µM, 25 µM, 50 µM, 75 µM 100 µM and 150 µM. Standards were tested
in duplicate and the mean concentration (± SD) was plotted on the calibration curve. Yeast
cell lysate samples were tested in singlet.
3.3.10. Enzymatic assay method for nucleotide determination in yeast cell extract. The
UV-endpoint method was evaluated based on a set of protocols outlined in Bergmeyer
(1974). Before this method could be applied to yeast cell lysate, it had to first be considered

100
valid to ensure it was fit for the intended purpose. Method validation included specific
laboratory investigations and procedures that demonstrated that this particular protocol
used for the quantitative measurement of the desired analytes, NAD+, NADH, NADP+ and
NADPH, in yeast cytosolic extract was reliable and reproducible. The fundamental
parameters for validating this included: (1) linearity and range (calibration curve), (2)
precision (repeatability), (3) sensitivity (lower limit of quantification), and (4) accuracy
(recovery).
3.3.10.1. Linearity, precision, sensitivity and accuracy provided by the method.
During the initial stage of the validation process, it was necessary to first construct
calibration curves that defined the relationship between the known concentrations of each
coenzyme and optical density at the desired wavelength. The initial calibration curves for
NAD+ and NADP+ included standards from 0-1500 µM. A subsequent calibration curve
using standards from 0-100 µM was established for each coenzyme to focus in on the lower
concentration range expected in yeast extract. The linearity was evaluated by linear
regression analysis. Regression analysis was calculated using the least square method
(Microsoft Excel 2013), and was utilized to determine the linear correlation coefficient (R)
and coefficient of determination (R2) of standard curves for each standard. An R-value of
≥0.985 was used as criterion of linearity, while a high R2-value of ≥0.980 was used as
criterion for goodness of fit of the regression line. After conducting the preliminary
calibration studies, the linear range of the assay was optimized such that the absorbance of
each standard was directly proportional to the analyte concentration in the sample. The
precision of the procedure was determined by analyzing duplicate samples of standard. The
repeatability was expressed numerically as the coefficient of variation (CV) of the

101
duplicate measurements, which was defined as the: (standard deviation of the analyte assay
values/ mean concentration of the analyte assay values) x 100. The precision was assessed
for each concentration level and did not exceed more than 20% of the CV. Assay sensitivity
was evaluated on the basis of the lower limit of quantification (LLOQ) using the
concentration of the lowest detectable standard from the data set that was in the prescribed
accuracy and precision of the assay. The accuracy of each assay method was based on the
recovery of known standards in the assay based on standard addition. When preparing
standard samples, known quantities of pure analyte were added to the sample matrix (cell
breaking buffer) and the increase in measured concentration was determined. A
comparison of the assayed coenzyme concentration versus the predicted amount provided
the recovery of the method and an estimation of its accuracy, which was expressed as the:
(average measured concentration of analyte/ predicted concentration of analyte) x 100. A
percent recovery value found within ±10% of the standard concentration was considered
acceptable.

102
3.4. Results
3.4.1. In-study validation of assays
3.4.1.1. Evaluation of Bergmeyer (1974) assay using standards in water
The results demonstrated that the assay protocols described by Bergmeyer (1974)
using NAD+ or NADP+ standards in water were precise, accurate and linear over the range
of cofactor concentrations tested (Fig. 3.1A and 3.1B). The R-values were estimated to be
0.9999 and 0.9991 for NAD+ and NADP+, respectively, indicating a high degree of
linearity, and the R2-values were estimated to be 0.9999 for NAD+ and 0.9984 for NADP+,
suggesting good fit of the data. For duplicate measurements at each concentration level,
the calculated precision did not exceed more than 20% of the CV, and the acceptance
criterion for recovery was met (±10%). These results demonstrated that the assay protocols
described by Bergmeyer (1974) can be repeated within the lab with high precision,
accuracy and linearity.

103
Figure 3.1: Best-fit calibration curves of NAD+ and NADP+ with cofactor dissolved in water.
The Y axis represents the absorbance change at 340 nm during the reactions catalyzed by alcohol
dehydrogenase in the NAD+ assay (A) and glucose-6-phosphate dehydrogenase in the NADP+
assay (B). Lines represent linear least squares fits to the data. The correlation coefficient (R) and
coefficient of determination (R2) were calculated using linear regression analysis. For (A), an R-
value of 0.9999 and R2-value of 0.9999 were determined; for (B) an R-value of 0.9991 and R2-
value of 0.9984 were determined. Standards were prepared in water and tested in duplicate (n = 2).
The mean values (± SD) of the duplicate measurements are shown; where the error bars are not
visible, they are within the symbol.
0.00
0.05
0.10
0.15
0.20
0.25
0.30
0.0 20.0 40.0 60.0 80.0 100.0 120.0
Ab
sorb
an
ce a
t 3
40
nm
NAD+ Standard (µM)
Standard Curve of NAD+
0.00
0.05
0.10
0.15
0.20
0.25
0.30
0.35
0.40
0.45
0.0 20.0 40.0 60.0 80.0 100.0 120.0
Ab
sorb
an
ce a
t 3
40
nm
NADP+ Standard (µM)
Standard Curve of NADP+B
A
104
3.4.1.2. Recovery of NADP+ standards made up in yeast extraction buffer
Standard recoveries from the curves in Figures 3.1 were tested using standards
prepared in yeast extraction buffer. Two buffers used for cellular homogenization were
assessed to determine the compatibility of each with the previously described enzymatic
assay for NADP+ (Section 3.3.9.2). The first buffer (Buffer 1) consisted of 0.6 M sorbitol,
10 mM Tris-HCl (pH 7.4), 1 mM EDTA, 1 mM PMSF and 0.2% (w/v) BSA, while the
second (Buffer 2) contained 0.6 M mannitol, 20 mM HEPES-KOH (pH 7.4) and 0.1%
(w/v) BSA. The various sample buffers spiked with 50 µM of NADP+ standard stock (10
mM) were prepared (Table 3.1), and the recovery of each standard concentration was
determined from the standard curve. For all samples derived from Buffer 1, less than 50%
of the spiked concentration was recovered. When prepared in Buffer 2, a higher recovery
of the standard concentration was measured (78.2%), and in the presence of PMSF, the
standard recovery was determined to be 92%.

105
Table 3.1. Percent recoveries of buffer samples spiked with 50 µM of NADP+ standard
stock (n =1).
Sample
Recovery (%)
Buffer 1
34.8
Buffer 1
(without EDTA)
45.7
Buffer 1
(without EDTA and PMSF)
32.1
Buffer 1
(without EDTA and BSA)
22.4
Buffer 1
(substitution of sorbitol with mannitol)
23.4
Buffer 2
78.7
Buffer 2
(with PMSF)
92.0
106
3.4.1.3. NAD+ assay in Buffer 2
Calibration samples prepared in Buffer 2, with the inclusion of 1 mM PMSF as a
protease inhibitor, were used to construct standards curves of each cofactor. To verify
whether NAD+ can be quantified in cell breaking buffer by the UV-endpoint method,
various amounts of standard NAD+ were added to the reaction mixture in the presence of
ADH used to catalyze the reaction, and absorbance changes were monitored by a UV-Vis
spectrophotometer at 340 nm. Linear standard curves were obtained between final
concentrations of 0 to 100 µM NAD+ (Fig. 3.1A) and 100 to 750 µM NAD+ (Appendix II,
Fig. 2). The R-values were estimated to be 0.9999 for both the lower and upper linear
regions of the calibration curve, indicating a high degree of linearity. The R2-value of the
lower region curve was estimated to be 0.9998, while that of the upper region was estimated
to be 0.9999, both results suggesting each linear model to be a good fit of the data. For
duplicate measurement at each concentration level, the calculated precision did not exceed
more than 20% of the CV, and the acceptance criterion for recovery was met (±10%). These
results demonstrated that NAD+ can be precisely and accurately quantified within the
established working range using the UV-endpoint method, and that the cell breaking buffer
system is compatible with the assay. From the data set, the LLOQ was determined to be 10
µM, while the upper limit of quantification (ULOQ) was determined to be 750 µM.
Similarly for the NADP+, NADH and NADPH assays, the results demonstrated high
precision, accuracy and linearity (Fig. 3.1B-D).
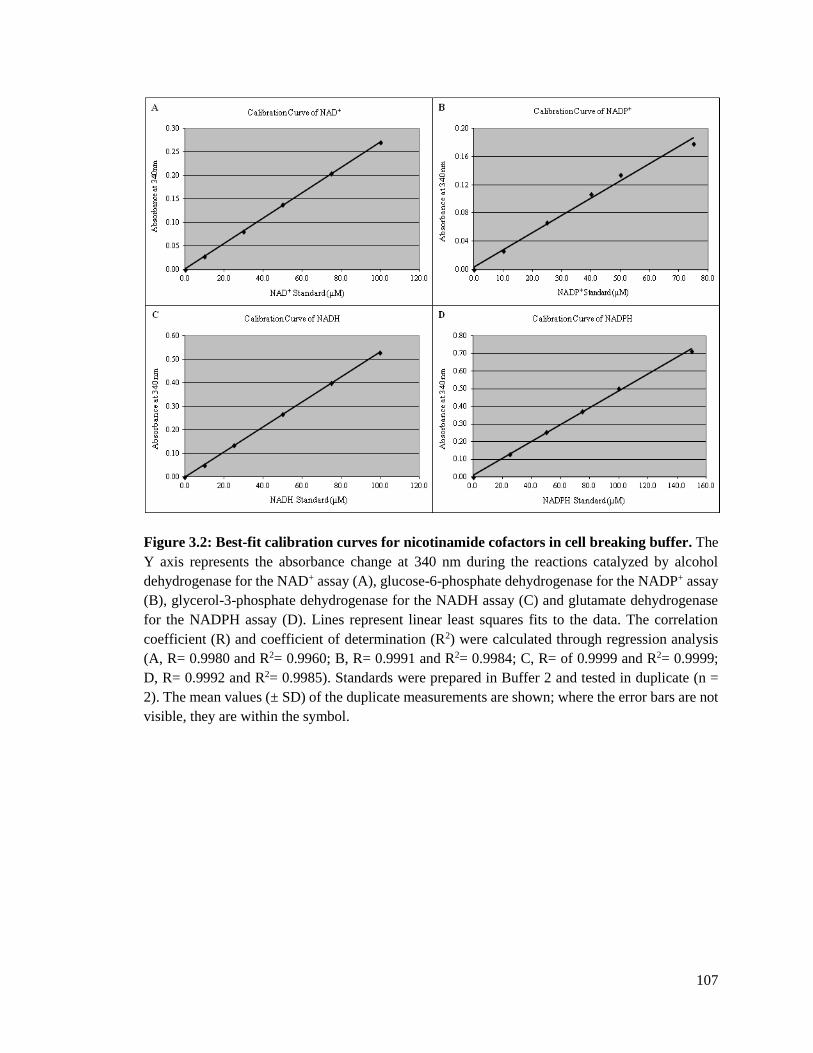
107
Figure 3.2: Best-fit calibration curves for nicotinamide cofactors in cell breaking buffer. The
Y axis represents the absorbance change at 340 nm during the reactions catalyzed by alcohol
dehydrogenase for the NAD+ assay (A), glucose-6-phosphate dehydrogenase for the NADP+ assay
(B), glycerol-3-phosphate dehydrogenase for the NADH assay (C) and glutamate dehydrogenase
for the NADPH assay (D). Lines represent linear least squares fits to the data. The correlation
coefficient (R) and coefficient of determination (R2) were calculated through regression analysis
(A, R= 0.9980 and R2= 0.9960; B, R= 0.9991 and R2= 0.9984; C, R= of 0.9999 and R2= 0.9999;
D, R= 0.9992 and R2= 0.9985). Standards were prepared in Buffer 2 and tested in duplicate (n =
2). The mean values (± SD) of the duplicate measurements are shown; where the error bars are not
visible, they are within the symbol.

108
3.4.1.4. Measurement of nucleotide content in yeast cell lysate (without protein
inhibition or removal)
Following the calibration studies, the developed assays were applied to crude
cytosolic extract isolated from yeast EC-1118 cells to determine the sensitivity of each,
and specifically whether the low coenzyme concentrations present in the cell extract
samples could be detected and accurately quantified using the modified assays. The
accuracy of the procedure was further evaluated in spike-and-recovery experiments. In the
initial studies performed, the cytosolic extract was only analyzed for its NAD+ and NADP+
content using the respective enzyme assays as problems with the measurements
immediately surfaced. For both assays, the concentration of the positive control (spike)
sample was selected to be 40 µM, as this concentration was close to the middle of each
calibration curve used for interpolation (Fig. 3.2A and 3.2B). However, after the assays
were performed no change in absorbance (ΔA) was detected in the unspiked and spiked
lysate samples, thereby precluding the coenzyme concentrations from being determined.
109
3.4.1.5. Effect of protease inhibition on nucleotide determination in yeast cell lysate
samples: evaluation of Complete Ultra Tablets (EDTA-free)
A cocktail manufactured by Roche Applied Science (Complete Ultra Tablets,
EDTA-free, glass vials, catalogue no. 05892953001) was investigated for use as a protease
inhibitor in yeast cell lysate. Calibration curves using pure coenzymes were first
constructed, meeting all requirements for linearity, precision and accuracy (Appendix II,
Fig. 3A and 3B), and spike-and-recovery experiments were performed using the modified
assay that included Buffer 2 for NAD+ and NADP+ determination in yeast cell lysate
samples. Recovery values of the 40 µM NAD+ and 50 µM NADP+ matrix spikes, and the
coenzyme content in the unspiked samples could not be determined as no signal was again
detected. Based on these results, the protease inhibitor cocktail did not improve the
recovery of the standard concentration in the spiked samples, or the measurement of the
coenzyme content in the unspiked extract samples, thereby failing to resolve the protein
interference issue.

110
3.4.1.6. Effect of deproteinization on nucleotide determination in yeast cell lysate
samples: evaluation of 10 kDa spin filter
A 10 kDa spin filter manufactured by Pall Life Sciences (Microsep™ Centrifugal
Device; catalogue no. OD010C46) was investigated for its ability to deproteinize yeast cell
lysate samples. Previously established calibration curves for NAD+, NADP+, NADH and
NADPH were used for the coenzyme determinations (Fig. 3.2A-D), and spike-and-
recovery experiments were performed to assay the nucleotide content in the deproteinized
cytosolic extract using the modified assay methods. Table 3.2 shows the recoveries of the
coenzymes from the standard addition experiments performed on cell lysate after
correction for the contribution from yeast to the NAD(P)+ or NAD(P)H content.
Clarification of the extract samples was found to greatly improve the recovery of the
standard concentration in the spiked samples, with recoveries ranging from 88.0% to
97.2%, depending on the coenzyme assay. However, the coenzyme content in the unspiked
extract samples remained low or unmeasurable. Of all the assays, ΔA values for only the
NAD+ and NADP+ assays were obtained, but following interpolation of the concentration
from the standard curve, the respective values were lower than the LLOQ.
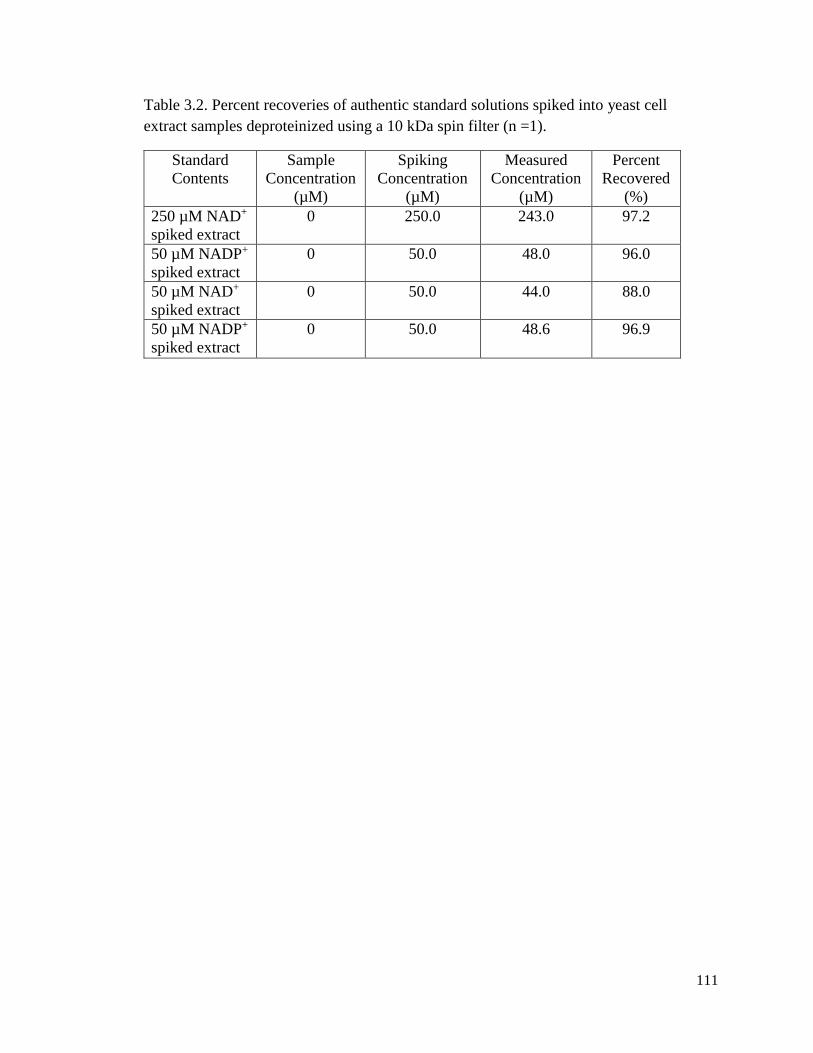
111
Table 3.2. Percent recoveries of authentic standard solutions spiked into yeast cell
extract samples deproteinized using a 10 kDa spin filter (n =1).
Standard
Contents
Sample
Concentration
(µM)
Spiking
Concentration
(µM)
Measured
Concentration
(µM)
Percent
Recovered
(%)
250 µM NAD+
spiked extract
0 250.0 243.0 97.2
50 µM NADP+
spiked extract
0 50.0 48.0 96.0
50 µM NAD+
spiked extract
0 50.0 44.0 88.0
50 µM NADP+
spiked extract
0 50.0 48.6 96.9
112
3.4.1.7. Measurement of nucleotide content in yeast cell lysate samples: investigation
of the use of spin filters and membrane pre-treatment
Prior to nucleotide analyses, spike-and-recovery experiments were performed using
crude cytosolic extract spiked with 40 µM NAD+. A previously established calibration
curve was used for coenzyme determination (Fig. 3.1A), and spike-and-recovery
experiments were performed to assay the nucleotide content in the deproteinized cytosolic
extract using the modified assay method. To determine the effect of the membrane pre-
treatment on sample recovery, cytosolic extract samples were first spiked and subsequently
deproteinized using 10 kDa and 30 kDa spin filters manufactured by Pall Life Sciences
(Microsep™ Advance spin filter; catalogue no. OD010C33, 10 kDa and OD030C33, 30
kDa). Table 3.3 shows the recoveries of the coenzymes from the standard addition
experiments performed on cell lysate after correction for the contribution from yeast to the
NAD+ content (Table 3.4). Presoaking the 10 kDa and 30 kDa membranes overnight with
cell breaking buffer greatly improved the recovery of the standard concentration in the
spiked samples over that determined using a dry membrane or one soaked in glycerine
(10%). Recovery of a 40 µM NAD+ matrix spike was 76.7% using the 10 kDa membrane
filter, while recovery of a 40 µM NAD+ matrix spike using the 30 kDa membrane filter
was 85.6% (Table 3.3).

113
Table 3.3. Percent recoveries of authentic standard solutions spiked into yeast
cell extract samples prior to centrifugation (n =1).
Sample
Recovery (%)
10 kDa device (dry)
11.5
30 kDa device (dry)
34.7
10 kDa device
(presoaked overnight in 10% glycerine)
19.6
10 kDa device
(presoaked overnight in cell breaking buffer)
76.7
30 kDa device
(presoaked overnight in cell breaking buffer)
85.6
Table 3.4. Concentration of coenzyme determined in yeast cell extract
sample (deproteinized using a 10 kDa filter).
Sample NAD+
(µM)
LLOQ
(µM)
Unspiked
extract
(NAD+ assay)
<LLOQ 10
114
3.5. Discussion
3.5.1. Method for preparing yeast cell extracts for enzymatic analyses
The NAD+, NADH, NADP+ and NADPH assays were developed with the objective
of measuring the redox status of the cell by measuring the concentration of these
coenzymes in yeast cytosolic extract isolated from S. cerevisiae strain EC-1118 cells.
Establishment of such assays was very much dependent on the application of cytosolic
extract as both NAD+-dependent Ald2/ 3p and NADP+-dependent Ald6p are localized in
the cytosol (Navarro-Avino et al. 1999). The remaining aldehyde dehydrogenases, Ald4p
and Ald5p, are mitochondrial and were not of interest in this study. To obtain a yeast
cytosolic extract, subcellular fractionation was used and was preceded by an extraction
protocol to produce a cruden yeast cell lysate. Fractionation was important for avoiding
cross-contamination of the cytosol with the mitochondria as NAD(P)+ and NAD(P)H are
present in both, which could affect coenzyme measurements, although no additional studies
were conducted to verify sample purity.
3.5.2. Method development of enzyme assays
The work of Klingenberg (1974; 1985) served as the conceptual basis for the
development of the coenzyme assays for measuring NAD+, NADP+, NADH and NADPH
content in yeast cytosolic extract. This work was developed for measuring the redox state
of free nicotinamide cofactors in animal tissue, blood and mitochondria. Although
literature indicated the work to have baseline potential for achieving our research
objectives, refinement of the existing protocol was still required. To enable robust, reliable
measurement of the coenzymes in yeast, it was necessary to develop a different cell lysis
method for isolating the cytosolic fraction from cells, as detailed in Section 3.3.6. The cell
lysis component of this protocol necessitated the inclusion of a homogenization buffer to
115
facilitate cell lysis, whose composition needed to be optimized for this study. Since certain
buffer characteristics can either have advantages or disadvantages, depending on the goals
of the experiment, it was important to ensure that the buffer composition not only created
an environment conducive to cell lysis, but was also compatible with the subsequent
enzymatic assays used for cofactor analyses (Hartford and Bonifacino 2009).
The first assay experiment conducted verified the enzymatic method described in
Bergmeyer (1974) could be successfully repeated and performed under our laboratory
conditions. For both assays assessed (NAD+ and NADP+), the protocols were strictly
followed resulting in high linearity, accuracy and precision of the analytical procedure.
With a working assay method in hand, the next step was to assess the calibration of the
assay and the influence of differences between the standard and spiked sample matrices
prepared in lysis buffer (Buffer 1). Recovery experiments performed on spiked NADP+
samples revealed low recovery of the standard concentrations in the buffer containing 0.6
M sorbitol, 10 mM Tris-HCl (pH 7.4), 1 mM EDTA, 1 mM PMSF and 0.1% (w/ v) BSA
(Table 3.1), questioning the appropriateness of this buffer for use in this study.
Standard buffers most often consist of several components including: (1) a suitable
organic buffer to maintain physiological pH, (2) sorbitol or mannitol (or another osmotic
balancer) to stabilize organelle membranes, (3) salts to provide the appropriate ionic
strength, (4) protease inhibitors to minimize the damage caused by hydrolytic enzymes
(Hartford and Bonifacino 2009), (5) and BSA, a globular protein with self-buffering
capacity (Curvale 2009). Lysis buffers also commonly include EDTA or EGTA, both of
which can bind to metal cations thereby making them unavailable for other reactions such
as those catalyzed by proteases (Hartford and Bonifacino 2009). Since protein degradation
116
can be problematic in extract samples due to the exposure of subcellular components to
proteases upon cell lysis, protein inhibitors, ideally those with broad enzyme specificity,
are important components of lysis buffers (Hartford and Bonifacino 2009).
In this study, the presence of EDTA in the cell lysis buffer (Buffer 1) was initially
thought to be interfering with the NADP+ assay as the mechanism for catalysis requires the
presence of Mg2+, added in the form of MgSO4, to activate glucose-6-phosphate, the
substrate for glucose-6-phosphate dehydrogenase. Since only one homogenization buffer
would ultimately be used for cell lysis, this result was concerning as all assays needed to
be compatible with the same buffer system. The exclusion of EDTA from Buffer 1 still
resulted in low recovery of the standard sample, suggesting possible interference from
another component. In response to this result, a variety of buffers derived from Buffer 1
were prepared that either eliminated or substituted certain components of the original
buffer recipe. Similarly, very low standard recoveries were determined in the spiked buffer
samples. However, when a buffer recipe containing 0.6 M mannitol, 20 mM HEPES-KOH
(pH 7.4), 1mM PMSF and 0.1% (w/ v) BSA (Buffer 2) was evaluated, lower interference
was observed as a much higher standard recovery was obtained (92.0%). For the remaining
assays (NAD+, NADH and NADPH), the respective protocols were strictly followed only
this time using standards prepared in Buffer 2 rather than Buffer 1. The results showed
high linearity, accuracy and precision of the analytical procedure, suggesting good
compatibility of Buffer 2 with all coenzyme assays.
Following the calibration studies, spike-and-recovery experiments were performed
using yeast cell extract samples to give an estimation of the precision and accuracy of the
method, and specifically whether the low coenzyme concentrations present in the extract

117
samples could be detected and quantified using the modified assays. The results indicated
no standard recovery in the spiked yeast extract sample or measurable coenzyme
concentration in the unspiked extract sample, suggesting a possible issue with the sample
as all assays were previously determined to be functional. Suggested reasons for low
cofactor recovery were put forward and subsequently investigated. These included: (1) the
presence of proteases in the sample extract resulting from cell lysis and homogenization
which could be rapidly degrading the enzymes specifically added to each reaction mixture,
(2) the high turbidity of the sample extract due to proteins and the large sample volumes
required for each assay (which accounted for 50-99% of the total volume of the reaction
mixture) which could be interfering with the absorbance measurements taken via
spectrophotometry, (3) and/ or the presence of nicotinamide coenzyme-dependent enzymes
in the cell extract sample which could be rapidly consuming the coenzymes of interest.
During the development of the assays reported here, we found that protease
inhibition through the addition of the Complete Ultra Tablet (EDTA-free) did not improve
the standard NAD+ and NADP+ recoveries in the spiked yeast cell extract samples or the
measurable coenzyme concentration in the unspiked cell extract samples. The results of the
enzymatic analyses suggest the tablet was unable to resolve this protein issue, appearing to
only heighten it by increasing the turbidity of the sample extract and the ambiguity of
absorbance measurements for the higher concentrated standards due to the increase in
background noise. The Complete Ultra Tablet (EDTA-free) contains 4-(2-
Aminoethyl)benzenesulfonyl-fluoride hydrochloride which, due to the presence of an
aromatic hydrocarbon, is also able to absorb UV light at 340 nm, along with other
unidentified components of the biological sample.

118
The initial rational for replacing PSMF with the tablet was based on the difference
in enzyme specificity between the compounds. While PMSF is specific only for the
inhibition of serine proteases, the Complete Ultra Tablet has a broad specificity range,
containing both irreversible and reversible serine, cysteine and aspartic protease inhibitors
(Roche Applied Science 2012). Of the tablets available, the EDTA-free version was
selected to avoid any assay interference EDTA may cause due to its role as a chelating
agent, which prevented metalloproteases in the sample from being inhibited. Based on the
experimental results, PMSF was included in the final EDTA-free buffer (Buffer 2) to
function as a protease inhibitor during yeast cell lysis.
The centrifugal devices effectively clarified the sample, resulting in a clear, much
less turbid sample extract. It appeared unwanted proteases or nicotinamide coenzyme-
dependent enzymes capable of interfering with the assay measurements were removed as
recovery values from the standard addition tests were high. The results of the initial
filtration experiments using a Pall 10 kDa centrifugal device revealed that centrifugation
of the yeast cell extract greatly improved the standard recovery in the spiked extract and
the measurement of coenzyme concentration in the unspiked extract. However,
discontinuation of this particular product demanded alternative filters be evaluated for
deproteinizing the sample extract. Two Pall devices constructed of polyethersulfone to
minimize protein binding were selected with molecular weight cut-offs of 10 kDa or 30
kDa. Initial results using dry filters revealed low standard recovery in the spiked cell
extract, suggesting a possible issue with the filter membrane and non-specific adsorption.
After pre-treatment with Buffer 2 or 10% glycerine solutions, Buffer 2 was found to greatly
improve the standard recovery after filtration with both the 10 kDa and 30 kDa devices.
119
Although these methods effectively deproteinized and clarified the lysate samples,
coenzyme levels in the native extracts were below the LLOQ, indicating the assays were
not sensitive enough for measuring the low coenzyme content present.
3.6. Conclusions
During development of the UV-endpoint method here, we report that working
assays for the measurement of NAD+, NADH, NADP+ and NADPH were established based
on a set of protocols outlined in Bergmeyer (1974). The method was optimized to include
a yeast cell lysis buffer that was compatible with all assays, as well as a deproteinization
step to remove interfering compounds and clarify the sample extract prior to coenzyme
analysis. Although the use of the centrifugal devices demonstrated potential in resolving
the protein interference issue, the results of the filtration experiments demand that more
research be conducted to determine its overall suitability for coenzyme analyses.
As part of the method development, all assays underwent validation to ensure the
established protocols were accurate and reproducible. Although the results obtained
indicated high linearity, accuracy and precision of the analytical method, they
demonstrated insufficient sensitivity as the assays were unable to accurately measure the
low coenzyme concentrations present in the yeast crude extract samples, suggesting the
need for further method development to increase the sensitivity of coenzyme detection and
quantification.
120
3.7. Literature Cited
Agrimi, G., L. Brambilla, G. Frascotti, I. Pisano, D. Porro, M. Vai and L. Palmieri. 2011.
Deletion or overexpression of mitochondrial NAD+ carriers in Saccharomyces cerevisiae
alters cellular NAD and ATP contents and affects mitochondrial metabolism and the rate
of glycolysis. Appl Environ Microbiol. 77:2239-2246.
Bakker, M.B., K.M. Overkamp, A.J.A. van Maris, M.A.H. Luttik, J.P. van Dijken and J.T.
Pronk. 2001. Stoichiometry and compartmentation of NADH metabolism in
Saccharomyces cerevisiae. FEMS Microbiol Rev. 25:15-27.
Bergmeyer, H.U. 1974. Methods in enzymatic analysis, 2nd Edition vol. IV. Verlaf Chemie
Weinbeim, Acadmic Press Inc, pp. 2045-2072.
Blomberg, A. and L. Alder. 1989. Roles of glycerol and glycerol-3-phosphate
dehydrogenase (NAD+) in acquired osmotolerance of Saccharomyces cerevisiae. J
Bacteriol. 171:1087-1092.
Blomberg, A. 2000. Metabolic surprises in Saccharomyces cerevisiae during adaptation to
saline conditions: questions, some answers, and a model. FEMS Microbiol Lett. 182:1-8.
Brewster, J.L., T. de Valoir, N.D. Dwyer, E. Winter and M.C. Gustin. 1993. An
osmosensing signal transduction pathway in yeast. Science. 259:1760-1763.
Bro, C., B. Regenberg, G. Lagniel, J. Labarre, M. Montero-Lomeli and J. Nielsen. 2003.
Transcriptional, proteonomic, and metabolic responses to lithium in galactose-grown yeast
cells. J Biol Chem. 278:31141-32149.
Bruinenberg, P.M., J.P. van Dijken and W.A. Scheffers. 1983. An enzymatic analysis of
NADPH production and consumption in Candida utilis. J Gen Microbiol. 129:965-971.
Bruinenberg, P.M., R. Jonker, J.P. van Dijken and W.A. Scheffers. 1985. Utilization of
formate as an additional energy source by glucose-limited chemostat cultures of Candida
utilis CBS 621 and Saccharomyces cerevisiae CBS 8066: evidence for absence of
transhydrogenase activity in yeasts. Arch Microbiol. 142:302-306.
Curvale, R.A. 2009. Buffer capacity of bovine serum albumin (BSA). J of Argent Chem
Soc. 97:174-180.
Eglinton, J.M., A.J. Heinrich, A.P. Pollmitz, P. Langridge, P.A. Henschke and M. de
Barros Lopes. 2002. Decreasing acetic acid accumulation by a glycerol overproducing
strain of Saccharomyces cerevisiae by deleting the ALD6 aldehyde dehydrogenase gene.
Yeast. 19:295-301.
121
Erasmus, D.J., G.K. van der Merwe and H.J. van Vuuren. 2003. Genome-wide expression
analyses: metabolic adaptation of Saccharomyces cerevisiae to high sugar stress. FEMS.
34:375-399.
Erasmus, D.J. and H.J.J. van Vuuren. 2009. Genetic basis for osmosensitivity and genetic
instability of the wine yeast Saccharomyces cerevisiae V1N7. Am J Enol Vitic. 60:145-
154.
Erasmus, D.J., M. Cliff and H.J.J. van Vuuren. 2004. Impact of yeast strain on the
production of acetic acid, glycerol, and the sensory attributes of Icewine. Am J Enol Vitic.
55:371-378.
Forster, J., I. Famili, P. Fu, B.O. Palsson and J. Nielsen. 2003. Genome-scale reconstruction
of Saccharomyces cerevisiae metabolic network. Genome Res. 13:244-253.
Hartford, J.B. and J.S. Bonifacino. 2009. Subcellular fractionation and isolation of
organelles 3.0-3.0.7. Current Protocols in Cell Biology. Chapter 3.
Heux. S., R. Cachon and D. Dequin. 2006. Cofactor engineering in Saccharomyces
cerevisiae: expression of H2O-forming NADH oxidase and impact on redox metabolism.
Metab Eng. 8:303-314.
Kasimova, M.R., J. Grigiene, K. Krab, P.H. Hagedorn, P.E. Andersen and I.M. Moller.
2006. The free NADH concentration is kept constant in plant mitochondria under different
metabolic conditions. 18:688-698.
Klingenberg, M. 1974. Nicotinamide-adenine dinucleotides (NAD+, NADP+, NADH,
NADPH): spectrophotometric and fluorimetric methods, p. 2045-2059. In H.U. Bergmeyer
(ed.), Methods of enzymatic analysis, 2nd ed., vol. 4. Academic Press, New York, N.Y.
Klingenberg, M. 1985. Nicotinamide-adenine dinucleotides and dinucleotide phosphate, p.
251-278 in H.U. Bergmeyer, (ed.), Methods of enzymatic analysis, 3rd ed., vol. 7. Verlag
Chemie. Deerfield Beach, FL.
Kukec, A., M. Berovic, M. Wondra, S. Celan and T. Kosmerl. 2003. Influence of
temperature shock on the glycerol production in cv. Sauvignon blanc fermentation. Vitis.
42:205-206.
Lagunas, R. and J.M. Ganedo. 1973. Reduced pyridine nucleotide balance growing on
Saccharomyces cerevisiae. Eur J Biochem. 37:90-94.
Liu, L.M. and J. Chen. 2011. Cofactor engineering enhances the physiological function of
an industrial strain. Progress in molecular and environmental bioengineering-from analysis

122
and modeling to technology applications. Edited by Capri A. In Tech Open Access
Publisher, Rijeka. 427-444.
Meaden, P.G., F.M. Dickinson, A. Misfud, W. Tessier, J. Westwater, H. Bussey and M.
Midgley. 1997. The ALD6 gene of Saccharomyces cerevisiae encodes a cytosolic, Mg2+-
activated acetaldehyde dehydrogenase. Yeast. 13:1319-1327.
Murdza-Inglis, D.L. 1995. Structure/ function studies of rat uncoupling protein in yeast
mitochondria. PhD Thesis. McMaster University, Hamilton, ON.
Navarro-Avino, J.P., R Prasad, V.J. Miralles, R.M. Benito and R. Serreno. 1999. A
proposal of nomenclature of aldehyde dehydrogenases in Saccharomyces cerevisiae and
characterization of the stress-inducible ALD2 and ALD3 genes. Yeast. 15:829-842.
Neviogt, E. and U. Stahl. 1997. Osmoregulation and glycerol metabolism in the yeast
Saccharomyces cerevisiae. FEMS Microbiol Rev. 213:231-271.
Nielsen, J. 2003. It is all about metabolic fluxes. J Bacteriol. 185:7031-7035.
Nielsen, J. 2011. Transcriptional control of metabolic fluxes. Mol Syst Biol.7:1-2.
Nissen, T.L., M. Anderlund, J. Nielsen, J. Villadsen and M.C. Kielland-Brandt. 2001.
Expression of cytoplasmic transhydrogenase in S. cerevisiae results in formation of 2-
oxoglutarate due to depletion of NADPH. Yeast. 18:19-32.
Påhlman, A.K., K. Granath, R. Ansell, S. Hohmann and L. Alder. 2001. The yeast glycerol
3-phosphatases Gpp1p and Gpp2p are required for glycerol biosynthesis and differentially
involved in the cellular responses to osmotic, anaerobic, and oxidative stress. Biol Chem.
276:3555-3563.
Pigeau, G.M. and D.L. Inglis. 2007. Response of wine yeast (Saccharomyces cerevisiae)
dehydrogenase to acetaldehyde stress during Icewine fermentation. J Appl Microbiol.
103:1576-1586.
Pigeau, G.M. and D.L. Inglis. 2005. Upregulation of ALD3 and GPD1 in Saccharomyces
cerevisiae during Icewine fermentation. J Appl Microbiol. 99:112-125.
Pigeau, G.M., E. Bozza, K. Kaiser and D.L. Inglis. 2007. Concentration effect of Riesling
Icewine juice on yeast performance and wine acidity. J Appl Microbiol. 103:1961-1698.
Remize, F., E. Andrieu and S. Dequin. 2000. Engineering of the pyruvate dehydrogenase
bypass in Saccharomyces cerevisiae: role of the cytosolic Mg2+ and mitochondrial K+
acetaldehyde dehydrogenases Ald6p and Ald4p in acetate formation during alcoholic
fermentation. Appl and Environ Microbiol. 66:3151-3159.

123
Remize, F., J.L. Roustan, J.M. Sablayrolles, P. Barre and S. Dequin. 1999. Glycerol
overproduction by engineered Saccharomyces cerevisiae wine yeast strains leads to
substantial changes in by-product formation and to a stimulation of fermentation rate in
stationary phase. Appl Environ Microbiol. 65:143-149.
Remize, F., L. Barnavon and S. Dequin. 2001. Glycerol export and glycerol-3-phosphate
dehydrogenase, but not glycerol phosphatase, are rate limiting for glycerol production in
Saccharomyces cerevisiae. Metab Eng. 3:300-312.
Roche Applied Science. 2012. Complete ultra tablets, EDTA-free glass vials. Retrieved
from: https://cssportal.roche.com/LFR_PublicDocs/ras/05892953001_en_01.pdf
van Dijken, J.P. and W.A. Scheffers. 1986. Redox balances in the metabolism of sugar by
yeast. FEMS Microbiol Rev. 32:139-224.
Vemuri, G.N., M.A. Eiteman, J.E. McEwan, L. Olsson and J. Nielsen. 2007. Increasing
NADH oxidation reduces overflow metabolism in Saccharomyces cerevisiae. PNAS.
104:2401-2407.
Verduyn, C., E. Postma, W.A. Scheffers and J.P. van Dijken. 1992. Effect of benzoic acid
on metabolic fluxes in yeasts: a continuous culture study on the regulation of respiration
and alcoholic fermentation. Yeast. 8:501-517.
Xie, W. 2008. Determination of NAD+ and NADH in a single cell under hydrogen peroxide
stress by capillary electrophoresis. MSc Thesis. Iowa State Univeristy, IA.

124
Chapter 4
Evaluation of Two Commercial Assay Kits for the Colorimetric Detection of
Nicotinamide Coenzymes in Wine Yeast Cell Lysate
Heit, C.1,2 and D.L. Inglis1,2,3
1 Cool Climate Oenology and Viticulture Institute, Brock University, St. Catharines, ON,
Canada
2 Centre for Biotechnology, Brock University, St. Catharines, ON, Canada
3 Department of Biological Sciences, Brock University, St. Catharines, ON, Canada
Formatted for the Journal of Applied Microbiology
4.1. Abstract
Aims: This study describes an evaluation of nicotinamide coenzyme determinations by a
colorimetric enzyme cycling method developed by Sigma-Aldrich® using a commercial
“NAD/ NADH Quantification Kit” and “NADP/ NADPH Quantification Kit” for use with
yeast cell extract. The biochemical interest of this determination lies in assessing the redox
balance of the NAD+/ NADH and NADP+/ NADPH system to determine their respective
roles as metabolic triggers for yeast-catalyzed acetic acid production.
Methods: The “NAD/ NADH Quantification Kit” provides a method for the sensitive
detection of intracellular nucleotides and their ratio, and is specific for only NAD+ and
NADH determination. Through an undefined enzyme cycling reaction, NADtotal (NAD+
and NADH) or NADH can be quantified in a colorimetric assay using a 96-well microtitre
plate (450 nm). In the same way, the “NADP/ NADPH Quantification Kit” can be used to
quantify NADPtotal (NADP+ and NADPH) or NADPH through the detection of NADPH.
Results and Comments: During evaluation of the assay method here, we report that
working assays for the measurement of NADtotal and NADPHtotal were established using a
colorimetric method developed by Sigma-Aldrich®. The method was optimized to include
a cell lysis buffer that was compatible with all assays, a filtration step to deproteinize the
lysate prior to coenzyme analysis, and ideal incubation times for the enzyme cycling
reactions. As part of the method development, all assays underwent validation to ensure
the established protocols were accurate and reproducible. The results obtained indicated
high linearity, accuracy and precision of the analytical method for measuring NADH and
NADPH, and that it was sensitive enough to accurately quantify the low coenzyme
concentrations (NADtotal and NADPtotal) present in the yeast extract,
Conclusions: The adapted technique was demonstrated to be relatively simple, fast and
inexpensive, and overall the results of the validation experiments suggest it to be a reliable

125
and reproducible method for measuring the coenzyme content in cell lysate. However,
issues pertaining to sample deproteinization and NAD+ and NADP+ decomposition in cell
extract for the measurement of NADH and NADPH indicate the need for additional
research and experiments.
Keywords: Nicotinamide coenzymes, enzyme assays, cycling reaction, quantification kits,
Saccharomyces cerevisiae.
4.2. Introduction
Redox homeostasis is an essential requirement for sustained metabolism and
growth in all living cells (Vemuri et al. 2007). Two pyridine nucleotide systems, NADH/
NAD+ and NADPH/ NADP+, determine the intracellular redox state in cells, primarily
through the NADH: NAD+ ratio and to a lesser extent by the NADPH: NADP+ ratio. In
Saccharomyces cerevisiae, these cofactor pairs play important roles as electron acceptors/
donors in over 300 biochemical reactions involving syntheses and oxidation-reduction (Lui
and Chen 2011; Forster et al. 2003), allowing them to have a critical effect on maintaining
intracellular redox balance (Heux et al. 2006). This importance has prompted a large
amount of research in this area, which is focused on determining the nucleotide content in
the cells, various organelles, and tissues of different organisms, including yeast, bacteria
and mammals (Xie et al. 2009).
Measuring the physiological levels of intracellular metabolites is of interest in the
field of metabolomics (Canelas et al. 2008). However, accurate quantification of NADH/
NAD+ and NADPH/ NADP+ levels is usually difficult to achieve. Since the turnover time
of many primary and secondary metabolites of microorganisms ranges from sub seconds
to several tens of seconds (Weibel et al. 1974; Taymaz-Nikerel et al. 2009; Douma et al.
2010), rapid changes in coenzyme ratios can occur when a sample is removed from its
original environment (Sporty et al. 2008), thereby affecting the reliability of the resulting

126
measurements. For this reason, sampling and quenching of metabolic activity should be
rapid to prevent (inter)conversion between metabolites (de Jonge et al. 2012). Furthermore,
only a portion of all the coenzymes present in the cell is free while the rest is bound to
protein (Kasischke et al. 2004), which also affects the accuracy of the measurements. Since
it is the free form that has a role in redox balance, measuring the total intracellular
nucleotide content (NADH + NAD+ or NADPH + NADP+) is not useful as it provides no
indication of the current redox state (Sun et al. 2012).
Several methods exist for measuring NADH/ NAD+ and NADPH/ NADP+ in extract
samples, although not without limitations. For some methods, only whole cell extract can
be assessed for its nucleotide content (Nissen et al. 2001; Cronwright et al. 2002; Cherati
et al. 2005; Agrimi et al. 2011; Serrano-Bueno et al. 2012) rather than specific subcellular
compartments such as the cytosol or mitochondria (Klingenberg 1975; Agrimi et al. 2011;
Sliwa et al. 2012; Suraniti et al. 2013). For others, free or bound forms of the coenzymes
cannot be distinguished, and often only the total amount of NAD(P)+ present in the sample
can be quantified. Separately quantifying these compounds is important as their
concentrations provide essential information about the metabolic, bioenergetic and/ or
redox status of the organism (Omachi et al. 1969; Marshall et al. 1974; Sies et al. 1983).
The approaches available for NAD(P)+ and NAD(P)H analysis can be divided into
two groups: those which are enzymatic, including both endpoint (spectrophotometric and
fluorometric) and cycling, and those which utilize chromatography, including thin-layer,
high performance liquid chromatography and high-pressure anion exchange
chromatography (Zerez et al. 1987). Since the quantities of nicotinamide adenine
dinucleotides in lysate samples are small, methods that allow for the determination of very

127
low levels are advantageous. Of the various enzymatic techniques available, the
spectrophotometric method is reputed to be accurate when the nucleotide content is
sufficiently high (more than 1 x 10⁻⁸ mole) (Klingenberg and Slenczka1959), while
measurements at lower concentrations (down to 0.5 10-11 mole) are possible using a
fluorometric method (Heldt and Klingenberg 1967). However, greater sensitivity can be
achieved using an enzymatic cycling method which allows for a sensitivity of 1 x 10⁻⁸ to
1x 10-13 mol per assay (Matsumura and Miyachi 1983; Gibon and Larher 1997).
Currently, a kit-based method is available from Sigma-Aldrich® that is able to
detect either NADH and NADtotal (NAD+ and NADH) or NADPH and NADPtotal (NADP+
and NADPH) using two colorimetric enzyme assays (“NAD/ NADH Quantification Kit”
and “NADP/ NADPH Quantification Kit”). The enzymatic method is based on a cycling
reaction, where enzymes within the reaction system recognize either NAD+/ NADH or
NADP+/ NADPH in the sample, which increases the detection sensitivity as the reaction is
specific for particular coenzymes (Sigma-Aldrich® 2012A and 2012B). Through these
reactions, the concentration of NADtotal (NAD+ and NADH) or NADH can be easily
quantified by comparison with the standard NADH, while NADPtotal (NADP+ and NADPH)
or NADPH can be determined by comparison with the standard NADPH. The assay
method requires the use of a microtitre plate reader and sample absorbance to be recorded
at 450 nm. This absorbance is notably higher than that used in the previous UV
spectrophotometric method (described in Chapter 3), which reduces background noise and
interference caused by the biological sample. Although the cycling assays allow for the
quantification of the total amount of pyridine nucleotides in cells, they cannot be used to
directly differentiate between reduced and oxidized forms of the cofactors (Sporty et al.
128
2008), which is an obvious limitation of the method. To indirectly measure the coenzymes,
the enzyme cycling reactions require a heating step to degrade the NAD+ or NADP+
present, thereby allowing only NADH and NADPH to be detected and the respective ratios
(NADH: NAD+ or NADPH: NADP+) to be determined (Sigma-Aldrich® 2012A and
2012B).
In the previous study conducted (Chapter 3), the method to measure both oxidized
and reduced forms of these coenzymes was determined to lack the sensitivity required to
quantify the low levels present in yeast cytosolic extract. These traditional assays were
conducted using specific enzyme assays where the reactions either consumed or produced
NADH and NADPH and monitoring absorption changes in the samples using a UV-Vis
spectrophotometer at 340 nm. Using this method, standard curves of each coenzyme were
constructed, and the LLOQ of NAD+, NADP+ and NADH was determined to be 10 µM,
while the LLOQ for NADPH was determined to be 25 µM. In comparison, the LLOQ of
the NADH and NADPH standard curves produced via the kit method are much lower at
0.4 µM. Based on the attributes of this method, the aim of our study was to critically
evaluate the applicability of two commercial assay kits for improving the detection
sensitivity and quantification of NAD+/ NADH and NADP+/ NADPH in yeast extract.
4.3. Materials and Methods
4.3.1. Yeast strain. Refer to Chapter 3, Section 3.3.1.
4.3.2. Culture media. Refer to Chapter 3, Section 3.3.2.
4.3.3. Yeast inoculation procedure and growth conditions for batch cultures. Refer to
Chapter 3, Section 3.3.3.
4.3.4. Determination of yeast wet weight. Refer to Chapter 3, Section 3.3.4.

129
4.3.5. Determination of yeast dry weight. Refer to Chapter 3, Section 3.3.5.
4.3.6. Preparation of yeast extracts for assays. Refer to Chapter 3, Section 3.3.6.
4.3.7. Deproteinization of cell extract with spin filters. Prior to enzymatic analysis,
cytosolic extract samples were deproteinized using molecular weight cut-off (MWCO) spin
filters manufactured by Pall Life Sciences (Mississauga, ON, CAN). Two devices were
selected based on volume, the Microsep™ Advance spin filter (0.5-5.0 ml) and the
Nanosep® spin filter (<0.5 ml), with a MWCO of 10 kDa and 30 kDa. After cytosolic
extraction, a measured volume of the sample was added to each centrifugation tube.
Samples in the Microsep™ Advance tubes were centrifuged at 7920 rpm at 4 ºC using the
Sorvall RC5C Plus ultracentrifuge (rotor model SS-34), and samples in the Nanosep® tubes
were centrifuged at 10 000 rpm at 4 ºC using the Sorvall Refrigerated Micro-Centrifuge
RMC-14. All samples were centrifuged until the volume of filtrate did not change,
indicating no more sample was able to pass through the pore size of the filter. Prior to
performing the assays, the volume of sample recovered was determined so that the
nucleotide content could be normalized to sample volume.
4.3.8. Overview: Determination of intracellular NAD(P)+ and NADPH
concentrations. Intracellular nucleotide concentrations were determined colorimetrically
using a microtitre plate reader (MR600 Microplate® Reader, Dynatech Laboratories, Inc.;
Alexandria, VI, USA) and “NAD/ NADH Quantification Kit” (MAK037) and “NADP/
NADPH Quantification Kit” (MAK038) supplied my Sigma-Aldrich® (St. Louis, MO,
USA). Calibration curves of NADH and NADPH were generated by plotting the standard
concentrations against the absorbance at 450 nm. Reactions were prepared in a clear 96-
well flat-bottom microtitration plate (Corning®, VWR; Mississauga, ON, CAN), and

130
nucleotides were detected following enzyme cycling reactions specific for the recognition
of NAD+/ NADH or NADP+/ NADPH. The cofactor contents, NADtotal (NAD+ and NADH)
and NADH or NADPtotal (NADP+ and NADPH) and NADPH, in the yeast sample extract
were then quantified by comparing with the standard NADH or NADPH.
4.3.8.1. Assay procedure for NAD+/ NADH and NADP+/ NADPH determination.
Quantification of NAD+/ NADH and NADP+/ NADPH concentrations in the yeast extract
and standard samples was achieved using a colorimetric enzyme cycling method developed
by Sigma-Aldrich® which was eventually optimized to include the cell breaking buffer
system (0.6 M mannitol; 20 mM HEPES-KOH, pH 7.4; 1 mM PMSF; 0.1% w/v fatty acid
free-BSA) used in the extraction protocol (4.3.6). Prior to using each kit, various reagents
were reconstituted with specified dilutents as per the kit instructions. For NAD+/ NADH
quantification, NADH standards were prepared from a 10 µM kit standard stock, and for
NADP+/ NADPH quantification, NADPH standards were prepared from a 10 µM kit
standard stock. To prepare these solutions, 10 µl of the 1 mM NADH or NADPH kit
standard were first diluted 100-fold with “NADH/ NAD Extraction Buffer” or “NADPH/
NADP Extraction Buffer” or cell breaking buffer to prepare a 10 µM standard solution.
The standard solution was then used to perform a series of dilutions to obtain a range of
calibration standards (0, 0.4, 0.8, 1.2, 1.6 and 2.0 µM NADH or NADPH) to construct a
calibration curve. To prepare standard samples, 0, 2, 4, 6, 8 and 10 µl of the 10 µM stock
were transferred into plate wells and brought to a final volume of 50 µl with buffer. For
cell extract samples, 50 µl of the deproteinzied sample (undiluted or diluted with buffer)
were transferred to a plate well. Standards and samples were tested in duplicate. To detect
only NADH or NADPH in the cell extract sample, NAD+ or NADP+ were first decomposed
131
prior to initiating the enzyme cycling reaction. To achieve decomposition, 200 µl of
extracted samples were aliquoted into 2 ml Eppendorf tubes and heated to 60ºC for 30
minutes in a water bath. After the heating period, samples were cooled on ice and
centrifuged at 10 000 rpm for 5 min at 4ºC to remove any precipitates using the Sorvall
Refrigerated Micro-Centrifuge RMC-14 (Newtown, CT, USA). These conditions
facilitated the decomposition of NAD+ or NADP+, leaving only NADH or NADPH in the
sample extract. Up to 50 µl of the decomposed sample were then transferred into a plate
well and brought to 50 µl with cell breaking buffer. Following standard and sample
preparation, all enzyme cycling reactions were initiated with the addition of 100 µl of the
kit Master Reaction Mix, which consisted of 98 µl of “NAD Cycling Buffer” or “NADP
Cycling Buffer” and 2 µl of “NAD Enzyme Cycling Mix” or “NADP Enzyme Cycling
Mix”. The contents in each well were mixed well by pipetting and the reactions were
incubated for 5 minutes at room temperature to convert NAD+ to NADH or NADP+ to
NADPH. Following this conversion, 10 µl of NADH or NADPH developer were added to
each well and the reactions were incubated at room temperature. After a specified time
(approximately 30 min), the absorbance was measured at 450 nm by the microplate reader.
The reactions were then terminated by the addition of 10 µl of Stop Solution.
4.3.9. Establishing an enzymatic assay method for nucleotide determination. Although
the assays used in this method had been previously validated by the manufacturer (Sigma-
Aldrich®), they were optimized for mammalian cells and contain reagents whose
formulations are proprietary. Therefore, during the validation process it was necessary to
perform additional experiments to investigate certain aspects of this assay method. Firstly,
it was important to ensure that the kit reagents of each assay were compatible with the cell

132
breaking buffer system used in the extraction protocol (Section 4.3.6), and hence that there
were no interferences caused by components of the buffer, and secondly that the
commercial assay systems could be adapted to yeast cells. During all validation
experiments, sufficient quality control procedures were carried out to ensure that the
expected performance of each assay was maintained throughout the duration of the
analyses. The fundamental parameters for evaluating this included: (1) linearity and range
(calibration curve), (2) precision (repeatability), (3) sensitivity (lower limit of
quantification), and (4) accuracy (recovery).
4.3.9.1. Linearity, precision, sensitivity and accuracy provided by the method. During
the initial stage of the validation process, it was necessary to first construct calibration
curves that defined the relationship between the known concentrations of each coenzyme
and optical density at the desired wavelength. The calibration curves for both NADH and
NADPH included standards from 0-2.0 µM. The linearity was evaluated by linear
regression analysis. Regression analysis was calculated using the least square method
(Microsoft Excel 2013), and was utilized to determine the linear correlation coefficient (R)
and coefficient of determination (R2) of standard curves for each standard. An R-value of
≥0.985 was used as criterion of linearity, while a high R2-value of ≥0.980 was used as
criterion for goodness of fit of the regression line. The precision of the procedure was
determined by analyzing duplicate samples of standard. The repeatability was expressed
numerically as the coefficient of variation (CV) of the duplicate measurements, which was
defined as the: (standard deviation of the analyte assay values/ mean concentration of the
analyte assay values) x 100. The precision was assessed for each concentration level and
did not exceed more than 20% of the CV. Assay sensitivity was evaluated on the basis of

133
the lower limit of quantification (LLOQ) using the concentration of the lowest detectable
standard from the data set that was in the prescribed accuracy and precision of the assay.
The accuracy of each assay method as based on recovery of known standards in the assay
based on standard addition. When preparing standard samples, known quantities of pure
analyte were added to the sample matrix (cell breaking buffer) and the increase in measured
concentration was determined. A comparison of the assayed coenzyme concentration
versus the predicted amount provided the recovery of the method and an estimation of its
accuracy, which was expressed as the: (average measured concentration of analyte/
predicted concentration of analyte) x 100. A recovery value found within the range of 90-
110% was considered acceptable.
134
4.4. Results
4.4.1. In-study validation of assays
4.4.1.1. Evaluation of commercial test kits for nucleotide determination
To determine if the assays were running according to the manufacturer’s
specifications, an initial experiment using the “NAD/ NADH Quantification Kit” and
“NADP/ NADPH Quantification Kit” was performed using standard solutions of the
cofactors to determine if suitable linearity, precision and accuracy could be obtained. Using
the respective kit reagents and standard solutions made up in the “NADH/ NAD Extraction
Buffer” or “NADPH/ NADP Extraction Buffer”, two linear calibration curves were
obtained between final concentrations of 0 to 2.0 µM NADH and NADPH (Fig. 4.1A and
4.1B). For the NADH calibration curve, the R-value was estimated to be 0.9971 and the
R2-value was estimated to be 0.9943. For the NADPH calibration curve, the R-value was
estimated to be 0.9907 and the R2-value was estimated to be 0.9814. Both results show
high linearity and good fit of the data. For duplicate measurements at each concentration
level, the calculated precision did not exceed more than 20% of the CV, and the acceptance
criterion for recovery was met (±10%). The results demonstrated that NADH and NADPH
can be precisely and accurately quantified within the established working range using the
colorimetric kits developed by Sigma-Aldrich®.
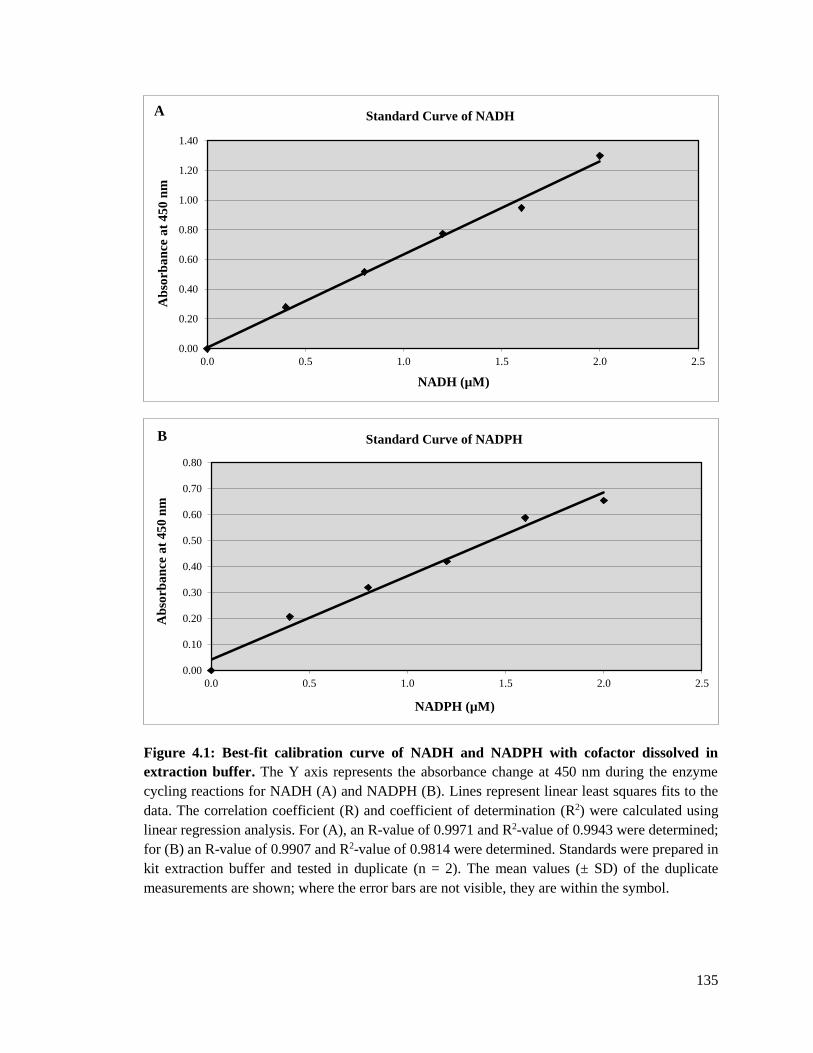
135
Figure 4.1: Best-fit calibration curve of NADH and NADPH with cofactor dissolved in
extraction buffer. The Y axis represents the absorbance change at 450 nm during the enzyme
cycling reactions for NADH (A) and NADPH (B). Lines represent linear least squares fits to the
data. The correlation coefficient (R) and coefficient of determination (R2) were calculated using
linear regression analysis. For (A), an R-value of 0.9971 and R2-value of 0.9943 were determined;
for (B) an R-value of 0.9907 and R2-value of 0.9814 were determined. Standards were prepared in
kit extraction buffer and tested in duplicate (n = 2). The mean values (± SD) of the duplicate
measurements are shown; where the error bars are not visible, they are within the symbol.
0.00
0.20
0.40
0.60
0.80
1.00
1.20
1.40
0.0 0.5 1.0 1.5 2.0 2.5
Ab
sorb
an
ce a
t 4
50
nm
NADH (µM)
Standard Curve of NADHA
0.00
0.10
0.20
0.30
0.40
0.50
0.60
0.70
0.80
0.0 0.5 1.0 1.5 2.0 2.5
Ab
sorb
an
ce a
t 4
50
nm
NADPH (µM)
Standard Curve of NADPHB

136
4.4.1.2. Evaluation of commercial test kits using yeast cell breaking buffer in place of
the cofactor extraction buffer
A second experiment was conducted to investigate the use of cell breaking buffer
in lieu of the “NADH/ NAD Extraction Buffer” or “NADPH/ NADP Extraction Buffer”
provided in the kit for preparation of the calibration standards NADH and NADPH (Fig.
4.2A and 4.2B). For the NADH calibration curve, the R-value was estimated to be 0.9974
and the R2-value was estimated to be 0.9949. For the NADPH calibration curve, the R-
value was estimated to be 0.9966 and the R2-value was estimated to be 0.9933. Both
calibration curve results show high linearity and good fit of the data. For duplicate
measurement at each concentration level, the calculated precision did not exceed more than
20% of the CV, and the acceptance criterion for recovery was met (±10%). These results
demonstrated that NADH and NADPH in yeast cell breaking buffer can be precisely and
accurately quantified within the established working range using the colorimetric kits
developed by Sigma-Aldrich®.

137
Figure 4.2: Best-fit calibration curve of NADH and NADPH with cofactor dissolved in yeast
cell breaking buffer. The Y axis represents the absorbance change at 450 nm during the enzyme
cycling reactions for NADH (A) and NADPH (B). Lines represent linear least squares fits to the
data. The correlation coefficient (R) and coefficient of determination (R2) were calculated using
linear regression analysis. For (A), an R-value of 0.9974 and R2-value of 0.9949 were determined;
for (B) an R-value of 0.9966 and R2-value of 0.9933were determined. Standards were prepared in
cell breaking buffer and tested in duplicate (n = 2). The mean values (± SD) of the duplicate
measurements are shown; where the error bars are not visible, they are within the symbol.
0.00
0.20
0.40
0.60
0.80
1.00
1.20
1.40
1.60
1.80
0.0 0.5 1.0 1.5 2.0 2.5
Ab
sorb
an
ce a
t 4
50
nm
NADH (µM)
Standard Curve of NADHA
0.00
0.02
0.04
0.06
0.08
0.10
0.12
0.0 0.5 1.0 1.5 2.0 2.5
Ab
sorb
an
ce a
t 4
50
nm
NADPH (µM)
Standard Curve of NADPHB

138
4.4.1.3. Calibration of assay incubation times
In both manuals for the “NAD/ NADH Quantification Kit” and “NADP/ NADPH
Quantification Kit”, the incubation time for the cycling reaction was indicated to range
between 1-4 hours. To assist in addressing this logistic and timing issue, time-course
experiments were conducted to determine the range of acceptable times for the incubation
step in the assay. The length of incubation time was limited by the upper threshold level of
the microtitre plate reader, which was set to 1.900.
4.4.1.3.1. Calibration of NAD+/ NADH assay incubation times
For the NADH assay, reactions were carried out according to the kit manual and
absorbance readings were taken at 10 minute intervals, beginning 10 minutes after the start
of incubation and terminating after 40 minutes (Appendix III, Fig. 1). At each interval, the
resulting calibration curve was assessed for its linearity and range, and for the precision
and accuracy of each measurement. After 20 and 30 minutes of incubation time, the
respective R and R2-values of each curve were determined to be the highest and closest to
one, suggesting high linearity and good fit of the data. The calculated precision for
duplicate measurements at each concentration level did not exceed more than 20% of the
CV, and the acceptance criterion for recovery was met (±10%). As the incubation time
increased, the absorbance measurements of the higher concentrated standards began to
exceed the upper absorbance limit of the plate reader resulting in no numerical values.
These results demonstrated the optimal incubation time for the NAD+/ NADH cycling
reaction to be around 20 to 30 minutes using the colorimetric kit method.

139
4.4.1.3.2. Calibration of NADP+/ NADPH assay incubation times
For the NADPH assay, reactions were carried out according to the manual and
absorbance readings were taken at 20 minute intervals, beginning 10 minutes after the start
of incubation and terminating after 90 minutes (Appendix III, Fig. 1). At each interval, the
resulting calibration curve was assessed for its linearity and range, as well as for the
precision and accuracy of each measurement. At the 50 minute interval and thereafter, the
respective R and R2-values of each calibration curve were determined to be greater than
0.9990 suggesting high linearity and good fit of the data. The calculated precision for
duplicate measurements at each concentration level did not exceed more than 20% of the
CV, and the acceptance criterion for recovery was met (±10%). These results demonstrated
the optimal incubation time for the NADP+/ NADPH cycling reaction to be around 50
minutes using the colorimetric kit method.
140
4.4.1.4. Measurement of nucleotide contents in cell lysate
Following the calibration studies, the assay method was applied to cell lysate
samples isolated from S. cerevisiae EC-1118 to determine the sensitivity of the each assay,
and specifically whether the low coenzyme concentrations present in the cytosolic extract
samples could be precisely and accurately detected and quantified using the commercial
assay kits. Assay sensitivity was also evaluated on the basis of the lower limit of
quantification (LLOQ) using the concentration of the lowest detectable standard from the
data set. As shown on the calibration curves for each assay, the LLOQ (0.4 µM) was the
same for the “NAD/ NADH Quantification Kit” and “NADP/ NADPH Quantification Kit”
(Fig. 4.1 and 4.2). Coenzyme concentrations below the LLOQ were considered inaccurate
as the values were outside the range of the standard curve.
The accuracy of the procedure was further evaluated using spike-and-recovery
experiments. A comparison of the assayed coenzyme concentration versus the theoretical
amount provided the recovery of the method and an estimation of its accuracy. For a
calibration curve with a range of 0 to 2.0 µM, the concentration of the positive control
(spike) sample was selected to be 0.8 µM as this concentration was close to the middle of
the curve. Table 4.2 shows the recoveries of the coenzymes from the standard addition
experiments performed on cell lysate after correction for the contribution from yeast to the
NADtotal or NADPtotal content (Table 4.1). Recovery of a 0.8 µM NADH matrix spike was
93.8%, while recovery of a 0.8 µM NADPH matrix spike was 90.0%. In addition to the
high recovery of the standard concentrations, the coenzyme content in the unspiked cell
lysate was also quantifiable. The NADtotal content was determined to be 0.74 ± 0.01 µM,
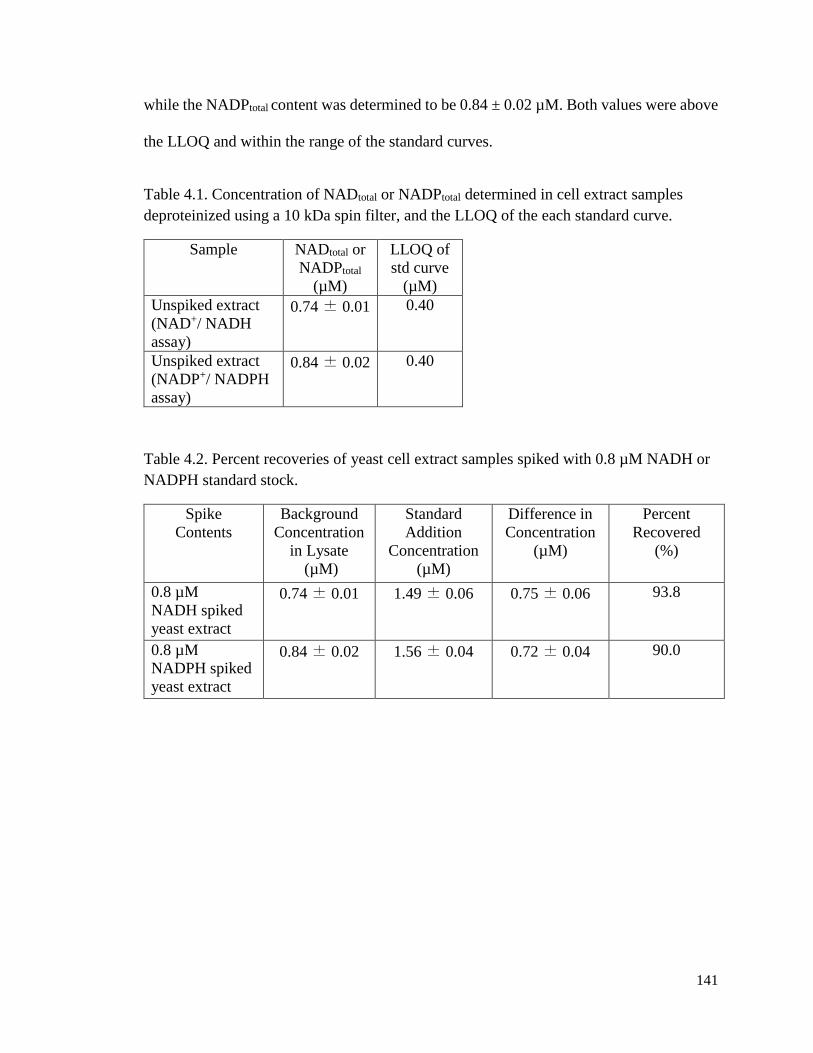
141
while the NADPtotal content was determined to be 0.84 ± 0.02 µM. Both values were above
the LLOQ and within the range of the standard curves.
Table 4.1. Concentration of NADtotal or NADPtotal determined in cell extract samples
deproteinized using a 10 kDa spin filter, and the LLOQ of the each standard curve.
Sample NADtotal or
NADPtotal
(µM)
LLOQ of
std curve
(µM)
Unspiked extract
(NAD+/ NADH
assay)
0.74 ± 0.01 0.40
Unspiked extract
(NADP+/ NADPH
assay)
0.84 ± 0.02 0.40
Table 4.2. Percent recoveries of yeast cell extract samples spiked with 0.8 µM NADH or
NADPH standard stock.
Spike
Contents
Background
Concentration
in Lysate
(µM)
Standard
Addition
Concentration
(µM)
Difference in
Concentration
(µM)
Percent
Recovered
(%)
0.8 µM
NADH spiked
yeast extract
0.74 ± 0.01 1.49 ± 0.06 0.75 ± 0.06 93.8
0.8 µM
NADPH spiked
yeast extract
0.84 ± 0.02 1.56 ± 0.04 0.72 ± 0.04 90.0

142
4.5. Discussion
4.5.1. Method for preparing yeast cell extracts for enzymatic analyses
The coenzyme assays were developed with the objective of measuring the redox
status of the cell by measuring the concentration of NAD+, NADH, NADP+ and NADPH
in yeast cytosolic extract isolated from S. cerevisiae strain EC-1118 cells. Establishment
of such assays was dependent on the application of cytosolic extract as both NAD+-
dependent Ald2/ 3p and NADP+-dependent Ald6p are localized in the cytosol (Navarro-
Avino et al. 1999). The remaining aldehyde dehydrogenases, Ald4p and Ald5p, are
mitochondrial and were not of interest in this study. To obtain a cytosolic extract,
subcellular fractionation was used and was preceded by an extraction protocol to produce
a crude cytosolic extract. This method was established in the previous study (Chapter 3)
evaluating the use of a UV-endpoint method for measuring the nicotinamide coenzymes in
yeast cell lysate (Bergmeyer 1974, Chapter 3).
4.5.2. Method development of enzyme assays
Assay kits developed by Sigma-Aldrich® formed the basis for the establishment of
coenzyme assays for measuring the nucleotide content in yeast cytosolic extract. Although
background information on the kits indicated this method to have baseline potential for
achieving our research objectives, refinement of the existing protocol was still required.
To enable robust, reliable measurement of the coenzymes in yeast, it was initially necessary
to develop a cell lysis method for isolating the cytosolic fraction from yeast cells, as
detailed in Section 4.3.6, different from that described in the technical bulletins of the
“NAD/ NADH Quantification Kit” and “NADP/ NADPH Quantification Kit” (Sigma-
Aldrich® 2012A and 2012B). In these bulletins, the protocol for cell sample preparation is
143
based on whole cell extract, which would preclude us from achieving our research
objectives as our interest is only in the cytosolic fraction of the yeast cell.
Furthermore, as part of the kit protocol “NAD/ NADH Extraction Buffer” and
“NADP/ NADPH Extraction Buffer” are required for nucleotide extraction from whole
cells whose formulations are proprietary. However, the cell lysis component of our
protocol necessitated the inclusion of a homogenization buffer to facilitate cell lysis, which
was previously determined to be suitable for coenzyme analysis using a UV-endpoint
enzymatic method (Chapter 3). This buffer was to be used in lieu of the kit extraction
buffers, making it essential that the kit reagents of each assay were compatible with the
components of the buffer system used in the extraction protocol (Section 4.3.6). The
contents of the buffer included 0.6 M mannitol, 20 mM HEPES-KOH (pH 7.4), 1mM
PMSF and 0.1% (w/ v) fatty-acid free-BSA.
The initial assay experiment conducted verified the enzymatic method established
by Sigma-Aldrich® could be successfully repeated and performed under our laboratory
conditions. For both assays assessed (NAD+/ NADH and NADP+/ NADPH), the protocols
were strictly followed using standards made up in extraction buffer resulting in high
linearity, accuracy and precision of the analytical procedure. With a working assay method
in hand, the next experiment conducted investigated the use of the cell breaking buffer in
lieu of the kit extraction buffer for preparation of the calibration standards. The results of
the method validation demonstrated compatibility of the cell breaking buffer with the kit
reagents as the acceptance criterion for accuracy, precision and linearity were met,
indicating that NADH and NADPH can be quantified within the established working range
of the standard curves using the modified colorimetric method. As no interference was

144
detected, further optimization of the lysis buffer was unnecessary, allowing the method to
be further refined to determine the optimal incubation time for each assay.
Following the calibration studies, spike-and-recovery experiments were performed
using deproteinized cell extract to give an estimation of the accuracy of the method, and
specifically whether the low coenzyme concentrations present in the cytosolic extract could
be precisely and accurately detected and quantified using the established assay protocols.
The results indicated standard recovery in the spiked extract to be high, and the measured
NADtotal and NADPtotal concentrations in the unspiked extract to be above the LLOQ and
within the established working range of each standard curve, suggesting no issues with the
yeast lysate sample.
However, issues with the detection of only NADH and NADPH did surface
following analysis of the decomposed samples. The results indicated the content of NADH
and NADPH to be the same or higher than that of NADtotal and NADPtotal, suggesting a
potential issue with the decomposition procedure used to obtain only the reduced cofactors
in the yeast extract sample. Although a heating step to detect only NADH or NADPH is
typical for enzymatic cycling reactions, redox reactions may continue during this time,
thereby altering the redox state of the cell (Sporty et al. 2008). It is also possible that the
heat treatment performed on the sample (60°C water bath for 30 min) was insufficient to
properly degrade the NAD+ and NADP+ present, necessitating the need for additional work
to be done on this in the future. Since the individual coenzymes could not be quantified,
the ratios of NAD+/ NADH and NADP+/ NADPH were unable to be determined,
consequently limiting the application of this method.

145
4.6. Conclusions
During development of the assay here, we report that working assays for the
measurement of NADtotal and NADPtotal were established based on two colorimetric kits
manufactured by Sigma-Aldrich®. The method was optimized to include a yeast cell lysis
buffer that was compatible with all assays, a deproteinization step to remove interfering
compounds and clarify the sample extract prior to coenzyme analysis, and ideal incubation
times for the enzyme cycling reactions. As part of the method development, all assays
underwent validation to ensure the established protocols were reliable and reproducible.
The results obtained indicated high linearity, accuracy and precision of the analytical
method, and that it was sensitive enough to accurately quantify the low coenzyme
concentrations present in the extract samples. However, issues pertaining to sample
deproteinization and NAD+ and NADP+ decomposition in cell extract for the measurement
of only NADH and NADPH suggest the need for additional research and experiments.

146
4.7. Literature Cited
Agrimi, G., L. Brambilla, G. Frascotti, I. Pisano, D. Porro, M. Vai and L. Palmieri. 2011.
Deletion or overexpression of mitochondrial NAD+ carriers in Saccharomyces cerevisiae
alters cellular NAD and ATP contents and affects mitochondrial metabolism and the rate
of glycolysis. Appl Environ Microbiol. 77:2239-2246.
Bergmeyer, H.U. 1974. Methods in enzymatic analysis, 2nd ed, vol. IV. Verlag Chemie
Weinbeim, Acadmic Press Inc, pp. 2045-2072.
Canelas, A.B., C. Ras, A. ten Pierick, J.C. van Dam, J.J. Heijen and W.M. van Gulik. 2008.
Leakage-free rapid quenching technique for yeast metabolomics. Metabolomics. 4:226-
239.
Cherati, N., S. Guezenec and J.M. Salmon. 2005. Redox interactions between
Saccharomyces cerevisiae and Saccharomyces uvarum. Appl Enviro Microbiol. 71:255-
260.
Cronwright, G.R., J.M. Rohwer and B.A. Prior. 2002. Metabolic control analysis of
glycerol synthesis in Saccharomyces cerevisiae. Appl Enviro Microbiol. 68:4448-4456.
de Jonge, J.J., R.D. Douma, J.J. Heijnen and W.M. van Gulik. 2012. Optimization of cold
methanol quenching for quantitative metabolomics of Penicillium chrysogenum.
Metabolomics. 4:727-735.
Douma, R. D., L.P. de Jonge, C.T.H. Jonker, R.M. Seifar, J.J. Heijnen and W.M. van Gulik.
2010. Intracellular metabolite determination in the presence of extracellular abundance:
application to the penicillin biosynthesis pathway in Penicillium chrysogenum. Biotechnol
Bioeng. 107:105-115.
Forster, J., I. Famili, P. Fu, B.O. Palsson and J. Nielsen. 2003. Genome-scale reconstruction
of Saccharomyces cerevisiae metabolic network. Genome Res. 13:244-253.
Gibon, Y. and F. Larher. 1997. Cycling assay for nicotinamide adenine dinucleotides: NaCl
precipitation and ethanol solubilization of the reduced tetrazolium. Anal Biochem.
251:153-157.
Heldt, H.W. and M. Klingenberg in S.P. Colowick and N.O. Kaplan: Methods in
enzymology, Vol. X, p. 3, Academic press, New York/ London 1967.
Heux. S., R. Cachon and D. Dequin. 2006. Cofactor engineering in Saccharomyces
cerevisiae: expression of H2O-forming NADH oxidase and impact on redox metabolism.
Metab Eng. 8:303-314.
147
Kasischke, K.A., H.D. Vishwasra, P.J. Fisher, W.R. Zipfel and W.W. Webb. 2004. Neural
activity triggers neuronal oxidative metabolism followed by astrocytic glycolysis.
Science. 305: 99–103.
Klingenberg, M. 1974. Nicotinamide-adenine dinucleotides (NAD+, NADP+, NADH,
NADPH): spectrophotometric and fluorimetric methods, p. 2045-2059. In H.U. Bergmeyer
(ed.), Methods of enzymatic analysis, 2nd ed., vol. 4. Academic Press, NY, NY.
Klingenberg, M. and W. Slenczka. 1959. Pyridynnucleotide in leber-mitochondrien. Eine
analyse ihrer redox-beziehungen. Biochem Z. 331:486-517.
Liu, L.M. and J. Chen. 2011. Cofactor engineering enhances the physiological function of
an industrial strain. Progress in molecular and environmental bioengineering-from analysis
and modeling to technology applications. Edited by Capri A. In Tech Open Access
Publisher, Rijeka. 427-444.
Navarro-Avino, J.P., R Prasad, V.J. Miralles, R.M. Benito and R. Serreno. 1999. A
proposal of nomenclature of aldehyde dehydrogenases in Saccharomyces cerevisiae and
characterization of the stress-inducible ALD2 and ALD3 genes. Yeast. 15:829-842.
Marshall, W.E. and A. Omachi. Measured and calculated NAD+/NADH ratios in human
erythrocytes. 1974. Biochim Biophys Acta. 354:1-10.
Matsumura, H. and S. Miyachi. 1983. Cycling assay for nicotinamide adenine
dinucleotides. p. 465-470 in Method in enzymology. Vol. 69, San Pietro, A., Ed. NY, NY.
Nissen, T.L., 2001. Expression of cytoplasmic transhydrogenase in S. cerevisiae results in
formation of 2-oxoglutarate due to depletion of the NADPH. Yeast. 18:19-32.
Omachi, A., C.B. Scott and H. Hegarty. 1969. Pyridine nucleotides in human erythrocytes
in different metabolic states. Biochim Biophys Act. 184:139-147.
Serrano-Bueno, G., A. Hernandez, G. Lopez-Lluch, J. R. Perez-Castineira, P. Navas and
A. Serrano. 2012. Inorganic pyrophosphatase defects lead to cell cycle arrest and
autophagic cell death through NAD depletion in fermenting yeast. J Biol Chem.
288:13082-13092.
Sies, H., R. Brigelius, H. Wefers, A. Müller and E. Cadenas. 1983. Cellular redox changes
and response to drugs and toxic agents. Fundam Appl Toxicol. 3:200-208.
Sigma-Aldrich®. 2012A. Complete product information- NAD/ NADH Quantification
Kits. Retrieved from:

148
http://www.sigmaaldrich.com/content/dam/sigmaaldrich/docs/Sigma/Bulletin/1/mak037b
ul.pdf
Sigma-Aldrich®. 2012B. Complete product information- NADP/ NADPH Quantification
Kits. Retrieved from:
http://www.sigmaaldrich.com/content/dam/sigmaaldrich/docs/Sigma/Bulletin/1/mak038b
ul.pdf
Sliwa, D., J. Dairou, J.M. Camadro and R. Santos. 2012. Inactivation of mitochondrial
aspartate aminotransferase contributes to the respiratory deficit of yeast frataxin-deficient
cells. Biochem J. 441:945-953.
Sporty, J.L., M.M. Kabir, K.W. Turteltaub, T. Ognibene, S.J. Lin and G. Bench. 2008.
Single sample extraction protocol for the quantification of NAD and NADH redox states
in Saccharomyces cerevisiae. J Sep Sci. 31:3202-3211.
Sun, F., C. Dai, J. Xie and X. Hu. 2012. Biochemical issues in estimation of cytosolic free
NAD/ NADH ratio. Plos One. 7:1-10.
Suraniti, E., V.S. Vajrala, B. Goudeau, S.P. Bottari and M. Rigoulet. 2013. Monitoring
metabolic responses of single mitochondria within poly(dimethylsiloxane) wells: study of
their endogenous reduced nicotinamide adenine dinucleotide evolution. Anal Chem. 85:
5146-5152.
Taymaz-Nikerel, H., M. De Mey, C. Ras, C., A. ten Pierick, R.M. Seifar, J. C. van Dam,
J.J. Heijen and W.M. van Gulik. 2009. Development and application of a differential
method for reliable metabolome analysis in Escherichia coli. Anal Biochem. 386:9-19.
Vemuri, G.N., M.A. Eiteman, J.E. McEwan, L. Olsson and J. Nielsen. 2007. Increasing
NADH oxidation reduces overflow metabolism in Saccharomyces cerevisiae. PNAS.
104:2401-2407.
Weibel, K. E., J.R. Mor and A. Fiechter. 1974. Rapid sampling of yeast-cells and
automated assays of adenylate, citrate, pyruvate and glucose-6-phosphate pools. Anal
Biochem. 58:208-216.
Xie, W., A. Xu and E.S. Yeung. 2009. Determination of NAD+ and NADH in a single cell
under hydrogen peroxide stress by capillary electrophoresis. Anal Chem. 81:1289-1284.
Zerez, C.R., S.J. Lee and K.R. Tanaka. 1987. Spectrophotometric determination of
oxidized and reduced pyridine nucleotides in erythrocytes using a single extraction
procedure. Anal Biol. 164:367-373.
149
5. Discussion and Conclusions
5.1. Overall discussion and future research directions
Wines produced from high sugar musts, including Icewine and appassimento-style
wines, represent a considerable investment for growers and winemakers. Allowing grapes
to dry off-vine postharvest using different drying techniques until the desired sugar content
is reached exposes berries to potential mold and bacteria formation and the risk of spoilage.
Once these shrivelled, dehydrated berries have been obtained, the winemaker may then be
confronted with slower fermentation rates due to the higher sugar content of the resulting
must, risk of lower alcohol levels being achieved in the final wines, and the production of
off-flavours.
Acetic acid and ethyl acetate are important components of wine because of their
association with spoilage and their abilities to negatively impact wine composition and
quality. When present in sufficient concentrations, these metabolites affect the organoleptic
properties of wine and may cause the volatile acidity (VA) levels to exceed legal limits. At
high levels, acetic acid imparts a vinegar aroma to the sensory profile of a wine while ethyl
acetate contributes a nail polish remover or solvent-like aroma. In Canada, Vintners
Quality Alliance (VQA) defines the maximum allowable limit of VA in Icewine and table
wine to be 2.1 g l-1 and 1.3 g l-1 acetic acid, respectfully (VQA 2013). Although usually
present in lower concentrations, the low detection threshold of ethyl acetate makes it easier
to perceive in Icewine than acetic acid, and consequently a problematic compound for
producers desiring their wines to be VQA-approved. Cliff and Pickering (2006) determined
the sensory threshold for acetic acid in Icewine to be 3.185 g l-1, while its reported
concentration range was between 0.49 to 2.29 g l-1 (Nurgel et al. 2004). On the other hand,
150
the sensory threshold of ethyl acetate was determined to be 0.198 g l-1 (Nurgel et al. 2004),
thereby falling within the range produced in Canadian Icewines currently on the market
(0.086 to 0.369 g l-1) (Cliff and Pickering 2006).
Due to prevalent concerns within the wine industry regarding volatile acidity
production in high sugar wines, as well as the desire of our lab group to advance knowledge
on this topic, a main goal of this project was to gain a better understanding of the adapted
response of wine yeast to sugar-induced osmotic stress and factors controlling acetic acid
and ethyl acetate production during high sugar fermentations. The second goal of this
project was to establish a method for measuring pyridine nucleotides (NAD+, NADH,
NADP+, NADPH) in yeast cytosolic extract that can be used in future research experiments
to understand how these stress responses relate to the intracellular redox balance of
fermenting wine yeast for controlling metabolic pathways.
5.1.1. Osmostress induced by appasssimento-type must reduced the fermentation
capacity of wine yeast and increased glycerol and acetic acid formation by S.
cerevisiae
In this study, the high osmotic stress experienced by commercial S. cerevisiae EC-
1118 and the natural isolate of S. bayanus throughout the course of fermentation in
appassimento-type must induced changes in yeast metabolism which correlated to several
fermentation challenges including slower fermentation rates and increased production of
metabolites involved in the yeast’s stress response, including glycerol and acetic acid. Two
fermentation conditions were examined in this study and included an 18°Brix must and a
27°Brix must, which was produced from grapes that were harvested at 18°Brix and
subsequently kiln-dried to 27°Brix.
151
In agreement with Caridi et al. (1999), a positive relationship between the
increasing initial sugar concentration of juice and elevated acetic acid production has been
demonstrated in this study, specifically in the 27°Brix must fermented by EC-1118. This
increase in acetic acid was preceded and eventually accompanied by an increase in glycerol
production. Past studies have concluded that S. cerevisiae cells produce glycerol to serve
as a compatible solute when placed under osmotic stress (Blomberg and Alder 1989;
Nevoigt and Stahl 1997; Blomberg 2000). The osmotic stress induced by Icewine juice in
particular was found to increase GPD1 expression and glycerol production (Pigeau and
Inglis 2005), where NADH is used as a cofactor to catalyze the reduction of DHAP to
glyceraldehyde-3-phosphate by glyceraldehyde-3-phosphate dehydrogenase. The
biosynthesis of acetic acid by an NAD+-dependent aldehyde dehydrogenase can regenerate
the NADH required by yeast to maintain intracellular redox balance and thus homeostasis,
which is supported by the positive correlation observed between glycerol and acetic acid
following normalization to sugar consumed (Pigeau et al. 2007). However, the role that
each Aldp plays in S. cerevisiae is not clear as yeast lack trans-
hydrogenase to convert between reducing equivalents (van Dijken and Scheffers 1986).
5.1.2. Acetic acid formation in S. cerevisiae during high sugar fermentations and
relationship to acetylCoA
The reason for elevated acetic acid production by wine yeast under hyperosmotic
stress is still unresolved, but may be due to a combination of metabolic and transcriptional
factors resulting in a build-up of acetic acid due to a lack of further conversion to acetylCoA
(Pigeau and Inglis 2005; 2007; Martin 2008). Several aldehyde dehydrogenases are
involved in acetic acid production during table wine fermentation, but the elevated levels
observed in high sugar wines appear to be due to the activity of Ald3p or Ald6p. Erasmus
152
et al. (2003) reported ALD2, ALD3, ALD4 and ALD6 to be up-regulated following brief
exposure to increased osmotic stress, which corresponded to an increase in acetic acid
production during fermentation. However, it is unknown whether these initial expressions
were transient or sustained throughout the fermentation as levels were not monitored for
the entire duration. Of the isogenes up-regulated, ALD6 was expressed at the highest level
and has been reported to be responsible for the majority of acetic acid generated in a
laboratory S. cerevisiae strain grown under aerobic conditions exposed to 40% (w/ v)
glucose (Erasmus and van Vuuren 2009). This study linked acetic acid generation under
osmotic stress to NADPH production, possibly as a way to compensate for the down-
regulation of NADPH generated through the pentose phosphate pathway (Bro et al. 2003;
Erasmus and van Vuuren 2009).
In contrast, the work of Pigeau and Inglis (2005; 2007) indicated a larger role for
Ald3p as ALD3 was shown to be differentially up-regulated in Icewine juice compared to
table wine juice, which corresponded to an increase in acetaldehyde and acetic acid
production during Icewine fermentation. The results showed ALD3 displayed a 6.2-fold
up-regulation on day 4 of fermentation compared to the table wine juice, which could
account for the elevated level of acetic acid found in Icewine. ALD3 was also found to be
the only ALD further up-regulated by acetaldehyde stress, while the expression of the
remaining ALD genes was determined to be unaffected (Pigeau and Inglis 2007). Based on
these findings, the increased expression of ALD3 was proposed to be necessary but not
sufficient to cause elevated acetic acid during the high sugar fermentation, suggesting
additional hyperosmotic stress responses may be required.
153
During alcoholic fermentation, acetic acid can be converted to acetylCoA in an
ATP-dependent reaction catalyzed by an acetylCoA synthetase encoded by ACS1 and
ACS2. Within the yeast cell, acetylCoA is required for the biosynthesis of lipids, sterols
and amino acids during growth. Since only ACS2 is present in the cytosol under anaerobic
conditions and is required for growth on glucose (van den Berg and Steenma 1995), it is
likely responsible for catalyzing the conversion of acetic acid to acetylCoA during
alcoholic fermentation. Under high sugar stress, Martin (2008) reported both ACS isoforms
to be strongly down-regulated in yeast fermenting Icewine juice compared to table wine
juice, and therefore may be a contributing factor to the high acetic acid levels released in
Icewine. Down-regulation of these genes would reduce the need for acetate as a substrate
for acetylCoA synthetase, thereby reducing the formation of acetylCoA and resulting in a
build-up in acetic acid.
Although the contribution of acetaldehyde to increased acetic acid production
during Icewine fermentation has been investigated (Pigeau and Inglis 2007), the substrate
availability of NAD+ or NADP+ to aldehyde dehydrogenase has not. Thus, an essential part
of the research lies in understanding the altered redox state of the yeast cells during
fermentation and determining its impact on the metabolic regulation of acetic acid
production under hyperosmotic stress. For these determinations to be made, the ratio of
NAD+/ NADH versus NADP+/ NADPH in yeast during fermentation in high versus low
sugar juice will be measured, which will allow the redox status of both coenzyme systems
to be assessed and its influence on acetic acid and glycerol production to be determined.
The concentration of the oxidized nicotinamide cofactors, NAD+ and NADP+, will also be
154
compared to the rate of acetic acid production to determine if substrate availability is a
controlling factor in increased acetic acid production.
To date, factors controlling the metabolic regulation of elevated acetic acid
production have only been examined partially at the substrate level in Icewine and
appassimento-style wine, and at the transcriptional level in Icewine. Future projects will
include using enzyme assays to analyze the activity levels of yeast cytosolic and
mitochondrial aldehyde dehydrogenases and acetylCoA synthetases to ascertain their
contributions to acetic acid production. Completion of these experiments will also enable
the respective activity levels to be compared to the previously measured gene expression
levels (Pigeau and Inglis 2005; 2007; Martin and Inglis 2006; Martin 2008) to determine
whether up- or down-regulation of gene expression translates to an increase or decrease in
enzyme activity. These results will confirm whether enzyme activity is, at least partially,
under transcriptional control and its role in acetic acid production.
5.1.3. Ethyl acetate formation in S. cerevisiae during high sugar fermentations and
relationship to acetylCoA
A second consequence of low ACS expression may be the formation of low ethyl
acetate levels during high sugar fermentations. Since acetylCoA is a substrate for alcohol
acetyltransferases, low acetylCoA levels would reduce the amount of substrate available
to acetyltransferases, thereby reducing the amount of ethyl acetate formed during
fermentation. In a previous study, two-fold lower ethyl acetate levels were determined to
be produced in Icewine by a commercial S. cerevisiae strain compared to that found in the
table wine, whereby acetylCoA is required for catalysis (Heit 2011; Heit and Inglis 2012).
This same production trend was observed in the appassimento study as higher levels of
ethyl acetate were measured in table wine compared to appassimento-style wine.
155
Since ethanol is unlikely a limiting substrate contributing to low ethyl acetate
formation due to its high levels in wine, future research will involve measuring acetylCoA
production by wine yeast fermenting under high and low sugar stress to determine
differences in substrate availability between the two sugar conditions. While limited
substrate availability reduces ester synthesis, reduced enzyme activity also decreases the
amount of product formed. Unfortunately, the activity levels of enzymes indirectly
involved in ester synthesis, including aldehyde dehydrogenases and acetylCoA
synthestases, and those directly involved in ester synthesis, including alcohol
acetyltransferases, were not measured, and therefore differences in enzyme activity levels
within strains fermenting under high and low sugar stress were not determined. Due to this
limitation, the contribution of the relevant enzymes to increased ethyl acetate formation
under low sugar stress could not be ascertained from this study. This would be important
to investigate in the future to gain a more comprehensive understanding of the factors
influencing ethyl acetate formation during high sugar fermentations.
5.1.4. Strain-related differences in acetic acid and ethyl acetate formation
Two wines yeasts, commercial S. cerevisiae strain EC-1118 and a natural isolate of
S. bayanus, were investigated to evaluate their differences in acetic acid and ethyl acetate
production in appassimento-type must produced using kiln drying. The S. bayanus strain
produced significantly less acetic acid per gram of sugar metabolized than EC-1118 during
fermentation in the high sugar must, which is consistent with past studies demonstrating
acetic acid production is yeast-strain dependent (Patel and Shibamoto 2002; Torrens et al.
2008; Erasmus et al. 2004). S. bayanus also demonstrated trends consistent with lower
ethyl acetate production compared to S. cerevisiae (Heit and Inglis 2013), a result

156
consistent with previous studies conducted in Icewine juice (Heit 2011; Heit and Inglis
2012). However, although acetic acid and ethyl acetate play important roles as (off)
flavours in wine, little is known about the factors controlling their production during
alcoholic fermentation, as previously discussed, and strain-related differences that exist
that may contribute to higher or lower formation.
Acetic acid production is complex process in wine yeast. During alcoholic
fermentation, acetate is produced as an intermediate of the cytosolic pyruvate
dehydrogenase (PDH) bypass, an alternative route to the PDH reaction for the direct
conversion of pyruvate to acetylCoA (Remize et al. 2000). This pathway involves the
conversion of pyruvate to acetaldehyde, which is subsequently oxidized to acetate by
aldehyde dehydrogenase. Through the action of acetylCoA synthetase, acetate is then
converted into acetylCoA, ensuring its availability for lipid and sterol biosynthesis.
Therefore, acetate production by fermenting yeast represents the balance between aldehyde
dehydrogenase and acetylCoA synthetase activity (Cordente et al. 2013); yeast with the
lowest aldehyde dehydrogenase activity and highest acetylCoA synthetase activity produce
the least amount of acetic acid (Verduyn et al. 1990), although substrate availability may
also exert a controlling influence. This is also true for ethyl acetate, which can be formed
enzymatically via an alcohol acetyltransferase through the condensation of acetylCoA and
ethanol (Plata et al. 2003). Due to the relationship of these compounds to acetaldehyde and
ethanol, yeast strains used in this study were evaluated for their production of other
metabolites involved in the stress response leading to acetic acid and ethyl acetate
formation. Analysis of these metabolites allowed for a better understanding of ethyl acetate
157
formation during fermentation, and evaluation of its relationship to acetic acid formation
and increased osmotic stress in fermenting wine yeast (Heit 2011; Heit and Inglis 2013).
However, the contribution of the various enzymes and substrates to lower acetic
acid and ethyl acetate formation by S. bayanus and higher formation of both metabolites
by EC-1118 could not be ascertained from this study as enzyme activity levels and all
substrates involved in catalysis were not measured. This would valuable to investigate in
the future to gain a more comprehensive understanding of the factors influencing
metabolite formation during high sugar fermentations and to elucidate differences between
wine yeast strains. Future experiments will be conducted to determine if acetic acid and
ethyl acetate production differences between strains fermenting under increased osmotic
stress are due to differences in aldehyde dehydrogenase, acetylCoA synthetase and/ or
alcohol acetyltransferase activity, substrate availability or a combination of both.
5.2. Conclusions
This future work, along with studies contained herein, will contribute to the
understanding of the metabolic responses of S. cerevisiae during high sugar fermentations.
Once we understand why and how certain metabolites are formed during the hyperosmotic
stress response, steps can be taken to minimize or eliminate unwanted compounds such as
acetic acid and ethyl acetate through the selection or development of yeast strains best
suited for Icewine and wine styles based on high sugar juice, including appassimento-style
wine. To our enthusiasm, the reported findings of our yeast trial research do offer a
potential strategy for managing VA levels for appassimento-style wine production, making
S. bayanus a potential candidate for commercialization. Furthering our research in the
aforementioned areas will assist in producing higher quality wine as this information is

158
applicable to winemakers, aiding them in maintaining Canada’s powerful influence in the
global Icewine market, and supporting their needs as they expand into new wine styles
involving high sugar juices.
5.3. Literature Cited
Bro, C., B. Regenberg, G. Lagniel, J. Labarre, M. Montero-Lomeli and J. Nielsen. 2003.
Transcriptional, proteonomic, and metabolic responses to lithium in galactose-grown yeast
cells. J Biol Chem. 278:31141-32149.
Blomberg, A. 2000. Metabolic surprises in Saccharomyces cerevisiae during adaptation to
saline conditions: questions, some answers, and a model. FEMS Microbiol Lett. 182:1-8.
Blomberg, A. and L. Alder. 1989. Roles of glycerol and glycerol-3-phosphate
dehydrogenase (NAD+) in acquired osmotolerance of Saccharomyces cerevisiae. J
Bacteriol. 171:1087-1092.
Brewster, J.L., T. de Valoir, N.D. Dwyer, E. Winter, and M.C. Gustin. 1993. An
osmosensing signal transduction pathway in yeast. Science. 259:1760-1763.
Caridi, A., P. Crucitti and D. Ramondino. 1999. Winemaking of musts at high osmotic
strength by thermotolerant yeasts. Biotech Lett. 21:617-620.
Cliff, M.A. and G.J. Pickering. 2006. Determination of odor detection thresholds for acetic
acid and ethyl acetate in ice wine. Aust J Wine Res. 17:45-52.
Cordente, A.G., G. Cordero-Bueso, I.S. Pretorius and C.D. Curtin. 2013. Novel wine yeast
with mutations in YAP1 that produces less acetic acid during fermentation. FEMS Yeast
Res. 13:62-73.
Erasmus, D.J., G.K. van der Merwe and H.J. van Vuuren. 2003. Genome-wide expression
analyses: metabolic adaptation of Saccharomyces cerevisiae to high sugar stress. FEMS.
34:375-399.
Erasmus, D.J. and H.J.J. van Vuuren. 2009. Genetic basis for osmosensitivity and genetic
instability of the wine yeast Saccharomyces cerevisiae V1N7. Am J Enol Vitic. 60:145-
154.
Erasmus, D.J., M. Cliff and H.J.J. van Vuuren. 2004. Impact of yeast strain on the
production of acetic acid, glycerol, and the sensory attributes of Icewine. Am J Enol Vitic.
55:371-378.

159
Heit, C. and D. Inglis. 2013. Acetic acid and ethyl acetate production during high brix
fermentations: effect of yeast strain. Am J Enol Vitic. 64:4.
Heit, C. and D. Inglis. 2012. An investigation of the relationship between ethyl acetate
production and osmotic stress in Saccharomyces cerevisiae K1-V1116 during high brix
fermentations. Am J Enol Vitic. 63:4.
Heit, C. 2011. Effect of yeast strain and sugar concentration on ethyl acetate production in
Icewine juice. BSc Hons Thesis. Brock University, ON.
Martin, S.J. 2008. The osmoadaptive response of the wine yeast S. cerevisiae K1-V1116
during Icewine fermentation. PhD Thesis. Brock University, ON.
Martin, S.J. and D. Inglis. 2006. Yeast osmoadaptive response response during Icewine
fermentation. Am J Enol Vit. 57:527A.
Neviogt, E. and U. Stahl. 1997. Osmoregulation and glycerol metabolism in the yeast
Saccharomyces cerevisiae. FEMS Microbiol Rev. 213:231-271.
Nurgel, C., G.J. Pickering and D.L. Inglis. 2004. Sensory and chemical characteristics of
Canadian ice wines. J Sci Food Agric. 84:1675-1684.
Patel, S. and S. Shibamoto. 2002. Effect of different strains of Saccharomyces cerevisiae
on production of volatiles in Napa Gamay wine and Petit sirah wine. J Agric Food Chem.
50:5649-5653.
Pigeau, G.M. and D.L. Inglis. 2007. Response of wine yeast (Saccharomyces cerevisiae)
aldehyde dehydrogenase to acetaldehyde stress during Icewine fermentation. J Appl
Microbiol. 103:1576-1586.
Pigeau, G.M. and D.L. Inglis. 2005. Upregulation of ALD3 and GPD1 in Saccharomyces
cerevisiae during Icewine fermentation. J Appl Microbiol. 99:112-125.
Pigeau, G.M., E. Bozza, K. Kaiser and D.L. Inglis. 2007. Concentration effect of Riesling
Icewine juice on yeast performance and wine acidity. J Appl Microbiol. 103:1961-1698.
Plata, C., C. Millán, J.C. Mauricio and J.M. Ortega. 2003. Formation of ethyl acetate and
isoamyl acetate by various species of wine yeasts. Food Microbiol. 20:217- 224.
Remize, F., E. Andrieu and S. Dequin. 2000. Engineering of the pyruvate dehydrogenase
bypass in Saccharomyces cerevisiae: role of the cytosolic Mg2+ and mitochondrial K+
acetaldehyde dehydrogenases Ald6p and Ald4p in acetate formation during alcoholic
fermentation. Appl and Environ Microbiol. 66:3151-3159.

160
Torrens, J., P. Urpi, M. Riu-Aumatell, S. Vichi, E. Lopez-Tamanes and S. Buxaderas.
2008. Different commercial yeast strains affecting volatile and sensory profile of cava base
wine. Int J Food Microbiol. 124:48-57.
van den Berg, M.A. and H.Y. Steensma. 1995. ACS2, a Saccharomyces cerevisiae gene
encoding acetyl-coenzyme A synthetase, essential for growth on glucose. Eur J Biochem.
231:704-713.
van Dijken, J. and W. Sheffers. 1986. Redox balances in the metabolism of sugars by
yeasts. FEMS Microbiol Rev. 32:199-224.
Verduyn, C., E. Postma, A. Scheffers and J.P. van Dijken. 1990. Physiology of
Saccharomyces cerevisiae in anaerobic glucose-limited chemostat culture. J Gen
Microbiol. 136:395-403.
VQA Ontario. 2013. Wine standards. Retrieved from:
http://www.vqaontario.com/Regulations/Standards

161
Appendix I: Data from Appassimento Study
1. Physical and chemical changes in grape berries during tobacco kiln drying
1.1. Soluble solids and reducing sugars concentrations during kiln drying
Figure 1: Soluble solids and reducing sugar concentrations during kiln drying. Soluble solids
(A) and reducing sugars (B) were measured during the drying process. The mean values (± SD) of
the duplicate measurements are shown (n = 2); where the error bars are not visible, they are within
the symbol.
0.0
5.0
10.0
15.0
20.0
25.0
30.0
27-Oct 28-Oct 29-Oct 30-Oct 31-Oct 01-Nov 02-Nov 03-Nov
So
lub
le s
oli
ds
(°B
rix)
Sample dates
A
0
50
100
150
200
250
300
27-Oct 28-Oct 29-Oct 30-Oct 31-Oct 01-Nov 02-Nov 03-Nov
Red
uci
ng
su
ga
rs (
g l
ˉ¹)
Sample dates
B

162
1.2. Berry weight and acidity (titratable acidity and pH) during kiln drying
Figure 2: Berrry weight and acidity during kiln drying. Berrry weight (A) and acidity (titratable
acidity and pH) (B) were measured throughout the drying process. The mean values (± SD) of the
duplicate measurements are shown (n = 2); where the error bars are not visible, they are within the
symbol.
0
20
40
60
80
100
120
140
27-Oct 28-Oct 29-Oct 30-Oct 31-Oct 01-Nov 02-Nov 03-Nov
Ber
ry w
eig
ht
(g)
Sample dates
A
3.15
3.20
3.25
3.30
3.35
3.40
0.0
1.0
2.0
3.0
4.0
5.0
6.0
7.0
8.0
9.0
10.0
27-Oct 28-Oct 29-Oct 30-Oct 31-Oct 01-Nov 02-Nov 03-Novp
H u
nit
Tit
rata
ble
aci
dit
y (
g l⁻¹
)
Sample dates
Titratable acidity pH
B

163
1.3. Metabolite concentrations during kiln drying
Figure 3: Metabolite concentrations (glycerol, acetaldehyde, ethanol, acetic acid and ethyl
acetate) during kiln drying. Metabolite concentration was measured throughout the drying course
(A) and normalized to soluble solids (˚Brix). The mean values (± SD) of the duplicate
measurements are shown (n = 2); where the error bars are not visible, they are within the symbol.
0
0.05
0.1
0.15
0.2
0.25
0.0
2.0
4.0
6.0
8.0
10.0
12.0
27-Oct 28-Oct 29-Oct 30-Oct 31-Oct 01-Nov 02-Nov 03-Nov
Ace
tic
aci
d a
nd
gly
cero
l (g
l⁻¹
),
eth
an
ol
(% v
/v),
eth
yl
ace
tate
(m
g l⁻¹
)
Ace
tald
ehy
de
(mg
l⁻¹
)
Sample dates
Acetaldehyde Ethanol Acetic acid Glycerol Ethyl acetate
A
0
0.001
0.002
0.003
0.004
0.005
0.006
0.007
0.008
0.009
0.01
0.00
0.05
0.10
0.15
0.20
0.25
0.30
0.35
0.40
0.45
0.50
27-Oct 28-Oct 29-Oct 30-Oct 31-Oct 01-Nov 02-Nov 03-Nov
Ace
tic
aci
d a
nd
gly
cero
l (g
l⁻¹
),
eth
an
ol
(% v
/v),
eth
yl
ace
tate
(mg
l⁻¹
)/˚B
rix
Ace
tald
ehy
de
(mg
l⁻¹
)/ ˚
Bri
x
Sample dates
Acetaldehyde Ethanol Acetic acid Glycerol Ethyl acetate
B

164
2. Formation of other yeast metabolites during fermentation
2.1. Glycerol formation during fermentation
Figure 4: Glycerol production during fermentation of red table wine must and appassimento-
type must. Glycerol was measured throughout the course of the fermentations (A) and the total
glycerol production was compared between yeast strains in high and low sugar environments (B).
Fermentations were performed in triplicate and samples from each treatment were analyzed in
duplicate, for an n = 6 for each measurement. The mean values (± SD) of the triplicate fermentations
are shown; where the error bars are not visible, they are within the symbol. Treatments were
compared to each other and analyzed statistically using analysis of variance (ANOVA) with mean
separation by Fisher’s Least Significant Difference (LSD) test (p< 0.05). In descending order,
lowercase letters indicate a unique group based on statistical difference using Fisher’s LSD0.05.
0
2
4
6
8
10
12
14
16
0 50 100 150 200 250 300 350 400
Gly
cero
l (g
l⁻¹
)
Fermentation time (h)
EC-1118 18B S. bayanus 18B EC-1118 27B S. bayanus 27B
A
0
2
4
6
8
10
12
14
16
EC-1118 (18°Brix) S. bayanus (18°Brix) EC-1118 (27°Brix) S. bayanus (27°Brix)
Gly
cero
l g
ener
ate
d (
g l⁻¹
)
B
c
b
b
a

165
Figure 5: Glycerol produced/ sugar consumed during fermentation of red table wine must
and appassimento-type must. Total glycerol production was normalized to the amount of sugar
consumed during the course of the fermentations, and compared between yeast strains.
Fermentations were performed in triplicate and samples from each treatment were analyzed in
duplicate, for an n = 6 for each measurement. The mean values (± SD) of the triplicate fermentations
are shown. Treatments were compared to each other and analyzed statistically using analysis of
variance (ANOVA) with mean separation by Fisher’s Least Significant Difference (LSD) test (p<
0.05). In descending order, lowercase letters indicate a unique group based on statistical difference
using Fisher’s LSD0.05.
0.00
0.01
0.02
0.03
0.04
0.05
0.06
EC-1118 (18°Brix) S. bayanus (18°Brix) EC-1118 (27°Brix) S. bayanus (27°Brix)
Gly
cero
l (g
l⁻¹
)/ S
ug
ar
con
sum
ed
(g
l⁻¹
)b
a
c
a

166
2.2 Acetaldehyde formation during fermentation
Figure 6: Acetaldehyde production during fermentation of red table wine must and
appassimento-type must. Acetaldehyde was measured throughout the course of the fermentations
(A) and the total acetaldehyde production was compared between yeast strains in high versus low
sugar environments (B). Fermentations were performed in triplicate and samples from each
treatment were analyzed in duplicate, for an n = 6 for each measurement. The mean values (± SD)
of the triplicate fermentations are shown; where the error bars are not visible, they are within the
symbol. Treatments were compared to each other and analyzed statistically using analysis of
variance (ANOVA) with mean separation by Fisher’s Least Significant Difference (LSD) test (p<
0.05). In descending order, lowercase letters indicate a unique group based on statistical difference
using Fisher’s LSD0.05.
0
20
40
60
80
100
120
140
160
0 50 100 150 200 250 300 350 400
Ace
tald
ehy
de
(mg
l⁻¹
)
Fermentation time (h)
EC-1118 18B S. bayanus 18B EC-1118 27B S. bayanus 27B
A
0.0
10.0
20.0
30.0
40.0
50.0
60.0
EC-1118 (18°Brix) S. bayanus (18°Brix) EC-1118 (27°Brix) S. bayanus (27°Brix)
Ace
tald
ehy
de
gen
era
ted
(m
g l⁻¹
)
BB
a
a
a
b

167
Figure 7: Acetaldehyde produced/ sugar consumed during fermentation of red table wine
must and appassimento-type must. Total acetaldehyde production was normalized to the amount
of sugar consumed during the course of the fermentations, and compared between yeast strains.
Fermentations were performed in triplicate and samples from each treatment were analyzed in
duplicate, for an n = 6 for each measurement. The mean values (± SD) of the triplicate fermentations
are shown. Treatments were compared to each other and analyzed statistically using analysis of
variance (ANOVA) with mean separation by Fisher’s Least Significant Difference (LSD) test (p<
0.05). In descending order, lowercase letters indicate a unique group based on statistical difference
using Fisher’s LSD0.05.
0.00
0.05
0.10
0.15
0.20
0.25
0.30
EC-1118 (18°Brix) S. bayanus (18°Brix) EC-1118 (27°Brix) S. bayanus (27°Brix)
Ace
tald
ehy
de
(mg
l⁻¹
)/ S
ug
ar
con
sum
ed
(g
l⁻¹
)
aa
b
c

168
2.3 Metabolomics analysis between strains
Figure 8: Metabolite production during fermentation by S. cerevisiae and S. bayanus.
Fermentations of appassimento-type must were monitored for (a) glycerol, (b) acetaldehyde, (c)
ethanol, (d) acetic acid and (e) ethyl acetate formation during fermentation, and compared between
wine yeast strains, S. cerevisiae EC-1118 () and S. bayanus (). Metabolite production was
determined by substracting the concentration measured on day 0 of fermentation (inoculation day)
from the level determined on the final day of fermentation. Fermentations were performed in
triplicate and samples from each treatment were analyzed in duplicate, for an n = 6 for each
measurement. The mean values (± SD) of the triplicate fermentations are shown; where the error
bars are not visible, they are within the symbol.
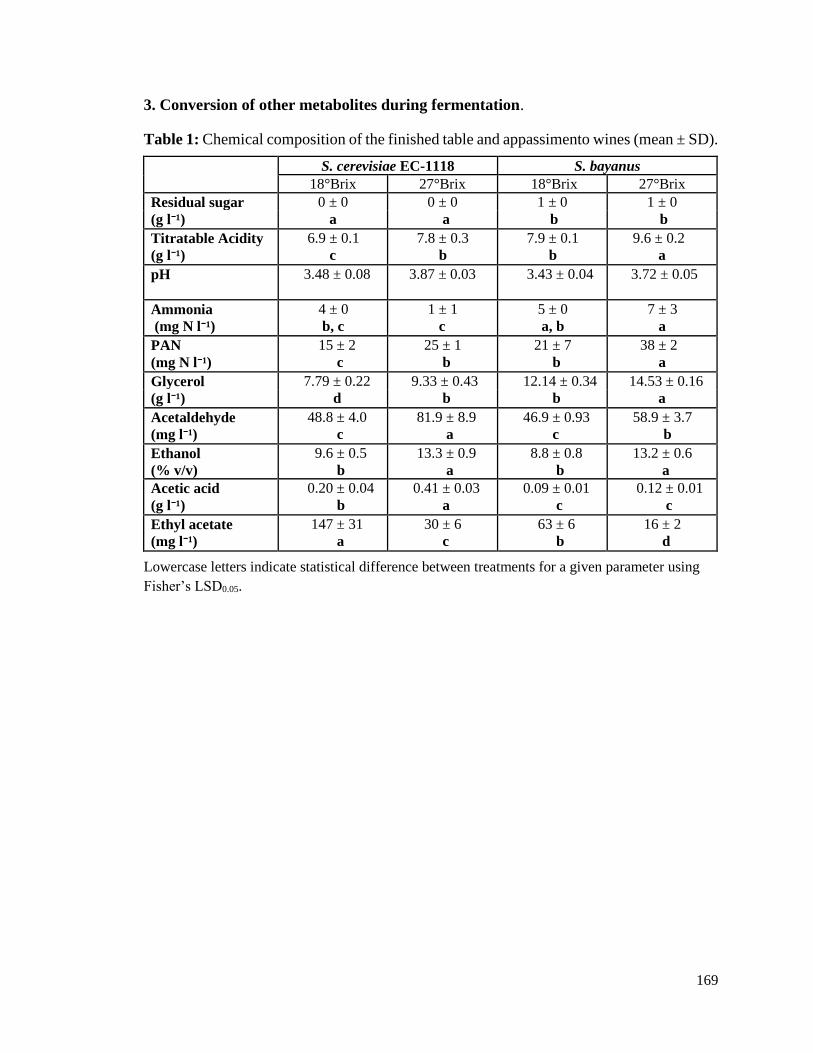
169
3. Conversion of other metabolites during fermentation.
Table 1: Chemical composition of the finished table and appassimento wines (mean ± SD).
S. cerevisiae EC-1118 S. bayanus
18°Brix 27°Brix 18°Brix 27°Brix
Residual sugar 0 ± 0 0 ± 0 1 ± 0 1 ± 0
(g l⁻¹) a a b b
Titratable Acidity
(g l⁻¹) 6.9 ± 0.1
c
7.8 ± 0.3
b
7.9 ± 0.1
b
9.6 ± 0.2
a
pH
3.48 ± 0.08 3.87 ± 0.03 3.43 ± 0.04 3.72 ± 0.05
Ammonia
(mg N l⁻¹)
4 ± 0
b, c
1 ± 1
c
5 ± 0
a, b
7 ± 3
a
PAN
(mg N l⁻¹) 15 ± 2
c
25 ± 1
b
21 ± 7
b
38 ± 2
a
Glycerol 7.79 ± 0.22 9.33 ± 0.43 12.14 ± 0.34 14.53 ± 0.16
(g l⁻¹) d b b a
Acetaldehyde
(mg l⁻¹) 48.8 ± 4.0
c
81.9 ± 8.9
a
46.9 ± 0.93
c
58.9 ± 3.7
b
Ethanol
(% v/v)
9.6 ± 0.5
b
13.3 ± 0.9
a
8.8 ± 0.8
b
13.2 ± 0.6
a
Acetic acid
(g l⁻¹) 0.20 ± 0.04
b
0.41 ± 0.03
a
0.09 ± 0.01
c
0.12 ± 0.01
c
Ethyl acetate
(mg l⁻¹) 147 ± 31
a
30 ± 6
c
63 ± 6
b
16 ± 2
d
Lowercase letters indicate statistical difference between treatments for a given parameter using
Fisher’s LSD0.05.
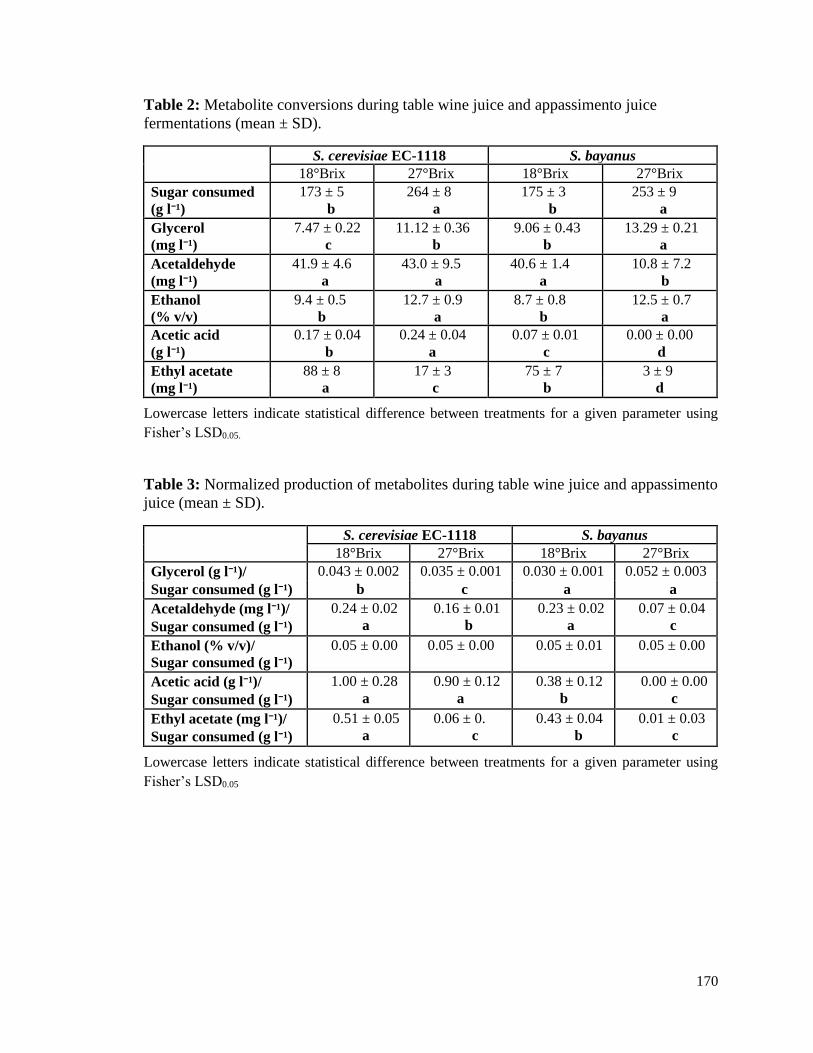
170
Table 2: Metabolite conversions during table wine juice and appassimento juice
fermentations (mean ± SD).
S. cerevisiae EC-1118 S. bayanus
18°Brix 27°Brix 18°Brix 27°Brix
Sugar consumed 173 ± 5 264 ± 8 175 ± 3 253 ± 9
(g l⁻¹) b a b a
Glycerol
(mg l⁻¹) 7.47 ± 0.22
c
11.12 ± 0.36
b
9.06 ± 0.43
b
13.29 ± 0.21
a
Acetaldehyde
(mg l⁻¹) 41.9 ± 4.6
a
43.0 ± 9.5
a
40.6 ± 1.4
a
10.8 ± 7.2
b
Ethanol
(% v/v)
9.4 ± 0.5
b
12.7 ± 0.9
a
8.7 ± 0.8
b
12.5 ± 0.7
a
Acetic acid
(g l⁻¹) 0.17 ± 0.04
b
0.24 ± 0.04
a
0.07 ± 0.01
c
0.00 ± 0.00
d
Ethyl acetate 88 ± 8 17 ± 3 75 ± 7 3 ± 9
(mg l⁻¹) a c b d
Lowercase letters indicate statistical difference between treatments for a given parameter using
Fisher’s LSD0.05.
Table 3: Normalized production of metabolites during table wine juice and appassimento
juice (mean ± SD).
S. cerevisiae EC-1118 S. bayanus
18°Brix 27°Brix 18°Brix 27°Brix
Glycerol (g l⁻¹)/ 0.043 ± 0.002 0.035 ± 0.001 0.030 ± 0.001 0.052 ± 0.003
Sugar consumed (g l⁻¹) b c a a
Acetaldehyde (mg l⁻¹)/ Sugar consumed (g l⁻¹)
0.24 ± 0.02
a
0.16 ± 0.01
b
0.23 ± 0.02
a
0.07 ± 0.04
c
Ethanol (% v/v)/
Sugar consumed (g l⁻¹) 0.05 ± 0.00
0.05 ± 0.00 0.05 ± 0.01 0.05 ± 0.00
Acetic acid (g l⁻¹)/ Sugar consumed (g l⁻¹)
1.00 ± 0.28
a
0.90 ± 0.12
a
0.38 ± 0.12
b
0.00 ± 0.00
c
Ethyl acetate (mg l⁻¹)/ Sugar consumed (g l⁻¹)
0.51 ± 0.05
a
0.06 ± 0.
c
0.43 ± 0.04
b
0.01 ± 0.03
c
Lowercase letters indicate statistical difference between treatments for a given parameter using
Fisher’s LSD0.05

171
Appendix II: Data from Bergmeyer (1974) method development
1. Evaluation of Bergmeyer (1974) assay using standards in water
Figure 1: Best-fit calibration curve of NAD+ with cofactor dissolved in water (0 to 1500 µM).
The Y axis represents the absorbance change at 340 nm during the reaction catalyzed by alcohol
dehydrogenase. Lines represent linear least squares fits to the data. Through regression analysis,
the correlation coefficient (R) and coefficient of determination were (R2) were calculated (R-value
of 0.9999; R2-value of 0.9999). Calibration standards were prepared in water and tested in duplicate
(n = 2). The mean values (± SD) of the duplicate measurements are shown; where the error bars
are not visible, they are within the symbol.
0.00
0.05
0.10
0.15
0.20
0.25
0.30
0.35
0.40
0.0 200.0 400.0 600.0 800.0 1000.0 1200.0 1400.0 1600.0
Ab
sorb
an
ce a
t 3
40
nm
NAD+ Standard (µM)
Standard Curve of NAD+

172
2. NAD+ assay in Buffer 2
Figure 2: Best-fit calibration curve of NAD+ with cofactor dissolved in yeast cell breaking
buffer (100 to 750 µM). The Y axis represents the absorbance change at 340 nm during the reaction
catalyzed by alcohol dehydrogenase. Lines represent linear least squares fits to the data. Through
regression analysis, the correlation coefficient (R) and coefficient of determination were (R2) were
calculated (R-value of 0.9999; R2-value of 0.9999). Calibration standards were prepared in cell
breaking buffer and tested in duplicate (n = 2). The mean values (± SD) of the duplicate
measurements are shown; where the error bars are not visible, they are within the symbol.
0.00
0.50
1.00
1.50
2.00
2.50
0.0 100.0 200.0 300.0 400.0 500.0 600.0 700.0 800.0
Ab
sorb
an
ce a
t 3
40
nm
NAD+ Standard (µM)
Calibration Curve of NAD+
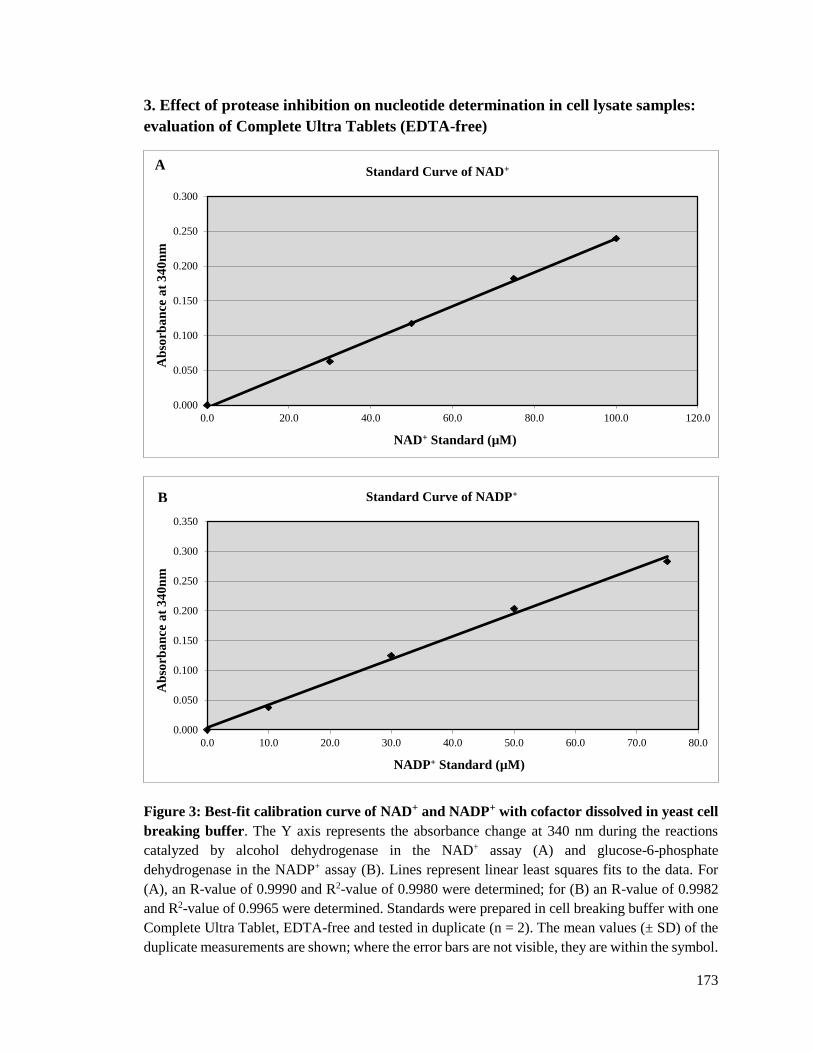
173
3. Effect of protease inhibition on nucleotide determination in cell lysate samples:
evaluation of Complete Ultra Tablets (EDTA-free)
Figure 3: Best-fit calibration curve of NAD+ and NADP+ with cofactor dissolved in yeast cell
breaking buffer. The Y axis represents the absorbance change at 340 nm during the reactions
catalyzed by alcohol dehydrogenase in the NAD+ assay (A) and glucose-6-phosphate
dehydrogenase in the NADP+ assay (B). Lines represent linear least squares fits to the data. For
(A), an R-value of 0.9990 and R2-value of 0.9980 were determined; for (B) an R-value of 0.9982
and R2-value of 0.9965 were determined. Standards were prepared in cell breaking buffer with one
Complete Ultra Tablet, EDTA-free and tested in duplicate (n = 2). The mean values (± SD) of the
duplicate measurements are shown; where the error bars are not visible, they are within the symbol.
0.000
0.050
0.100
0.150
0.200
0.250
0.300
0.0 20.0 40.0 60.0 80.0 100.0 120.0
Ab
sorb
an
ce a
t 3
40
nm
NAD+ Standard (µM)
Standard Curve of NAD+A
0.000
0.050
0.100
0.150
0.200
0.250
0.300
0.350
0.0 10.0 20.0 30.0 40.0 50.0 60.0 70.0 80.0
Ab
sorb
an
ce a
t 3
40
nm
NADP+ Standard (µM)
Standard Curve of NADP+B
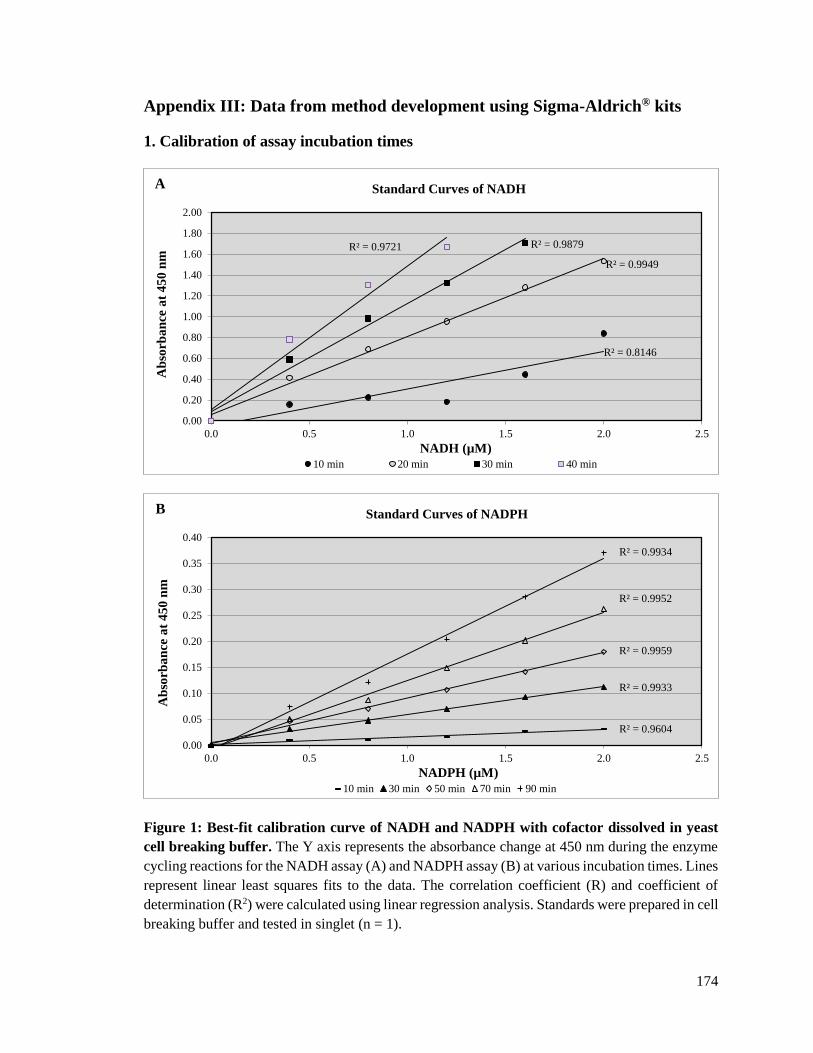
174
Appendix III: Data from method development using Sigma-Aldrich® kits
1. Calibration of assay incubation times
Figure 1: Best-fit calibration curve of NADH and NADPH with cofactor dissolved in yeast
cell breaking buffer. The Y axis represents the absorbance change at 450 nm during the enzyme
cycling reactions for the NADH assay (A) and NADPH assay (B) at various incubation times. Lines
represent linear least squares fits to the data. The correlation coefficient (R) and coefficient of
determination (R2) were calculated using linear regression analysis. Standards were prepared in cell
breaking buffer and tested in singlet (n = 1).
R² = 0.8146
R² = 0.9949
R² = 0.9879R² = 0.9721
0.00
0.20
0.40
0.60
0.80
1.00
1.20
1.40
1.60
1.80
2.00
0.0 0.5 1.0 1.5 2.0 2.5
Ab
sorb
an
ce a
t 4
50
nm
NADH (µM)
Standard Curves of NADH
10 min 20 min 30 min 40 min
A
R² = 0.9604
R² = 0.9933
R² = 0.9959
R² = 0.9952
R² = 0.9934
0.00
0.05
0.10
0.15
0.20
0.25
0.30
0.35
0.40
0.0 0.5 1.0 1.5 2.0 2.5
Ab
sorb
an
ce a
t 4
50
nm
NADPH (µM)
Standard Curves of NADPH
10 min 30 min 50 min 70 min 90 min
B