hyperspectral microwave atmospheric sounding · pdf filehyperspectral microwave atmospheric...
TRANSCRIPT

GeoMAS: 1 WJB 4/13/10
MIT Lincoln Laboratory
Hyperspectral Microwave Atmospheric Sounding
W. J. Blackwell, L. J. Bickmeier, R. V. Leslie, M. L. Pieper, J. E. Samra, and C. Surussavadee1
April 14, 2010 ITSC-17
This work is sponsored by the Department of the Air Force under Air Force contract FA8721-05-C-0002. Opinions, interpretations, conclusions, and recommendations are those of the authors and are not necessarily endorsed by the United States Government.
1C. Surussavadee is Head of the Andaman Environment and Natural Disaster Research Center, Phuket, Thailand

MIT Lincoln Laboratory GeoMAS: 2
WJB 4/13/10
Background/Overview
• “Hyperspectral” measurements allow the determination of the Earth’s tropospheric temperature with vertical resolution exceeding 1km
– ~100 channels in the microwave
• Hyperspectral infrared sensors available since the 90’s – Clouds substantially degrade the information content – A hyperspectral microwave sensor is therefore highly desirable
• Several recent enabling technologies make HyMW feasible: – Detailed physical/microphysical atmospheric and sensor models – Advanced, signal-processing based retrieval algorithms – RF receivers are more sensitive and more compact/integrated
• The key idea: Use RF receiver arrays to build up information in the spectral domain (versus spatial domain for STAR systems)

MIT Lincoln Laboratory GeoMAS: 3
WJB 4/13/10
Outline
• Hyperspectral microwave sounding – “Spectral multiplexing” concept – Temperature weighting function analysis
• GEO performance comparisons – Precipitation and All-weather Temperature and Humidity (PATH) – GeoMAS (118/183 GHz): Geostationary Microwave Array Spectrometer – Compare with “GeoAMSU” synthetic aperture system
• LEO performance comparisons – HyMAS (60/183 GHz): Hyperspectral Microwave Array Spectrometer – Compare with AIRS + AMSUA + HSB
• Summary and path forward

MIT Lincoln Laboratory GeoMAS: 4
WJB 4/13/10
Atmospheric Transmission at Microwave Wavelengths
The frequency dependence of atmospheric absorption allows different altitudes to be sensed by spacing channels along absorption lines
Geo
AM
SU
Bot
h
Geo
MA
S

MIT Lincoln Laboratory GeoMAS: 5
WJB 4/13/10
Geostationary Microwave Array Spectrometer: Nominal GeoMAS Beam Layout
2x9 = 18 channels
2x9 = 18 channels
2x9 = 18 channels
2x9 = 18 channels
2x8 = 16 channels (four beams)
Array microscans; every spot on the ground is measured by 88 channels

MIT Lincoln Laboratory GeoMAS: 6
WJB 4/13/10
Spectral Multiplexing Concept (1/8)

MIT Lincoln Laboratory GeoMAS: 7
WJB 4/13/10
Spectral Multiplexing Concept (2/8)

MIT Lincoln Laboratory GeoMAS: 8
WJB 4/13/10
Spectral Multiplexing Concept (3/8)

MIT Lincoln Laboratory GeoMAS: 9
WJB 4/13/10
Spectral Multiplexing Concept (4/8)

MIT Lincoln Laboratory GeoMAS: 10 WJB 4/13/10
Spectral Multiplexing Concept (5/8)

MIT Lincoln Laboratory GeoMAS: 11 WJB 4/13/10
Spectral Multiplexing Concept (6/8)

MIT Lincoln Laboratory GeoMAS: 12 WJB 4/13/10
Spectral Multiplexing Concept (7/8)

MIT Lincoln Laboratory GeoMAS: 13 WJB 4/13/10
Spectral Multiplexing Concept (8/8)

MIT Lincoln Laboratory GeoMAS: 14 WJB 4/13/10
GeoMAS versus “Traditional” 60-GHz Bands

MIT Lincoln Laboratory GeoMAS: 15 WJB 4/13/10
Why is an Array Needed??
• Other approaches using a single receiver: – Simply sweep the receiver local oscillator (LO) to achieve many
channels – Add a high-resolution digital backend to achieve many channels
• The array approach provides very large effective bandwidth
Solid lines: Advantage due to channelization Dashed lines: Advantage due to channelization
iikkAND noise reduction
Increasing integration time
118-GHz system

MIT Lincoln Laboratory GeoMAS: 16 WJB 4/13/10
State-of-the-art Physical Models Used for Simulation Analyses
• Cloud-resolving atmospheric model (MM5)
• Ocean surface emissivity model
• Random land surface emissivity model
• Line-by-line transmittance model with detailed scattering

MIT Lincoln Laboratory GeoMAS: 17 WJB 4/13/10
Global Profile Sets for Performance Assessments
MM5 characterized by high water content NOAA88b characterized by high variability

MIT Lincoln Laboratory GeoMAS: 18 WJB 4/13/10
GeoMAS Channels (coverage of 10,000x10,000 km2 area in 15 min is assumed)
• GeoMAS 118-GHz – 64 channels on the low-frequency side of the 118.75-GHz line
ΔTRMS = 0.2 K
• GeoMAS 118-GHz + 183-GHz – 64 channels on the low-freq side of the 118.75-GHz oxygen line – 16 channels within +/- 10 GHz of 183.83-GHz water vapor line
ΔTRMS = 0.25 K • “GeoMAS 88” (89-GHz + 118-GHz + 183-GHz)
– 64 channels on the low-freq side of the 118.75-GHz oxygen line – 16 channels within +/- 10 GHz of 183.83-GHz water vapor line – 8 channels at 89 +/- 0.5 GHz
ΔTRMS = 0.15 K
Half the channels at each band are H-pol, the other half are V-pol

MIT Lincoln Laboratory GeoMAS: 19 WJB 4/13/10
Synthetic Thinned Aperture Radiometer (STAR) Assumptions
• Six oxygen channels (identical to AMSU-A): – 50.3, 52.8, 53.596, 54.4, 54.94, 55.5 GHz ‒ ΔTRMS: 0.5, 0.35, 0.5, 0.35, 0.35, 0.35 K
• Four water vapor channels (three identical to AMSU-B): – 183.31 ± 1, 3, and 7 GHz; 167 GHz ‒ ΔTRMS: 1, 0.71, 0.5, 0.71 K
• Fundamental receiver parameters (Tsys and τ) identical to those used for GeoMAS
B. Lambrigtsen, S. Brown, T. Gaier, P. Kangaslahti, and A. Tanner, “A baseline for the decadal-survey PATH mission,” Proc. IGARSS, vol. 3, July 2008, pp. 338–341.
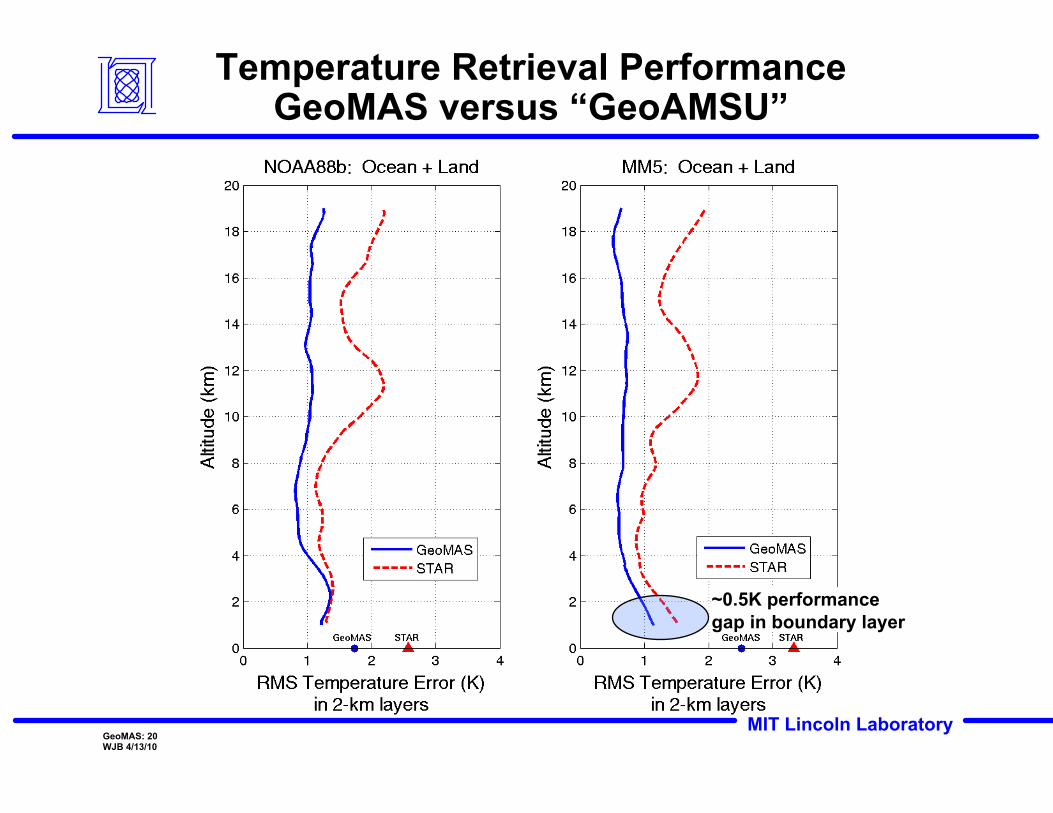
MIT Lincoln Laboratory GeoMAS: 20 WJB 4/13/10
Temperature Retrieval Performance GeoMAS versus “GeoAMSU”
~0.5K performance gap in boundary layer
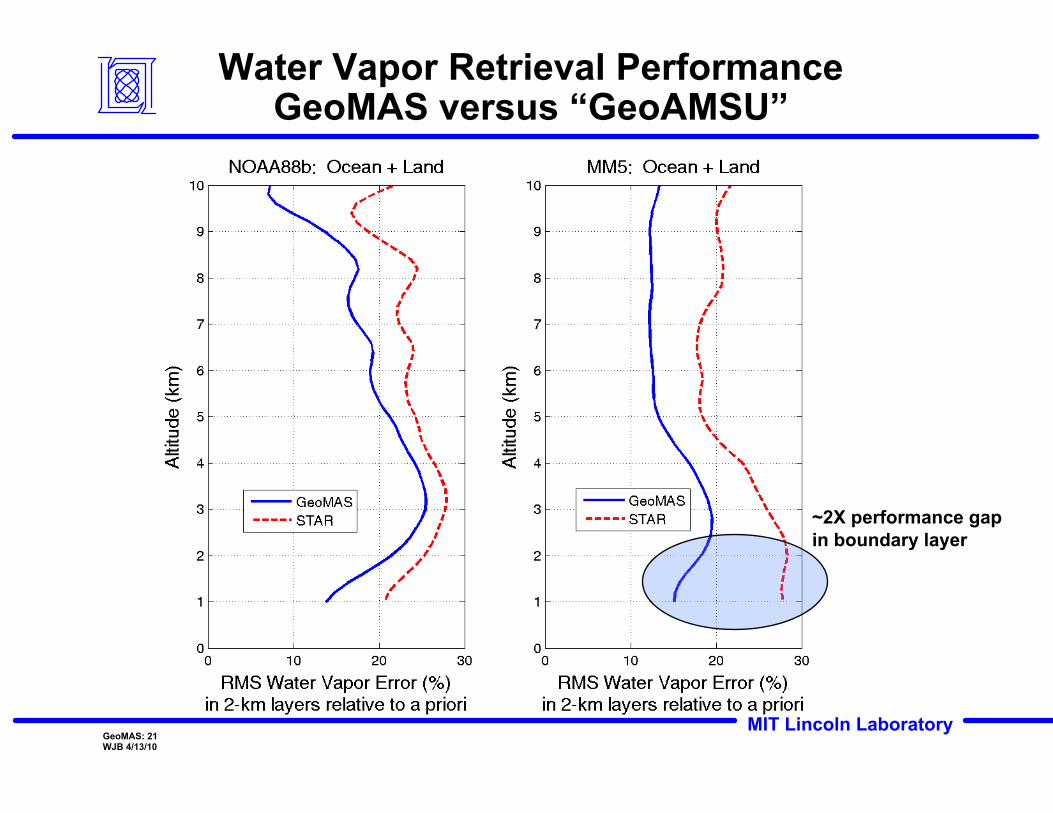
MIT Lincoln Laboratory GeoMAS: 21 WJB 4/13/10
Water Vapor Retrieval Performance GeoMAS versus “GeoAMSU”
~2X performance gap in boundary layer

MIT Lincoln Laboratory GeoMAS: 22 WJB 4/13/10
Precipitation Retrieval Performance: GeoMAS Superior for All Rain Rates

MIT Lincoln Laboratory GeoMAS: 23 WJB 4/13/10
Temperature Retrieval Performance AIRS/AMSU/HSB Versus HyMAS 60-GHz
All Profiles Cloudiest 30%
AIRS Level 2 Profile Database: Global, Non-frozen Ocean

MIT Lincoln Laboratory GeoMAS: 24 WJB 4/13/10
Water Vapor Retrieval Performance AIRS/AMSU/HSB Versus HyMAS 60-GHz
All Profiles Cloudiest 30%
AIRS Level 2 Profile Database: Global, Non-frozen Ocean

MIT Lincoln Laboratory GeoMAS: 25 WJB 4/13/10
Summary and Path Forward
• Hyperspectral microwave sensors could change the landscape of atmospheric sounding (LEO and GEO)
• GeoMAS performance superior to current geostationary microwave state-of-the-art
– Temperature, water vapor, and precipitation mapping
• HyMAS performance exceeds AIRS+AMSU, especially in clouds
• Hyperspectral microwave would provide advanced sounding capability – Complementary to hyperspectral IR (improved CO2 retrievals expected) – Complementary to infrared ABI (rapid scan imaging of severe weather in
tandem with ABI would provide quantum leap forward)
• Next steps – HyMAS/GeoMAS channel optimization; more channels; image sharpening – Detailed sensitivity studies (recent correlated error analyses promising) – Hardware demonstration (airborne prototype)

MIT Lincoln Laboratory GeoMAS: 26 WJB 4/13/10
More Information
• “Hyperspectral Microwave Atmospheric Sounding,” Blackwell, et al., under review (IEEE TGRS)
• “Scientific Arguments for a Hyperspectral Microwave Sensor,” Boukabara, et al., EUMETSAT confererence, September 2010
• “Improved All-Weather Atmospheric Sounding Using Hyperspectral Microwave Observations,” Blackwell, et al., IGARSS 2010
• Previous presentations available (AMS, URSI, and MicroRad)

GeoMAS: 27 WJB 4/13/10
MIT Lincoln Laboratory
Backup Slides

MIT Lincoln Laboratory GeoMAS: 28 WJB 4/13/10
GeoMAS Performance Superior, Even for Low Transmittance (High Water Content)

MIT Lincoln Laboratory GeoMAS: 29 WJB 4/13/10
Atmospheric Sounding
• Global all-weather observations of precipitation, temperature, and humidity are needed to drive weather forecast models
• These observations require space-based sensors measuring upwelling thermal radiance spectra
• Microwave observations are needed to provide cloud penetration
• Most weather develops over many hours so that existing multiple LEO sounders provide sufficiently frequent coverage
• Severe weather events are a critical exception, usually cloud shrouded; key observables vary within ~15 km and ~15 minutes
These attributes motivate a geostationary microwave sensor

MIT Lincoln Laboratory GeoMAS: 30 WJB 4/13/10
Transmittance Calculations in Clouds (Non-Precipitating Pixels)

MIT Lincoln Laboratory GeoMAS: 31 WJB 4/13/10
GeoMAS Beam Sampling Each Pixel is Eventually Sampled at All Freqs
50km
Cross hatching indicates different frequency bands
Blue circles denote pixels that have been fully sampled

MIT Lincoln Laboratory GeoMAS: 32 WJB 4/13/10
Correlated Error Sources
• Unknown array spatial misalignments – Small effect, due to broad beams, but non-negligible – Modeling included in our simulation study (slides to come)
• Spatial nonhomogeneities in scene – Clouds, surface, water vapor, etc. – Modeling included in our simulation study (slides to come)
• Forward model errors – Transmittance, cloud/microphysical, surface, etc. – Modeling included in our simulation study (slides to come)

MIT Lincoln Laboratory GeoMAS: 33 WJB 4/13/10
Significance of Performance Improvements
• Substantial advantage in the retrieval of sea surface temperature:
– Better storm tracking and intensification prediction – More accurate long-term weather forecasts
• Marked advantage in atmospheric profile retrieval – Improved initialization of numerical forecast models – Areas in and around precipitation are most critical
• Synoptic coverage provided by LEO sounders sets “background error” that approaches 0.2K in mid troposphere
– GEO soundings must be very accurate to positively impact current models
– Sampling of diurnal variations in temperature and moisture are not provided by LEO observations

MIT Lincoln Laboratory GeoMAS: 34 WJB 4/13/10
GeoSTAR1 250kg, 350W
GeoMAS2 70kg, 50W
Comparison of GeoSTAR and GeoMAS
<2m reflector diameter
1Lambrigtsen, et al., IGARSS 2008 2Staelin, et al., GEM Working Group Report to GOES Program Office, 1997
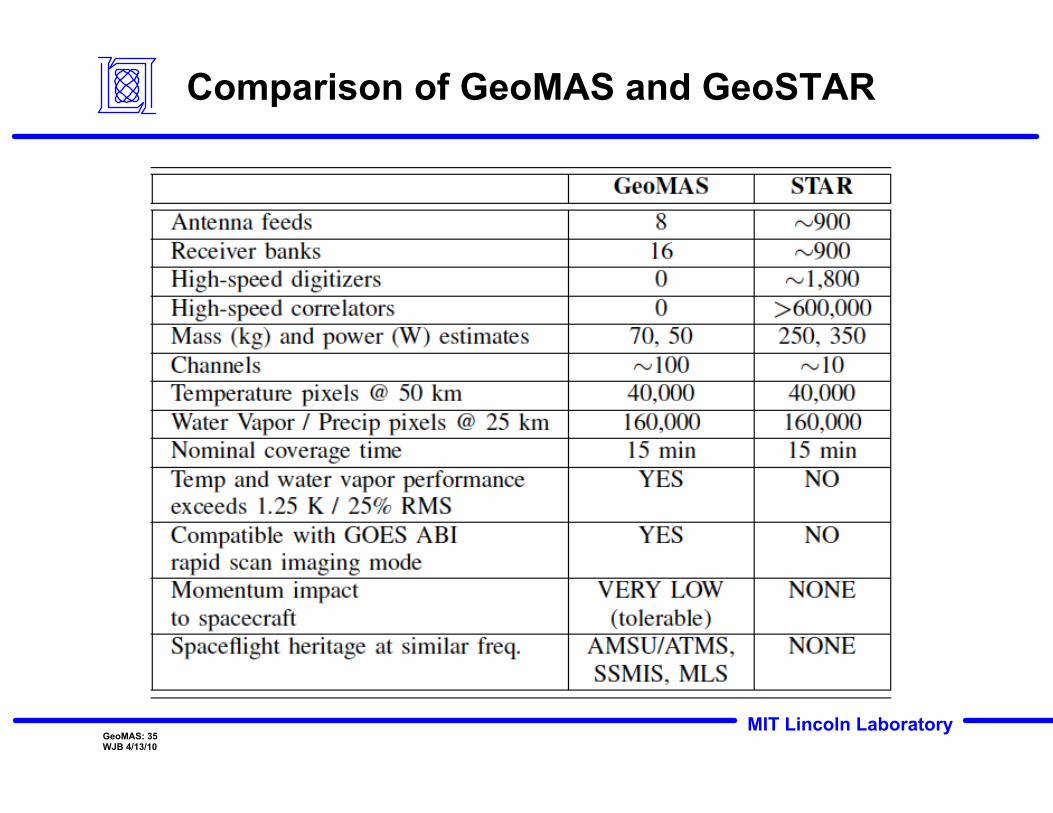
MIT Lincoln Laboratory GeoMAS: 35 WJB 4/13/10
Comparison of GeoMAS and GeoSTAR

MIT Lincoln Laboratory GeoMAS: 36 WJB 4/13/10
Temperature Retrieval Performance

MIT Lincoln Laboratory GeoMAS: 37 WJB 4/13/10
Temperature Retrieval Performance

MIT Lincoln Laboratory GeoMAS: 38 WJB 4/13/10
Water Vapor Retrieval Performance

MIT Lincoln Laboratory GeoMAS: 39 WJB 4/13/10
Water Vapor Retrieval Performance