hypothesis testing of edge organizations: modeling the c2
TRANSCRIPT
1
12th ICCRTS Adapting C2 to the 21st Century
Hypothesis Testing of Edge Organizations:
Modeling the C2 Organization Design Space Track Session:
Organizational Issues
***Student Paper***
Authors: James B. Gateau Tara A. Leweling John P. Looney
Dr. Mark E. Nissen Naval Postgraduate School
Point of Contact: Mark E. Nissen
Center for Edge Power Naval Postgraduate School
589 Dyer Road, Room 200A, Code 06/IS Monterey, CA 93943-5000
+01 831 656 3570 [email protected]

2
ABSTRACT The Edge represents a fresh approach to organizational design. It appears to be particularly appropriate in the context of modern military warfare, but also raises issues regarding comparative performance of alternate organizational designs. Building upon prior C2 research, we seek to understand the comparative performance of the Edge and all organizational forms, across 21st Century and all mission-environmental conditions, and hence characterize the entire organization design space systematically. Leveraging recent advances in computational organization theory, we extend our campaign of experimentation to specify six, diverse, archetypal organizational forms from theory, and evaluate their comparative performance empirically. Results confirm that no single organizational form is “best” for all circumstances; highlight contingent circumstances for which the Edge and other kinds of organizations perform relatively better than one another; and elucidate specific performance measures that provide multidimensional insight into different aspects of organizational performance. This research grounds the Edge organization firmly in well-established organization theory, and provides empirical support for and against claims regarding this novel organizational form, particularly in terms of agility. Additionally, through organizational modeling and analysis, we articulate an organization design space for the first time. We discuss the model, experimental setup and results in considerable detail, and offer theoretical implications for the organization scholar and actionable guidance for the C2 practitioner. INTRODUCTION Recent advances in computational organization theory (e.g., see Burton et al. 2002, Carley and Lin 1997, Levitt et al. 1999, Lomi & Larsen 2001) and computational social science (see NAACSOS 2007) offer promising potential to test the performance of different organizational forms in a variety of mission-environmental contexts. For instance, to represent and reason about organizational processes, one can conduct computational experiments with levels of rigor and control comparable to laboratory experimentation. This can support greater internal validity and reliability than is obtainable often through fieldwork. As another instance, computational experiments can be conducted to examine myriad different organizational designs, including cases that have yet to be implemented in physical organizations (Nissen 2005b). Moreover, mission-environmental contexts are not manipulated easily in the field, and laboratory experiments are limited generally to micro-level organizational phenomena.
The present paper represents part four in our campaign of experimentation, which began with a paper presented at the 2004 CCRTS conference (Nissen and Buettner 2004). In that paper, the relative advantages and disadvantages of computational experimentation were presented, and this computational research method was described in terms of a complementary, empirical approach. The 2005 ICCRTS paper followed (Nissen 2005a); it compared and analyzed more than 25 diverse organizational forms, including the Edge organization, which was shown to be theoretically distinct and uniquely differentiated from other organization forms described by prior investigators. This 2005 paper also offered a theoretical discussion and set of hypotheses about the performance of Edge and Hierarchy organization forms under different mission-environmental conditions, and provided insight into relative characteristics and behaviors of Hierarchy and Edge organizations. Then in our 2006 ICCRTS paper (Orr and Nissen 2006), we expanded the study to specify and model four other, classic, theoretically grounded organization forms: Simple Structure, Professional Bureaucracy, Divisionalized Form, and Adhocracy (Mintzberg 1979, 1980). We also employed computational experimentation to compare and contrast empirically the relative performance of Hierarchy and Edge organizational forms, using a multidimensional set of performance measures, under the mission-environmental conditions at two different points in history: the Industrial Era, and the 21st Century.
Through this campaign of experimentation, we are progressing systematically toward instantiation and analysis of the entire organization design space (i.e., in a contingency-theoretic sense) of organizational forms and mission-environmental contexts. Although such instantiation and analysis are clearly not exhaustive, by including a diversity of classic organizational
3
archetypes from theory, and examining them across both current and contrasting mission-environmental contexts, this design space should be representative, and the results should be applicable across a diverse array of organizations and environments in practice. Hence this research is empirical in nature, and targets theoretical development as well as practical application. This represents the focus of the present paper: we employ computational experimentation to examine the relative, multidimensional performance of all six, theoretically distinct organizational forms, across four experimental manipulations, in both Industrial Era and 21st Century scenarios. The following section presents theoretical background and hypotheses, after which we describe our computational model, present the results, and draw final conclusions.
BACKGROUND Drawing heavily from Orr and Nissen (2006), we begin by summarizing briefly Mintzberg’s (1979, 1980) classic, archetypal organization forms, the Edge organization, and the seven hypotheses developed in the first part of this research effort (Nissen 2005a). We then outline background information pertaining to computational modeling.
Organizational Archetypes and Edge Hypotheses To begin, Mintzberg (1980) suggests a typology of five, archetypal organizational configurations: Simple Structure, Machine Bureaucracy, Professional Bureaucracy, Divisionalized Form, and Adhocracy. The different configurations vary according to the structuring and predominance of their organizational parts, coordination mechanisms, design parameters, and contingency factors. These five, archetypal organization forms are broadly applicable, mutually distinct, and derived from both theory and practice. Hence they are representative of many contemporary organizations observable in practice today, and many of the emerging organizational forms (e.g., strategic alliances, networked firms, Edge organizations) can be analyzed as hybrids through consideration of their separate parts, mechanisms, parameters and factors.
Indeed, we show (see Nissen 2005a, Orr and Nissen 2006) how the Edge organization shares similarities with the Adhocracy (e.g., coordination by mutual adjustment, small unit size, many liaison links throughout, selective decentralization), Professional Bureaucracy (e.g., low vertical specialization, high training and indoctrination, market and functional grouping), and Simple Structure (e.g., low horizontal specialization, low formalization). But it also demonstrates several key differences, and it does not correspond cleanly with any single archetype (e.g., it is characterized as an hybrid Professional Adhocracy—a combination of archetypes). Key to Edge characterization is decentralization, empowerment, shared awareness and freely flowing knowledge required to push power for informed decision making and competent action to the “edges” of organizations (Alberts and Hayes 2003), where they interact directly with their environments and other players in the corresponding organizational field (Scott 2001). In contrast, the Edge organization shares almost no similarities with the Machine Bureaucracy (cf. high training and indoctrination), the latter to which we refer interchangeably as “Hierarchy.”
Finally, we revisit and recapitulate the key hypotheses developed through our prior research, which are rooted in current Edge “theory.” This sets the stage for computational experimentation. The key Edge hypotheses are restated below for reference (see Nissen 2005a for derivation and discussion; page numbers refer to Alberts and Hayes 2003).
Hypothesis 0. Edge organizations can outperform Hierarchy organizations in demanding mission environmental contexts. Hypothesis 1. “Power to the Edge is the correct response to the increased uncertainty, volatility, and complexity associated with [21st century] military operations” [p. 6]. Hypothesis 2. “The correct C2 approach depends on [five] factors”: 1) shift from static/trench to mobile/maneuver warfare; 2) shift from cyclic to continuous communications; 3) increase in volume and quality of information; 4) increase in professional competence; and 5) increase in creativity and initiative [p. 19].

4
Hypothesis 3. “Given a robustly networked force, any one of the six effective command and control philosophies proven useful in the Industrial Era is possible” [p. 32]. Hypothesis 4. People who work together, over time, and learn to operate in a “post and smart-pull” environment will outperform similarly organized and capable people who do not. Hypothesis 5. “The more uncertain and dynamic an adversary and/or the environment are, the more valuable agility becomes” [p. 124]. Hypothesis 6. “An organization’s power can be increased without significant resource expenditures” [p. 172].
Computational Modeling In this section, we discuss computational organization theory and computational social science briefly, and we draw directly from Nissen and Levitt (2004) to provide an overview of our computational modeling approach. We then describe the computational model developed to test our hypotheses.
Computational Organization Theory and Social Science Research. Computational Organization Theory (COT) and Computational Social Science (CSS) are emerging, multidisciplinary fields that integrate aspects of artificial intelligence, organization studies and system dynamics/simulation (e.g., see Carley and Prietula 1994). Nearly all research in this developing field involves computational tools, which are employed to support computational experimentation and theorem proving through executable models developed to emulate the behaviors of physical organizations (e.g., see Burton et al. 2002, Carley and Lin 1997, Levitt et al. 1999).
As the field has matured, several distinct classes of models have evolved for particular purposes, including: descriptive models, quasi-realistic models, normative models, and man-machine interaction models for training (Cohen and Cyert 1965, Burton and Obel 1995). More recent models have been used for purposes such as developing theory, testing theory and competing hypotheses, fine-tuning laboratory experiments and field studies, reconstructing historical events, extrapolating and analyzing past trends, exploring basic principles, and reasoning about organizational and social phenomenon (Carley and Hill 2001: 87).
Our COT/CSS research builds upon the planned accumulation of collaborative research over almost two decades to develop rich, theory-based models of organizational processes (Levitt 2004). Using an agent-based representation (Cohen 1992, Kunz et al. 1999), micro-level organizational behaviors have been researched and formalized to reflect well-accepted organization theory (Levitt et al. 1999). Extensive empirical validation projects (e.g., Christiansen 1993, Thomsen 1998) have demonstrated the representational fidelity, and shown how the qualitative and quantitative behaviors of our computational models correspond closely with a diversity of enterprise processes in practice.
This research stream continues today with the goal of developing new micro-organization theory, and embedding it in software tools that can be used to design organizations in the same way that engineers design bridges, semiconductors or airplanes—through computational modeling, analysis and evaluation of multiple virtual prototypes. Such virtual prototypes also enable us to take great strides beyond relying upon the kinds of informal and ambiguous, natural-language descriptions that comprise the bulk of organization theory today. For instance, in addition to providing textual description, organization theory is imbued with a rich, time-tested collection of micro-theories that lend themselves to computational representation and analysis. Examples include Galbraith's (1977) information processing abstraction, March and Simon’s (1958) bounded rationality assumption, and Thompson’s (1967) task interdependence contingencies. Drawing on such micro-theory, we employ symbolic (i.e., non-numeric) representation and reasoning techniques from established research on artificial intelligence to

5
develop computational models of theoretical phenomena. Once formalized through a computational model, the symbolic representation is “executable,” meaning it can be used to emulate organizational dynamics.
Table 1 Model Elements and Descriptions (adapted from Orr and Nissen 2006)
ModelElement Element Description
Tasks Abstract representations of any work that consumes time, is required for project completion and can generate exceptions.
Actors A person or a group of persons who perform work and process information.
Exceptions Simulated situations where an actor needs additional information, requires a decision from a supervisor, or discovers an error that needs correcting.
Milestones Points in a project where major business objectives are accomplished, but such markers neither represent tasks nor entail effort.
Successor links
Define an order in which tasks and milestones occur in a model, but they do not constrain these events to occur in a strict sequence. Tasks can also occur in parallel. VDT offers three types of successor links: finish-start, start-start and finish-finish.
Rework links
Similar to successor links because they connect one task (called the driver task) with another (called the dependent task). However, rework links also indicate that the dependent task depends on the success of the driver task, and that the project's success is also in some way dependent on this. If the driver fails, some rework time is added to all dependent tasks linked to the driver task by rework links. The volume of rework is then associated with the project error probability settings.
Task assignments
Show which actors are responsible for completing direct and indirect work resulting from a task.
Supervision links
Show which actors supervise which subordinates. In VDT, the supervision structure (also called the exception-handling hierarchy ) represents a hierarchy of positions, defining who a subordinate would go to for information or to report an exception.
Even though the representation has qualitative elements (e.g., lacking the precision
offered by numerical models), through commitment to computational modeling, it becomes semi-formal (e.g., most people viewing the model can agree on what it describes), reliable (e.g., the same sets of organizational conditions and environmental factors generate the same sets of behaviors) and explicit (e.g., much ambiguity inherent in natural language is obviated). This, particularly when used in conjunction with the descriptive natural language theory of our extant literature, represents a substantial advance in the field of organizational analysis and design, and offers direct application to research and practice associated with command and control (C2).
Additionally, when modeling aggregations of people, such as work groups, departments, or firms, one can augment the kind of symbolic model from above with certain aspects of numerical representation. For instance, the distribution of skill levels in an organization can be approximated—in aggregate—by a Bell Curve; the probability of a given task incurring exceptions and requiring rework can be specified—organization wide—by a distribution; and the irregular attention of a worker to any particular activity or event (e.g., new work task or communication) can be modeled—stochastically—to approximate collective behavior. As another instance, specific organizational behaviors can be simulated hundreds of times—such as through Monte Carlo techniques—to gain insight into which results are common and expected versus rare and exceptional.
Of course, applying numerical simulation techniques to organizations is hardly new (Law and Kelton 1991). But this approach enables us to integrate the kinds of dynamic, qualitative behaviors emulated by symbolic models with quantitative metrics generated through discrete-event simulation. It is through such integration of qualitative and quantitative models—bolstered

6
by reliance on sound theory and empirical validation—that our approach diverges most from extant research methods, and offers new insight into organizational dynamics. Computational Modeling Environment. The computational modeling environment consists of the elements described in Table 1, and has been developed directly from Galbraith’s information processing view of organizations. This view of organizations, described in detail in Jin and Levitt (1996), has three key implications.
Figure 1 Information Processing View of Knowledge Work
(adapted from Nissen and Levitt 2004)
The first is ontological: we model knowledge work through interactions of tasks to be
performed; actors communicating with one another, and performing tasks; and an organization structure that defines actors’ roles, and constrains their behaviors. Figure 1 illustrates this view of tasks, actors and organization structure. As suggested by the figure, we model the organization structure as a network of reporting relations, which can capture micro-behaviors such as managerial attention, span of control, and empowerment. We represent the task structure as a separate network of activities, which can capture organizational attributes such as expected duration, complexity and required skills. Within the organization structure, we further model various roles (e.g., marketing analyst, design engineer, manager), which can capture organizational attributes such as skills possessed, levels of experience, and task familiarity. Within the task structure, we further model various sequencing constraints, interdependencies, and quality/rework loops, which can capture considerable variety in terms of how knowledge work is organized and performed.
As suggested by the figure also, each actor within the intertwined organization and task structures has a queue of information tasks to be performed (e.g., assigned work activities, messages from other actors, meetings to attend) and a queue of information outputs (e.g., completed work products, communications to other actors, requests for assistance). Each actor processes such tasks according to how well the actor’s skill set matches those required for a given activity, the relative priority of the task, the actor’s work backlog (i.e., queue length), and how many interruptions divert the actor’s attention from the task at hand.
The second implication is computational: work volume is modeled in terms of both direct work (e.g., planning, design, manufacturing) and indirect work (e.g., decision wait time, rework, coordination work). Measuring indirect work enables the quantitative assessment of (virtual) process performance (e.g., through schedule growth, cost growth, quality). The third implication is validational: the computational modeling environment has been validated extensively, over a period spanning almost two decades, by a team of more than 30 researchers (Levitt 2004). This validation process has involved three primary streams of effort: 1) internal validation against micro-social science research findings and against observed micro-behaviors in real-world organizations, 2) external validation against the predictions of macro-theory and against the observed macro-experience of real-world organizations, and 3) model
Communicationsto other actors“Out tray”
Actor“In tray”
Communicationsfrom other actors
Direct Work
Communicationsto other actors“Out tray”
Actor“In tray”
Communicationsfrom other actors
Direct Work
Communicationsto other actorsCommunicationsto other actors“Out tray”
Actor“In tray”
Communicationsfrom other actors
Direct Work
“Out tray”
Actor“In tray”
Communicationsfrom other actorsCommunicationsfrom other actors
Direct Work

7
cross-docking experiments against the predictions of other computational models with the same input data sets (Levitt et al. 2005). As such, ours is one of the few, implemented, computational organization modeling environments that has been subjected to such a thorough, multi-method trajectory of validation.
RESEARCH DESIGN In this section we formulate a computational model of the different organization forms. Then we develop a three-pronged set of experimental manipulations to test our hypotheses, and to examine the comparative performance of the different organizational forms under Industrial Era and 21st Century conditions.
Table 2 Model Formulation – Organization Forms
Structural Factor
Mintzberg Design
Parameter
Model Parameter Edge Machine
BureacracySimple
StructureProf.
BureacracyDivisional
Form Adhocracy
Decentralization Centralization Low High High Low Medium LowFormalization of
behavior Formalization Low High Low Low High Low
Vertical specialization Hierarchy Set-Up 1-level 3-level 2-level 2-level 4-level 1-level
" Operating Core Role ST ST ST ST ST ST" Holding Company (PM) 0 0 0 0 3 0" Command Position (PM) 0 3 3 3 3 0" Coordination Position (SL) 0 200 0 0 225 0" Operations Position (ST) 13,000 13,000 13,000 13,000 13,000 13,000
Size # of Total FTEs 13,000 13,203 13,003 13,003 13,231 13,000Unit Size # of FTEs per Unit 813 1650 2601 765 778 813
N/A # of Units 16 8 5 17 17 16Training Skill Level Med Med Med Med Med Med
Indoctrination App. Experience1,2 Med High Med High High LowTeam experience Med Low Low Med Low Low
Liaison Devices Communication Links Many Few Some Many Few Many" Information Exchange1 0.9 0.1 0.1 0.3 0.1 0.9
Planning & Control Systems
Meetings No Meetings2 hrs/day
(staff)42 hrs/week(10% ops)5
2 hrs/month(10% ops)5
2 hrs/day (staff)4,
2 hrs/week (top mgmt)
No Meetings
" Matrix Strength High Low Low Med. Low HighApp. Experience3 Add 1 level Subt 1 level Same level Same level Subt 1 level Same level
N/A6 Number of Operational Tasks 16 4 4 16 4 16
" Degree of ConcurrencyMassive
ConcurrencySequential,
2 PhaseSequential,
2 PhaseMassive
ConcurrencySequential,
2 PhaseMassive
Concurrency" Interdependence High Low Low High Low High" Rework Links Many Some Some Many Some Many" Rework Strength 0.1 0.3 0.3 0.1 0.3 0.1
Environment - Complxity FEP/PEP 0.2 0.1 0.1 0.2 0.1 0.2
1 This parameter has two aspects: indoctrination and planning & control systems.2 The indoctrination aspect of this parameter reflects the organization's familiarity with its environment.3 The planning & control systems aspect of this parameter reflects the organization's information processing environment; adjustment wrt indoctrination value.4 These meetings are between the Commander and Staff members.5 These meetings are between the Leader(s) and 10% of Operational Core members.6 Mintzberg does not explicitly address "work structure" in his paper.
Organization Structure
Communication Structure
Work Structure
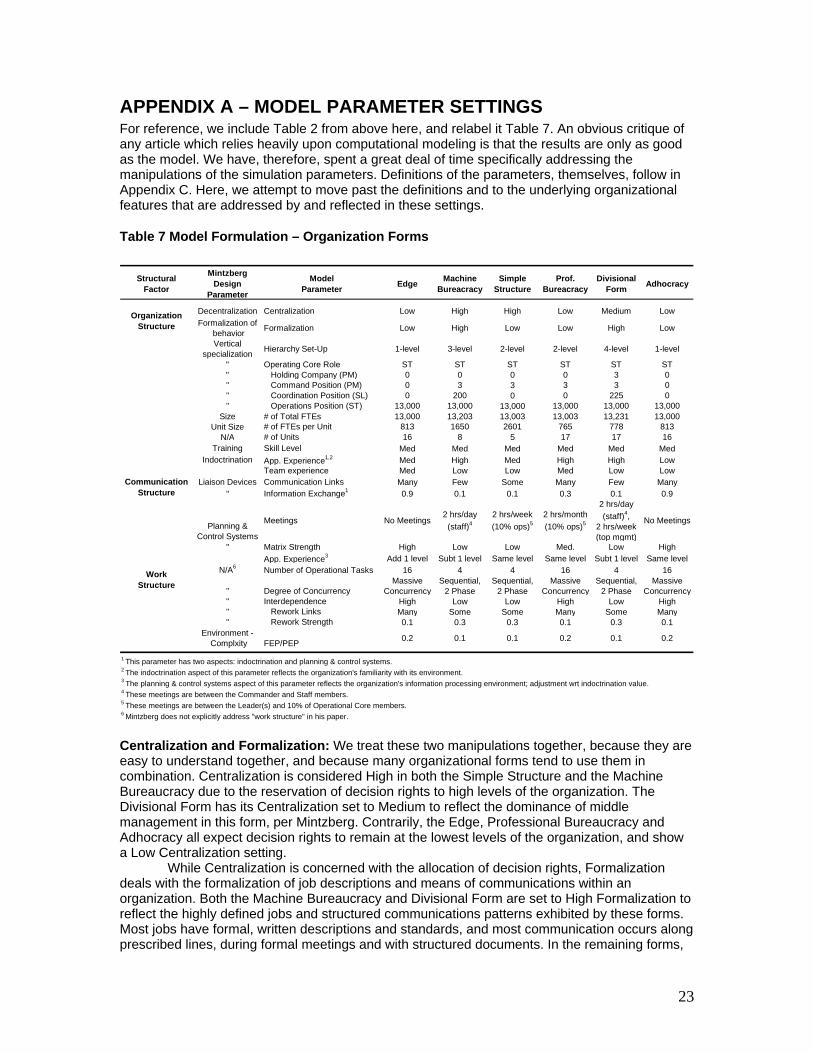
Model Formulation – Organization Forms Table 2 shows how this modeling environment is used to formulate models of the archetypal and Edge organizational forms, and how select model variables are used to operationalize the various organization design parameters. The three structural factors (i.e., organization, communication, work) derive directly from our prior computational experiments (Nissen 2005a, Orr and Nissen 2006); the Mintzberg design parameters derive directly from Mintzberg (1980); and the model parameters derive directly from our computational models. These latter parameters are specified precisely to represent each of the diverse organizational archetypes noted above. Notice that each organizational archetype consists of a unique combination of parameter settings in our computational models.

8
Parameter settings for the Edge and Machine Bureaucracy (i.e., equivalent to the Hierarchy in our prior article) replicate those reported in Nissen (2005a) very closely, hence we concentrate here on extensions to the additional archetypal forms. Parameter settings for the Simple Structure, Professional Bureaucracy, Divisionalized Form, and Adhocracy are comparable overall with those developed by Orr and Nissen (2006), but they reflect some, relatively minor adjustments that enhance the level of consistency across forms. The interested reader can consult this prior work for discussion of and rationale for the parameter settings, and we include Appendix A to this article to summarize them for easy reference. We summarize the model formulations here in Table 2. Close examination of the table indicates how these model formulations mirror theory well. Hence we present a theoretically grounded model formulation of six, distinct, organizational forms with relevance to C2. Table 3 Model Manipulations – Industrial Era and21st Century Conditions
Manipulation Model Parameter Industrial Era Value
21st Century Value
Soln. Complexity Med. HighRequirement Complexity Med. High
Uncertainty Med. High
FEP Baseline in Table 2
Baseline + 0.1
PEP Baseline in Table 2
Baseline + 0.1
App. Experience Baseline in Table 2
Baseline - one leveld
Noise 0.3a 0.01
Info. Exchange Prob. Baseline in Table 2
Baseline + 0.3b
Communication links Baseline
Baseline for Edge;
more for Hierarchye
Organization settingsc
Baseline for Hierarchy;
opposite for Edge
Baseline for Edge;
opposite for Hierarchy
App. Experience Baseline in Table 2
Baseline in Table 2
Skill Level Baseline in Table 2
Baseline + one level
Team Experience Baseline in Table 2
Baseline + one level
All of the above All of the above All of the above
Mission & Environmental Context (P1, 5)
Aggregate (P1 - 6)
Network Architecture (P2, 3)
Professional Competency (P2, 4)
Model Manipulations – Industrial Era and 21st Century Conditions We model organizational contexts of the Industrial Era and the 21st Century via the three dimensions specified by Nissen (2005a): 1) mission and environmental context, 2) network architecture, and 3) professional competency. These dimensions capture the research hypotheses from above, and hence provide a principal basis for experimentation. Using our computational modeling tools, each manipulation can be conducted independently to isolate separate effects, or can be conducted collectively to emulate aggregate effects. The experimental manipulations are listed in Table 3, which summarize how each of the three experimental

9
manipulations is specified across the two alternate scenarios. As noted at the bottom of in the table, we include a fourth, aggregate manipulation also. This aggregate manipulation includes all of the effects described in the other three manipulations: mission and environmental context, network architecture, and professional competency. In design terms, this represents a full factorial, 6 x 4 x 2 experiment (i.e., 6 archetypes, 4 manipulations, 2 scenarios). As above, the interested reader can consult our prior work for details, and we include Appendix B to this article to summarize them for easy reference.
Model Measurement – Dependent Variables Table 4 details the dependent variables — time, cost, direct work, rework, coordination work, decision wait time, maximum backlog, and product risk — that we use to assess the multidimensional performance of the different organization forms. Table 4 Model Measurement – Dependent Variables
Dependent Variable
TimeTime (days) is the predicted time to perform a project, in working days, which includes both direct and indirect (i.e. coordination, rework and decision latency) work.
CostCost (dollars) is the predicted cost of labor to perform a project, in dollars, which includes both direct and indirect (i.e. coordination, rework and decision latency) work.
Direct Work
Direct work measures the amount of time, in person-days, that all actors in a project spend completing direct functional or technical activities – excluding rework, coordination work, and decision wait time – related to the completion the project.
Coordination Work
Coordination work measures the amount of time, in person-days, that all actors in a project spend attending to meetings and processing information requests from other positions.
Decision Wait Time
Decision wait time measures the amount of time, in person-days, that all actors in a project spend waiting for information and responses about how to handle exceptions.
Maximum Backlog
Product risk (PRI)
Project risk index (PRI) measures the risk to quality arising from project exceptions. PRI represents the likelihood that all of the planned work components will not be integrated well by project completion, or that the integration will have residual defe
Parameter Description
ReworkRework measures the amount of time, in person-days, that all actors in a project spend redoing tasks in the project that have generated exceptions.
Maximum Backlog measures the number of days’ work that an organizational actor has backlogged; that is, it measures the degree to which an actor is behind schedule. A backlog of one day would represent an actor that is fully busy but not behind.
RESULTS In this section, we describe the experimental results produced using the computational models and 6 x 4 x 2 experimental design outlined above. Specifically, here we evaluate emulated organizational performance for Machine Bureaucracy, Edge, Simple Structure, Professional Bureaucracy, Divisionalized Form and Adhocracy organizations, subject to the four experimental manipulations, under both Industrial Era and21st Century conditions. In the following subsections, we first provide some empirical data for comparison across theoretically distinct forms. We then make comparisons down the four experimental manipulations, examining how the different experimental conditions affect the behavior and performance of these organizational archetypes.
10
We subsequently summarize the empirical results in terms of our research hypotheses. We then discuss the organization design space as a whole.
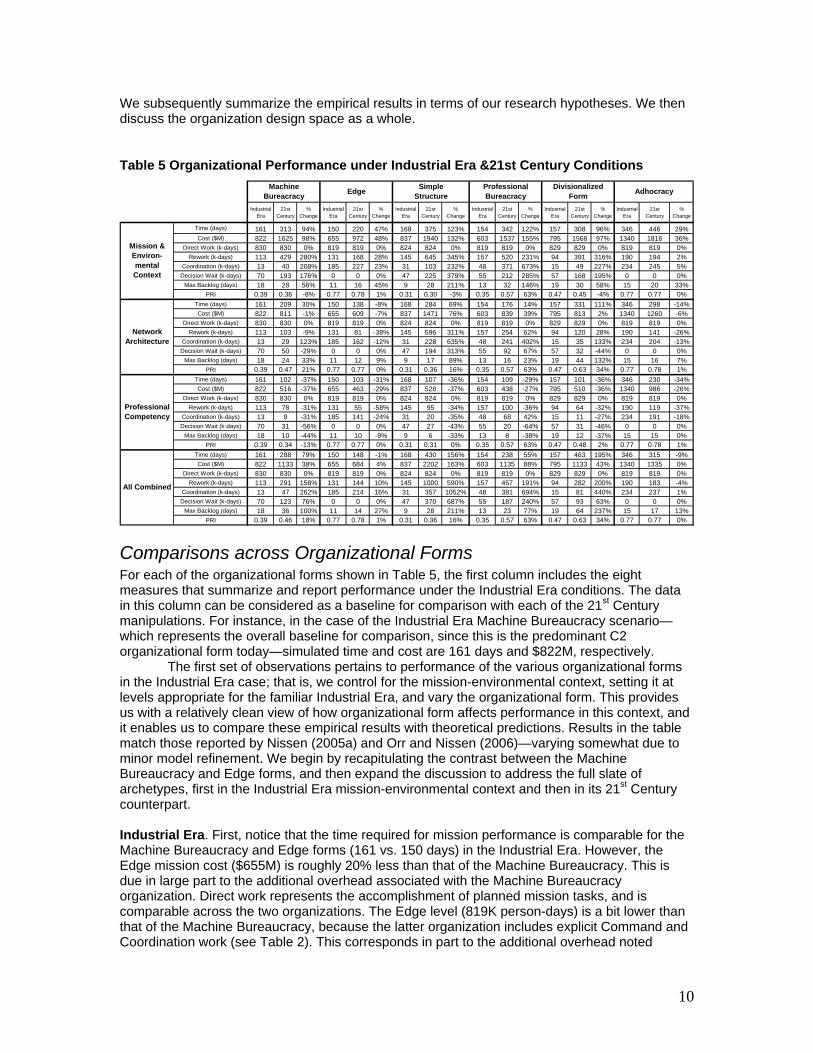
Table 5 Organizational Performance under Industrial Era &21st Century Conditions
Industrial Era
21st Century
% Change
Industrial Era
21st Century
% Change
Industrial Era
21st Century
% Change
Industrial Era
21st Century
% Change
Industrial Era
21st Century
% Change
Industrial Era
21st Century
% Change
Time (days) 161 313 94% 150 220 47% 168 375 123% 154 342 122% 157 308 96% 346 446 29%Cost ($M) 822 1625 98% 655 972 48% 837 1940 132% 603 1537 155% 795 1568 97% 1340 1816 36%
Direct Work (k-days) 830 830 0% 819 819 0% 824 824 0% 819 819 0% 829 829 0% 819 819 0%Rework (k-days) 113 429 280% 131 168 28% 145 645 345% 157 520 231% 94 391 316% 190 194 2%
Coordination (k-days) 13 40 208% 185 227 23% 31 103 232% 48 371 673% 15 49 227% 234 245 5%Decision Wait (k-days) 70 193 176% 0 0 0% 47 225 379% 55 212 285% 57 168 195% 0 0 0%
Max Backlog (days) 18 28 56% 11 16 45% 9 28 211% 13 32 146% 19 30 58% 15 20 33%PRI 0.39 0.36 -8% 0.77 0.78 1% 0.31 0.30 -3% 0.35 0.57 63% 0.47 0.45 -4% 0.77 0.77 0%
Time (days) 161 209 30% 150 138 -8% 168 284 69% 154 176 14% 157 331 111% 346 298 -14%Cost ($M) 822 811 -1% 655 609 -7% 837 1471 76% 603 839 39% 795 813 2% 1340 1260 -6%
Direct Work (k-days) 830 830 0% 819 819 0% 824 824 0% 819 819 0% 829 829 0% 819 819 0%Rework (k-days) 113 103 -9% 131 81 -38% 145 596 311% 157 254 62% 94 120 28% 190 141 -26%
Coordination (k-days) 13 29 123% 185 162 -12% 31 228 635% 48 241 402% 15 35 133% 234 204 -13%Decision Wait (k-days) 70 50 -29% 0 0 0% 47 194 313% 55 92 67% 57 32 -44% 0 0 0%
Max Backlog (days) 18 24 33% 11 12 9% 9 17 89% 13 16 23% 19 44 132% 15 16 7%PRI 0.39 0.47 21% 0.77 0.77 0% 0.31 0.36 16% 0.35 0.57 63% 0.47 0.63 34% 0.77 0.78 1%
Time (days) 161 102 -37% 150 103 -31% 168 107 -36% 154 109 -29% 157 101 -36% 346 230 -34%Cost ($M) 822 516 -37% 655 463 -29% 837 528 -37% 603 438 -27% 795 510 -36% 1340 986 -26%
Direct Work (k-days) 830 830 0% 819 819 0% 824 824 0% 819 819 0% 829 829 0% 819 819 0%Rework (k-days) 113 78 -31% 131 55 -58% 145 95 -34% 157 100 -36% 94 64 -32% 190 119 -37%
Coordination (k-days) 13 9 -31% 185 141 -24% 31 20 -35% 48 68 42% 15 11 -27% 234 191 -18%Decision Wait (k-days) 70 31 -56% 0 0 0% 47 27 -43% 55 20 -64% 57 31 -46% 0 0 0%
Max Backlog (days) 18 10 -44% 11 10 -9% 9 6 -33% 13 8 -38% 19 12 -37% 15 15 0%PRI 0.39 0.34 -13% 0.77 0.77 0% 0.31 0.31 0% 0.35 0.57 63% 0.47 0.48 2% 0.77 0.78 1%
Time (days) 161 288 79% 150 148 -1% 168 430 156% 154 238 55% 157 463 195% 346 315 -9%Cost ($M) 822 1133 38% 655 684 4% 837 2202 163% 603 1135 88% 795 1133 43% 1340 1335 0%
Direct Work (k-days) 830 830 0% 819 819 0% 824 824 0% 819 819 0% 829 829 0% 819 819 0%Rework (k-days) 113 291 158% 131 144 10% 145 1000 590% 157 457 191% 94 282 200% 190 183 -4%
Coordination (k-days) 13 47 262% 185 214 16% 31 357 1052% 48 381 694% 15 81 440% 234 237 1%Decision Wait (k-days) 70 123 76% 0 0 0% 47 370 687% 55 187 240% 57 93 63% 0 0 0%
Max Backlog (days) 18 36 100% 11 14 27% 9 28 211% 13 23 77% 19 64 237% 15 17 13%PRI 0.39 0.46 18% 0.77 0.78 1% 0.31 0.36 16% 0.35 0.57 63% 0.47 0.63 34% 0.77 0.77 0%
Adhocracy
All Combined
Machine Bureacracy
Simple Structure
ProfessionalBureacracy
Divisionalized Form
Mission & Environ-mental Context
Network Architecture
Professional Competency
Edge
Comparisons across Organizational Forms For each of the organizational forms shown in Table 5, the first column includes the eight measures that summarize and report performance under the Industrial Era conditions. The data in this column can be considered as a baseline for comparison with each of the 21st Century manipulations. For instance, in the case of the Industrial Era Machine Bureaucracy scenario—which represents the overall baseline for comparison, since this is the predominant C2 organizational form today—simulated time and cost are 161 days and $822M, respectively.
The first set of observations pertains to performance of the various organizational forms in the Industrial Era case; that is, we control for the mission-environmental context, setting it at levels appropriate for the familiar Industrial Era, and vary the organizational form. This provides us with a relatively clean view of how organizational form affects performance in this context, and it enables us to compare these empirical results with theoretical predictions. Results in the table match those reported by Nissen (2005a) and Orr and Nissen (2006)—varying somewhat due to minor model refinement. We begin by recapitulating the contrast between the Machine Bureaucracy and Edge forms, and then expand the discussion to address the full slate of archetypes, first in the Industrial Era mission-environmental context and then in its 21st Century counterpart. Industrial Era. First, notice that the time required for mission performance is comparable for the Machine Bureaucracy and Edge forms (161 vs. 150 days) in the Industrial Era. However, the Edge mission cost ($655M) is roughly 20% less than that of the Machine Bureaucracy. This is due in large part to the additional overhead associated with the Machine Bureaucracy organization. Direct work represents the accomplishment of planned mission tasks, and is comparable across the two organizations. The Edge level (819K person-days) is a bit lower than that of the Machine Bureaucracy, because the latter organization includes explicit Command and Coordination work (see Table 2). This corresponds in part to the additional overhead noted

11
above. Rework measures the amount of mission work that is redone due to errors and exceptions. The values reported in the table indicate that the Edge organization (131K person-days) engages in somewhat more rework than the Machine Bureaucracy (113K) does. In contrast, the Edge engages in an order of magnitude greater coordination work (185K person-days) than the Machine Bureaucracy (13K) does. This reflects directly the flat organization and highly networked, peer-to-peer communication structures associated with the Edge.
In further contrast, the Edge organization incurs no decision wait time, whereas the Machine Bureaucracy reveals a sizeable amount (70K person-days). Unlike the Machine Bureaucracy, in which actors wait for supervisors to make decisions and to provide information, Edge actors make the best decisions that they can, and use the best information that they have, when called to perform their mission tasks. This accounts in part for the slightly faster mission-execution time and lower cost. Maximum backlog for the Edge organization (11 days) is less than that for the Machine Bureaucracy (18 days), indicating that the Commander in the Machine Bureaucracy gets several weeks behind at the peak. Finally, PRI is a mission-risk index, which quantifies the magnitude of work that would be required to correct all exceptions that were not reworked completely. The Edge (0.77) exhibits double the risk associated with mission performance by the Machine Bureaucracy (0.39).
Looking now across the other organizational forms, notice that time in this Industrial Era mission-environmental context is roughly comparable across all forms except for the Adhocracy. Specifically, the Simple Structure (168), Professional Bureaucracy (154) and Divisionalized Form (157) are all within 10% of the Machine Bureaucracy (161) time, whereas the Adhocracy (346) is more than double. In terms of time, most organizational forms appear to fit the Industrial Era environment relatively well, but the Adhocracy clearly represents a poor choice in terms of form in this context. The Edge (150) remains the fastest organizational form, but it is followed closely by the Professional Bureaucracy (154) and Divisionalized Form (157). In terms of cost, we observe greater variation across the forms. The Professional Bureaucracy ($603M) is roughly 10% less expensive than the Edge form ($655M), followed by the Divisionalized Form ($795M), Machine Bureaucracy ($822M) and Simple Structure ($837M), with the Adhocracy ($1340M) performing most poorly among the six forms.
The other results summarized in the table highlight different dimensions of performance across the various organizations. For instance, notice that the Edge form has the lowest decision wait time. Indeed, the Edge value (0 person-days) reveals that no time is wasted waiting for decisions and information from supervisors. The Adhocracy shares this aspect of organizational behavior. In contrast, the Simple Structure (47), Professional Bureaucracy (55) and Divisionalized Form (57) all reflect considerable decision wait time, and the Machine Bureaucracy (70) shows the worst performance across the six organizational forms with respect to this dimension. For another instance, The Edge (0.77) and Adhocracy (0.77) both reflect very high risk in terms of PRI, whereas all of the other forms show considerably lower risk.
To summarize, looking across this multidimensional characterization of comparative organizational performance, none of the six organizational forms is clearly dominant in the Industrial Era mission-environmental context. The Edge form, for instance, is the fastest in terms of time, and is one of the least expensive forms, reflecting zero decision wait time, but it reflects the highest risk level of all forms. Which one is “better” depends upon stakeholder performance preferences. 21st Century. Look next at 21st Century performance across the organizational forms. The Edge (220 days) reflects the fastest organizational form, and unlike in the Industrial Era above, the other forms are considerably slower than the Edge is. Hence the Edge appears to be relatively robust to environmental change when compared to the other forms, at least in terms of the performance dimension time. The Edge reflects the best performance across forms in terms of cost ($972M) as well, with all of the other forms above the $1.3B level in this more demanding, 21st Century mission-environmental context. A key part of the Edge form’s robustness can be seen via the third column labeled “% change” for the six forms. Whereas Edge performance degrades by roughly 20 – 50% across the shift from Industrial Era to 21st Century conditions, most of the other organizational forms experience performance degradation of 100% or more,

12
across multiple performance dimensions. Alternatively, Edge performance in terms of risk remains very high (0.78) when compared to the other organizational forms.
Industrial Age & 21st Century
MI
EI
SIPI
DI
AI
M2
E2
S2
P2
D2
A2
0.20
0.30
0.40
0.50
0.60
0.70
0.80
0.90
100 150 200 250 300 350 400 450 500
Time
Risk
Figure 2 Time-Risk Performance Summary across Forms & Eras
This can be viewed clearly via the graph presented in Figure 2. This graph depicts
comparative organizational performance in terms of the dimensions time (horizontal axis) and risk (vertical axis), for all six organizational forms, across the Industrial Era and 21st Century cases. The performance plot point for each organization is labeled for easy visual reference. For instance, the Machine Bureaucracy is labeled “MI” in the Industrial Era and “M2” in the 21st Century case; the Edge is labeled “EI” in the Industrial Era and “E2” in the 21st Century case; and so forth for the other forms (i.e., “SI” & “S2” for Simple Structure, “PI” & “P2” for Professional Bureaucracy, etc.). These plot points correspond directly to the performance results summarized in Table 5.
Notice how performance points for four forms (i.e., “MI,” “SI,” “PI,” “DI”) cluster in the lower-left corner of the graph: performance in the Industrial Era is quite comparable across these four organizational forms. In contrast, and as observable via the table, performance of the Edge and Adhocracy forms is much worse in terms of risk, and although the Edge reveals marginally better performance in terms of time than the other four forms do, the Adhocracy is by far the worst of all forms in the Industrial Era. As such, if a leader or policy maker were to select the “best” organizational form for the Industrial Era—with an interest in balancing performance in terms of time and risk—he or she would likely select one of the four forms in the lower-left corner. This result is consistent with observations from practice: most C2 organizations in the Industrial Era reflect one or more of the four forms clustered in that corner.
Alternatively, when comparing performance in the 21st Century across organizational forms, as summarized in the table, the graph reveals the dramatic performance degradation experience by all forms except for the Edge, and it shows how all four of the forms from above that balance time and risk well in the Industrial Era (i.e., labeled “MI,” “SI,” “PI,” “DI”) clearly struggle to perform in the 21st Century mission-environmental context. Nonetheless, whether the Edge (i.e., “E2”) is “better” in terms of both time and risk than these four forms is unclear: it depends upon how important one performance dimension is relative to the other.

13
Comparisons across Experimental Manipulations Now we examine performance of the organizations across the four experimental manipulations. For this we look down the columns of the table, and we concentrate on the 21st Century Era, since this represents more of the present and future than the past. We examine each of the manipulations in sequence, comparing each with results reported above. Network Architecture. We begin by looking first at the Machine Bureaucracy—again, as the most common form today, and as a basis for comparison. We compare its 21st Century performance reported above in the Mission & Environmental Context row with that summarized in the Network Architecture row of the table. Notice that, when compared to 21st Century performance reported above, organizational performance of the Machine Bureaucracy improves across most dimensions through this network manipulation. For instance, time (209 vs. 313), cost ($811M vs. $1625M), decision wait time (50 vs. 193) and other measures reflect increased performance. Only the risk index degrades (0.47 vs. 0.36) between these two manipulations. A similar result can be seen for the Edge organization, in which every performance measure reflects a lower value with the Network Architecture manipulation than when compared to 21st Century performance reported above.
Alternatively, when compared to Industrial Era performance, organizational performance of the Machine Bureaucracy with this Network Architecture manipulation is worse in several respects than the baseline. In particular, time (30%), coordination (123%), backlog (33%) and risk (21%) all reflect higher values in the Network Architecture case than in the baseline. A key part of this worsening of performance stems from the changes in organizational parameters. Whereas the enhanced network architecture enables the Machine Bureaucracy to exhibit somewhat less centralization and formalization, along with greater matrix strength (i.e., become somewhat less bureaucratic), it also precludes the organization from maintaining its strict controls and discipline. Hence “enhancing” the network architecture—and in turn enabling less bureaucratic organizational behaviors—represents a metaphorical two-edge sword: lateral communication and collaboration is enhanced, but bureaucratic safeguards are relaxed. Given the current, intensive focus placed on enhancing network architecture to support organizational C2, this result should be considered very carefully by leaders and policy makers.
In contrast, performance of the Edge organization with the Network Architecture manipulation in the 21st Century Era is better than in the Industrial Era. With the Edge structure, the network architecture enhancements complement the form’s inherent flexibility, and promote the kinds of lateral communication and collaboration that are central to Edge operations. Hence enhancing the network architecture serves to reinforce the Edge organizational form.
Results across the other organizational forms are similar but mixed. For instance, looking at the 21st Century column, performance of the Simple Structure, Professional Bureaucracy, Divisionalized Form and Adhocracy improves via the network-architecture manipulation over that reported above. Indeed, every organizational form reflects better 21st Century performance through enhanced network architecture. As with the Machine Bureaucracy above, the only exception pertains to risk, which increases somewhat for the Simple Structure and Divisionalized Form. Such monotonic performance improvement due to the network architecture manipulation suggests that the kinds of investments being made currently in the Global Information Grid and other network-centric infrastructure are well-advised, and offer potential to improve organizational performance in the demanding 21st Century environment. Of course, such investments come at considerable cost. Professional Competency. Looking again at the Machine Bureaucracy, here we compare its 21st Century performance reported in the Mission & Environmental Context row above with that summarized for the Professional Competency row of the table. Notice that organizational performance improves dramatically across multiple dimensions through the professional competency manipulation. For instance, time (102 vs. 313), cost ($516M vs. $1625M), decision wait time (31 vs. 193) and other measures reflect increased performance, and unlike reported above for the network architecture manipulation, risk (0.34 vs. 0.36) does not rise via enhanced

14
professional competency. This quantifies the huge importance of organization and knowledge flows in terms of performance.
A similar result can be seen for the Edge organization, in which every performance measure reflects a lower value with the professional competency manipulation than when compared to 21st Century performance reported above. Indeed, performance improves across all organizational forms when professional competency is enhanced dramatically. Hence regardless of which of these organizational forms is selected, increasing professional competency offers dramatic potential to improve performance.
Moreover, notice that the magnitude of performance improvements via professional competency is greater than that reflected via network architecture. To reinforce the comment above, given the relatively light emphasis placed upon enhancing the professional competency of C2 organizations today, this empirical result could call for decision makers and policy makers to reconsider their priorities also. All Combined. Looking again at the Machine Bureaucracy, here we compare its 21st Century performance reported in the Mission & Environmental Context row above with that summarized for the All Combined row of the table. This fourth, aggregate manipulation combines the effects of all three manipulations discussed above. As one would expect, this aggregate manipulation reflects a combination of performance degradation observed in the 21st Century mission-environmental context with performance enhancement via the network architecture and professional competency manipulations. Hence, if an organization is thrust into the kind of more demanding mission-environmental context represented by our 21st Century case, then leaders and policy makers should seek to enhance performance through improved network architecture and increased professional competency.
So which organizational form is “best” in the 21st Century case? As suggested above, this depends upon which performance measures are of greatest importance to organizational stakeholders. Here with this all combined manipulation, for instance, the Edge demonstrates the greatest speed (148 days) and lowest cost ($684M) of all forms, but it reflects considerable rework (144K person-days) and coordination (214K person-days), and this form retains the worst risk levels (0.78). In contrast, the Machine Bureaucracy, is slower (288 days) and more expensive ($1133M) than the Edge is, and it incurs more rework (291K person-days) than the Edge does, but coordination (47K person-days) is less, and risk (0.46) is considerably less than that of the Edge form.
Nonetheless, one can say that some organizational forms dominate others in this 21st
Century case. For instance, the Edge reflects faster speed (148 vs. 315) and lower cost ($684M vs. $1335M) than the Adhocracy does, and its rework (144 vs. 183) and coordination (214 vs. 237) are less than those of the Adhocracy, yet risk levels (0.78 vs. 0.77) are comparable. Hence one could say that the Edge form should be preferred strictly over the Adhocracy in the 21st
Century case. The case for dominance is not as straightforward to establish in terms of the other organizational form, however. We need some mechanism for weighting and comparing performance across multiple dimensions. This remains for future research.
Support for Hypotheses Despite expanding the scope of research in this present investigation to include six archetypal organizational forms, such expansion does not change the results reported by Orr and Nissen (2006) appreciably. Indeed, although the former study focused solely on a contrast between the Edge and Hierarchy/Machine Bureaucracy forms, the results of this current, expanded study remain consistent—albeit a bit weaker in terms of support across all organizational forms. We recapitulate and refine the results reported by Orr and Nissen (2006) here. Hypothesis 0. This hypothesis demands an omnibus assessment of Edge and Hierarchy/Machine Bureaucracy organizational performance across eras. The Edge form outperforms the Machine Bureaucracy and other archetypal forms in the 21st Century Era (e.g., in terms of time and cost), but not across all performance measures (esp. risk). This provides partial support for the hypothesis.

15
Hypothesis 1. Our Mission & Environmental Context manipulation addresses this hypothesis in part, and results above in terms of comparisons across eras provide partial support for this hypothesis. The Edge organization exhibits considerably greater agility, and hence is more robust to the challenges and demands of the 21st Century Era than the Machine Bureaucracy and several other forms are. However, the Edge form retains higher risk levels than those exhibited by most other organizations. Hypothesis 2. Our Network Architecture manipulation addresses this hypothesis in part, and the Professional Competency manipulation addresses it too. If we look to the Aggregate manipulation above, we see that improving the network architecture and enhancing professional competency improves organizational performance considerably, for the Edge, Machine Bureaucracy and other organizational forms alike. Hence this hypothesis is supported for multiple organizational forms. Hypothesis 3. Our Network Architecture manipulation addresses this hypothesis in part, as we find evidence that improving network architecture increases organizational agility, and makes the organization more robust to challenges and demands of the 21st Century Era. However, our computational models do not represent each of six different C2 philosophies explicitly; hence our support for this hypothesis is limited. Hypothesis 4. Our Professional Competency manipulation addresses this hypothesis in large part, but the Network Architecture manipulation plays some role too (e.g., post and smart-pull environment). If we focus on professional competency effects, which include people working together over time, we find substantial support for this hypothesis. Hypothesis 5. Our Mission & Environmental Context manipulation addresses this hypothesis in part, and results above in terms of comparisons across eras provide some support for this hypothesis. The Edge organization exhibits considerably greater agility, and hence is more robust to the uncertainties and dynamics of the 21st Century Era than the Machine Bureaucracy and most other forms are. The adhocracy represents an exception, however, as it experiences very low percentage degradation in organizational performance in the 21st Century case. Hypothesis 6. This hypothesis is difficult to assess via our computational results, for we do not represent resource expenditures explicitly, nor do we have variables to measure power. Indeed, the kinds of network architecture effects represented in our model demand huge resource investments in global communications infrastructure. Hence such investments provide some evidence against this hypothesis. Alternatively, the kinds of professional competency effects represented in our model do not demand large resource investments, as simply changing organizational policy to reduce job and personnel turnover can bring about considerable improvements in knowledge flows—and in turn organizational performance.
Organization Design Space The discussion above provides empirical comparisons and contrasts between the six archetypal organizational forms examined, and it provides partial support for the seven research hypotheses articulated above. It appears that the Edge organization exhibits superior performance across some dimensions (e.g., time, cost, decision wait time)—particularly in the 21st Century case—but the Machine Bureaucracy exhibits superior performance across others (esp. risk), and the Adhocracy experiences lower percentage performance degradation in the 21st Century case. Indeed, each of the six organizational forms exhibits attributes that would make it perform better in some environments and contexts than in others. The question is, how can one combine the best aspects of the Edge, Machine Bureaucracy, and others to compose a clearly superior organizational form? A related question follows, how can aspects of the other organizational forms contribute toward such superior form? In other words, how can we draw the best parts of alternate organizational forms, and combine them into a dominant hybrid? These are questions of organizational design, and our computational models provide the basis for answering such

16
questions. The key is to use the six, archetypal, computational models from above to represent an organizational design space via the dozens of parameters and settings used to specify each particular organizational form.
For instance, if we can identify the model parameters that enable the Edge organization to operate so quickly and inexpensively, and combine them with the parameters that enable the Machine Bureaucracy to reduce risk, and combine them with those enabling the Adhocracy to withstand environmental change, then we might be able to design a “new,” hybrid, organizational form that outperforms the Edge, Machine Bureaucracy and Adhocracy alike. Moreover, if we can identify the model parameters that enable the Simple Structure to keep risk below that of the Machine Bureaucracy, that enable the Professional Bureaucracy to operate so quickly in predictable environments such as the Industrial Era, and that enable the Divisionalized Form to keep rework down in predictable environments—that is, drawing the best from each organizational form—then we would establish the capability to design an organization that is tailored specifically to a particular environment. Further, if we can identify the model parameters that make each of the various organizational forms more or less effective in terms of responses to manipulations such as enhanced network architecture and increased professional competency, then we would establish the capability to design an organization that is tailored specifically to a particular manipulation. This represents the objective of articulating the organization design space: to facilitate organizational design specific to particular environments and managerial manipulations.
The first step is to understand how the various model parameters contribute to differentiate the six, archetypal organizational forms from one another. Referring back to the model specifications in Table 2, notice that most parameter settings are common across two or more different organizational forms. For instance, centralization is “low” for the Edge, Professional Bureaucracy and Adhocracy forms, and is “high” for the Machine Bureaucracy and Simple Structure. As another instance, formalization is “low” for the Edge, Professional Bureaucracy, Simple Structure and Adhocracy forms, and is “high” for the Machine Bureaucracy and Divisionalized Form. As a third instance, hierarchy is “1-level” for the Edge and Adhocracy, “2-level” for the Simple Structure and Professional Bureaucracy, and higher for the Machine Bureaucracy and Divisionalized Form. Clearly, looking across only these three parameter settings is insufficient to differentiate the six forms, but are all 25 of the parameters summarized in Table 2 necessary to differentiate these forms?
Table 6 Parametric Differentiation of Archetypes
Centralization
Hierarchy Levels
Application Experience
Edge Low 1 High
Adhocracy Low 1 Low
Professional Bureaucracy
Low 2 High
Simple Structure
High 2 Med
Machine Bureaucracy
High 3 Med
Divisional Form
Med 4 Med
Through analysis of Table 2, we show that three parameters are sufficient to differentiate the six forms uniquely: centralization, hierarchy and application experience. This is summarized in

17
Table 6. Notice how, on the basis of centralization, the Edge, Adhocracy and Professional Bureaucracy are alike, and how these three forms are different than the other three. This centralization parameter setting divides the organizational forms into two groups. The levels of hierarchy parameter setting divides them further, and including the different application experience settings enables us to define six, unique organizational forms. Because each of these parameters is independent of the others, we establish here a minimal, orthogonal set of parameters required to differentiate the organization design space. Figure 3 delineates this space.
The figure displays a three-dimensional representation with each model parameter denoted on a separate axis. All three axes are denoted with high and low endpoints for ease of comparison across dimensions. Each of the six organizational forms is plotted according to the entries in this table. For instance, the Edge form is plotted at the low level of centralization, high level of application experience, and low (i.e., 1-level) end of hierarchy, in the right-rear-upper corner of the diagram. For some contrast, the Machine Bureaucracy is plotted at the high level of centralization, medium level of application experience, and relatively high (i.e., 3-level) end of hierarchy, in the left-middle-lower corner of the diagram. Following this same scheme: the Simple Structure plots “above” the Machine Bureaucracy; the Professional Bureaucracy plots “below” the Edge; and so forth as depicted in the figure.
H Centralization L
H
H
iera
rchy
L
L
App Exper
H
Edge
Machine
Simple
ProfBur
Division
AdhocracyE
H
A B
CD
Figure 3 Minimal Orthogonal Organization Design Space
Delineation of the six archetypal forms as such raises several noteworthy points. For one,
as noted above, the six, theoretically unique, organizational forms can be differentiated via three parametric dimensions. This suggests that one can conceivably design organizations with as few as three design parameters. Such a finding would simplify the task of organizational design considerably. For another, the six organizational forms are clearly separate and distinct from one another in the figure, but some forms plot further apart than others do; that is, one can observe some relative clustering. For instance, the Edge, Professional Bureaucracy and Adhocracy all plot on the right side of the diagram, with the Edge and Adhocracy both plotting at the top, whereas the Simple Structure and Machine Bureaucracy plot on the left side of the diagram, and more toward the bottom. The Divisional Form plots in the center of the “floor” of the diagram. Notice the
18
connection between this clustering in terms of design and that noted above in terms of performance. This provides a start to understanding the impact of various design parameters on resulting organizational performance.
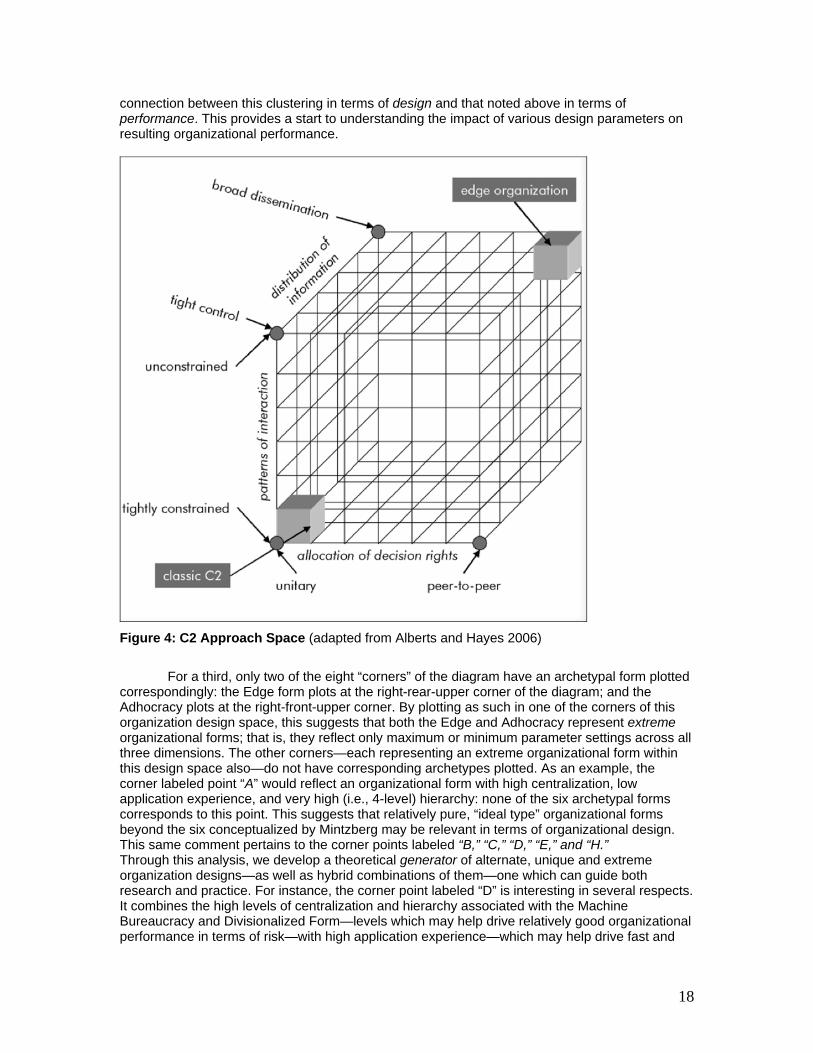
Figure 4: C2 Approach Space (adapted from Alberts and Hayes 2006)
For a third, only two of the eight “corners” of the diagram have an archetypal form plotted
correspondingly: the Edge form plots at the right-rear-upper corner of the diagram; and the Adhocracy plots at the right-front-upper corner. By plotting as such in one of the corners of this organization design space, this suggests that both the Edge and Adhocracy represent extreme organizational forms; that is, they reflect only maximum or minimum parameter settings across all three dimensions. The other corners—each representing an extreme organizational form within this design space also—do not have corresponding archetypes plotted. As an example, the corner labeled point “A” would reflect an organizational form with high centralization, low application experience, and very high (i.e., 4-level) hierarchy: none of the six archetypal forms corresponds to this point. This suggests that relatively pure, “ideal type” organizational forms beyond the six conceptualized by Mintzberg may be relevant in terms of organizational design. This same comment pertains to the corner points labeled “B,” “C,” “D,” “E,” and “H.” Through this analysis, we develop a theoretical generator of alternate, unique and extreme organization designs—as well as hybrid combinations of them—one which can guide both research and practice. For instance, the corner point labeled “D” is interesting in several respects. It combines the high levels of centralization and hierarchy associated with the Machine Bureaucracy and Divisionalized Form—levels which may help drive relatively good organizational performance in terms of risk—with high application experience—which may help drive fast and
19
low-cost performance. Such an organization design might offer promise in terms of taking advantage of the best properties of Edge and Machine Bureaucracy designs, for example. Other extreme corner points might offer similar advantages in terms of different combinations of archetypes. Understanding the relative structures, properties, behaviors and performance characteristics of organizational forms corresponding to these corner points, as well as hybrid combinations of them, represents an intriguing topic for future research.
To close this section, notice how our articulation of the organizational design space above reveals both similarities and differences with respect to the “C2 approach space” that Alberts and Hayes (2006) outline for C2 organizations and processes. Specifically, their C2 approach space varies along three axes also: 1) patterns of interaction (constrained to unconstrained), distribution of information (tight control to broad dissemination), and allocation of decision rights (unitary to peer-to-peer). As shown in Figure 4, “Classic C2” (i.e., the Machine Bureaucracy) and the Edge, when viewed through this lens, are both at opposite and extreme corners of the approach space. Alternatively, whereas the Edge form plots in a similar position in our organization design space, the Machine Bureaucracy does not. This raises some question as to whether the Edge and Machine Bureaucracy forms represent “opposites” as depicted in Figure 4, or whether they simply occupy different regions of design space.
One would first have to reconcile the model parameters and settings used to construct the organization design space above with the three axes used here in the C2 approach space. For instance, the dimension centralization from our computational model would appear to map relatively well to the dimension allocation of decision rights from the C2 approach space: high centralization would correspond well with unitary allocation of decision rights. Alternatively, mappings between model dimensions and either the patterns of interaction or distribution of information dimensions is not as clear. One would then have to establish where each of the six, archetypal, organizational forms from above would plot in this latter approach space. For instance, one could argue, based on the arrangement of archetypal forms delineated in Figure 3, that the Edge and Machine Bureaucracy forms are represented well in the approach space of Figure 4: once the dimensional mapping noted above has been accomplished, the other archetypal forms could be interrelated between the two views. Finally, one would have to establish some correspondence between comparative organizational performance and the various regions of the C2 approach space in order to inform design. This could follow directly from the kinds of mapping and interrelation steps noted above, but we are not in a position to report on such mapping and interrelation at this time. Hence we reserve this for future research.
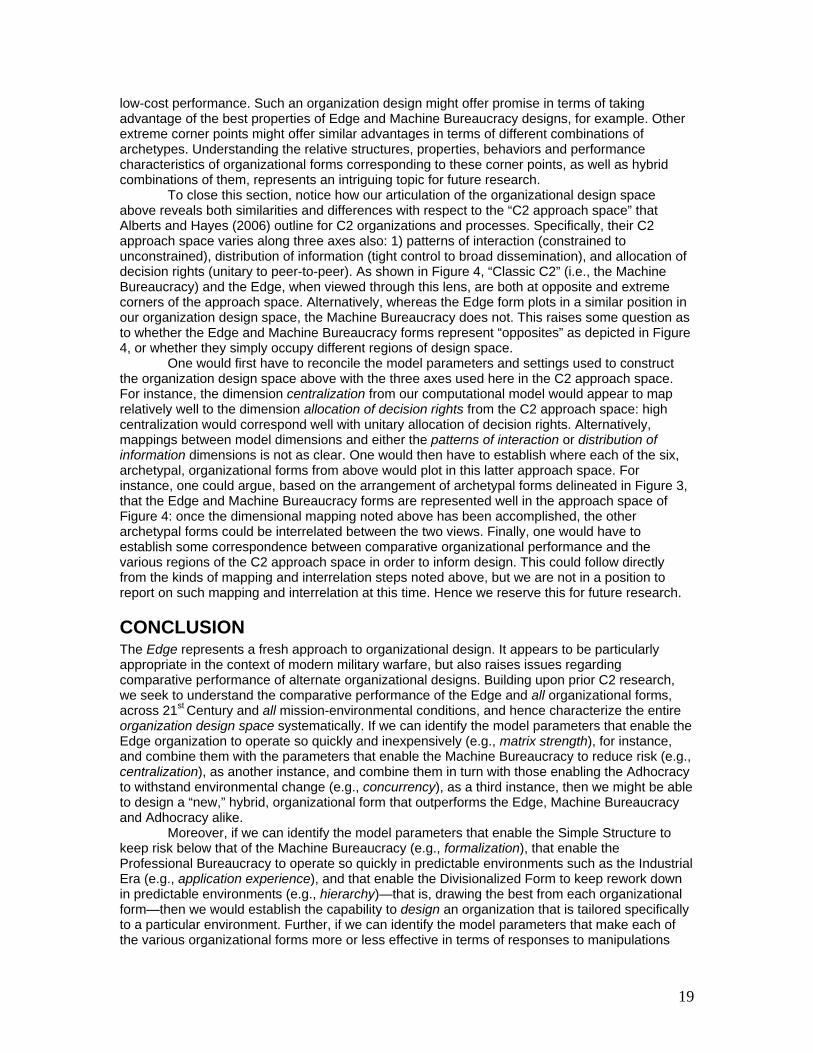
CONCLUSION The Edge represents a fresh approach to organizational design. It appears to be particularly appropriate in the context of modern military warfare, but also raises issues regarding comparative performance of alternate organizational designs. Building upon prior C2 research, we seek to understand the comparative performance of the Edge and all organizational forms, across 21st Century and all mission-environmental conditions, and hence characterize the entire organization design space systematically. If we can identify the model parameters that enable the Edge organization to operate so quickly and inexpensively (e.g., matrix strength), for instance, and combine them with the parameters that enable the Machine Bureaucracy to reduce risk (e.g., centralization), as another instance, and combine them in turn with those enabling the Adhocracy to withstand environmental change (e.g., concurrency), as a third instance, then we might be able to design a “new,” hybrid, organizational form that outperforms the Edge, Machine Bureaucracy and Adhocracy alike.
Moreover, if we can identify the model parameters that enable the Simple Structure to keep risk below that of the Machine Bureaucracy (e.g., formalization), that enable the Professional Bureaucracy to operate so quickly in predictable environments such as the Industrial Era (e.g., application experience), and that enable the Divisionalized Form to keep rework down in predictable environments (e.g., hierarchy)—that is, drawing the best from each organizational form—then we would establish the capability to design an organization that is tailored specifically to a particular environment. Further, if we can identify the model parameters that make each of the various organizational forms more or less effective in terms of responses to manipulations

20
such as enhanced network architecture and increased professional competency, then we would establish the capability to design an organization that is tailored specifically to a particular manipulation.
Leveraging recent advances in computational organization theory, we extend our campaign of experimentation to specify six, diverse, archetypal organizational forms from theory, and evaluate their comparative performance empirically. Results confirm that no single organizational form is “best” for all circumstances. For instance, results from the Industrial Era reveal that the Edge form is the fastest in terms of time, and is one of the least expensive forms, reflecting zero decision wait time, but it reflects the highest risk level of all forms. Which one is “better” depends upon stakeholder performance preferences. The case is similar in terms of 21st Century performance, as well as that across the various experimental manipulations. Results also highlight contingent circumstances for which the Edge and other kinds of organizations perform relatively better than one another. For instance, the Machine Bureaucracy performs relative well in the Industrial Era context—as do the Simple Structure, Professional Bureaucracy and Divisionalized Form—but each of these forms struggles considerably in the 21st Century environment. Results further elucidate specific performance measures that provide multidimensional insight into different aspects of organizational performance. For instance, the leader or policy maker who is concerned most about speed and cost would tend to favor the Edge organization design, whereas his or her counterpart who is concerned most with risk would shy away from this form, endorsing more traditional designs such as the Machine Bureaucracy and Divisionalized Form. Indeed, risk aversion as such would tend, quite generally, to limit many people’s willingness to endorse the Edge form. This represents a challenging question of organizational change: given the relative advantages and disadvantages associated with the Edge design, how can the leader and policy maker transform existing, hierarchical organizations in a prudent manner that effects change toward flatter, edge-like organizations? We reserve this question for future research.
The research described in this article provides several contributions. For instance, it grounds the Edge organization firmly in well-established organization theory, and it provides empirical support for and against claims regarding this novel organizational form, particularly in terms of agility. Additionally, through organizational modeling and analysis, we articulate an organization design space for the first time, and as noted above, we illustrate how such design space could be used to inform researcher and practitioner alike. As another instance, we demonstrate the power and potential of computational experimentation as a complementary research method, and we illustrate how this method can be used for empirical comparison of different organization designs—even those that do not exist in practice yet—as virtual prototypes. This offers potential to change the manner in which military, government, commercial, non-profit, and other kinds of organizations are designed to perform well across a diversity of mission-environmental contexts in the future, and it offers an exciting thrust of continued research along the lines of this investigation.
REFERENCES Alberts, D.S. and Hayes, R.E., 2003. Power to the Edge CCRP. Burton, R.M., J. Lauridsen, B. Obel. 2002. Return on Assets Loss from Situational and
Contingency Misfits. Management Science 48(11) 1461-1485.
Burton, R., B. Obel. 1995. The Validity of Computational Models in Organization Science: From Model Realism to Purpose of the Model. Comp. and Math. Org. Theory 1(1) 57-71.
Carley, K.M., Z. Lin. 1997. A Theoretical Study of Organizational Performance under Information Distortion. Management Science 43(7) 976-997.
Carley, K.M., M.J. Prietula . 1994. Computational Organization Theory, Hillsdale, NJ, Lawrence Erlbaum Associates.

21
Carley, K., V. Hill . 2001. Structural Change and Learning Within Organizations. In: Lomi, A. and Larsen, E.R., (Eds.) Dynamics of Organizational Computational Modeling and Organization Theories, Cambridge, MA, The MIT Press.
Christiansen, T.R. 1993. Modeling Efficiency and Effectiveness of Coordination in Engineering Design Teams. Unpublished Ph.D Dissertation. Stanford University.
Cohen, G.P. 1992. The Virtual Design Team: An Information Processing Model of Design Team Management. Unpublished Ph.D Dissertation. Stanford University.
Cohen, K.J., R.M. Cyert . 1965. Simulation of Organizational Behavior. In: March, J.G., (Ed.) Handbook of Organizations, Rand McNally.
Galbraith, J.R. 1977. Organizational Design, Addison-Wesley.
Jin, Y., R.E. Levitt. 1996. The Virtual Design Team: A Computational Model of Project Organizations. Journal of Computational and Mathematical Organizational Theory 2(3) 171-195.
Kunz, J.C., R.E. Levitt, Jin Y. 1999. The Virtual Design Team: A computational model of project organizations. Communications of the Association for Comp. Machinery 41(11) 84-92.
Law, A.M., D. Kelton . 1991. Simulation Modeling and Analysis 2nd Ed., New York, NY, McGraw-Hill.
Lawrence, P.R., and Lorsch, J.W. 1967. Differentiation and Integration in Complex Organizations. Administrative Science Quarterly, 12, 1-47.
Levitt, R.E., J. Thomsen, T.R. Christiansen, J.C. Kunz, Y. Jin, C. Nass. 1999. Simulating Project Work Processes and Organizations: Toward a Micro-Contingency Theory of Organizational Design. Management Science 45(11):1479-1495.
Levitt, R.E. 2004. Computational Modeling of Organizations Comes of Age. Journal of Compuational and Mathematical Organization Theory 10(2) 127-145.
Levitt, R.E., R.J. Orr, M. Nissen. 2005. Validating the Virtual Design Team (VDT) Computational Modeling Environment. The Collaboratory for Research on Global Projects, Working Paper #25, 1-15. Available at: http://crgp.stanford.edu/publications/working_papers/WP25.pdf
Lomi, A., E.R. Larsen. 2001. Dynamics of Organizations: Computational Modeling and Organization Theories, Menlo Park, CA, American Association of Artificial Intelligence.
March, J.G., H.A. Simon 1958. Organizations, New York: Wiley.
Mintzberg, H., The Structuring of Organizations Englewood Cliffs, NJ: Prentice-Hall (1979).
Mintzberg, Henry. 1980. Structure in 5's" A synthesis of the Research on Organization Design. Management Science. Mar; 26(3):322-341.
NAACSOS. 2007. North American Computational Social and Organization Sciences, website http://www.casos.cs.cmu.edu/naacsos/, accessed 13 March 2007.
Nissen, M.E., R.E. Levitt. 2004. Agent-Based Modeling of Knowledge Dynamics. Knowledge Management Research & Practice 2(3) 169-183.

22
Nissen, M.E. and Buettner, R.R., 2004. “Computational Experimentation with the Virtual Design Team: Bridging the Chasm between Laboratory and Field Research in C2,” Proceedings Command and Control Research and Technology Symposium, San Diego, CA, June 2004.
Nissen, M.E. 2005a. Hypothesis Testing of Edge Organizations: Specifying Computational C2 Models for Experimentation. Proceedings International Command & Control Research Symposium. McLean, VA.
Nissen, M.E., 2005b. “A Computational Approach to Diagnosing Misfits, Inducing Requirements, and Delineating Transformations for Edge Organizations,” Proceedings International Command and Control Research and Technology Symposium, McLean, VA , June 2005.
Orr, R.J. and Nissen, M.E., “Computational Experimentation on C2 Models,” Proceedings International Command and Control Research and Technology Symposium, Cambridge, UK (September 2006).
Scott, W.R., Institutions and Organizations (Second Edition) Thousand Oaks, CA: Sage (2001). SV online help. SimVision 3.11 Online User’s Guide (accessed January 2007). Thompson, J.D. 1967. Organizations in Action, New York, McGraw-Hill.
Thomsen, J. 1998. The Virtual Team Alliance (VTA): Modeling the Effects of Goal Incongruency in Semi-Routine, Fast-Paced Project Organizations. Stanford Univ.
23
APPENDIX A – MODEL PARAMETER SETTINGS For reference, we include Table 2 from above here, and relabel it Table 7. An obvious critique of any article which relies heavily upon computational modeling is that the results are only as good as the model. We have, therefore, spent a great deal of time specifically addressing the manipulations of the simulation parameters. Definitions of the parameters, themselves, follow in Appendix C. Here, we attempt to move past the definitions and to the underlying organizational features that are addressed by and reflected in these settings.
Table 7 Model Formulation – Organization Forms
Structural Factor
Mintzberg Design
Parameter
Model Parameter Edge Machine
BureacracySimple
StructureProf.
BureacracyDivisional
Form Adhocracy
Decentralization Centralization Low High High Low Medium LowFormalization of
behavior Formalization Low High Low Low High Low
Vertical specialization Hierarchy Set-Up 1-level 3-level 2-level 2-level 4-level 1-level
" Operating Core Role ST ST ST ST ST ST" Holding Company (PM) 0 0 0 0 3 0" Command Position (PM) 0 3 3 3 3 0" Coordination Position (SL) 0 200 0 0 225 0" Operations Position (ST) 13,000 13,000 13,000 13,000 13,000 13,000
Size # of Total FTEs 13,000 13,203 13,003 13,003 13,231 13,000Unit Size # of FTEs per Unit 813 1650 2601 765 778 813
N/A # of Units 16 8 5 17 17 16Training Skill Level Med Med Med Med Med Med
Indoctrination App. Experience1,2 Med High Med High High LowTeam experience Med Low Low Med Low Low
Liaison Devices Communication Links Many Few Some Many Few Many" Information Exchange1 0.9 0.1 0.1 0.3 0.1 0.9
Planning & Control Systems
Meetings No Meetings2 hrs/day
(staff)42 hrs/week(10% ops)5
2 hrs/month(10% ops)5
2 hrs/day (staff)4,
2 hrs/week (top mgmt)
No Meetings
" Matrix Strength High Low Low Med. Low HighApp. Experience3 Add 1 level Subt 1 level Same level Same level Subt 1 level Same level
N/A6 Number of Operational Tasks 16 4 4 16 4 16
" Degree of ConcurrencyMassive
ConcurrencySequential,
2 PhaseSequential,
2 PhaseMassive
ConcurrencySequential,
2 PhaseMassive
Concurrency" Interdependence High Low Low High Low High" Rework Links Many Some Some Many Some Many" Rework Strength 0.1 0.3 0.3 0.1 0.3 0.1
Environment - Complxity FEP/PEP 0.2 0.1 0.1 0.2 0.1 0.2
1 This parameter has two aspects: indoctrination and planning & control systems.2 The indoctrination aspect of this parameter reflects the organization's familiarity with its environment.3 The planning & control systems aspect of this parameter reflects the organization's information processing environment; adjustment wrt indoctrination value.4 These meetings are between the Commander and Staff members.5 These meetings are between the Leader(s) and 10% of Operational Core members.6 Mintzberg does not explicitly address "work structure" in his paper.
Organization Structure
Communication Structure
Work Structure
Centralization and Formalization: We treat these two manipulations together, because they are easy to understand together, and because many organizational forms tend to use them in combination. Centralization is considered High in both the Simple Structure and the Machine Bureaucracy due to the reservation of decision rights to high levels of the organization. The Divisional Form has its Centralization set to Medium to reflect the dominance of middle management in this form, per Mintzberg. Contrarily, the Edge, Professional Bureaucracy and Adhocracy all expect decision rights to remain at the lowest levels of the organization, and show a Low Centralization setting. While Centralization is concerned with the allocation of decision rights, Formalization deals with the formalization of job descriptions and means of communications within an organization. Both the Machine Bureaucracy and Divisional Form are set to High Formalization to reflect the highly defined jobs and structured communications patterns exhibited by these forms. Most jobs have formal, written descriptions and standards, and most communication occurs along prescribed lines, during formal meetings and with structured documents. In the remaining forms,

24
the low Formalization is meant to reflect less formal job descriptions and less constrained communications patterns. Size and Shape: Because the SimVision simulation is sensitive to the number of full-time equivalents assigned to tasks, we have controlled for organization size, setting the number of operations positions to 13,000 for all six forms. The Edge and Adhocracy add no other positions to this number, as they reflect purely flat organizational forms. The Simple Structure and Professional Bureaucracies add only 3 FTEs in command positions to reflect the existence of senior positions responsible for the decisions of those organizations. There are, however, no middle managers. The Machine Bureaucracy and Divisional Form add coordination positions representing precisely those middle managers. The Divisional Form goes further and adds 3 FTEs in a “Holding Company.” This fourth level of the organization is intended to simulate the increased vertical specialization in an organization that has adopted a divisional form—nominally a number of smaller Machine Bureaucracies organized by function. Skills and Experience: All six forms have their skill level set to medium as a baseline, but the application and team experience of each organization differs. We do not expect the Adhocracy to have any specific experience with the task it faces, and, as an ad-hoc organization, one would not expect for team members to have much experience working together either. As such, both experience levels are set to Low. The Edge organization, while sharing much in common with the Adhocracy, is expected to have a Medium level of experience, both with the task at hand and with each other. The Machine Bureaucracy and Divisional Form have High task experience, but Low team experience to reflect the task specialization, but high turnover endemic in these organizational forms. The Simple structure, like the previous two forms, expects low team experience among members, but unlike the previous two, lacks the amount of task specialization required to garner a High Application Experience, thus it is rated at Medium. The Professional Bureaucracy earns a High Application Experience, as the members of such an organization, due to their professionalization, bring with them a High Task Experience. Similarly, such organizations tend to be reasonably stable and develop a Medium level of Team Experience. Communications: The Edge, Adhocracy and Professional Bureaucracy are expected to have reasonably unconstrained communications and, hence, Many communications links within the organization. The Divisional Form and Machine Bureaucracy, for comparison, have Few links, representative of communications constrained to supervisory links (the chain of command). Somewhere between these, we find the Professional Bureaucracy, with Some links. This represents the relative freedom of communication between members, while partially constrained by the bureaucratic structure. The information exchange parameter represents a percentage likelihood that communication will occur between two actors. In the Edge and Adhocracy, we set this to 0.9 to reflect the expected propensity for such organizations to communicate. Analogously, the remaining forms are set to seemingly reasonable settings. We expect the Simple, Divisional and Machine Bureaucracy forms to experience much lower information exchange rates, with the Professional Bureaucracy somewhere between, but weighted more toward the other bureaucracies. Meetings were set to representative numbers as well. The Edge and Adhocracy have no formal meetings, since all members are expected to be continually communicating when required. All four other forms exhibit some meeting frequency. All meetings are considered to be two hours long. For the Divisional Form and Machine Bureaucracy, this takes the form of daily staff meetings (and weekly top management meeting for the Divisional Form). In the Simple Structure and Professional Bureaucracy, these meetings involve 10% of the operators, as there is no staff to meet, and occur weekly and monthly respectively. Matrix strength is intended to be reflective of the amount of cross-functional management in an organization. As the Divisional Form, Machine Bureaucracy and Simple Structure are all primarily organized by function, with little cross-functional coordination by the workers, they are rated as Low. The Edge and Adhocracy, of course, are rated as High to reflect the completely
25
cross-functional aspect of these organizations. The Professional Bureaucracy, in order to reflect a moderate amount of such matrix organization is rated as Medium. Tasks and Concurrency: While all six organizations are, by design, attempting to complete the same tasks, there are characteristic means by which they choose to divide such tasks. The Edge, Adhocracy and Professional Bureaucracy separate the tasks into a large number of subtasks, and exhibit a high degree of concurrency in the performance of such tasks, in addition to a large number of rework links and High task interdependence. With a smaller number of available groups, the other forms tend to organize the tasks by functions and to assign such tasks along functional lines. This attempts to illustrate the difference between the reciprocal interdependence of the Edge, Adhocracy and Professional Bureaucracy and the sequential interdependence of the other three forms (Thompson, 1967). The Simple Structure, Machine Bureaucracy and Divisional form, by utilizing scheduling and task specialization, have reduced the amount of interdependence between tasks and, consequently, the amount of rework crossing such task boundaries. This insulation comes at a price. While the task interdependence may be low, errors that do cause rework tend to be significant, resulting in three times the rework strength of the reciprocal forms. This value of 0.3 means that when a rework link is activated, each day of rework in the original task results in 0.3 days of rework in the dependent task.
Environmental Complexity: According to Thompson, organizations seek to insulate the operating core from the uncertainty of the environment. This is modeled via the Environmental Complexity variable. The Edge, Adhocracy and Professional Bureaucracies lack such insulation, as the individual organization members are responsible for responding to such environmental changes. Consequently, we have given them a higher Environmental Complexity setting to reflect the fact that even working on the same task, the operating core in these forms face a less certain task environment. The specific parameters FEP and PEP stand for functional error probability and project error probability, respectively, and address two aspects of environmental difficulty: the former characterizes the likelihood of organizations making errors and causing exceptions at the functional level (esp. within the Operating Core); the latter characterizes the likelihood of organizations making errors and causing exceptions across functions (esp. within the Middle Line). Hence the Edge, Adhocracy and Professional Bureaucracy, largely due to their massive task concurrency and reciprocal interdependence, are expected to make more errors than the other organizational forms are.

26
APPENDIX B – MODEL PARAMETER MANIPULATIONS For reference, we include Table 3 from above here, and relabel it Table 8. Following the format of Appendix A, here we address the Model Manipulations that relate to the experiment design described above. Table 8 Model Manipulations – Industrial Era and21st Century Conditions
Manipulation Model Parameter Industrial Era Value
21st Century Value
Soln. Complexity Med. HighRequirement Complexity Med. High
Uncertainty Med. High
FEP Baseline in Table 2
Baseline + 0.1
PEP Baseline in Table 2
Baseline + 0.1
App. Experience Baseline in Table 2
Baseline - one leveld
Noise 0.3a 0.01
Info. Exchange Prob. Baseline in Table 2
Baseline + 0.3b
Communication links Baseline
Baseline for Edge;
more for Hierarchye
Organization settingsc
Baseline for Hierarchy;
opposite for Edge
Baseline for Edge;
opposite for Hierarchy
App. Experience Baseline in Table 2
Baseline in Table 2
Skill Level Baseline in Table 2
Baseline + one level
Team Experience Baseline in Table 2
Baseline + one level
All of the above All of the above All of the above
Mission & Environmental Context (P1, 5)
Aggregate (P1 - 6)
Network Architecture (P2, 3)
Professional Competency (P2, 4)
Complexity and Uncertainty: Following from Thompson (1967), we consider two separate variables related to the work being undertaken by the organization. We consider the industrial era as a baseline case. As suggested by the names, requirement complexity and solution complexity address two aspects of environmental complexity: the former characterizes complexity in terms of understanding what organizational responses are required (e.g., complex product marketing and design spaces); the latter characterizes complexity in terms of providing the required responses (e.g., complex marketing campaigns and products). These parameters are set to nominal levels (i.e., Medium) in the Industrial Era baseline. Uncertainty captures relative predictability of the environment. This parameter is set likewise to a nominal level in the baseline case. The 21st Century era is marked by significantly more complex military tasks. The number and kind of adversaries are significantly increased, and the mission itself tends to no longer be simply the destruction of the adversarial forces, but includes a wide range of MOOTW (Military Operations Other Than War). As such, the task Complexities are set to High. This wide range of operations also brings with it a higher degree of uncertainty, as we often do not know even which information to seek. Decisions often must be made with incomplete or missing information.
27
Errors: Due, in part, to the increased complexity and uncertainty, we estimate the number of exceptions to also increase from the Industrial Era to the 21st Century. It is more likely that some exigency of the situation will require rework in the 21st Century. Given the Industrial Era context, small changes in, for instance enemy order of battle, are less likely to directly affect plans or tasks in motion than the same kind of change in a 21st Century conflict. The 0.1 difference represents a 10% increase in these kinds of errors. Experience: In the Industrial Era, it could be expected that the military organization was very experienced in doing its job. Senior officers had spent entire careers working in their specialties, and the newest recruits received training specific to the application they faced. The 21st Century offers no such sureties. In fact, it is common for the senior officer in charge of a mission to have no previous experience in that mission area. We do not have a cadre of senior officers who have spent their careers in peacekeeping operations or humanitarian relief (although their numbers are ever-increasing), for instance. We, similarly, are unable to train all our junior members for every potential situation they might encounter. As such, we downgrade the application experience in the 21st Century context. Noise: This manipulation attempts to represent the fact that networked communications enable more reliable and efficient communication. In the Industrial Era, we retain a baseline setting for noise. As the SimVision model is calibrated to extant contingency research, such a baseline setting should reflect the usual state of the world when those cases were studied. To replicate a 21st Century networked architecture, the Noise is reduced to .01, reflecting an admittedly optimistic view that this architecture provides less unwanted communications and unneeded information. Information Exchange: Similarly, we contend that the Networked Architecture will result in an increased propensity to share information. This is, giving people an avenue for easily exchanging information will result in that exchange—at least an increase of 30% (as modeled). Due to the limitations of the model, however, the Edge and Adhocracies could only be increased by 10% (to 100%). Communication Links and Organization Settings: Adapting these settings proved tricky, as we strove to maintain the central features of each archetype even while manipulating them for this context. Is a hierarchy still a hierarchy if we allow significant and arbitrary communications within the organization? We settled, finally, on merely shifting these settings en masse in the appropriate direction for this context. In the 21st Century Context, the number of communications links is increased for the three hierarchical organizational forms (Simple Structure, Machine Bureaucracy and Divisional Form). While this does somewhat reduce the amount of hierarchy inherent in the organizations, it simulates the resultant increase in communications enabled by the introduction of a Network Architecture. The organization settings for Centralization, Formalization and Matrix Strength were also manipulated in this context. In the Industrial Era, without a Network Architecture, we argue that the more Edge-like organizations (Adhocracy, Edge and Professional Bureaucracy) will necessarily tend toward greater Centralization, more Formalization and decreased Matrix Strength as they will lack the communications paths requisite for doing otherwise. At the same time, the Hierarchical organizations in the 21st Century context will be drawn to adopt more matrixed, decentralized and informal organizations simply as a result of the increased communications. For this computation, then, we modified the Edge-like organizations toward Hierarchy in the Industrial Era and the hierarchical organizations toward the Edge in the 21st Century. Skill Level and Team Experience: These manipulations reflect the increased professional competency in the 21st Century context. As opposed to the Industrial Era, teamwork and individual proficiency are each increased by one level. While there is no adjustment for Application Experience—a shift to the 21st Century doesn’t result in automatically receiving a

28
specific background in the application—individual training (as indicated by Skill Level) results in somewhat more proficient actors. Also, the emphasis on teamwork for all members results in an increased team experience level. Actors are significantly experienced in working with and on teams even if they are new to one particular team.

29
APPENDIX C – MODEL PARAMETER DEFINITIONS In this appendix, we both paraphrase and quote from (SV online help, 2007) to include definitions of the model elements and parameters that are discussed above and applicable to the computational experimentation reported in this study. Activity - See Task. Actor - See Position. Application experience - A measure of how familiar the position or person is with similar projects. Behavior file - A file that specifies the simulator's default behavior, such as how much rework to add to tasks with exceptions. Centralization - A measure of how centralized the decision - making is in a project. For example, high centralization indicates that most decisions are made and exceptions handled by top managerial positions such as the Project Manager. Low centralization means decisions are made by individual responsible positions. Communication - The passing of information between positions about tasks. Communications link - A dashed green link that links two tasks, indicating that the position responsible for the first task must communicate with the other position during or at the completion of the first task. Coordination - A combination of the information exchange generated by communication and meetings. Coordination Volume - The predicted time during a project or program that all positions spend at meetings and processing information requests from other positions. Critical path - The set of tasks in a project that determine the total project duration. Lengthening any of the tasks on the critical path lengthens the project duration. Decision wait time - The time a position waits for a response from the supervisor about how to handle an exception, plus any time the position waits for exception resolution before making the decision by default. See also Wait Volume. Exception - A situation detected by the simulator where part of a task requires additional information or a decision, or generates an error that may need correcting. Exception handling - Involves positions reporting exceptions to supervisors and supervisors making decisions on how to deal with the exceptions. Failure dependency link - See Rework link. Formalization - A measure of the formality of communication in an organization. For example, high formalization indicates that most communication occurs in formal meetings. FRI (Functional Risk Index) - A measure of the likelihood that components produced by a project have defects. Also called CQI, or Component Quality Index. Full - time equivalent (FTE) - A measure of position or person availability to perform a task. For example, a position with an FTE value of 3 has the equivalent of 3 full - time employees to perform tasks. Functional exception - An error that causes rework in a task but does not affect any dependent tasks. Links - A set of color - coded arrows that represent the relationships between shapes. Matrix Strength - A measure of the level of supervision in a project or program, and a reflection of the structure of the organization. Low matrix strength means that positions are located in skill-based functional departments and supervised directly by functional managers. High matrix strength means positions are co-located with other skill specialists in dedicated project teams and have project supervision from a Project Manager. Meeting - A gathering of positions to communicate about the project and project tasks. Meeting Participant link - A dashed grey line that links a position to a meeting, indicating that the position must attend the meeting. Milestone - A point in a project or program where a major business objective is completed. Model - A visual representation of a program and its projects. Noise - The probability that a position is distracted from assigned tasks.
30
Organization - A group of departments that staff a program or project. Organization Assignment link - A solid pink line that links an organization to a project within a program. PM - Project Manager, the position that assumes overall responsibility for a project. Position - An abstract group representing one or more FTEs (full - time equivalents) that performs work and processes information. In a staffed project, positions represent a person or a group of persons. PRI (Project Risk Index) - A measure of the likelihood that components produced by a project will not be integrated at the end of the project, or that the integration will have defects. PRI is thus a measure of the success of system integration. Primary Assignment link - A solid blue line that links a position to a primary task, which is a task that takes priority over any secondary assignments. Program - A set of related projects that share dependencies and together achieve the client's business objectives. A program also includes the associated responsible organizations, milestones, and relationships between projects. Project - A project represents work an organization must perform to achieve a major business milestone. The work is represented by tasks, milestones, the positions that perform tasks, meetings, and the dependencies between all these elements. While a model may contain numerous projects, it need only contain one. Each project in a model supports the goal of the program to which the project belongs. Project exceptions - Errors that might cause rework in a driver task and all its dependent tasks. Project Exception Rate - The probability that a subtask will fail and generate rework for failure dependent tasks. This probability is generally in the range 0.01 (low) to 0.10 (significant, but common). If the Project Exception Rate is greater than about 0.20, so much rework can be generated that the project may never finish. Project Successor link - A solid black line that links a project to another project or to a project milestone. Rework - Redoing all or part of a task. Compare with direct work. Rework Cost - The predicted cost of rework, or rework volume weighted by average cost per FTE of positions that do rework. Rework link - A dashed red line that links a task to a dependent task that will need rework if the driver task fails. Rework Volume - The predicted time needed for all positions on a project to do the required rework. Scenario - See Case. Secondary Assignment link - A dashed blue line that links a position to a secondary task, which is a task that can be worked whenever the position is not working on a primary task. Simulator - Software that simulates the work done by positions as they perform individual project tasks, including both planned direct work and coordination and rework. Simulation charts - Charts that summarize and provide details of the simulated performance of the program and the individual modeled projects. Successor link - A solid black line that links milestones and tasks. Supervision link - A solid black line that links a supervisory position to its supervised position. Task - Any work that consumes time, can generate communications or exceptions, and is required for project completion. VFP (Verification Failure Probability) - The probability that an exception will be generated for a task. The VFP is calculated during simulation based on a number of factors, including noise, communication rates, and team experience. Wait Volume - A measure of the cumulative time spent by positions waiting for decisions to be made in a project. Work volume - The predicted time that all positions on a project spend doing direct work.