hyspiri tir science measurement baseline - nasa · 8/23/2010 · hyspiri tir science measurement...
TRANSCRIPT
HyspIRI
TIR Science Measurement Baseline
NASA Earth Science and Applications Decadal Survey
Simon J. Hook and HyspIRI Team
© 2010 California Institute of Technology. Jet Propulsion Laboratory, California Institute of Technology. Government sponsorship acknowledged.

NRC Decadal Survey HyspIRI Visible ShortWave InfraRed (VSWIR) Imaging Spectrometer
+ Multispectral Thermal InfraRed (TIR) Scanner
VSWIR: Plant Physiology andFunction Types (PPFT)
Multispectral TIR Scanner
Red tide algal bloom in Monterey Bay, CA
Map of dominant tree species, Bartlett Forest, NH

3
HyspIRI Thermal Infrared Multispectral (TIR) Science Measurements
Science Questions:TQ1. Volcanoes/Earthquakes (MA,FF)– How can we help predict and mitigate earthquake and volcanic hazards through
detection of transient thermal phenomena?• TQ2. Wildfires (LG,DR)– What is the impact of global biomass burning on the terrestrial biosphere and
atmosphere, and how is this impact changing over time?• TQ3. Water Use and Availability, (MA,RA)– How is consumptive use of global freshwater supplies responding to changes in climate
and demand, and what are the implications for sustainable management of water resources?
• TQ4. Urbanization/Human Health, (DQ,GG)– How does urbanization affect the local, regional and global environment? Can we
characterize this effect to help mitigate its impact on human health and welfare?• TQ5. Earth surface composition and change, (AP,JC)– What is the composition and temperature of the exposed surface of the Earth? How do
these factors change over time and affect land use and habitability?
Measurement:
• 7 bands between 7.5-12 µm and 1 band at 4 µm
• 60 m resolution, 5 days revisit
• Global land and shallow water
Volcanoes
Urbanization
Water Use and Availability
Surface Temperature Evapotranspiration
Andean volcano heats up
0
0.1
0.2
0.3
0.4
0.5
0.6
0.7
0.8
0.9
1
3.00 4.00 5.00 6.00 7.00 8.00 9.00 10.00 11.00 12.00 13.00Wavelength (um)
Rel
ativ
e Sp
ectr
al R
espo
nse
H1 (m21)H2 (m28)H3 (a10)H4 (a11)H5 (a12)H6H7H8 (m32)
Multispectral Scanner
Schedule: 4 year phase A-D, 3 years operations
High Heritage
TIR
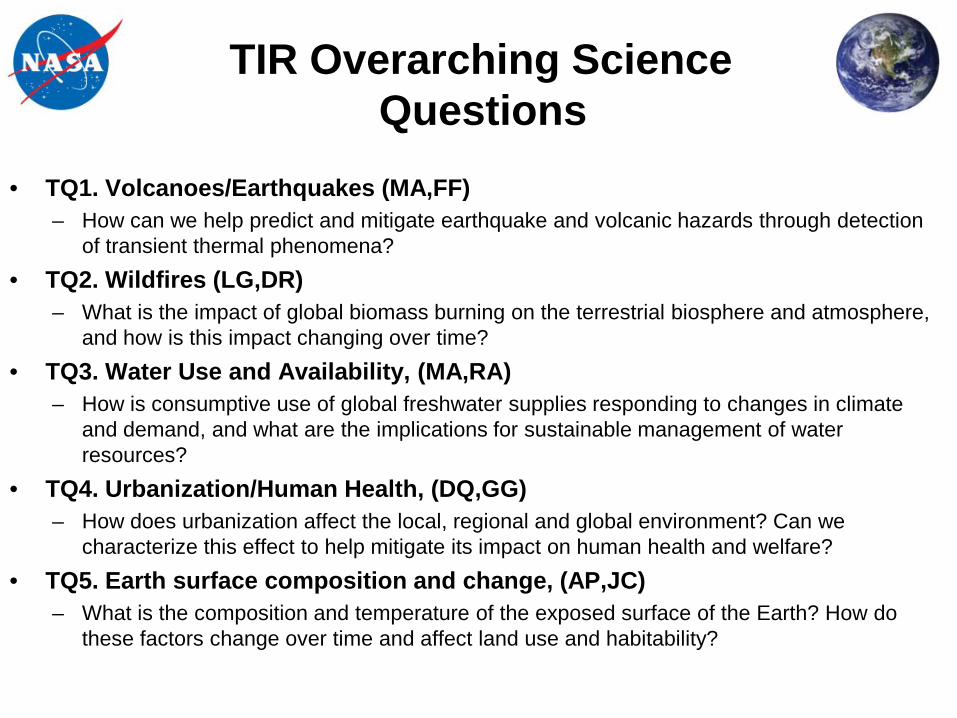
TIR Overarching Science Questions
• TQ1. Volcanoes/Earthquakes (MA,FF)– How can we help predict and mitigate earthquake and volcanic hazards through detection
of transient thermal phenomena?• TQ2. Wildfires (LG,DR)
– What is the impact of global biomass burning on the terrestrial biosphere and atmosphere, and how is this impact changing over time?
• TQ3. Water Use and Availability, (MA,RA)– How is consumptive use of global freshwater supplies responding to changes in climate
and demand, and what are the implications for sustainable management of water resources?
• TQ4. Urbanization/Human Health, (DQ,GG)– How does urbanization affect the local, regional and global environment? Can we
characterize this effect to help mitigate its impact on human health and welfare?• TQ5. Earth surface composition and change, (AP,JC)
– What is the composition and temperature of the exposed surface of the Earth? How do these factors change over time and affect land use and habitability?

Characterizing and Understanding Volcanic Eruptions
Gas and thermal anomalies, plume composition including SO2 and ash content on weekly basis
“Likewise, the Tier 2 Hyperspectral Infrared Imager (HyspIRI) mission would include measurements over a range of optical and infrared wavelengths useful for detecting volcanic eruptions, determining the ash content ofvolcanic plumes, and identifying the occurrence and effects of associated landslides.”
Source: Dr Jack Kaye, Presented to Subcommittee on Space and AeronauticsCommittee on Science and Technology United States House of Representatives,
May 5, 2010

EyjafjallajökullIceland Volcano
EruptionApril 19 2010 MODIS image of ash plume.
Characterizing and Understanding Volcanic Eruptions

Characterizing and Understanding Volcanic Eruptions

Global Characterization of Fire Emission Sources
Biomass burning and fossil fuel emissions release ~1015 g of carbon (C) to the atmosphere each year. Biomass burning constitutes ~36% of all global C emissions.
Van der Werf et al., 2004
Region Fire emissions1997-2001 average
(10^15g C yr-1)
Central and northern South America
0.27
Southern South America 0.80
Northern Africa 0.80
Southern Africa 1.02
Southeast Asia 0.37
Boreal (north of 38oN) 0.14
Other 0.13
Global 3.53
Carbon Release from Biomass Burning

Fire Radiative Energy
Wooster et al 2002 and 2003
Ellicott et al 2009
Use Fire Radiative Energy to estimate combusted biomass: Need 3-5 um data
90% probability of detection; boreal forest; nadir view
Carbon Release from Biomass Burning
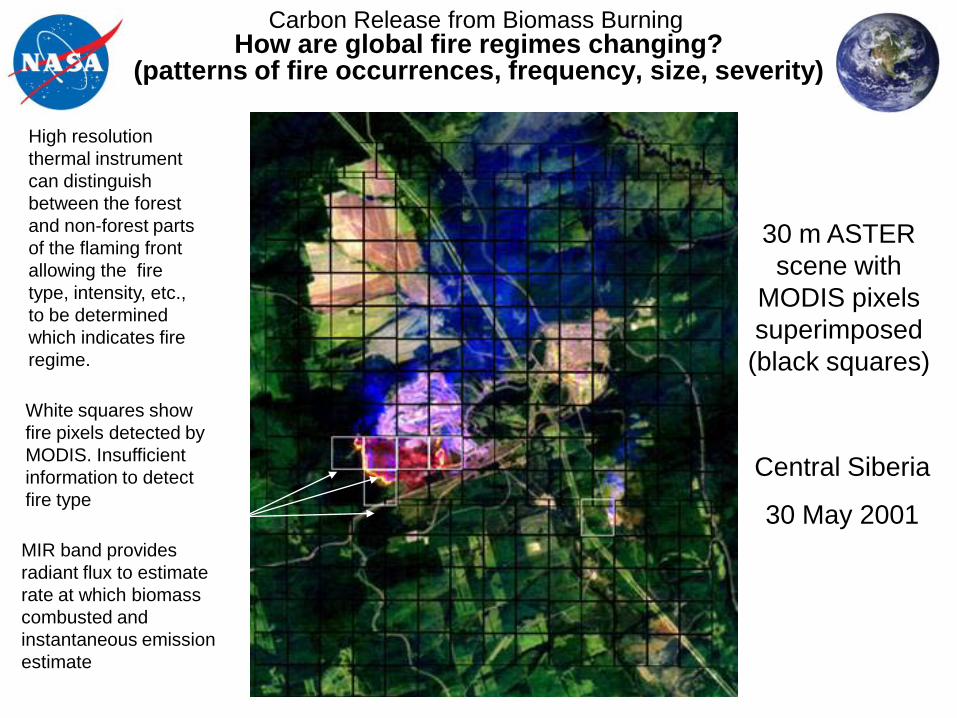
How are global fire regimes changing?(patterns of fire occurrences, frequency, size, severity)
Central Siberia
30 May 2001
30 m ASTER scene with
MODIS pixels superimposed (black squares)
High resolution thermal instrument can distinguish between the forest and non-forest parts of the flaming front allowing the fire type, intensity, etc., to be determined which indicates fire regime.
White squares show fire pixels detected by MODIS. Insufficient information to detect fire type
MIR band provides radiant flux to estimate rate at which biomass combusted and instantaneous emission estimate
Carbon Release from Biomass Burning

11
Science MeasurementsSummary Measurement Characteristics
SpectralBands (8) µm 3.98 µm, 7.35 µm, 8.28 µm, 8.63 µm, 9.07 µm, 10.53 µm, 11.33 µm, 12.05 Bandwidth 0.084 µm, 0.32 µm, 0.34 µm, 0.35 µm, 0.36 µm, 0.54 µm, 0.54 µm, 0.52 µmAccuracy <0.01 µm
RadiometricRange Bands 2-8= 200K – 500K; Band 1= 1400KResolution < 0.05 K, Linear Quantization to 14 bitsAccuracy < 0.5 K 3-sigma at 250KPrecision (NEdT) < 0.2KLinearity >99% characterized to 0.1 %
SpatialIFOV 60 mMTF >0.65 at FNyScan Type Push-WhiskSwath Width 600 km (±25.5° at 623 km altitude)Cross-Track Samples 10,000Swath Length 15.4 km (+/- 0.7-degrees at 623km altitude)Down-Track Samples 256
Band-to-Band Co-registraion 0.2 pixels (12 m)Pointing Knowledge 1.5 arcsec (0.1 pixels)

12
TemporalOrbit Crossing 10:30 am sun synchronous descendingGlobal Land Repeat 5 days at equator
OnOrbit CalibrationLunar View 1 per month {radiometric}Blackbody Views 1 per scan {radiometric}Deep Space Views 1 per scan {radiometric}Surface Cal Experiments 2 (d/n) every 5 days {radiometric}Spectral Surface Cal Experiments 1 per year
Data CollectionTime Coverage Day and NightLand Coverage Land surface above sea levelWater Coverage Coastal zone -50 m and shallowerOpen Ocean Averaged to 1km spatial samplingCompression 2:1 lossless
Science MeasurementsCharacteristics Continued

13
Mission ConceptOperational Scenario
• Following arrival at science orbit, the baseline data acquisition plan is established. Collect data for entire land surface excluding sea ice (Arctic and Antarctic) every 5 days at 60 m spatial resolution in 8 spectral bands
• Data are downlinked and transferred to the science data processing center where calibration and baseline processing algorithms are applied.
• Level 1, 2 products are delivered to the scientific community and general users to pursue the science questions– With appropriate cloud screening, compositing, spatial, and temporal subsetting
Land and coastal acquisition

Annual TIR imaging opportunities in a 5-day near-repeating orbit, 1 yr. simulation
Nominal orbit: average alt. 626.8 km, inclination 97.8°. TIR imager FOV: +/- 25.46° (60 m pixel GSD at nadir, 9272 cross-track pixels).
Oceans average to 1 km

TIR Instrument Concept
2/10/09 15
Spectral Bands
Scanning and Data Rate
• 60 m Pixel Footprint •Time-Averaged Science Data Rate 0.024 Gbps• Assuming 14 bits, 2:1 Compression• Scan Mirror Rotation Rate 13 RPM• Pixel Dwell Time 32 microseconds
Mass and Power (JPL Team X)•Mass CBE 60 kg•Power CBE 109 W
Direction ofSpacecraft
Motion
256 Pixels15 km±0.7°
9937 Pixels, 596 km, ±25.5°
Scan Mirror
Focal Plane8 Spectral Bands
x 256 Pixels

16
Mission Concept TIR Overview
• Duration: 4 years development, 3 years science
• Coverage: Global land every 5 days
• Day and Night imaging (1 day and night image at a given location obtained every 5 days)
• Data download using dual-polarization X-band at high-latitude stations
• Spacecraft: LEO RSDO bus (SA-200HP)
• Launch: Taurus-class launch vehicle

Summary
We have developed a sets of science questions that are well aligned with the HyspIRI Mission called for in the NASA Earth Science and Applications Decadal Survey. The mission has strong relevance to both climate and society.
We have reviewed and refined these questions that relate to both science and applications objectives and developed traceability to a set of science measurements.
We have established a high heritage and low risk approach for acquiring the HyspIRI VSWIR and TIR science measurements