i-275 & sr4 interchange operations study · i-275 & sr4 interchange operations study . 3 wb...
TRANSCRIPT
I-275 & SR4 INTERCHANGE OPERATIONS STUDY
1
Project Summary Location SR-4 and I-275 Interchange
Springdale, Ohio
Hamilton County
PID
Study Sponsor ODOT, District 8
Proposed Work This Interchange Operations Study examines the impact of the addition of a lane to the ramp from southbound SR-4 to I-275. Design plan sheets showing the proposed recommendation are included in Appendix E.

I-275 & SR4 INTERCHANGE OPERATIONS STUDY
2
Study Area
HCS Analysis Points:
Freeway Analysis:
WB I-275 East of SR-4 Exit Ramp
WB I-275 East of NB SR-4 Merge
WB I-275 West of NB SR-4 Merge
WB I-275 West of SB SR-4 Merge
EB I-275 West of SB SR-4 Merge
EB I-275 East of SB SR-4 Merge
Ramp Analysis:
WB I-275 Diverge to SR-4
WB I-275 Merge from NB SR-4

I-275 & SR4 INTERCHANGE OPERATIONS STUDY
3
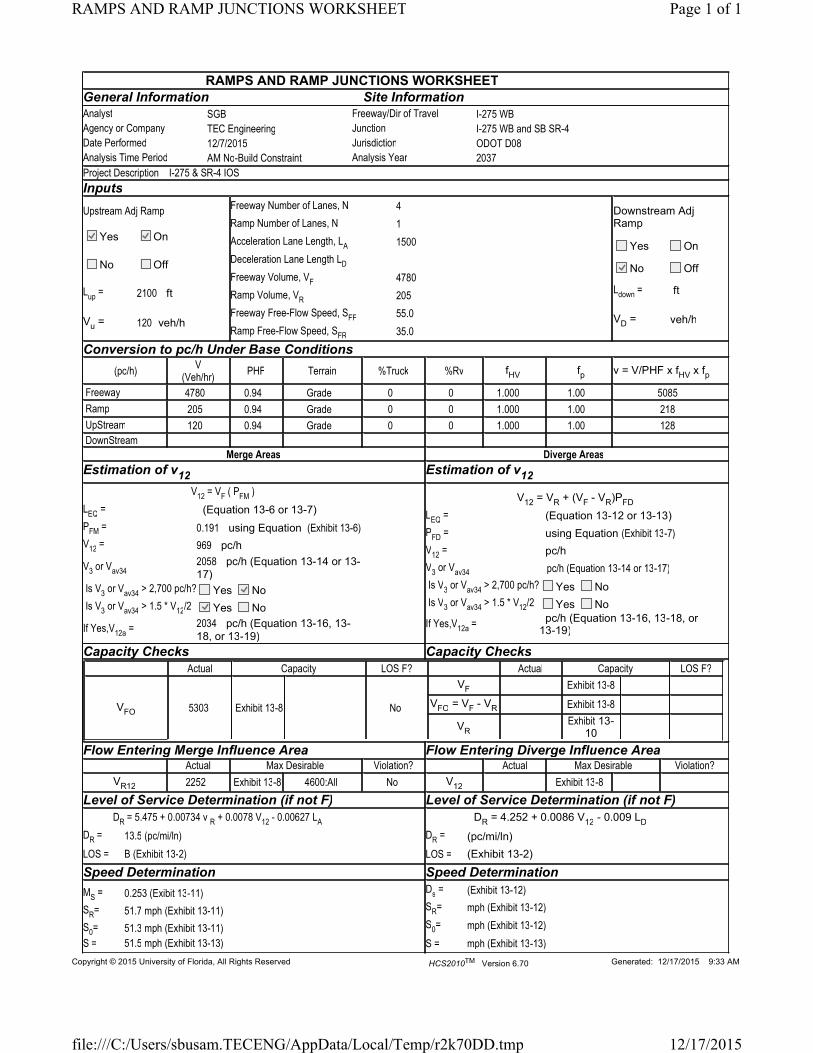
WB I-275 Merge from SB SR-4
EB I-275 Merge from SB SR-4
EB I-275 Merge from NB SR-4
Intersection Analysis:
EB I-275 Ramps with SR-4
WB I-275 Ramps with SR-4
SR-4 & Crescentville/Ray Norrish
Problem Description The SR-4 corridor is a principal arterial serving various residential and commercial areas within Butler County including the communities of Fairfield, Hamilton, and Fairfield Township. As part of that commuter corridor, the SR-4 & I-275 interchange serves as the primary access to this area. Continued increase in commercial and residential development along Crescentville Road and SR-4 north of I-275 has greatly increased traffic along SR-4 to and from north of I-275. This increase in traffic demand has caused the existing single lane ramp to be over capacity increasing congestion and causing excessive traffic queues due to lane utilization at SR-4 and Crescentville. The addition of a second lane to the exit ramp would allow for a thru/right lane on SB SR-4, provide a separate lane for EB and WB I-275 traffic, and therefore allow for better lane utilization on SR-4 at Crescentville, reducing congestion and queues. Design plan sheets for the proposed recommendations have been included in Appendix E.
Traffic Analysis Posted Speed Limits (of Roadways within the Study Area):
Mainline, I-275 – 65 mph
Crossroad, SR-4 – 40 mph Adjacent Intersection, Crescentville - 45 mph, Ray Norrish – 25 mph
The intersection analysis at SR-4 and Crescentville took into account the existing lane utilization
for southbound SR-4. Currently the majority of thru/right traffic utilizes the curb lane at
Crescentville as this is the only lane which accesses I-275. Under the build conditions the lane
utilization was re-adjusted to account for the access to the I-275 EB ramp from the center thru
lane. Additionally, the analysis at SR-4 and Crescentville resulted in v/c ratios of greater than
1.0 for some movements contributing to the I-275 ramp traffic. As such, constraint analysis was
performed. The reduced traffic volumes were spread through all affected movements within
the system proportionally.

I-275 & SR4 INTERCHANGE OPERATIONS STUDY
4
Freeway Analysis Results:
I-275 WB Mainline
2037 AM No-Build Geometry
2037 AM Build Geometry
2037 PM No-Build Geometry
2037 PM Build Geometry
LOS Density
(pc/mi/ln) LOS Density
(pc/mi/ln) LOS Density
(pc/mi/ln) LOS Density
(pc/mi/ln)
WB I-275 E of SR-4 Diverge
C 21.4 C 21.4 C 23.8 C 23.8
WB-275 W of SR-4 Diverge
C 18.2 C 18.2 C 20.9 C 20.9
WB I-275 W of NB SR-4 Merge
C 18.6 C 18.6 C 22.2 C 22.2
WB I-275 W of SB SR-4 Merge
C 20.5 C 20.5 D 27.1 D 27.1
I-275 EB Mainline
2037 AM No-Build Geometry
2037 AM Build Geometry
2037 PM No-Build Geometry
2037 PM Build Geometry
LOS Density
(pc/mi/ln) LOS Density
(pc/mi/ln) LOS Density
(pc/mi/ln) LOS Density
(pc/mi/ln)
EB I-275 W of SB SR-4 Merge
C 19.5 C 19.5 C 24.7 C 24.7
EB I-275 E of SB SR-4 Merge
C 24.9 C 25.0 D 29.8 D 30.0
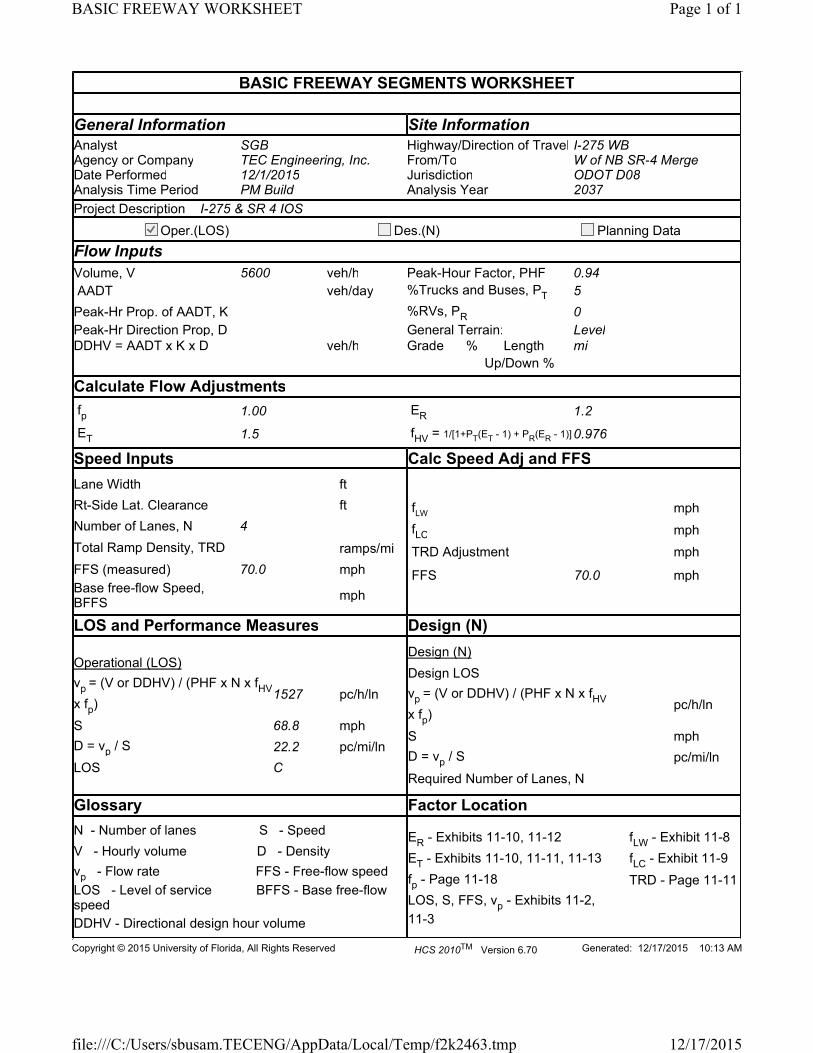
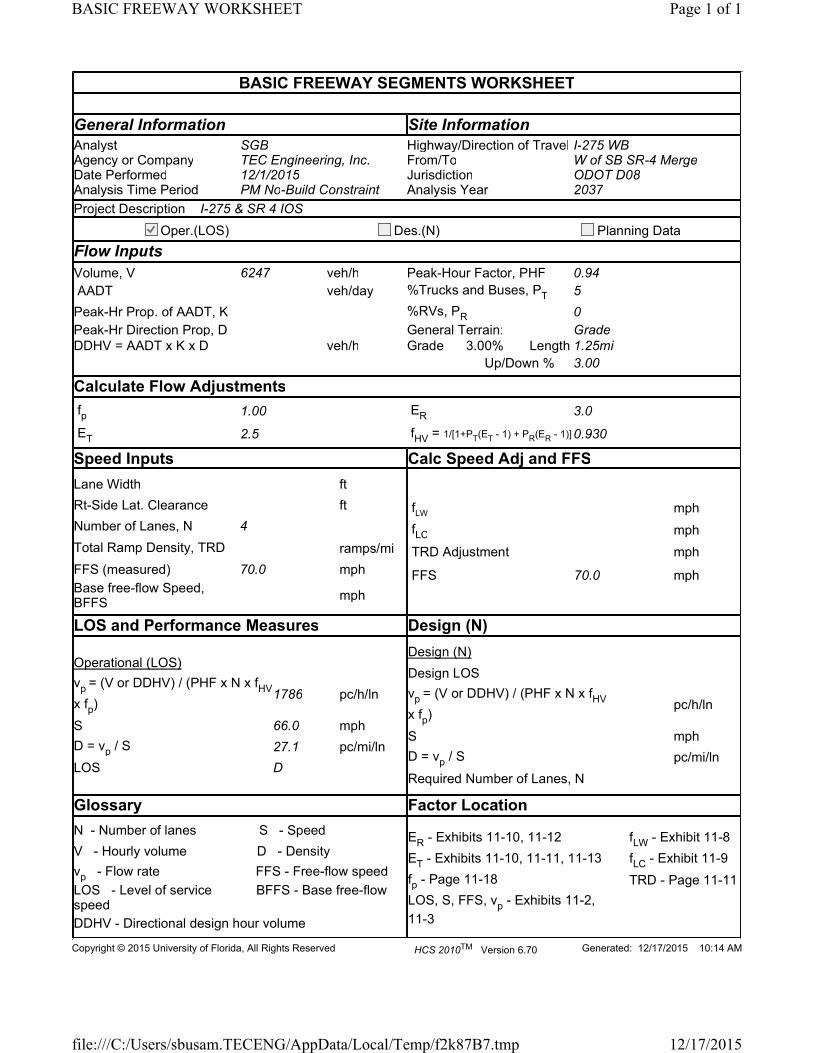
The proposed geometric modifications do not degrade the operations on the freeway mainline when comparing the no build and build conditions. Ramp Analysis Results:
I-275 WB Ramps
2037 AM No-Build Geometry
2037 AM Build Geometry
2037 PM No-Build Geometry
2037 PM Build Geometry
LOS Density
(pc/mi/ln) LOS Density
(pc/mi/ln) LOS Density
(pc/mi/ln) LOS Density
(pc/mi/ln)
NB SR-4 Merge B 12.5 B 12.5 B 16.0 B 16.0
SB SR-4 Merge B 13.5 B 13.6 B 19.7 B 19.8
I-275 EB Ramps
2037 AM No-Build Geometry
2037 AM Build Geometry
2037 PM No-Build Geometry
2037 PM Build Geometry
LOS Density
(pc/mi/ln) LOS Density
(pc/mi/ln) LOS Density
(pc/mi/ln) LOS Density
(pc/mi/ln)
NB SR-4 Merge B 15.2 B 15.2 B 16.0 B 16.1
The westbound I-275 to SR-4 ramp is not analyzed as a diverge section. The existing configuration of the interchange from westbound I-275 ramp to SR- 4 includes an exit only lane,
I-275 & SR4 INTERCHANGE OPERATIONS STUDY
5
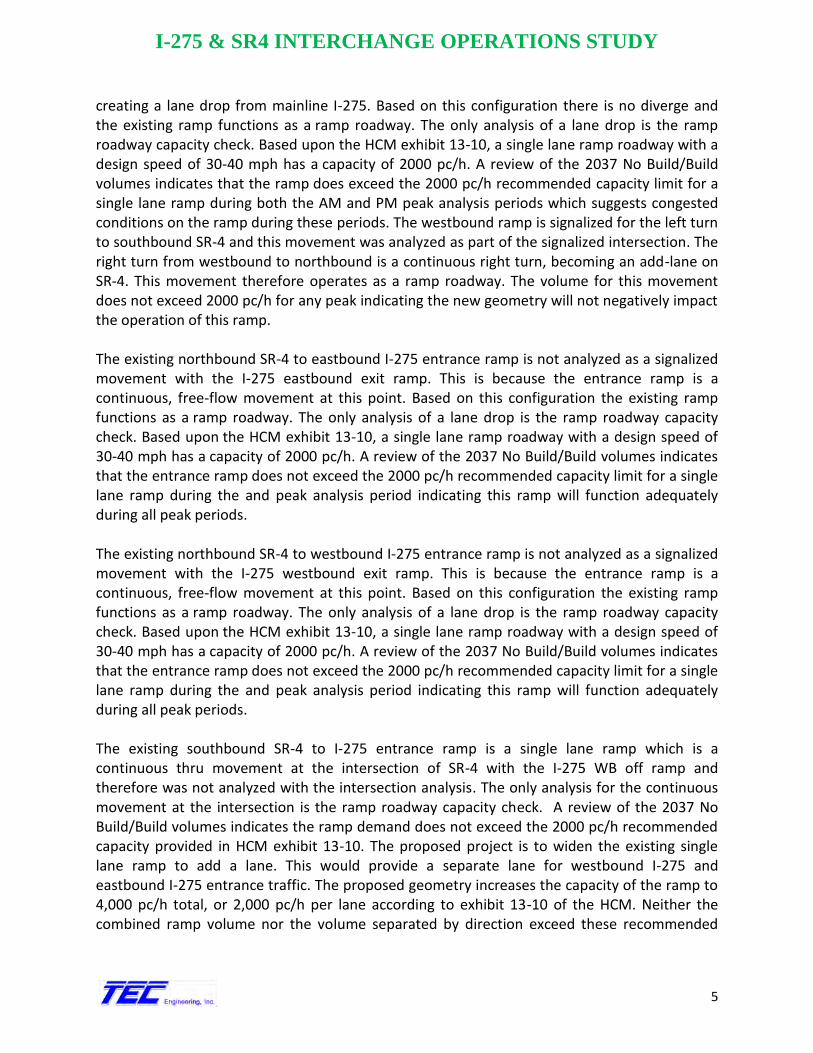
creating a lane drop from mainline I-275. Based on this configuration there is no diverge and the existing ramp functions as a ramp roadway. The only analysis of a lane drop is the ramp roadway capacity check. Based upon the HCM exhibit 13-10, a single lane ramp roadway with a design speed of 30-40 mph has a capacity of 2000 pc/h. A review of the 2037 No Build/Build volumes indicates that the ramp does exceed the 2000 pc/h recommended capacity limit for a single lane ramp during both the AM and PM peak analysis periods which suggests congested conditions on the ramp during these periods. The westbound ramp is signalized for the left turn to southbound SR-4 and this movement was analyzed as part of the signalized intersection. The right turn from westbound to northbound is a continuous right turn, becoming an add-lane on SR-4. This movement therefore operates as a ramp roadway. The volume for this movement does not exceed 2000 pc/h for any peak indicating the new geometry will not negatively impact the operation of this ramp. The existing northbound SR-4 to eastbound I-275 entrance ramp is not analyzed as a signalized movement with the I-275 eastbound exit ramp. This is because the entrance ramp is a continuous, free-flow movement at this point. Based on this configuration the existing ramp functions as a ramp roadway. The only analysis of a lane drop is the ramp roadway capacity check. Based upon the HCM exhibit 13-10, a single lane ramp roadway with a design speed of 30-40 mph has a capacity of 2000 pc/h. A review of the 2037 No Build/Build volumes indicates that the entrance ramp does not exceed the 2000 pc/h recommended capacity limit for a single lane ramp during the and peak analysis period indicating this ramp will function adequately during all peak periods. The existing northbound SR-4 to westbound I-275 entrance ramp is not analyzed as a signalized movement with the I-275 westbound exit ramp. This is because the entrance ramp is a continuous, free-flow movement at this point. Based on this configuration the existing ramp functions as a ramp roadway. The only analysis of a lane drop is the ramp roadway capacity check. Based upon the HCM exhibit 13-10, a single lane ramp roadway with a design speed of 30-40 mph has a capacity of 2000 pc/h. A review of the 2037 No Build/Build volumes indicates that the entrance ramp does not exceed the 2000 pc/h recommended capacity limit for a single lane ramp during the and peak analysis period indicating this ramp will function adequately during all peak periods. The existing southbound SR-4 to I-275 entrance ramp is a single lane ramp which is a continuous thru movement at the intersection of SR-4 with the I-275 WB off ramp and therefore was not analyzed with the intersection analysis. The only analysis for the continuous movement at the intersection is the ramp roadway capacity check. A review of the 2037 No Build/Build volumes indicates the ramp demand does not exceed the 2000 pc/h recommended capacity provided in HCM exhibit 13-10. The proposed project is to widen the existing single lane ramp to add a lane. This would provide a separate lane for westbound I-275 and eastbound I-275 entrance traffic. The proposed geometry increases the capacity of the ramp to 4,000 pc/h total, or 2,000 pc/h per lane according to exhibit 13-10 of the HCM. Neither the combined ramp volume nor the volume separated by direction exceed these recommended

I-275 & SR4 INTERCHANGE OPERATIONS STUDY
6
capacity limits indicating the proposed geometry will operate adequately under existing and future traffic conditions. The proposed geometric modifications do not degrade the operations on the ramp facilities when comparing the no build and build conditions. Intersection Analysis Results:
SR-4 Signalized Intersections
2037 AM No-Build Geometry
2037 AM Build Geometry
2037 PM No-Build Geometry
2037 PM Build Geometry
LOS Delay
(sec/veh) LOS Delay
(sec/veh) LOS Delay
(sec/veh) LOS Delay
(sec/veh)
SR 4 & Crescentville SR 4 & Crescentville
NB Approach D 50.2 E 62.3 F 110.2 F 100.0
SB Approach E 67.3 E 68.7 E 65.7 D 36.3
EB Approach F 82.9 E 74.8 F 98.3 F 98.3
WB Approach E 76.5 E 75.1 F 98.0 E 72.6
Overall Intersection
E 58.7 E 65.6 F 93.3 E 74.9
SR 4 & WB I-275 Ramp SR 4 & WB I-275 Ramp
NB Approach C 30.0 C 30.0 C 32.7 C 32.7
SB Approach C 20.5 C 20.6 C 22.0 C 22.2
EB Approach - - - - - -
WB Approach C 28.8 C 28.8 C 31.8 C 31.8
Overall Intersection
C 27.0 C 27.0 C 29.3 C 29.3
SR 4 & EB I-275 Ramp SR 4 & EB I-275 Ramp
NB Approach C 21.5 C 21.5 C 26.6 C 26.6
SB Approach C 26.7 C 26.9 C 26.1 C 26.4
EB Approach C 28.1 C 28.1 C 26.2 C 26.2
WB Approach - - - - - -
Overall Intersection
C 26.1 C 26.2 C 26.3 C 26.5
The results of the intersection analysis indicate the proposed modifications do not degrade intersection LOS at any of the study intersections.

I-275 & SR4 INTERCHANGE OPERATIONS STUDY
7
No-Build SB SR 4 & I-275 Entrance Ramp

I-275 & SR4 INTERCHANGE OPERATIONS STUDY
8
Build SB SR 4 & I-275 Entrance Ramp

I-275 & SR4 INTERCHANGE OPERATIONS STUDY
9
Conclusion: The IOS verifies that the level of service is not degraded between the design year no-build condition and the design year build condition. The study meets the requirements of the Ohio Department of Transportation. Attachments Appendix A – HCS Results – Freeway Section Appendix B – HCS Results – Ramp Analysis Appendix C – HCS Results – Intersection Analysis Appendix D – Certified Traffic Appendix E – Design Plan Sheets

Appendix A

BASIC FREEWAY SEGMENTS WORKSHEET
General Information Site Information
Analyst SGB Highway/Direction of Travel I-275 EB Agency or Company TEC Engineering, Inc. From/To E of SB SR-4 Merge Date Performed 12/1/2015 Jurisdiction ODOT D08 Analysis Time Period AM No-Build Constraint Analysis Year 2037
Project Description I-275 & SR-4 IOS
Oper.(LOS) Des.(N) Planning Data
Flow Inputs
Volume, V 6150 veh/h Peak-Hour Factor, PHF 0.94
AADT veh/day %Trucks and Buses, PT 5
Peak-Hr Prop. of AADT, K %RVs, PR 0
Peak-Hr Direction Prop, D General Terrain: Level
DDHV = AADT x K x D veh/h Grade % Length mi
Up/Down %
Calculate Flow Adjustments
fp 1.00 E
R 1.2
ET 1.5 fHV = 1/[1+PT(ET - 1) + PR(ER - 1)] 0.976
Speed Inputs Calc Speed Adj and FFS
Lane Width ft
Rt-Side Lat. Clearance ft
Number of Lanes, N 4
Total Ramp Density, TRD ramps/mi
FFS (measured) 70.0 mph
Base free-flow Speed, BFFS
mph
fLW mph
fLC mph
TRD Adjustment mph
FFS 70.0 mph
LOS and Performance Measures Design (N)
Operational (LOS)
vp
= (V or DDHV) / (PHF x N x fHV
x fp)1677 pc/h/ln
S 67.4 mph
D = vp / S 24.9 pc/mi/ln
LOS C
Design (N)
Design LOS
vp = (V or DDHV) / (PHF x N x fHV
x fp)pc/h/ln
S mph
D = vp / S pc/mi/ln
Required Number of Lanes, N
Glossary Factor Location
N - Number of lanes S - Speed
V - Hourly volume D - Density
vp - Flow rate FFS - Free-flow speed
LOS - Level of service BFFS - Base free-flow speed
DDHV - Directional design hour volume
ER - Exhibits 11-10, 11-12 fLW - Exhibit 11-8
ET - Exhibits 11-10, 11-11, 11-13 fLC - Exhibit 11-9
fp - Page 11-18 TRD - Page 11-11
LOS, S, FFS, vp
- Exhibits 11-2,
11-3
Copyright © 2015 University of Florida, All Rights Reserved HCS 2010TM Version 6.70 Generated: 12/17/2015 9:26 AM
Page 1 of 1BASIC FREEWAY WORKSHEET
12/17/2015file:///C:/Users/sbusam.TECENG/AppData/Local/Temp/f2kAE0B.tmp

BASIC FREEWAY SEGMENTS WORKSHEET
General Information Site Information
Analyst SGB Highway/Direction of Travel I-275 EB Agency or Company TEC Engineering, Inc. From/To E of SB SR-4 Merge Date Performed 12/1/2015 Jurisdiction ODOT D08 Analysis Time Period AM Build Constraint Analysis Year 2037
Project Description I-275 & SR-4 IOS
Oper.(LOS) Des.(N) Planning Data
Flow Inputs
Volume, V 6170 veh/h Peak-Hour Factor, PHF 0.94
AADT veh/day %Trucks and Buses, PT 5
Peak-Hr Prop. of AADT, K %RVs, PR 0
Peak-Hr Direction Prop, D General Terrain: Level
DDHV = AADT x K x D veh/h Grade % Length mi
Up/Down %
Calculate Flow Adjustments
fp 1.00 E
R 1.2
ET 1.5 fHV = 1/[1+PT(ET - 1) + PR(ER - 1)] 0.976
Speed Inputs Calc Speed Adj and FFS
Lane Width ft
Rt-Side Lat. Clearance ft
Number of Lanes, N 4
Total Ramp Density, TRD ramps/mi
FFS (measured) 70.0 mph
Base free-flow Speed, BFFS
mph
fLW mph
fLC mph
TRD Adjustment mph
FFS 70.0 mph
LOS and Performance Measures Design (N)
Operational (LOS)
vp
= (V or DDHV) / (PHF x N x fHV
x fp)1682 pc/h/ln
S 67.3 mph
D = vp / S 25.0 pc/mi/ln
LOS C
Design (N)
Design LOS
vp = (V or DDHV) / (PHF x N x fHV
x fp)pc/h/ln
S mph
D = vp / S pc/mi/ln
Required Number of Lanes, N
Glossary Factor Location
N - Number of lanes S - Speed
V - Hourly volume D - Density
vp - Flow rate FFS - Free-flow speed
LOS - Level of service BFFS - Base free-flow speed
DDHV - Directional design hour volume
ER - Exhibits 11-10, 11-12 fLW - Exhibit 11-8
ET - Exhibits 11-10, 11-11, 11-13 fLC - Exhibit 11-9
fp - Page 11-18 TRD - Page 11-11
LOS, S, FFS, vp
- Exhibits 11-2,
11-3
Copyright © 2015 University of Florida, All Rights Reserved HCS 2010TM Version 6.70 Generated: 12/17/2015 9:28 AM
Page 1 of 1BASIC FREEWAY WORKSHEET
12/17/2015file:///C:/Users/sbusam.TECENG/AppData/Local/Temp/f2kF0E4.tmp

BASIC FREEWAY SEGMENTS WORKSHEET
General Information Site Information
Analyst SGB Highway/Direction of Travel I-275 EB Agency or Company TEC Engineering, Inc. From/To W of SB SR-4 Merge Date Performed 12/1/2015 Jurisdiction ODOT D08 Analysis Time Period AM No-Build Analysis Year 2037
Project Description I-275 & SR-4 IOS
Oper.(LOS) Des.(N) Planning Data
Flow Inputs
Volume, V 4980 veh/h Peak-Hour Factor, PHF 0.94
AADT veh/day %Trucks and Buses, PT 5
Peak-Hr Prop. of AADT, K %RVs, PR 0
Peak-Hr Direction Prop, D General Terrain: Level
DDHV = AADT x K x D veh/h Grade % Length mi
Up/Down %
Calculate Flow Adjustments
fp 1.00 E
R 1.2
ET 1.5 fHV = 1/[1+PT(ET - 1) + PR(ER - 1)] 0.976
Speed Inputs Calc Speed Adj and FFS
Lane Width ft
Rt-Side Lat. Clearance ft
Number of Lanes, N 4
Total Ramp Density, TRD ramps/mi
FFS (measured) 70.0 mph
Base free-flow Speed, BFFS
mph
fLW mph
fLC mph
TRD Adjustment mph
FFS 70.0 mph
LOS and Performance Measures Design (N)
Operational (LOS)
vp
= (V or DDHV) / (PHF x N x fHV
x fp)1358 pc/h/ln
S 69.7 mph
D = vp / S 19.5 pc/mi/ln
LOS C
Design (N)
Design LOS
vp = (V or DDHV) / (PHF x N x fHV
x fp)pc/h/ln
S mph
D = vp / S pc/mi/ln
Required Number of Lanes, N
Glossary Factor Location
N - Number of lanes S - Speed
V - Hourly volume D - Density
vp - Flow rate FFS - Free-flow speed
LOS - Level of service BFFS - Base free-flow speed
DDHV - Directional design hour volume
ER - Exhibits 11-10, 11-12 fLW - Exhibit 11-8
ET - Exhibits 11-10, 11-11, 11-13 fLC - Exhibit 11-9
fp - Page 11-18 TRD - Page 11-11
LOS, S, FFS, vp
- Exhibits 11-2,
11-3
Copyright © 2015 University of Florida, All Rights Reserved HCS 2010TM Version 6.70 Generated: 12/17/2015 9:28 AM
Page 1 of 1BASIC FREEWAY WORKSHEET
12/17/2015file:///C:/Users/sbusam.TECENG/AppData/Local/Temp/f2k9B56.tmp

BASIC FREEWAY SEGMENTS WORKSHEET
General Information Site Information
Analyst SGB Highway/Direction of Travel I-275 EB Agency or Company TEC Engineering, Inc. From/To W of SB SR-4 Merge Date Performed 12/1/2015 Jurisdiction ODOT D08 Analysis Time Period AM Build Analysis Year 2037
Project Description I-275 & SR-4 IOS
Oper.(LOS) Des.(N) Planning Data
Flow Inputs
Volume, V 4980 veh/h Peak-Hour Factor, PHF 0.94
AADT veh/day %Trucks and Buses, PT 5
Peak-Hr Prop. of AADT, K %RVs, PR 0
Peak-Hr Direction Prop, D General Terrain: Level
DDHV = AADT x K x D veh/h Grade % Length mi
Up/Down %
Calculate Flow Adjustments
fp 1.00 E
R 1.2
ET 1.5 fHV = 1/[1+PT(ET - 1) + PR(ER - 1)] 0.976
Speed Inputs Calc Speed Adj and FFS
Lane Width ft
Rt-Side Lat. Clearance ft
Number of Lanes, N 4
Total Ramp Density, TRD ramps/mi
FFS (measured) 70.0 mph
Base free-flow Speed, BFFS
mph
fLW mph
fLC mph
TRD Adjustment mph
FFS 70.0 mph
LOS and Performance Measures Design (N)
Operational (LOS)
vp
= (V or DDHV) / (PHF x N x fHV
x fp)1358 pc/h/ln
S 69.7 mph
D = vp / S 19.5 pc/mi/ln
LOS C
Design (N)
Design LOS
vp = (V or DDHV) / (PHF x N x fHV
x fp)pc/h/ln
S mph
D = vp / S pc/mi/ln
Required Number of Lanes, N
Glossary Factor Location
N - Number of lanes S - Speed
V - Hourly volume D - Density
vp - Flow rate FFS - Free-flow speed
LOS - Level of service BFFS - Base free-flow speed
DDHV - Directional design hour volume
ER - Exhibits 11-10, 11-12 fLW - Exhibit 11-8
ET - Exhibits 11-10, 11-11, 11-13 fLC - Exhibit 11-9
fp - Page 11-18 TRD - Page 11-11
LOS, S, FFS, vp
- Exhibits 11-2,
11-3
Copyright © 2015 University of Florida, All Rights Reserved HCS 2010TM Version 6.70 Generated: 12/17/2015 9:29 AM
Page 1 of 1BASIC FREEWAY WORKSHEET
12/17/2015file:///C:/Users/sbusam.TECENG/AppData/Local/Temp/f2k9B56.tmp

BASIC FREEWAY SEGMENTS WORKSHEET
General Information Site Information
Analyst SGB Highway/Direction of Travel I-275 EB Agency or Company TEC Engineering, Inc. From/To E of SB SR-4 Merge Date Performed 12/1/2015 Jurisdiction ODOT D08 Analysis Time Period PM No-Build Constraint Analysis Year 2037
Project Description I-275 & SR-4 IOS
Oper.(LOS) Des.(N) Planning Data
Flow Inputs
Volume, V 7014 veh/h Peak-Hour Factor, PHF 0.94
AADT veh/day %Trucks and Buses, PT 5
Peak-Hr Prop. of AADT, K %RVs, PR 0
Peak-Hr Direction Prop, D General Terrain: Level
DDHV = AADT x K x D veh/h Grade % Length mi
Up/Down %
Calculate Flow Adjustments
fp 1.00 E
R 1.2
ET 1.5 fHV = 1/[1+PT(ET - 1) + PR(ER - 1)] 0.976
Speed Inputs Calc Speed Adj and FFS
Lane Width ft
Rt-Side Lat. Clearance ft
Number of Lanes, N 4
Total Ramp Density, TRD ramps/mi
FFS (measured) 70.0 mph
Base free-flow Speed, BFFS
mph
fLW mph
fLC mph
TRD Adjustment mph
FFS 70.0 mph
LOS and Performance Measures Design (N)
Operational (LOS)
vp
= (V or DDHV) / (PHF x N x fHV
x fp)1912 pc/h/ln
S 64.1 mph
D = vp / S 29.8 pc/mi/ln
LOS D
Design (N)
Design LOS
vp = (V or DDHV) / (PHF x N x fHV
x fp)pc/h/ln
S mph
D = vp / S pc/mi/ln
Required Number of Lanes, N
Glossary Factor Location
N - Number of lanes S - Speed
V - Hourly volume D - Density
vp - Flow rate FFS - Free-flow speed
LOS - Level of service BFFS - Base free-flow speed
DDHV - Directional design hour volume
ER - Exhibits 11-10, 11-12 fLW - Exhibit 11-8
ET - Exhibits 11-10, 11-11, 11-13 fLC - Exhibit 11-9
fp - Page 11-18 TRD - Page 11-11
LOS, S, FFS, vp
- Exhibits 11-2,
11-3
Copyright © 2015 University of Florida, All Rights Reserved HCS 2010TM Version 6.70 Generated: 12/17/2015 10:19 AM
Page 1 of 1BASIC FREEWAY WORKSHEET
12/17/2015file:///C:/Users/sbusam.TECENG/AppData/Local/Temp/f2k9B28.tmp

BASIC FREEWAY SEGMENTS WORKSHEET
General Information Site Information
Analyst SGB Highway/Direction of Travel I-275 EB Agency or Company TEC Engineering, Inc. From/To E of SB SR-4 Merge Date Performed 12/1/2015 Jurisdiction ODOT D08 Analysis Time Period PM Build Analysis Year 2037
Project Description I-275 & SR-4 IOS
Oper.(LOS) Des.(N) Planning Data
Flow Inputs
Volume, V 7040 veh/h Peak-Hour Factor, PHF 0.94
AADT veh/day %Trucks and Buses, PT 5
Peak-Hr Prop. of AADT, K %RVs, PR 0
Peak-Hr Direction Prop, D General Terrain: Level
DDHV = AADT x K x D veh/h Grade % Length mi
Up/Down %
Calculate Flow Adjustments
fp 1.00 E
R 1.2
ET 1.5 fHV = 1/[1+PT(ET - 1) + PR(ER - 1)] 0.976
Speed Inputs Calc Speed Adj and FFS
Lane Width ft
Rt-Side Lat. Clearance ft
Number of Lanes, N 4
Total Ramp Density, TRD ramps/mi
FFS (measured) 70.0 mph
Base free-flow Speed, BFFS
mph
fLW mph
fLC mph
TRD Adjustment mph
FFS 70.0 mph
LOS and Performance Measures Design (N)
Operational (LOS)
vp
= (V or DDHV) / (PHF x N x fHV
x fp)1919 pc/h/ln
S 64.0 mph
D = vp / S 30.0 pc/mi/ln
LOS D
Design (N)
Design LOS
vp = (V or DDHV) / (PHF x N x fHV
x fp)pc/h/ln
S mph
D = vp / S pc/mi/ln
Required Number of Lanes, N
Glossary Factor Location
N - Number of lanes S - Speed
V - Hourly volume D - Density
vp - Flow rate FFS - Free-flow speed
LOS - Level of service BFFS - Base free-flow speed
DDHV - Directional design hour volume
ER - Exhibits 11-10, 11-12 fLW - Exhibit 11-8
ET - Exhibits 11-10, 11-11, 11-13 fLC - Exhibit 11-9
fp - Page 11-18 TRD - Page 11-11
LOS, S, FFS, vp
- Exhibits 11-2,
11-3
Copyright © 2015 University of Florida, All Rights Reserved HCS 2010TM Version 6.70 Generated: 12/17/2015 10:19 AM
Page 1 of 1BASIC FREEWAY WORKSHEET
12/17/2015file:///C:/Users/sbusam.TECENG/AppData/Local/Temp/f2k3812.tmp

BASIC FREEWAY SEGMENTS WORKSHEET
General Information Site Information
Analyst SGB Highway/Direction of Travel I-275 EB Agency or Company TEC Engineering, Inc. From/To W of SB SR-4 Merge Date Performed 12/1/2015 Jurisdiction ODOT D08 Analysis Time Period PM No-Build Analysis Year 2037
Project Description I-275 & SR-4 IOS
Oper.(LOS) Des.(N) Planning Data
Flow Inputs
Volume, V 6120 veh/h Peak-Hour Factor, PHF 0.94
AADT veh/day %Trucks and Buses, PT 5
Peak-Hr Prop. of AADT, K %RVs, PR 0
Peak-Hr Direction Prop, D General Terrain: Level
DDHV = AADT x K x D veh/h Grade % Length mi
Up/Down %
Calculate Flow Adjustments
fp 1.00 E
R 1.2
ET 1.5 fHV = 1/[1+PT(ET - 1) + PR(ER - 1)] 0.976
Speed Inputs Calc Speed Adj and FFS
Lane Width ft
Rt-Side Lat. Clearance ft
Number of Lanes, N 4
Total Ramp Density, TRD ramps/mi
FFS (measured) 70.0 mph
Base free-flow Speed, BFFS
mph
fLW mph
fLC mph
TRD Adjustment mph
FFS 70.0 mph
LOS and Performance Measures Design (N)
Operational (LOS)
vp
= (V or DDHV) / (PHF x N x fHV
x fp)1668 pc/h/ln
S 67.5 mph
D = vp / S 24.7 pc/mi/ln
LOS C
Design (N)
Design LOS
vp = (V or DDHV) / (PHF x N x fHV
x fp)pc/h/ln
S mph
D = vp / S pc/mi/ln
Required Number of Lanes, N
Glossary Factor Location
N - Number of lanes S - Speed
V - Hourly volume D - Density
vp - Flow rate FFS - Free-flow speed
LOS - Level of service BFFS - Base free-flow speed
DDHV - Directional design hour volume
ER - Exhibits 11-10, 11-12 fLW - Exhibit 11-8
ET - Exhibits 11-10, 11-11, 11-13 fLC - Exhibit 11-9
fp - Page 11-18 TRD - Page 11-11
LOS, S, FFS, vp
- Exhibits 11-2,
11-3
Copyright © 2015 University of Florida, All Rights Reserved HCS 2010TM Version 6.70 Generated: 12/17/2015 10:17 AM
Page 1 of 1BASIC FREEWAY WORKSHEET
12/17/2015file:///C:/Users/sbusam.TECENG/AppData/Local/Temp/f2kFC0C.tmp

BASIC FREEWAY SEGMENTS WORKSHEET
General Information Site Information
Analyst SGB Highway/Direction of Travel I-275 EB Agency or Company TEC Engineering, Inc. From/To W of SB SR-4 Merge Date Performed 12/1/2015 Jurisdiction ODOT D08 Analysis Time Period PM Build Analysis Year 2037
Project Description I-275 & SR-4 IOS
Oper.(LOS) Des.(N) Planning Data
Flow Inputs
Volume, V 6120 veh/h Peak-Hour Factor, PHF 0.94
AADT veh/day %Trucks and Buses, PT 5
Peak-Hr Prop. of AADT, K %RVs, PR 0
Peak-Hr Direction Prop, D General Terrain: Level
DDHV = AADT x K x D veh/h Grade % Length mi
Up/Down %
Calculate Flow Adjustments
fp 1.00 E
R 1.2
ET 1.5 fHV = 1/[1+PT(ET - 1) + PR(ER - 1)] 0.976
Speed Inputs Calc Speed Adj and FFS
Lane Width ft
Rt-Side Lat. Clearance ft
Number of Lanes, N 4
Total Ramp Density, TRD ramps/mi
FFS (measured) 70.0 mph
Base free-flow Speed, BFFS
mph
fLW mph
fLC mph
TRD Adjustment mph
FFS 70.0 mph
LOS and Performance Measures Design (N)
Operational (LOS)
vp
= (V or DDHV) / (PHF x N x fHV
x fp)1668 pc/h/ln
S 67.5 mph
D = vp / S 24.7 pc/mi/ln
LOS C
Design (N)
Design LOS
vp = (V or DDHV) / (PHF x N x fHV
x fp)pc/h/ln
S mph
D = vp / S pc/mi/ln
Required Number of Lanes, N
Glossary Factor Location
N - Number of lanes S - Speed
V - Hourly volume D - Density
vp - Flow rate FFS - Free-flow speed
LOS - Level of service BFFS - Base free-flow speed
DDHV - Directional design hour volume
ER - Exhibits 11-10, 11-12 fLW - Exhibit 11-8
ET - Exhibits 11-10, 11-11, 11-13 fLC - Exhibit 11-9
fp - Page 11-18 TRD - Page 11-11
LOS, S, FFS, vp
- Exhibits 11-2,
11-3
Copyright © 2015 University of Florida, All Rights Reserved HCS 2010TM Version 6.70 Generated: 12/17/2015 10:18 AM
Page 1 of 1BASIC FREEWAY WORKSHEET
12/17/2015file:///C:/Users/sbusam.TECENG/AppData/Local/Temp/f2kC4C7.tmp

BASIC FREEWAY SEGMENTS WORKSHEET
General Information Site Information
Analyst SGB Highway/Direction of Travel I-275 WB Agency or Company TEC Engineering, Inc. From/To East of SR-4 Diverge Date Performed 12/1/2015 Jurisdiction ODOT D08 Analysis Time Period AM No-Build Analysis Year 2037
Project Description I-275 & SR 4 IOS
Oper.(LOS) Des.(N) Planning Data
Flow Inputs
Volume, V 6780 veh/h Peak-Hour Factor, PHF 0.94
AADT veh/day %Trucks and Buses, PT 5
Peak-Hr Prop. of AADT, K %RVs, PR 0
Peak-Hr Direction Prop, D General Terrain: Level
DDHV = AADT x K x D veh/h Grade % Length mi
Up/Down %
Calculate Flow Adjustments
fp 1.00 E
R 1.2
ET 1.5 fHV = 1/[1+PT(ET - 1) + PR(ER - 1)] 0.976
Speed Inputs Calc Speed Adj and FFS
Lane Width ft
Rt-Side Lat. Clearance ft
Number of Lanes, N 5
Total Ramp Density, TRD ramps/mi
FFS (measured) 70.0 mph
Base free-flow Speed, BFFS
mph
fLW mph
fLC mph
TRD Adjustment mph
FFS 70.0 mph
LOS and Performance Measures Design (N)
Operational (LOS)
vp
= (V or DDHV) / (PHF x N x fHV
x fp)1479 pc/h/ln
S 69.1 mph
D = vp / S 21.4 pc/mi/ln
LOS C
Design (N)
Design LOS
vp = (V or DDHV) / (PHF x N x fHV
x fp)pc/h/ln
S mph
D = vp / S pc/mi/ln
Required Number of Lanes, N
Glossary Factor Location
N - Number of lanes S - Speed
V - Hourly volume D - Density
vp - Flow rate FFS - Free-flow speed
LOS - Level of service BFFS - Base free-flow speed
DDHV - Directional design hour volume
ER - Exhibits 11-10, 11-12 fLW - Exhibit 11-8
ET - Exhibits 11-10, 11-11, 11-13 fLC - Exhibit 11-9
fp - Page 11-18 TRD - Page 11-11
LOS, S, FFS, vp
- Exhibits 11-2,
11-3
Copyright © 2015 University of Florida, All Rights Reserved HCS 2010TM Version 6.70 Generated: 12/17/2015 9:17 AM
Page 1 of 1BASIC FREEWAY WORKSHEET
12/17/2015file:///C:/Users/sbusam.TECENG/AppData/Local/Temp/f2k7D2C.tmp

BASIC FREEWAY SEGMENTS WORKSHEET
General Information Site Information
Analyst SGB Highway/Direction of Travel I-275 WB Agency or Company TEC Engineering, Inc. From/To East of SR-4 Diverge Date Performed 12/1/2015 Jurisdiction ODOT D08 Analysis Time Period AM Build Analysis Year 2037
Project Description I-275 & SR 4 IOS
Oper.(LOS) Des.(N) Planning Data
Flow Inputs
Volume, V 6780 veh/h Peak-Hour Factor, PHF 0.94
AADT veh/day %Trucks and Buses, PT 5
Peak-Hr Prop. of AADT, K %RVs, PR 0
Peak-Hr Direction Prop, D General Terrain: Level
DDHV = AADT x K x D veh/h Grade % Length mi
Up/Down %
Calculate Flow Adjustments
fp 1.00 E
R 1.2
ET 1.5 fHV = 1/[1+PT(ET - 1) + PR(ER - 1)] 0.976
Speed Inputs Calc Speed Adj and FFS
Lane Width ft
Rt-Side Lat. Clearance ft
Number of Lanes, N 5
Total Ramp Density, TRD ramps/mi
FFS (measured) 70.0 mph
Base free-flow Speed, BFFS
mph
fLW mph
fLC mph
TRD Adjustment mph
FFS 70.0 mph
LOS and Performance Measures Design (N)
Operational (LOS)
vp
= (V or DDHV) / (PHF x N x fHV
x fp)1479 pc/h/ln
S 69.1 mph
D = vp / S 21.4 pc/mi/ln
LOS C
Design (N)
Design LOS
vp = (V or DDHV) / (PHF x N x fHV
x fp)pc/h/ln
S mph
D = vp / S pc/mi/ln
Required Number of Lanes, N
Glossary Factor Location
N - Number of lanes S - Speed
V - Hourly volume D - Density
vp - Flow rate FFS - Free-flow speed
LOS - Level of service BFFS - Base free-flow speed
DDHV - Directional design hour volume
ER - Exhibits 11-10, 11-12 fLW - Exhibit 11-8
ET - Exhibits 11-10, 11-11, 11-13 fLC - Exhibit 11-9
fp - Page 11-18 TRD - Page 11-11
LOS, S, FFS, vp
- Exhibits 11-2,
11-3
Copyright © 2015 University of Florida, All Rights Reserved HCS 2010TM Version 6.70 Generated: 12/17/2015 9:19 AM
Page 1 of 1BASIC FREEWAY WORKSHEET
12/17/2015file:///C:/Users/sbusam.TECENG/AppData/Local/Temp/f2k7D2C.tmp

BASIC FREEWAY SEGMENTS WORKSHEET
General Information Site Information
Analyst SGB Highway/Direction of Travel I-275 WB Agency or Company TEC Engineering, Inc. From/To W of SR 4 Diverge Date Performed 12/1/2015 Jurisdiction ODOT D08 Analysis Time Period AM No-Build Analysis Year 2037
Project Description I-275 & SR 4 IOS
Oper.(LOS) Des.(N) Planning Data
Flow Inputs
Volume, V 4660 veh/h Peak-Hour Factor, PHF 0.94
AADT veh/day %Trucks and Buses, PT 5
Peak-Hr Prop. of AADT, K %RVs, PR 0
Peak-Hr Direction Prop, D General Terrain: Level
DDHV = AADT x K x D veh/h Grade % Length mi
Up/Down %
Calculate Flow Adjustments
fp 1.00 E
R 1.2
ET 1.5 fHV = 1/[1+PT(ET - 1) + PR(ER - 1)] 0.976
Speed Inputs Calc Speed Adj and FFS
Lane Width ft
Rt-Side Lat. Clearance ft
Number of Lanes, N 4
Total Ramp Density, TRD ramps/mi
FFS (measured) 70.0 mph
Base free-flow Speed, BFFS
mph
fLW mph
fLC mph
TRD Adjustment mph
FFS 70.0 mph
LOS and Performance Measures Design (N)
Operational (LOS)
vp
= (V or DDHV) / (PHF x N x fHV
x fp)1270 pc/h/ln
S 69.9 mph
D = vp / S 18.2 pc/mi/ln
LOS C
Design (N)
Design LOS
vp = (V or DDHV) / (PHF x N x fHV
x fp)pc/h/ln
S mph
D = vp / S pc/mi/ln
Required Number of Lanes, N
Glossary Factor Location
N - Number of lanes S - Speed
V - Hourly volume D - Density
vp - Flow rate FFS - Free-flow speed
LOS - Level of service BFFS - Base free-flow speed
DDHV - Directional design hour volume
ER - Exhibits 11-10, 11-12 fLW - Exhibit 11-8
ET - Exhibits 11-10, 11-11, 11-13 fLC - Exhibit 11-9
fp - Page 11-18 TRD - Page 11-11
LOS, S, FFS, vp
- Exhibits 11-2,
11-3
Copyright © 2015 University of Florida, All Rights Reserved HCS 2010TM Version 6.70 Generated: 12/17/2015 9:20 AM
Page 1 of 1BASIC FREEWAY WORKSHEET
12/17/2015file:///C:/Users/sbusam.TECENG/AppData/Local/Temp/f2kA1AC.tmp

BASIC FREEWAY SEGMENTS WORKSHEET
General Information Site Information
Analyst SGB Highway/Direction of Travel I-275 WB Agency or Company TEC Engineering, Inc. From/To W of SR 4 Diverge Date Performed 12/1/2015 Jurisdiction ODOT D08 Analysis Time Period AM Build Analysis Year 2037
Project Description I-275 & SR 4 IOS
Oper.(LOS) Des.(N) Planning Data
Flow Inputs
Volume, V 4660 veh/h Peak-Hour Factor, PHF 0.94
AADT veh/day %Trucks and Buses, PT 5
Peak-Hr Prop. of AADT, K %RVs, PR 0
Peak-Hr Direction Prop, D General Terrain: Level
DDHV = AADT x K x D veh/h Grade % Length mi
Up/Down %
Calculate Flow Adjustments
fp 1.00 E
R 1.2
ET 1.5 fHV = 1/[1+PT(ET - 1) + PR(ER - 1)] 0.976
Speed Inputs Calc Speed Adj and FFS
Lane Width ft
Rt-Side Lat. Clearance ft
Number of Lanes, N 4
Total Ramp Density, TRD ramps/mi
FFS (measured) 70.0 mph
Base free-flow Speed, BFFS
mph
fLW mph
fLC mph
TRD Adjustment mph
FFS 70.0 mph
LOS and Performance Measures Design (N)
Operational (LOS)
vp
= (V or DDHV) / (PHF x N x fHV
x fp)1270 pc/h/ln
S 69.9 mph
D = vp / S 18.2 pc/mi/ln
LOS C
Design (N)
Design LOS
vp = (V or DDHV) / (PHF x N x fHV
x fp)pc/h/ln
S mph
D = vp / S pc/mi/ln
Required Number of Lanes, N
Glossary Factor Location
N - Number of lanes S - Speed
V - Hourly volume D - Density
vp - Flow rate FFS - Free-flow speed
LOS - Level of service BFFS - Base free-flow speed
DDHV - Directional design hour volume
ER - Exhibits 11-10, 11-12 fLW - Exhibit 11-8
ET - Exhibits 11-10, 11-11, 11-13 fLC - Exhibit 11-9
fp - Page 11-18 TRD - Page 11-11
LOS, S, FFS, vp
- Exhibits 11-2,
11-3
Copyright © 2015 University of Florida, All Rights Reserved HCS 2010TM Version 6.70 Generated: 12/17/2015 9:21 AM
Page 1 of 1BASIC FREEWAY WORKSHEET
12/17/2015file:///C:/Users/sbusam.TECENG/AppData/Local/Temp/f2kA1AC.tmp

BASIC FREEWAY SEGMENTS WORKSHEET
General Information Site Information
Analyst SGB Highway/Direction of Travel I-275 WB Agency or Company TEC Engineering, Inc. From/To W of NB SR-4 Merge Date Performed 12/1/2015 Jurisdiction ODOT D08 Analysis Time Period AM No-Build Analysis Year 2037
Project Description I-275 & SR 4 IOS
Oper.(LOS) Des.(N) Planning Data
Flow Inputs
Volume, V 4780 veh/h Peak-Hour Factor, PHF 0.94
AADT veh/day %Trucks and Buses, PT 5
Peak-Hr Prop. of AADT, K %RVs, PR 0
Peak-Hr Direction Prop, D General Terrain: Level
DDHV = AADT x K x D veh/h Grade % Length mi
Up/Down %
Calculate Flow Adjustments
fp 1.00 E
R 1.2
ET 1.5 fHV = 1/[1+PT(ET - 1) + PR(ER - 1)] 0.976
Speed Inputs Calc Speed Adj and FFS
Lane Width ft
Rt-Side Lat. Clearance ft
Number of Lanes, N 4
Total Ramp Density, TRD ramps/mi
FFS (measured) 70.0 mph
Base free-flow Speed, BFFS
mph
fLW mph
fLC mph
TRD Adjustment mph
FFS 70.0 mph
LOS and Performance Measures Design (N)
Operational (LOS)
vp
= (V or DDHV) / (PHF x N x fHV
x fp)1303 pc/h/ln
S 69.9 mph
D = vp / S 18.6 pc/mi/ln
LOS C
Design (N)
Design LOS
vp = (V or DDHV) / (PHF x N x fHV
x fp)pc/h/ln
S mph
D = vp / S pc/mi/ln
Required Number of Lanes, N
Glossary Factor Location
N - Number of lanes S - Speed
V - Hourly volume D - Density
vp - Flow rate FFS - Free-flow speed
LOS - Level of service BFFS - Base free-flow speed
DDHV - Directional design hour volume
ER - Exhibits 11-10, 11-12 fLW - Exhibit 11-8
ET - Exhibits 11-10, 11-11, 11-13 fLC - Exhibit 11-9
fp - Page 11-18 TRD - Page 11-11
LOS, S, FFS, vp
- Exhibits 11-2,
11-3
Copyright © 2015 University of Florida, All Rights Reserved HCS 2010TM Version 6.70 Generated: 12/17/2015 9:22 AM
Page 1 of 1BASIC FREEWAY WORKSHEET
12/17/2015file:///C:/Users/sbusam.TECENG/AppData/Local/Temp/f2kF576.tmp

BASIC FREEWAY SEGMENTS WORKSHEET
General Information Site Information
Analyst SGB Highway/Direction of Travel I-275 WB Agency or Company TEC Engineering, Inc. From/To W of NB SR-4 Merge Date Performed 12/1/2015 Jurisdiction ODOT D08 Analysis Time Period AM Build Analysis Year 2037
Project Description I-275 & SR 4 IOS
Oper.(LOS) Des.(N) Planning Data
Flow Inputs
Volume, V 4780 veh/h Peak-Hour Factor, PHF 0.94
AADT veh/day %Trucks and Buses, PT 5
Peak-Hr Prop. of AADT, K %RVs, PR 0
Peak-Hr Direction Prop, D General Terrain: Level
DDHV = AADT x K x D veh/h Grade % Length mi
Up/Down %
Calculate Flow Adjustments
fp 1.00 E
R 1.2
ET 1.5 fHV = 1/[1+PT(ET - 1) + PR(ER - 1)] 0.976
Speed Inputs Calc Speed Adj and FFS
Lane Width ft
Rt-Side Lat. Clearance ft
Number of Lanes, N 4
Total Ramp Density, TRD ramps/mi
FFS (measured) 70.0 mph
Base free-flow Speed, BFFS
mph
fLW mph
fLC mph
TRD Adjustment mph
FFS 70.0 mph
LOS and Performance Measures Design (N)
Operational (LOS)
vp
= (V or DDHV) / (PHF x N x fHV
x fp)1303 pc/h/ln
S 69.9 mph
D = vp / S 18.6 pc/mi/ln
LOS C
Design (N)
Design LOS
vp = (V or DDHV) / (PHF x N x fHV
x fp)pc/h/ln
S mph
D = vp / S pc/mi/ln
Required Number of Lanes, N
Glossary Factor Location
N - Number of lanes S - Speed
V - Hourly volume D - Density
vp - Flow rate FFS - Free-flow speed
LOS - Level of service BFFS - Base free-flow speed
DDHV - Directional design hour volume
ER - Exhibits 11-10, 11-12 fLW - Exhibit 11-8
ET - Exhibits 11-10, 11-11, 11-13 fLC - Exhibit 11-9
fp - Page 11-18 TRD - Page 11-11
LOS, S, FFS, vp
- Exhibits 11-2,
11-3
Copyright © 2015 University of Florida, All Rights Reserved HCS 2010TM Version 6.70 Generated: 12/17/2015 9:23 AM
Page 1 of 1BASIC FREEWAY WORKSHEET
12/17/2015file:///C:/Users/sbusam.TECENG/AppData/Local/Temp/f2kF576.tmp

BASIC FREEWAY SEGMENTS WORKSHEET
General Information Site Information
Analyst SGB Highway/Direction of Travel I-275 WB Agency or Company TEC Engineering, Inc. From/To W of SB SR-4 Merge Date Performed 12/1/2015 Jurisdiction ODOT D08 Analysis Time Period AM No-Build Constraint Analysis Year 2037
Project Description I-275 & SR 4 IOS
Oper.(LOS) Des.(N) Planning Data
Flow Inputs
Volume, V 4985 veh/h Peak-Hour Factor, PHF 0.94
AADT veh/day %Trucks and Buses, PT 5
Peak-Hr Prop. of AADT, K %RVs, PR 0
Peak-Hr Direction Prop, D General Terrain: Grade
DDHV = AADT x K x D veh/h Grade 3.00% Length 1.25mi
Up/Down % 3.00
Calculate Flow Adjustments
fp 1.00 E
R 3.0
ET 2.5 fHV = 1/[1+PT(ET - 1) + PR(ER - 1)] 0.930
Speed Inputs Calc Speed Adj and FFS
Lane Width ft
Rt-Side Lat. Clearance ft
Number of Lanes, N 4
Total Ramp Density, TRD ramps/mi
FFS (measured) 70.0 mph
Base free-flow Speed, BFFS
mph
fLW mph
fLC mph
TRD Adjustment mph
FFS 70.0 mph
LOS and Performance Measures Design (N)
Operational (LOS)
vp
= (V or DDHV) / (PHF x N x fHV
x fp)1425 pc/h/ln
S 69.4 mph
D = vp / S 20.5 pc/mi/ln
LOS C
Design (N)
Design LOS
vp = (V or DDHV) / (PHF x N x fHV
x fp)pc/h/ln
S mph
D = vp / S pc/mi/ln
Required Number of Lanes, N
Glossary Factor Location
N - Number of lanes S - Speed
V - Hourly volume D - Density
vp - Flow rate FFS - Free-flow speed
LOS - Level of service BFFS - Base free-flow speed
DDHV - Directional design hour volume
ER - Exhibits 11-10, 11-12 fLW - Exhibit 11-8
ET - Exhibits 11-10, 11-11, 11-13 fLC - Exhibit 11-9
fp - Page 11-18 TRD - Page 11-11
LOS, S, FFS, vp
- Exhibits 11-2,
11-3
Copyright © 2015 University of Florida, All Rights Reserved HCS 2010TM Version 6.70 Generated: 12/17/2015 9:25 AM
Page 1 of 1BASIC FREEWAY WORKSHEET
12/17/2015file:///C:/Users/sbusam.TECENG/AppData/Local/Temp/f2k8CA6.tmp

BASIC FREEWAY SEGMENTS WORKSHEET
General Information Site Information
Analyst SGB Highway/Direction of Travel I-275 WB Agency or Company TEC Engineering, Inc. From/To W of SB SR-4 Merge Date Performed 12/1/2015 Jurisdiction ODOT D08 Analysis Time Period AM Build Constraint Analysis Year 2037
Project Description I-275 & SR 4 IOS
Oper.(LOS) Des.(N) Planning Data
Flow Inputs
Volume, V 4988 veh/h Peak-Hour Factor, PHF 0.94
AADT veh/day %Trucks and Buses, PT 5
Peak-Hr Prop. of AADT, K %RVs, PR 0
Peak-Hr Direction Prop, D General Terrain: Grade
DDHV = AADT x K x D veh/h Grade 3.00% Length 1.25mi
Up/Down % 3.00
Calculate Flow Adjustments
fp 1.00 E
R 3.0
ET 2.5 fHV = 1/[1+PT(ET - 1) + PR(ER - 1)] 0.930
Speed Inputs Calc Speed Adj and FFS
Lane Width ft
Rt-Side Lat. Clearance ft
Number of Lanes, N 4
Total Ramp Density, TRD ramps/mi
FFS (measured) 70.0 mph
Base free-flow Speed, BFFS
mph
fLW mph
fLC mph
TRD Adjustment mph
FFS 70.0 mph
LOS and Performance Measures Design (N)
Operational (LOS)
vp
= (V or DDHV) / (PHF x N x fHV
x fp)1426 pc/h/ln
S 69.4 mph
D = vp / S 20.5 pc/mi/ln
LOS C
Design (N)
Design LOS
vp = (V or DDHV) / (PHF x N x fHV
x fp)pc/h/ln
S mph
D = vp / S pc/mi/ln
Required Number of Lanes, N
Glossary Factor Location
N - Number of lanes S - Speed
V - Hourly volume D - Density
vp - Flow rate FFS - Free-flow speed
LOS - Level of service BFFS - Base free-flow speed
DDHV - Directional design hour volume
ER - Exhibits 11-10, 11-12 fLW - Exhibit 11-8
ET - Exhibits 11-10, 11-11, 11-13 fLC - Exhibit 11-9
fp - Page 11-18 TRD - Page 11-11
LOS, S, FFS, vp
- Exhibits 11-2,
11-3
Copyright © 2015 University of Florida, All Rights Reserved HCS 2010TM Version 6.70 Generated: 12/17/2015 9:25 AM
Page 1 of 1BASIC FREEWAY WORKSHEET
12/17/2015file:///C:/Users/sbusam.TECENG/AppData/Local/Temp/f2kDCB9.tmp

BASIC FREEWAY SEGMENTS WORKSHEET
General Information Site Information
Analyst SGB Highway/Direction of Travel I-275 WB Agency or Company TEC Engineering, Inc. From/To East of SR-4 Diverge Date Performed 12/1/2015 Jurisdiction ODOT D08 Analysis Time Period PM No-Build Analysis Year 2037
Project Description I-275 & SR 4 IOS
Oper.(LOS) Des.(N) Planning Data
Flow Inputs
Volume, V 7420 veh/h Peak-Hour Factor, PHF 0.94
AADT veh/day %Trucks and Buses, PT 5
Peak-Hr Prop. of AADT, K %RVs, PR 0
Peak-Hr Direction Prop, D General Terrain: Level
DDHV = AADT x K x D veh/h Grade % Length mi
Up/Down %
Calculate Flow Adjustments
fp 1.00 E
R 1.2
ET 1.5 fHV = 1/[1+PT(ET - 1) + PR(ER - 1)] 0.976
Speed Inputs Calc Speed Adj and FFS
Lane Width ft
Rt-Side Lat. Clearance ft
Number of Lanes, N 5
Total Ramp Density, TRD ramps/mi
FFS (measured) 70.0 mph
Base free-flow Speed, BFFS
mph
fLW mph
fLC mph
TRD Adjustment mph
FFS 70.0 mph
LOS and Performance Measures Design (N)
Operational (LOS)
vp
= (V or DDHV) / (PHF x N x fHV
x fp)1618 pc/h/ln
S 68.0 mph
D = vp / S 23.8 pc/mi/ln
LOS C
Design (N)
Design LOS
vp = (V or DDHV) / (PHF x N x fHV
x fp)pc/h/ln
S mph
D = vp / S pc/mi/ln
Required Number of Lanes, N
Glossary Factor Location
N - Number of lanes S - Speed
V - Hourly volume D - Density
vp - Flow rate FFS - Free-flow speed
LOS - Level of service BFFS - Base free-flow speed
DDHV - Directional design hour volume
ER - Exhibits 11-10, 11-12 fLW - Exhibit 11-8
ET - Exhibits 11-10, 11-11, 11-13 fLC - Exhibit 11-9
fp - Page 11-18 TRD - Page 11-11
LOS, S, FFS, vp
- Exhibits 11-2,
11-3
Copyright © 2015 University of Florida, All Rights Reserved HCS 2010TM Version 6.70 Generated: 12/17/2015 10:07 AM
Page 1 of 1BASIC FREEWAY WORKSHEET
12/17/2015file:///C:/Users/sbusam.TECENG/AppData/Local/Temp/f2k68E2.tmp

BASIC FREEWAY SEGMENTS WORKSHEET
General Information Site Information
Analyst SGB Highway/Direction of Travel I-275 WB Agency or Company TEC Engineering, Inc. From/To East of SR-4 Diverge Date Performed 12/1/2015 Jurisdiction ODOT D08 Analysis Time Period PM Build Analysis Year 2037
Project Description I-275 & SR 4 IOS
Oper.(LOS) Des.(N) Planning Data
Flow Inputs
Volume, V 7420 veh/h Peak-Hour Factor, PHF 0.94
AADT veh/day %Trucks and Buses, PT 5
Peak-Hr Prop. of AADT, K %RVs, PR 0
Peak-Hr Direction Prop, D General Terrain: Level
DDHV = AADT x K x D veh/h Grade % Length mi
Up/Down %
Calculate Flow Adjustments
fp 1.00 E
R 1.2
ET 1.5 fHV = 1/[1+PT(ET - 1) + PR(ER - 1)] 0.976
Speed Inputs Calc Speed Adj and FFS
Lane Width ft
Rt-Side Lat. Clearance ft
Number of Lanes, N 5
Total Ramp Density, TRD ramps/mi
FFS (measured) 70.0 mph
Base free-flow Speed, BFFS
mph
fLW mph
fLC mph
TRD Adjustment mph
FFS 70.0 mph
LOS and Performance Measures Design (N)
Operational (LOS)
vp
= (V or DDHV) / (PHF x N x fHV
x fp)1618 pc/h/ln
S 68.0 mph
D = vp / S 23.8 pc/mi/ln
LOS C
Design (N)
Design LOS
vp = (V or DDHV) / (PHF x N x fHV
x fp)pc/h/ln
S mph
D = vp / S pc/mi/ln
Required Number of Lanes, N
Glossary Factor Location
N - Number of lanes S - Speed
V - Hourly volume D - Density
vp - Flow rate FFS - Free-flow speed
LOS - Level of service BFFS - Base free-flow speed
DDHV - Directional design hour volume
ER - Exhibits 11-10, 11-12 fLW - Exhibit 11-8
ET - Exhibits 11-10, 11-11, 11-13 fLC - Exhibit 11-9
fp - Page 11-18 TRD - Page 11-11
LOS, S, FFS, vp
- Exhibits 11-2,
11-3
Copyright © 2015 University of Florida, All Rights Reserved HCS 2010TM Version 6.70 Generated: 12/17/2015 10:09 AM
Page 1 of 1BASIC FREEWAY WORKSHEET
12/17/2015file:///C:/Users/sbusam.TECENG/AppData/Local/Temp/f2k57A3.tmp

BASIC FREEWAY SEGMENTS WORKSHEET
General Information Site Information
Analyst SGB Highway/Direction of Travel I-275 WB Agency or Company TEC Engineering, Inc. From/To W of SR 4 Diverge Date Performed 12/1/2015 Jurisdiction ODOT D08 Analysis Time Period PM No-Build Analysis Year 2037
Project Description I-275 & SR 4 IOS
Oper.(LOS) Des.(N) Planning Data
Flow Inputs
Volume, V 5310 veh/h Peak-Hour Factor, PHF 0.94
AADT veh/day %Trucks and Buses, PT 5
Peak-Hr Prop. of AADT, K %RVs, PR 0
Peak-Hr Direction Prop, D General Terrain: Level
DDHV = AADT x K x D veh/h Grade % Length mi
Up/Down %
Calculate Flow Adjustments
fp 1.00 E
R 1.2
ET 1.5 fHV = 1/[1+PT(ET - 1) + PR(ER - 1)] 0.976
Speed Inputs Calc Speed Adj and FFS
Lane Width ft
Rt-Side Lat. Clearance ft
Number of Lanes, N 4
Total Ramp Density, TRD ramps/mi
FFS (measured) 70.0 mph
Base free-flow Speed, BFFS
mph
fLW mph
fLC mph
TRD Adjustment mph
FFS 70.0 mph
LOS and Performance Measures Design (N)
Operational (LOS)
vp
= (V or DDHV) / (PHF x N x fHV
x fp)1448 pc/h/ln
S 69.3 mph
D = vp / S 20.9 pc/mi/ln
LOS C
Design (N)
Design LOS
vp = (V or DDHV) / (PHF x N x fHV
x fp)pc/h/ln
S mph
D = vp / S pc/mi/ln
Required Number of Lanes, N
Glossary Factor Location
N - Number of lanes S - Speed
V - Hourly volume D - Density
vp - Flow rate FFS - Free-flow speed
LOS - Level of service BFFS - Base free-flow speed
DDHV - Directional design hour volume
ER - Exhibits 11-10, 11-12 fLW - Exhibit 11-8
ET - Exhibits 11-10, 11-11, 11-13 fLC - Exhibit 11-9
fp - Page 11-18 TRD - Page 11-11
LOS, S, FFS, vp
- Exhibits 11-2,
11-3
Copyright © 2015 University of Florida, All Rights Reserved HCS 2010TM Version 6.70 Generated: 12/17/2015 10:10 AM
Page 1 of 1BASIC FREEWAY WORKSHEET
12/17/2015file:///C:/Users/sbusam.TECENG/AppData/Local/Temp/f2kB30B.tmp

BASIC FREEWAY SEGMENTS WORKSHEET
General Information Site Information
Analyst SGB Highway/Direction of Travel I-275 WB Agency or Company TEC Engineering, Inc. From/To W of SR 4 Diverge Date Performed 12/1/2015 Jurisdiction ODOT D08 Analysis Time Period PM Build Analysis Year 2037
Project Description I-275 & SR 4 IOS
Oper.(LOS) Des.(N) Planning Data
Flow Inputs
Volume, V 5310 veh/h Peak-Hour Factor, PHF 0.94
AADT veh/day %Trucks and Buses, PT 5
Peak-Hr Prop. of AADT, K %RVs, PR 0
Peak-Hr Direction Prop, D General Terrain: Level
DDHV = AADT x K x D veh/h Grade % Length mi
Up/Down %
Calculate Flow Adjustments
fp 1.00 E
R 1.2
ET 1.5 fHV = 1/[1+PT(ET - 1) + PR(ER - 1)] 0.976
Speed Inputs Calc Speed Adj and FFS
Lane Width ft
Rt-Side Lat. Clearance ft
Number of Lanes, N 4
Total Ramp Density, TRD ramps/mi
FFS (measured) 70.0 mph
Base free-flow Speed, BFFS
mph
fLW mph
fLC mph
TRD Adjustment mph
FFS 70.0 mph
LOS and Performance Measures Design (N)
Operational (LOS)
vp
= (V or DDHV) / (PHF x N x fHV
x fp)1448 pc/h/ln
S 69.3 mph
D = vp / S 20.9 pc/mi/ln
LOS C
Design (N)
Design LOS
vp = (V or DDHV) / (PHF x N x fHV
x fp)pc/h/ln
S mph
D = vp / S pc/mi/ln
Required Number of Lanes, N
Glossary Factor Location
N - Number of lanes S - Speed
V - Hourly volume D - Density
vp - Flow rate FFS - Free-flow speed
LOS - Level of service BFFS - Base free-flow speed
DDHV - Directional design hour volume
ER - Exhibits 11-10, 11-12 fLW - Exhibit 11-8
ET - Exhibits 11-10, 11-11, 11-13 fLC - Exhibit 11-9
fp - Page 11-18 TRD - Page 11-11
LOS, S, FFS, vp
- Exhibits 11-2,
11-3
Copyright © 2015 University of Florida, All Rights Reserved HCS 2010TM Version 6.70 Generated: 12/17/2015 10:11 AM
Page 1 of 1BASIC FREEWAY WORKSHEET
12/17/2015file:///C:/Users/sbusam.TECENG/AppData/Local/Temp/f2kB30B.tmp

BASIC FREEWAY SEGMENTS WORKSHEET
General Information Site Information
Analyst SGB Highway/Direction of Travel I-275 WB Agency or Company TEC Engineering, Inc. From/To W of NB SR-4 Merge Date Performed 12/1/2015 Jurisdiction ODOT D08 Analysis Time Period PM No-Build Analysis Year 2037
Project Description I-275 & SR 4 IOS
Oper.(LOS) Des.(N) Planning Data
Flow Inputs
Volume, V 5600 veh/h Peak-Hour Factor, PHF 0.94
AADT veh/day %Trucks and Buses, PT 5
Peak-Hr Prop. of AADT, K %RVs, PR 0
Peak-Hr Direction Prop, D General Terrain: Level
DDHV = AADT x K x D veh/h Grade % Length mi
Up/Down %
Calculate Flow Adjustments
fp 1.00 E
R 1.2
ET 1.5 fHV = 1/[1+PT(ET - 1) + PR(ER - 1)] 0.976
Speed Inputs Calc Speed Adj and FFS
Lane Width ft
Rt-Side Lat. Clearance ft
Number of Lanes, N 4
Total Ramp Density, TRD ramps/mi
FFS (measured) 70.0 mph
Base free-flow Speed, BFFS
mph
fLW mph
fLC mph
TRD Adjustment mph
FFS 70.0 mph
LOS and Performance Measures Design (N)
Operational (LOS)
vp
= (V or DDHV) / (PHF x N x fHV
x fp)1527 pc/h/ln
S 68.8 mph
D = vp / S 22.2 pc/mi/ln
LOS C
Design (N)
Design LOS
vp = (V or DDHV) / (PHF x N x fHV
x fp)pc/h/ln
S mph
D = vp / S pc/mi/ln
Required Number of Lanes, N
Glossary Factor Location
N - Number of lanes S - Speed
V - Hourly volume D - Density
vp - Flow rate FFS - Free-flow speed
LOS - Level of service BFFS - Base free-flow speed
DDHV - Directional design hour volume
ER - Exhibits 11-10, 11-12 fLW - Exhibit 11-8
ET - Exhibits 11-10, 11-11, 11-13 fLC - Exhibit 11-9
fp - Page 11-18 TRD - Page 11-11
LOS, S, FFS, vp
- Exhibits 11-2,
11-3
Copyright © 2015 University of Florida, All Rights Reserved HCS 2010TM Version 6.70 Generated: 12/17/2015 10:12 AM
Page 1 of 1BASIC FREEWAY WORKSHEET
12/17/2015file:///C:/Users/sbusam.TECENG/AppData/Local/Temp/f2k2463.tmp
BASIC FREEWAY SEGMENTS WORKSHEET
General Information Site Information
Analyst SGB Highway/Direction of Travel I-275 WB Agency or Company TEC Engineering, Inc. From/To W of NB SR-4 Merge Date Performed 12/1/2015 Jurisdiction ODOT D08 Analysis Time Period PM Build Analysis Year 2037
Project Description I-275 & SR 4 IOS
Oper.(LOS) Des.(N) Planning Data
Flow Inputs
Volume, V 5600 veh/h Peak-Hour Factor, PHF 0.94
AADT veh/day %Trucks and Buses, PT 5
Peak-Hr Prop. of AADT, K %RVs, PR 0
Peak-Hr Direction Prop, D General Terrain: Level
DDHV = AADT x K x D veh/h Grade % Length mi
Up/Down %
Calculate Flow Adjustments
fp 1.00 E
R 1.2
ET 1.5 fHV = 1/[1+PT(ET - 1) + PR(ER - 1)] 0.976
Speed Inputs Calc Speed Adj and FFS
Lane Width ft
Rt-Side Lat. Clearance ft
Number of Lanes, N 4
Total Ramp Density, TRD ramps/mi
FFS (measured) 70.0 mph
Base free-flow Speed, BFFS
mph
fLW mph
fLC mph
TRD Adjustment mph
FFS 70.0 mph
LOS and Performance Measures Design (N)
Operational (LOS)
vp
= (V or DDHV) / (PHF x N x fHV
x fp)1527 pc/h/ln
S 68.8 mph
D = vp / S 22.2 pc/mi/ln
LOS C
Design (N)
Design LOS
vp = (V or DDHV) / (PHF x N x fHV
x fp)pc/h/ln
S mph
D = vp / S pc/mi/ln
Required Number of Lanes, N
Glossary Factor Location
N - Number of lanes S - Speed
V - Hourly volume D - Density
vp - Flow rate FFS - Free-flow speed
LOS - Level of service BFFS - Base free-flow speed
DDHV - Directional design hour volume
ER - Exhibits 11-10, 11-12 fLW - Exhibit 11-8
ET - Exhibits 11-10, 11-11, 11-13 fLC - Exhibit 11-9
fp - Page 11-18 TRD - Page 11-11
LOS, S, FFS, vp
- Exhibits 11-2,
11-3
Copyright © 2015 University of Florida, All Rights Reserved HCS 2010TM Version 6.70 Generated: 12/17/2015 10:13 AM
Page 1 of 1BASIC FREEWAY WORKSHEET
12/17/2015file:///C:/Users/sbusam.TECENG/AppData/Local/Temp/f2k2463.tmp
BASIC FREEWAY SEGMENTS WORKSHEET
General Information Site Information
Analyst SGB Highway/Direction of Travel I-275 WB Agency or Company TEC Engineering, Inc. From/To W of SB SR-4 Merge Date Performed 12/1/2015 Jurisdiction ODOT D08 Analysis Time Period PM No-Build Constraint Analysis Year 2037
Project Description I-275 & SR 4 IOS
Oper.(LOS) Des.(N) Planning Data
Flow Inputs
Volume, V 6247 veh/h Peak-Hour Factor, PHF 0.94
AADT veh/day %Trucks and Buses, PT 5
Peak-Hr Prop. of AADT, K %RVs, PR 0
Peak-Hr Direction Prop, D General Terrain: Grade
DDHV = AADT x K x D veh/h Grade 3.00% Length 1.25mi
Up/Down % 3.00
Calculate Flow Adjustments
fp 1.00 E
R 3.0
ET 2.5 fHV = 1/[1+PT(ET - 1) + PR(ER - 1)] 0.930
Speed Inputs Calc Speed Adj and FFS
Lane Width ft
Rt-Side Lat. Clearance ft
Number of Lanes, N 4
Total Ramp Density, TRD ramps/mi
FFS (measured) 70.0 mph
Base free-flow Speed, BFFS
mph
fLW mph
fLC mph
TRD Adjustment mph
FFS 70.0 mph
LOS and Performance Measures Design (N)
Operational (LOS)
vp
= (V or DDHV) / (PHF x N x fHV
x fp)1786 pc/h/ln
S 66.0 mph
D = vp / S 27.1 pc/mi/ln
LOS D
Design (N)
Design LOS
vp = (V or DDHV) / (PHF x N x fHV
x fp)pc/h/ln
S mph
D = vp / S pc/mi/ln
Required Number of Lanes, N
Glossary Factor Location
N - Number of lanes S - Speed
V - Hourly volume D - Density
vp - Flow rate FFS - Free-flow speed
LOS - Level of service BFFS - Base free-flow speed
DDHV - Directional design hour volume
ER - Exhibits 11-10, 11-12 fLW - Exhibit 11-8
ET - Exhibits 11-10, 11-11, 11-13 fLC - Exhibit 11-9
fp - Page 11-18 TRD - Page 11-11
LOS, S, FFS, vp
- Exhibits 11-2,
11-3
Copyright © 2015 University of Florida, All Rights Reserved HCS 2010TM Version 6.70 Generated: 12/17/2015 10:14 AM
Page 1 of 1BASIC FREEWAY WORKSHEET
12/17/2015file:///C:/Users/sbusam.TECENG/AppData/Local/Temp/f2k87B7.tmp

BASIC FREEWAY SEGMENTS WORKSHEET
General Information Site Information
Analyst SGB Highway/Direction of Travel I-275 WB Agency or Company TEC Engineering, Inc. From/To W of SB SR-4 Merge Date Performed 12/1/2015 Jurisdiction ODOT D08 Analysis Time Period PM Build Analysis Year 2037
Project Description I-275 & SR 4 IOS
Oper.(LOS) Des.(N) Planning Data
Flow Inputs
Volume, V 6260 veh/h Peak-Hour Factor, PHF 0.94
AADT veh/day %Trucks and Buses, PT 5
Peak-Hr Prop. of AADT, K %RVs, PR 0
Peak-Hr Direction Prop, D General Terrain: Grade
DDHV = AADT x K x D veh/h Grade 3.00% Length 1.25mi
Up/Down % 3.00
Calculate Flow Adjustments
fp 1.00 E
R 3.0
ET 2.5 fHV = 1/[1+PT(ET - 1) + PR(ER - 1)] 0.930
Speed Inputs Calc Speed Adj and FFS
Lane Width ft
Rt-Side Lat. Clearance ft
Number of Lanes, N 4
Total Ramp Density, TRD ramps/mi
FFS (measured) 70.0 mph
Base free-flow Speed, BFFS
mph
fLW mph
fLC mph
TRD Adjustment mph
FFS 70.0 mph
LOS and Performance Measures Design (N)
Operational (LOS)
vp
= (V or DDHV) / (PHF x N x fHV
x fp)1790 pc/h/ln
S 66.0 mph
D = vp / S 27.1 pc/mi/ln
LOS D
Design (N)
Design LOS
vp = (V or DDHV) / (PHF x N x fHV
x fp)pc/h/ln
S mph
D = vp / S pc/mi/ln
Required Number of Lanes, N
Glossary Factor Location
N - Number of lanes S - Speed
V - Hourly volume D - Density
vp - Flow rate FFS - Free-flow speed
LOS - Level of service BFFS - Base free-flow speed
DDHV - Directional design hour volume
ER - Exhibits 11-10, 11-12 fLW - Exhibit 11-8
ET - Exhibits 11-10, 11-11, 11-13 fLC - Exhibit 11-9
fp - Page 11-18 TRD - Page 11-11
LOS, S, FFS, vp
- Exhibits 11-2,
11-3
Copyright © 2015 University of Florida, All Rights Reserved HCS 2010TM Version 6.70 Generated: 12/17/2015 10:16 AM
Page 1 of 1BASIC FREEWAY WORKSHEET
12/17/2015file:///C:/Users/sbusam.TECENG/AppData/Local/Temp/f2kBC7D.tmp

Appendix B

RAMPS AND RAMP JUNCTIONS WORKSHEET
General Information Site Information
Analyst SGB Freeway/Dir of Travel I-275 EB
Agency or Company TEC Engineering Junction I-275 EB and NB SR-4
Date Performed 12/7/2015 Jurisdiction ODOT D08
Analysis Time Period AM No-Build Constraint Analysis Year 2037
Project Description I-275 & SR-4 IOS
Inputs
Upstream Adj Ramp
Yes On
No Off
Lup
= ft
Vu = veh/h
Freeway Number of Lanes, N 5
Ramp Number of Lanes, N 1
Acceleration Lane Length, LA 1500
Deceleration Lane Length LD
Freeway Volume, VF 6150
Ramp Volume, VR 540
Freeway Free-Flow Speed, SFF 55.0
Ramp Free-Flow Speed, SFR 35.0
Downstream Adj Ramp
Yes On
No Off
Ldown = ft
VD = veh/h
Conversion to pc/h Under Base Conditions
(pc/h)V
(Veh/hr)PHF Terrain %Truck %Rv fHV fp v = V/PHF x fHV x fp
Freeway 6150 0.94 Level 0 0 1.000 1.00 6543
Ramp 540 0.94 Level 0 0 1.000 1.00 574
UpStream
DownStream
Merge Areas Diverge Areas
Estimation of v12 Estimation of v12
V12
= VF ( P
FM )
LEQ
= (Equation 13-6 or 13-7)
PFM
= 0.146 using Equation (Exhibit 13-6)
V12 = 698 pc/h
V3 or V
av342039 pc/h (Equation 13-14 or 13-
17)
Is V3 or Vav34 > 2,700 pc/h? Yes No
Is V3 or V
av34 > 1.5 * V
12/2 Yes No
If Yes,V12a = 1910 pc/h (Equation 13-16, 13-18, or 13-19)
V12 = VR + (VF - VR)PFD
LEQ
= (Equation 13-12 or 13-13)
PFD = using Equation (Exhibit 13-7)
V12
= pc/h
V3 or V
av34 pc/h (Equation 13-14 or 13-17)
Is V3 or Vav34 > 2,700 pc/h? Yes No
Is V3 or V
av34 > 1.5 * V
12/2 Yes No
If Yes,V12a
= pc/h (Equation 13-16, 13-18, or 13-19)
Capacity Checks Capacity Checks
Actual Capacity LOS F? Actual Capacity LOS F?
VFO 5351 Exhibit 13-8 No
VF Exhibit 13-8
VFO = VF - VR Exhibit 13-8
VRExhibit 13-
10
Flow Entering Merge Influence Area Flow Entering Diverge Influence AreaActual Max Desirable Violation? Actual Max Desirable Violation?
VR12 2484 Exhibit 13-8 4600:All No V12 Exhibit 13-8
Level of Service Determination (if not F) Level of Service Determination (if not F)
DR = 5.475 + 0.00734 v
R + 0.0078 V
12- 0.00627 L
A
DR = 15.2 (pc/mi/ln)
LOS = B (Exhibit 13-2)
DR = 4.252 + 0.0086 V12 - 0.009 LD
DR = (pc/mi/ln)
LOS = (Exhibit 13-2)
Speed Determination Speed Determination
MS = 0.263 (Exibit 13-11)
SR= 51.6 mph (Exhibit 13-11)
S0= 51.6 mph (Exhibit 13-11)
S = 51.6 mph (Exhibit 13-13)
Ds = (Exhibit 13-12)
SR= mph (Exhibit 13-12)
S0= mph (Exhibit 13-12)
S = mph (Exhibit 13-13)
Copyright © 2015 University of Florida, All Rights Reserved HCS2010TM Version 6.70 Generated: 12/17/2015 9:45 AM
Page 1 of 1RAMPS AND RAMP JUNCTIONS WORKSHEET
12/17/2015file:///C:/Users/sbusam.TECENG/AppData/Local/Temp/r2kC5DF.tmp

RAMPS AND RAMP JUNCTIONS WORKSHEET
General Information Site Information
Analyst SGB Freeway/Dir of Travel I-275 EB
Agency or Company TEC Engineering Junction I-275 EB and NB SR-4
Date Performed 12/7/2015 Jurisdiction ODOT D08
Analysis Time Period AM Build Constraint Analysis Year 2037
Project Description I-275 & SR-4 IOS
Inputs
Upstream Adj Ramp
Yes On
No Off
Lup
= ft
Vu = veh/h
Freeway Number of Lanes, N 5
Ramp Number of Lanes, N 1
Acceleration Lane Length, LA 1500
Deceleration Lane Length LD
Freeway Volume, VF 6170
Ramp Volume, VR 540
Freeway Free-Flow Speed, SFF 55.0
Ramp Free-Flow Speed, SFR 35.0
Downstream Adj Ramp
Yes On
No Off
Ldown = ft
VD = veh/h
Conversion to pc/h Under Base Conditions
(pc/h)V
(Veh/hr)PHF Terrain %Truck %Rv fHV fp v = V/PHF x fHV x fp
Freeway 6170 0.94 Level 0 0 1.000 1.00 6564
Ramp 540 0.94 Level 0 0 1.000 1.00 574
UpStream
DownStream
Merge Areas Diverge Areas
Estimation of v12 Estimation of v12
V12
= VF ( P
FM )
LEQ
= (Equation 13-6 or 13-7)
PFM
= 0.146 using Equation (Exhibit 13-6)
V12 = 700 pc/h
V3 or V
av342046 pc/h (Equation 13-14 or 13-
17)
Is V3 or Vav34 > 2,700 pc/h? Yes No
Is V3 or V
av34 > 1.5 * V
12/2 Yes No
If Yes,V12a = 1916 pc/h (Equation 13-16, 13-18, or 13-19)
V12 = VR + (VF - VR)PFD
LEQ
= (Equation 13-12 or 13-13)
PFD = using Equation (Exhibit 13-7)
V12
= pc/h
V3 or V
av34 pc/h (Equation 13-14 or 13-17)
Is V3 or Vav34 > 2,700 pc/h? Yes No
Is V3 or V
av34 > 1.5 * V
12/2 Yes No
If Yes,V12a
= pc/h (Equation 13-16, 13-18, or 13-19)
Capacity Checks Capacity Checks
Actual Capacity LOS F? Actual Capacity LOS F?
VFO 5366 Exhibit 13-8 No
VF Exhibit 13-8
VFO = VF - VR Exhibit 13-8
VRExhibit 13-
10
Flow Entering Merge Influence Area Flow Entering Diverge Influence AreaActual Max Desirable Violation? Actual Max Desirable Violation?
VR12 2490 Exhibit 13-8 4600:All No V12 Exhibit 13-8
Level of Service Determination (if not F) Level of Service Determination (if not F)
DR = 5.475 + 0.00734 v
R + 0.0078 V
12- 0.00627 L
A
DR = 15.2 (pc/mi/ln)
LOS = B (Exhibit 13-2)
DR = 4.252 + 0.0086 V12 - 0.009 LD
DR = (pc/mi/ln)
LOS = (Exhibit 13-2)
Speed Determination Speed Determination
MS = 0.263 (Exibit 13-11)
SR= 51.6 mph (Exhibit 13-11)
S0= 51.6 mph (Exhibit 13-11)
S = 51.6 mph (Exhibit 13-13)
Ds = (Exhibit 13-12)
SR= mph (Exhibit 13-12)
S0= mph (Exhibit 13-12)
S = mph (Exhibit 13-13)
Copyright © 2015 University of Florida, All Rights Reserved HCS2010TM Version 6.70 Generated: 12/17/2015 9:47 AM
Page 1 of 1RAMPS AND RAMP JUNCTIONS WORKSHEET
12/17/2015file:///C:/Users/sbusam.TECENG/AppData/Local/Temp/r2kD3D3.tmp

RAMPS AND RAMP JUNCTIONS WORKSHEET
General Information Site Information
Analyst SGB Freeway/Dir of Travel I-275 WB
Agency or Company TEC Engineering Junction I-275 WB and NB SR-4
Date Performed 12/7/2015 Jurisdiction ODOT D08
Analysis Time Period AM No-Build Analysis Year 2037
Project Description I-275 & SR-4 IOS
Inputs
Upstream Adj Ramp
Yes On
No Off
Lup
= 2100 ft
Vu = 220 veh/h
Freeway Number of Lanes, N 4
Ramp Number of Lanes, N 1
Acceleration Lane Length, LA 1500
Deceleration Lane Length LD
Freeway Volume, VF 4660
Ramp Volume, VR 120
Freeway Free-Flow Speed, SFF 55.0
Ramp Free-Flow Speed, SFR 35.0
Downstream Adj Ramp
Yes On
No Off
Ldown = ft
VD = veh/h
Conversion to pc/h Under Base Conditions
(pc/h)V
(Veh/hr)PHF Terrain %Truck %Rv fHV fp v = V/PHF x fHV x fp
Freeway 4660 0.94 Grade 0 0 1.000 1.00 4957
Ramp 120 0.94 Grade 0 0 1.000 1.00 128
UpStream 220 0.94 Grade 0 0 1.000 1.00 234
DownStream
Merge Areas Diverge Areas
Estimation of v12 Estimation of v12
V12
= VF ( P
FM )
LEQ
= (Equation 13-6 or 13-7)
PFM = 0.202 using Equation (Exhibit 13-6)
V12
= 1000 pc/h
V3 or Vav341978 pc/h (Equation 13-14 or 13-
17)
Is V3 or V
av34 > 2,700 pc/h? Yes No
Is V3 or Vav34 > 1.5 * V12/2 Yes No
If Yes,V12a
= 1982 pc/h (Equation 13-16, 13-
18, or 13-19)
V12
= VR + (V
F- V
R)P
FD
LEQ = (Equation 13-12 or 13-13)
PFD
= using Equation (Exhibit 13-7)
V12
= pc/h
V3 or V
av34 pc/h (Equation 13-14 or 13-17)
Is V3 or V
av34 > 2,700 pc/h? Yes No
Is V3 or Vav34 > 1.5 * V12/2 Yes No
If Yes,V12a
= pc/h (Equation 13-16, 13-18, or 13-19)
Capacity Checks Capacity Checks
Actual Capacity LOS F? Actual Capacity LOS F?
VFO 5085 Exhibit 13-8 No
VF Exhibit 13-8
VFO = VF - VR Exhibit 13-8
VR
Exhibit 13-10
Flow Entering Merge Influence Area Flow Entering Diverge Influence AreaActual Max Desirable Violation? Actual Max Desirable Violation?
VR12 2110 Exhibit 13-8 4600:All No V12 Exhibit 13-8
Level of Service Determination (if not F) Level of Service Determination (if not F)
DR = 5.475 + 0.00734 v R + 0.0078 V12 - 0.00627 LA
DR = 12.5 (pc/mi/ln)
LOS = B (Exhibit 13-2)
DR = 4.252 + 0.0086 V
12- 0.009 L
D
DR = (pc/mi/ln)
LOS = (Exhibit 13-2)
Speed Determination Speed Determination
MS = 0.248 (Exibit 13-11)
SR= 51.8 mph (Exhibit 13-11)
S0= 51.4 mph (Exhibit 13-11)
S = 51.6 mph (Exhibit 13-13)
Ds = (Exhibit 13-12)
SR= mph (Exhibit 13-12)
S0= mph (Exhibit 13-12)
S = mph (Exhibit 13-13)
Copyright © 2015 University of Florida, All Rights Reserved HCS2010TM Version 6.70 Generated: 12/17/2015 9:30 AM
Page 1 of 1RAMPS AND RAMP JUNCTIONS WORKSHEET
12/17/2015file:///C:/Users/sbusam.TECENG/AppData/Local/Temp/r2k406B.tmp

RAMPS AND RAMP JUNCTIONS WORKSHEET
General Information Site Information
Analyst SGB Freeway/Dir of Travel I-275 WB
Agency or Company TEC Engineering Junction I-275 WB and NB SR-4
Date Performed 12/7/2015 Jurisdiction ODOT D08
Analysis Time Period AM Build Analysis Year 2037
Project Description I-275 & SR-4 IOS
Inputs
Upstream Adj Ramp
Yes On
No Off
Lup
= 2100 ft
Vu = 220 veh/h
Freeway Number of Lanes, N 4
Ramp Number of Lanes, N 1
Acceleration Lane Length, LA 1500
Deceleration Lane Length LD
Freeway Volume, VF 4660
Ramp Volume, VR 120
Freeway Free-Flow Speed, SFF 55.0
Ramp Free-Flow Speed, SFR 35.0
Downstream Adj Ramp
Yes On
No Off
Ldown = ft
VD = veh/h
Conversion to pc/h Under Base Conditions
(pc/h)V
(Veh/hr)PHF Terrain %Truck %Rv fHV fp v = V/PHF x fHV x fp
Freeway 4660 0.94 Grade 0 0 1.000 1.00 4957
Ramp 120 0.94 Grade 0 0 1.000 1.00 128
UpStream 220 0.94 Grade 0 0 1.000 1.00 234
DownStream
Merge Areas Diverge Areas
Estimation of v12 Estimation of v12
V12
= VF ( P
FM )
LEQ
= (Equation 13-6 or 13-7)
PFM = 0.202 using Equation (Exhibit 13-6)
V12
= 1000 pc/h
V3 or Vav341978 pc/h (Equation 13-14 or 13-
17)
Is V3 or V
av34 > 2,700 pc/h? Yes No
Is V3 or Vav34 > 1.5 * V12/2 Yes No
If Yes,V12a
= 1982 pc/h (Equation 13-16, 13-
18, or 13-19)
V12
= VR + (V
F- V
R)P
FD
LEQ = (Equation 13-12 or 13-13)
PFD
= using Equation (Exhibit 13-7)
V12
= pc/h
V3 or V
av34 pc/h (Equation 13-14 or 13-17)
Is V3 or V
av34 > 2,700 pc/h? Yes No
Is V3 or Vav34 > 1.5 * V12/2 Yes No
If Yes,V12a
= pc/h (Equation 13-16, 13-18, or 13-19)
Capacity Checks Capacity Checks
Actual Capacity LOS F? Actual Capacity LOS F?
VFO 5085 Exhibit 13-8 No
VF Exhibit 13-8
VFO = VF - VR Exhibit 13-8
VR
Exhibit 13-10
Flow Entering Merge Influence Area Flow Entering Diverge Influence AreaActual Max Desirable Violation? Actual Max Desirable Violation?
VR12 2110 Exhibit 13-8 4600:All No V12 Exhibit 13-8
Level of Service Determination (if not F) Level of Service Determination (if not F)
DR = 5.475 + 0.00734 v R + 0.0078 V12 - 0.00627 LA
DR = 12.5 (pc/mi/ln)
LOS = B (Exhibit 13-2)
DR = 4.252 + 0.0086 V
12- 0.009 L
D
DR = (pc/mi/ln)
LOS = (Exhibit 13-2)
Speed Determination Speed Determination
MS = 0.248 (Exibit 13-11)
SR= 51.8 mph (Exhibit 13-11)
S0= 51.4 mph (Exhibit 13-11)
S = 51.6 mph (Exhibit 13-13)
Ds = (Exhibit 13-12)
SR= mph (Exhibit 13-12)
S0= mph (Exhibit 13-12)
S = mph (Exhibit 13-13)
Copyright © 2015 University of Florida, All Rights Reserved HCS2010TM Version 6.70 Generated: 12/17/2015 9:32 AM
Page 1 of 1RAMPS AND RAMP JUNCTIONS WORKSHEET
12/17/2015file:///C:/Users/sbusam.TECENG/AppData/Local/Temp/r2kA41C.tmp
RAMPS AND RAMP JUNCTIONS WORKSHEET
General Information Site Information
Analyst SGB Freeway/Dir of Travel I-275 WB
Agency or Company TEC Engineering Junction I-275 WB and SB SR-4
Date Performed 12/7/2015 Jurisdiction ODOT D08
Analysis Time Period AM No-Build Constraint Analysis Year 2037
Project Description I-275 & SR-4 IOS
Inputs
Upstream Adj Ramp
Yes On
No Off
Lup
= 2100 ft
Vu = 120 veh/h
Freeway Number of Lanes, N 4
Ramp Number of Lanes, N 1
Acceleration Lane Length, LA 1500
Deceleration Lane Length LD
Freeway Volume, VF 4780
Ramp Volume, VR 205
Freeway Free-Flow Speed, SFF 55.0
Ramp Free-Flow Speed, SFR 35.0
Downstream Adj Ramp
Yes On
No Off
Ldown = ft
VD = veh/h
Conversion to pc/h Under Base Conditions
(pc/h)V
(Veh/hr)PHF Terrain %Truck %Rv fHV fp v = V/PHF x fHV x fp
Freeway 4780 0.94 Grade 0 0 1.000 1.00 5085
Ramp 205 0.94 Grade 0 0 1.000 1.00 218
UpStream 120 0.94 Grade 0 0 1.000 1.00 128
DownStream
Merge Areas Diverge Areas
Estimation of v12 Estimation of v12
V12
= VF ( P
FM )
LEQ
= (Equation 13-6 or 13-7)
PFM = 0.191 using Equation (Exhibit 13-6)
V12
= 969 pc/h
V3 or Vav342058 pc/h (Equation 13-14 or 13-
17)
Is V3 or V
av34 > 2,700 pc/h? Yes No
Is V3 or Vav34 > 1.5 * V12/2 Yes No
If Yes,V12a
= 2034 pc/h (Equation 13-16, 13-
18, or 13-19)
V12
= VR + (V
F- V
R)P
FD
LEQ = (Equation 13-12 or 13-13)
PFD
= using Equation (Exhibit 13-7)
V12
= pc/h
V3 or V
av34 pc/h (Equation 13-14 or 13-17)
Is V3 or V
av34 > 2,700 pc/h? Yes No
Is V3 or Vav34 > 1.5 * V12/2 Yes No
If Yes,V12a
= pc/h (Equation 13-16, 13-18, or 13-19)
Capacity Checks Capacity Checks
Actual Capacity LOS F? Actual Capacity LOS F?
VFO 5303 Exhibit 13-8 No
VF Exhibit 13-8
VFO = VF - VR Exhibit 13-8
VR
Exhibit 13-10
Flow Entering Merge Influence Area Flow Entering Diverge Influence AreaActual Max Desirable Violation? Actual Max Desirable Violation?
VR12 2252 Exhibit 13-8 4600:All No V12 Exhibit 13-8
Level of Service Determination (if not F) Level of Service Determination (if not F)
DR = 5.475 + 0.00734 v R + 0.0078 V12 - 0.00627 LA
DR = 13.5 (pc/mi/ln)
LOS = B (Exhibit 13-2)
DR = 4.252 + 0.0086 V
12- 0.009 L
D
DR = (pc/mi/ln)
LOS = (Exhibit 13-2)
Speed Determination Speed Determination
MS = 0.253 (Exibit 13-11)
SR= 51.7 mph (Exhibit 13-11)
S0= 51.3 mph (Exhibit 13-11)
S = 51.5 mph (Exhibit 13-13)
Ds = (Exhibit 13-12)
SR= mph (Exhibit 13-12)
S0= mph (Exhibit 13-12)
S = mph (Exhibit 13-13)
Copyright © 2015 University of Florida, All Rights Reserved HCS2010TM Version 6.70 Generated: 12/17/2015 9:33 AM
Page 1 of 1RAMPS AND RAMP JUNCTIONS WORKSHEET
12/17/2015file:///C:/Users/sbusam.TECENG/AppData/Local/Temp/r2k70DD.tmp

RAMPS AND RAMP JUNCTIONS WORKSHEET
General Information Site Information
Analyst SGB Freeway/Dir of Travel I-275 WB
Agency or Company TEC Engineering Junction I-275 WB and SB SR-4
Date Performed 12/7/2015 Jurisdiction ODOT D08
Analysis Time Period AM Build Constraint Analysis Year 2037
Project Description I-275 & SR-4 IOS
Inputs
Upstream Adj Ramp
Yes On
No Off
Lup
= 2100 ft
Vu = 120 veh/h
Freeway Number of Lanes, N 4
Ramp Number of Lanes, N 1
Acceleration Lane Length, LA 1500
Deceleration Lane Length LD
Freeway Volume, VF 4780
Ramp Volume, VR 208
Freeway Free-Flow Speed, SFF 55.0
Ramp Free-Flow Speed, SFR 35.0
Downstream Adj Ramp
Yes On
No Off
Ldown = ft
VD = veh/h
Conversion to pc/h Under Base Conditions
(pc/h)V
(Veh/hr)PHF Terrain %Truck %Rv fHV fp v = V/PHF x fHV x fp
Freeway 4780 0.94 Grade 0 0 1.000 1.00 5085
Ramp 208 0.94 Grade 0 0 1.000 1.00 221
UpStream 120 0.94 Grade 0 0 1.000 1.00 128
DownStream
Merge Areas Diverge Areas
Estimation of v12 Estimation of v12
V12
= VF ( P
FM )
LEQ
= (Equation 13-6 or 13-7)
PFM = 0.190 using Equation (Exhibit 13-6)
V12
= 967 pc/h
V3 or Vav342059 pc/h (Equation 13-14 or 13-
17)
Is V3 or V
av34 > 2,700 pc/h? Yes No
Is V3 or Vav34 > 1.5 * V12/2 Yes No
If Yes,V12a
= 2034 pc/h (Equation 13-16, 13-
18, or 13-19)
V12
= VR + (V
F- V
R)P
FD
LEQ = (Equation 13-12 or 13-13)
PFD
= using Equation (Exhibit 13-7)
V12
= pc/h
V3 or V
av34 pc/h (Equation 13-14 or 13-17)
Is V3 or V
av34 > 2,700 pc/h? Yes No
Is V3 or Vav34 > 1.5 * V12/2 Yes No
If Yes,V12a
= pc/h (Equation 13-16, 13-18, or 13-19)
Capacity Checks Capacity Checks
Actual Capacity LOS F? Actual Capacity LOS F?
VFO 5306 Exhibit 13-8 No
VF Exhibit 13-8
VFO = VF - VR Exhibit 13-8
VR
Exhibit 13-10
Flow Entering Merge Influence Area Flow Entering Diverge Influence AreaActual Max Desirable Violation? Actual Max Desirable Violation?
VR12 2255 Exhibit 13-8 4600:All No V12 Exhibit 13-8
Level of Service Determination (if not F) Level of Service Determination (if not F)
DR = 5.475 + 0.00734 v R + 0.0078 V12 - 0.00627 LA
DR = 13.6 (pc/mi/ln)
LOS = B (Exhibit 13-2)
DR = 4.252 + 0.0086 V
12- 0.009 L
D
DR = (pc/mi/ln)
LOS = (Exhibit 13-2)
Speed Determination Speed Determination
MS = 0.253 (Exibit 13-11)
SR= 51.7 mph (Exhibit 13-11)
S0= 51.3 mph (Exhibit 13-11)
S = 51.5 mph (Exhibit 13-13)
Ds = (Exhibit 13-12)
SR= mph (Exhibit 13-12)
S0= mph (Exhibit 13-12)
S = mph (Exhibit 13-13)
Copyright © 2015 University of Florida, All Rights Reserved HCS2010TM Version 6.70 Generated: 12/17/2015 9:43 AM
Page 1 of 1RAMPS AND RAMP JUNCTIONS WORKSHEET
12/17/2015file:///C:/Users/sbusam.TECENG/AppData/Local/Temp/r2k54C5.tmp
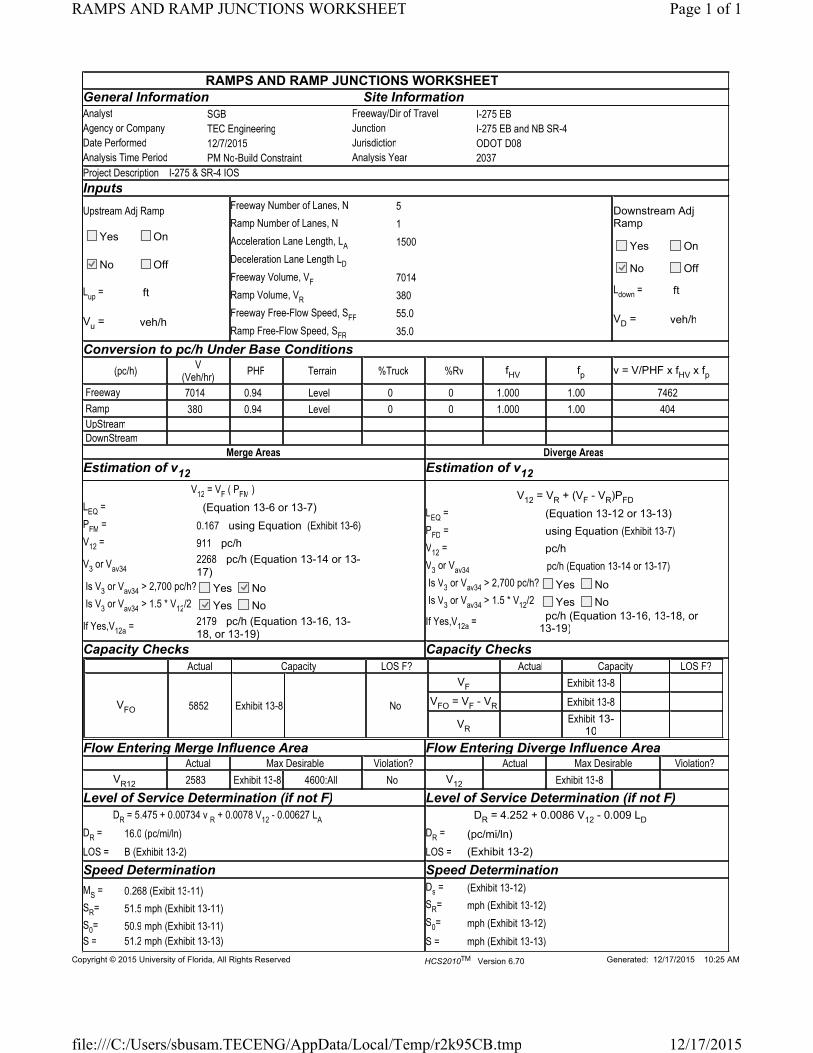
RAMPS AND RAMP JUNCTIONS WORKSHEET
General Information Site Information
Analyst SGB Freeway/Dir of Travel I-275 EB
Agency or Company TEC Engineering Junction I-275 EB and NB SR-4
Date Performed 12/7/2015 Jurisdiction ODOT D08
Analysis Time Period PM No-Build Constraint Analysis Year 2037
Project Description I-275 & SR-4 IOS
Inputs
Upstream Adj Ramp
Yes On
No Off
Lup
= ft
Vu = veh/h
Freeway Number of Lanes, N 5
Ramp Number of Lanes, N 1
Acceleration Lane Length, LA 1500
Deceleration Lane Length LD
Freeway Volume, VF 7014
Ramp Volume, VR 380
Freeway Free-Flow Speed, SFF 55.0
Ramp Free-Flow Speed, SFR 35.0
Downstream Adj Ramp
Yes On
No Off
Ldown = ft
VD = veh/h
Conversion to pc/h Under Base Conditions
(pc/h)V
(Veh/hr)PHF Terrain %Truck %Rv fHV fp v = V/PHF x fHV x fp
Freeway 7014 0.94 Level 0 0 1.000 1.00 7462
Ramp 380 0.94 Level 0 0 1.000 1.00 404
UpStream
DownStream
Merge Areas Diverge Areas
Estimation of v12 Estimation of v12
V12
= VF ( P
FM )
LEQ
= (Equation 13-6 or 13-7)
PFM
= 0.167 using Equation (Exhibit 13-6)
V12 = 911 pc/h
V3 or V
av342268 pc/h (Equation 13-14 or 13-
17)
Is V3 or Vav34 > 2,700 pc/h? Yes No
Is V3 or V
av34 > 1.5 * V
12/2 Yes No
If Yes,V12a = 2179 pc/h (Equation 13-16, 13-18, or 13-19)
V12 = VR + (VF - VR)PFD
LEQ
= (Equation 13-12 or 13-13)
PFD = using Equation (Exhibit 13-7)
V12
= pc/h
V3 or V
av34 pc/h (Equation 13-14 or 13-17)
Is V3 or Vav34 > 2,700 pc/h? Yes No
Is V3 or V
av34 > 1.5 * V
12/2 Yes No
If Yes,V12a
= pc/h (Equation 13-16, 13-18, or 13-19)
Capacity Checks Capacity Checks
Actual Capacity LOS F? Actual Capacity LOS F?
VFO 5852 Exhibit 13-8 No
VF Exhibit 13-8
VFO = VF - VR Exhibit 13-8
VRExhibit 13-
10
Flow Entering Merge Influence Area Flow Entering Diverge Influence AreaActual Max Desirable Violation? Actual Max Desirable Violation?
VR12 2583 Exhibit 13-8 4600:All No V12 Exhibit 13-8
Level of Service Determination (if not F) Level of Service Determination (if not F)
DR = 5.475 + 0.00734 v
R + 0.0078 V
12- 0.00627 L
A
DR = 16.0 (pc/mi/ln)
LOS = B (Exhibit 13-2)
DR = 4.252 + 0.0086 V12 - 0.009 LD
DR = (pc/mi/ln)
LOS = (Exhibit 13-2)
Speed Determination Speed Determination
MS = 0.268 (Exibit 13-11)
SR= 51.5 mph (Exhibit 13-11)
S0= 50.9 mph (Exhibit 13-11)
S = 51.2 mph (Exhibit 13-13)
Ds = (Exhibit 13-12)
SR= mph (Exhibit 13-12)
S0= mph (Exhibit 13-12)
S = mph (Exhibit 13-13)
Copyright © 2015 University of Florida, All Rights Reserved HCS2010TM Version 6.70 Generated: 12/17/2015 10:25 AM
Page 1 of 1RAMPS AND RAMP JUNCTIONS WORKSHEET
12/17/2015file:///C:/Users/sbusam.TECENG/AppData/Local/Temp/r2k95CB.tmp

RAMPS AND RAMP JUNCTIONS WORKSHEET
General Information Site Information
Analyst SGB Freeway/Dir of Travel I-275 EB
Agency or Company TEC Engineering Junction I-275 EB and NB SR-4
Date Performed 12/7/2015 Jurisdiction ODOT D08
Analysis Time Period PM Build Analysis Year 2037
Project Description I-275 & SR-4 IOS
Inputs
Upstream Adj Ramp
Yes On
No Off
Lup
= ft
Vu = veh/h
Freeway Number of Lanes, N 5
Ramp Number of Lanes, N 1
Acceleration Lane Length, LA 1500
Deceleration Lane Length LD
Freeway Volume, VF 7040
Ramp Volume, VR 380
Freeway Free-Flow Speed, SFF 55.0
Ramp Free-Flow Speed, SFR 35.0
Downstream Adj Ramp
Yes On
No Off
Ldown = ft
VD = veh/h
Conversion to pc/h Under Base Conditions
(pc/h)V
(Veh/hr)PHF Terrain %Truck %Rv fHV fp v = V/PHF x fHV x fp
Freeway 7040 0.94 Level 0 0 1.000 1.00 7489
Ramp 380 0.94 Level 0 0 1.000 1.00 404
UpStream
DownStream
Merge Areas Diverge Areas
Estimation of v12 Estimation of v12
V12
= VF ( P
FM )
LEQ
= (Equation 13-6 or 13-7)
PFM
= 0.167 using Equation (Exhibit 13-6)
V12 = 915 pc/h
V3 or V
av342276 pc/h (Equation 13-14 or 13-
17)
Is V3 or Vav34 > 2,700 pc/h? Yes No
Is V3 or V
av34 > 1.5 * V
12/2 Yes No
If Yes,V12a = 2186 pc/h (Equation 13-16, 13-18, or 13-19)
V12 = VR + (VF - VR)PFD
LEQ
= (Equation 13-12 or 13-13)
PFD = using Equation (Exhibit 13-7)
V12
= pc/h
V3 or V
av34 pc/h (Equation 13-14 or 13-17)
Is V3 or Vav34 > 2,700 pc/h? Yes No
Is V3 or V
av34 > 1.5 * V
12/2 Yes No
If Yes,V12a
= pc/h (Equation 13-16, 13-18, or 13-19)
Capacity Checks Capacity Checks
Actual Capacity LOS F? Actual Capacity LOS F?
VFO 5871 Exhibit 13-8 No
VF Exhibit 13-8
VFO = VF - VR Exhibit 13-8
VRExhibit 13-
10
Flow Entering Merge Influence Area Flow Entering Diverge Influence AreaActual Max Desirable Violation? Actual Max Desirable Violation?
VR12 2590 Exhibit 13-8 4600:All No V12 Exhibit 13-8
Level of Service Determination (if not F) Level of Service Determination (if not F)
DR = 5.475 + 0.00734 v
R + 0.0078 V
12- 0.00627 L
A
DR = 16.1 (pc/mi/ln)
LOS = B (Exhibit 13-2)
DR = 4.252 + 0.0086 V12 - 0.009 LD
DR = (pc/mi/ln)
LOS = (Exhibit 13-2)
Speed Determination Speed Determination
MS = 0.268 (Exibit 13-11)
SR= 51.5 mph (Exhibit 13-11)
S0= 50.9 mph (Exhibit 13-11)
S = 51.2 mph (Exhibit 13-13)
Ds = (Exhibit 13-12)
SR= mph (Exhibit 13-12)
S0= mph (Exhibit 13-12)
S = mph (Exhibit 13-13)
Copyright © 2015 University of Florida, All Rights Reserved HCS2010TM Version 6.70 Generated: 12/17/2015 10:26 AM
Page 1 of 1RAMPS AND RAMP JUNCTIONS WORKSHEET
12/17/2015file:///C:/Users/sbusam.TECENG/AppData/Local/Temp/r2k1A94.tmp

RAMPS AND RAMP JUNCTIONS WORKSHEET
General Information Site Information
Analyst SGB Freeway/Dir of Travel I-275 WB
Agency or Company TEC Engineering Junction I-275 WB and NB SR-4
Date Performed 12/7/2015 Jurisdiction ODOT D08
Analysis Time Period AM No-Build Analysis Year 2037
Project Description I-275 & SR-4 IOS
Inputs
Upstream Adj Ramp
Yes On
No Off
Lup
= 2100 ft
Vu = 660 veh/h
Freeway Number of Lanes, N 4
Ramp Number of Lanes, N 1
Acceleration Lane Length, LA 1500
Deceleration Lane Length LD
Freeway Volume, VF 5310
Ramp Volume, VR 290
Freeway Free-Flow Speed, SFF 55.0
Ramp Free-Flow Speed, SFR 35.0
Downstream Adj Ramp
Yes On
No Off
Ldown = ft
VD = veh/h
Conversion to pc/h Under Base Conditions
(pc/h)V
(Veh/hr)PHF Terrain %Truck %Rv fHV fp v = V/PHF x fHV x fp
Freeway 5310 0.94 Grade 0 0 1.000 1.00 5649
Ramp 290 0.94 Grade 0 0 1.000 1.00 309
UpStream 660 0.94 Grade 0 0 1.000 1.00 702
DownStream
Merge Areas Diverge Areas
Estimation of v12 Estimation of v12
V12
= VF ( P
FM )
LEQ
= (Equation 13-6 or 13-7)
PFM = 0.179 using Equation (Exhibit 13-6)
V12
= 1012 pc/h
V3 or Vav342318 pc/h (Equation 13-14 or 13-
17)
Is V3 or V
av34 > 2,700 pc/h? Yes No
Is V3 or Vav34 > 1.5 * V12/2 Yes No
If Yes,V12a
= 2259 pc/h (Equation 13-16, 13-
18, or 13-19)
V12
= VR + (V
F- V
R)P
FD
LEQ = (Equation 13-12 or 13-13)
PFD
= using Equation (Exhibit 13-7)
V12
= pc/h
V3 or V
av34 pc/h (Equation 13-14 or 13-17)
Is V3 or V
av34 > 2,700 pc/h? Yes No
Is V3 or Vav34 > 1.5 * V12/2 Yes No
If Yes,V12a
= pc/h (Equation 13-16, 13-18, or 13-19)
Capacity Checks Capacity Checks
Actual Capacity LOS F? Actual Capacity LOS F?
VFO 5958 Exhibit 13-8 No
VF Exhibit 13-8
VFO = VF - VR Exhibit 13-8
VR
Exhibit 13-10
Flow Entering Merge Influence Area Flow Entering Diverge Influence AreaActual Max Desirable Violation? Actual Max Desirable Violation?
VR12 2568 Exhibit 13-8 4600:All No V12 Exhibit 13-8
Level of Service Determination (if not F) Level of Service Determination (if not F)
DR = 5.475 + 0.00734 v R + 0.0078 V12 - 0.00627 LA
DR = 16.0 (pc/mi/ln)
LOS = B (Exhibit 13-2)
DR = 4.252 + 0.0086 V
12- 0.009 L
D
DR = (pc/mi/ln)
LOS = (Exhibit 13-2)
Speed Determination Speed Determination
MS = 0.267 (Exibit 13-11)
SR= 51.5 mph (Exhibit 13-11)
S0= 50.7 mph (Exhibit 13-11)
S = 51.1 mph (Exhibit 13-13)
Ds = (Exhibit 13-12)
SR= mph (Exhibit 13-12)
S0= mph (Exhibit 13-12)
S = mph (Exhibit 13-13)
Copyright © 2015 University of Florida, All Rights Reserved HCS2010TM Version 6.70 Generated: 12/17/2015 10:21 AM
Page 1 of 1RAMPS AND RAMP JUNCTIONS WORKSHEET
12/17/2015file:///C:/Users/sbusam.TECENG/AppData/Local/Temp/r2kC302.tmp

RAMPS AND RAMP JUNCTIONS WORKSHEET
General Information Site Information
Analyst SGB Freeway/Dir of Travel I-275 WB
Agency or Company TEC Engineering Junction I-275 WB and NB SR-4
Date Performed 12/7/2015 Jurisdiction ODOT D08
Analysis Time Period AM Build Analysis Year 2037
Project Description I-275 & SR-4 IOS
Inputs
Upstream Adj Ramp
Yes On
No Off
Lup
= 2100 ft
Vu = 660 veh/h
Freeway Number of Lanes, N 4
Ramp Number of Lanes, N 1
Acceleration Lane Length, LA 1500
Deceleration Lane Length LD
Freeway Volume, VF 5310
Ramp Volume, VR 290
Freeway Free-Flow Speed, SFF 55.0
Ramp Free-Flow Speed, SFR 35.0
Downstream Adj Ramp
Yes On
No Off
Ldown = ft
VD = veh/h
Conversion to pc/h Under Base Conditions
(pc/h)V
(Veh/hr)PHF Terrain %Truck %Rv fHV fp v = V/PHF x fHV x fp
Freeway 5310 0.94 Grade 0 0 1.000 1.00 5649
Ramp 290 0.94 Grade 0 0 1.000 1.00 309
UpStream 660 0.94 Grade 0 0 1.000 1.00 702
DownStream
Merge Areas Diverge Areas
Estimation of v12 Estimation of v12
V12
= VF ( P
FM )
LEQ
= (Equation 13-6 or 13-7)
PFM = 0.179 using Equation (Exhibit 13-6)
V12
= 1012 pc/h
V3 or Vav342318 pc/h (Equation 13-14 or 13-
17)
Is V3 or V
av34 > 2,700 pc/h? Yes No
Is V3 or Vav34 > 1.5 * V12/2 Yes No
If Yes,V12a
= 2259 pc/h (Equation 13-16, 13-
18, or 13-19)
V12
= VR + (V
F- V
R)P
FD
LEQ = (Equation 13-12 or 13-13)
PFD
= using Equation (Exhibit 13-7)
V12
= pc/h
V3 or V
av34 pc/h (Equation 13-14 or 13-17)
Is V3 or V
av34 > 2,700 pc/h? Yes No
Is V3 or Vav34 > 1.5 * V12/2 Yes No
If Yes,V12a
= pc/h (Equation 13-16, 13-18, or 13-19)
Capacity Checks Capacity Checks
Actual Capacity LOS F? Actual Capacity LOS F?
VFO 5958 Exhibit 13-8 No
VF Exhibit 13-8
VFO = VF - VR Exhibit 13-8
VR
Exhibit 13-10
Flow Entering Merge Influence Area Flow Entering Diverge Influence AreaActual Max Desirable Violation? Actual Max Desirable Violation?
VR12 2568 Exhibit 13-8 4600:All No V12 Exhibit 13-8
Level of Service Determination (if not F) Level of Service Determination (if not F)
DR = 5.475 + 0.00734 v R + 0.0078 V12 - 0.00627 LA
DR = 16.0 (pc/mi/ln)
LOS = B (Exhibit 13-2)
DR = 4.252 + 0.0086 V
12- 0.009 L
D
DR = (pc/mi/ln)
LOS = (Exhibit 13-2)
Speed Determination Speed Determination
MS = 0.267 (Exibit 13-11)
SR= 51.5 mph (Exhibit 13-11)
S0= 50.7 mph (Exhibit 13-11)
S = 51.1 mph (Exhibit 13-13)
Ds = (Exhibit 13-12)
SR= mph (Exhibit 13-12)
S0= mph (Exhibit 13-12)
S = mph (Exhibit 13-13)
Copyright © 2015 University of Florida, All Rights Reserved HCS2010TM Version 6.70 Generated: 12/17/2015 10:22 AM
Page 1 of 1RAMPS AND RAMP JUNCTIONS WORKSHEET
12/17/2015file:///C:/Users/sbusam.TECENG/AppData/Local/Temp/r2kC302.tmp

RAMPS AND RAMP JUNCTIONS WORKSHEET
General Information Site Information
Analyst SGB Freeway/Dir of Travel I-275 WB
Agency or Company TEC Engineering Junction I-275 WB and SB SR-4
Date Performed 12/7/2015 Jurisdiction ODOT D08
Analysis Time Period PM No-Build Constraint Analysis Year 2037
Project Description I-275 & SR-4 IOS
Inputs
Upstream Adj Ramp
Yes On
No Off
Lup
= 2100 ft
Vu = 290 veh/h
Freeway Number of Lanes, N 4
Ramp Number of Lanes, N 1
Acceleration Lane Length, LA 1500
Deceleration Lane Length LD
Freeway Volume, VF 5600
Ramp Volume, VR 647
Freeway Free-Flow Speed, SFF 55.0
Ramp Free-Flow Speed, SFR 35.0
Downstream Adj Ramp
Yes On
No Off
Ldown = ft
VD = veh/h
Conversion to pc/h Under Base Conditions
(pc/h)V
(Veh/hr)PHF Terrain %Truck %Rv fHV fp v = V/PHF x fHV x fp
Freeway 5600 0.94 Grade 0 0 1.000 1.00 5957
Ramp 647 0.94 Grade 0 0 1.000 1.00 688
UpStream 290 0.94 Grade 0 0 1.000 1.00 309
DownStream
Merge Areas Diverge Areas
Estimation of v12 Estimation of v12
V12
= VF ( P
FM )
LEQ
= (Equation 13-6 or 13-7)
PFM = 0.132 using Equation (Exhibit 13-6)
V12
= 785 pc/h
V3 or Vav342586 pc/h (Equation 13-14 or 13-
17)
Is V3 or V
av34 > 2,700 pc/h? Yes No
Is V3 or Vav34 > 1.5 * V12/2 Yes No
If Yes,V12a
= 2382 pc/h (Equation 13-16, 13-
18, or 13-19)
V12
= VR + (V
F- V
R)P
FD
LEQ = (Equation 13-12 or 13-13)
PFD
= using Equation (Exhibit 13-7)
V12
= pc/h
V3 or V
av34 pc/h (Equation 13-14 or 13-17)
Is V3 or V
av34 > 2,700 pc/h? Yes No
Is V3 or Vav34 > 1.5 * V12/2 Yes No
If Yes,V12a
= pc/h (Equation 13-16, 13-18, or 13-19)
Capacity Checks Capacity Checks
Actual Capacity LOS F? Actual Capacity LOS F?
VFO 6645 Exhibit 13-8 No
VF Exhibit 13-8
VFO = VF - VR Exhibit 13-8
VR
Exhibit 13-10
Flow Entering Merge Influence Area Flow Entering Diverge Influence AreaActual Max Desirable Violation? Actual Max Desirable Violation?
VR12 3070 Exhibit 13-8 4600:All No V12 Exhibit 13-8
Level of Service Determination (if not F) Level of Service Determination (if not F)
DR = 5.475 + 0.00734 v R + 0.0078 V12 - 0.00627 LA
DR = 19.7 (pc/mi/ln)
LOS = B (Exhibit 13-2)
DR = 4.252 + 0.0086 V
12- 0.009 L
D
DR = (pc/mi/ln)
LOS = (Exhibit 13-2)
Speed Determination Speed Determination
MS = 0.300 (Exibit 13-11)
SR= 51.1 mph (Exhibit 13-11)
S0= 50.4 mph (Exhibit 13-11)
S = 50.7 mph (Exhibit 13-13)
Ds = (Exhibit 13-12)
SR= mph (Exhibit 13-12)
S0= mph (Exhibit 13-12)
S = mph (Exhibit 13-13)
Copyright © 2015 University of Florida, All Rights Reserved HCS2010TM Version 6.70 Generated: 12/17/2015 10:23 AM
Page 1 of 1RAMPS AND RAMP JUNCTIONS WORKSHEET
12/17/2015file:///C:/Users/sbusam.TECENG/AppData/Local/Temp/r2k76A8.tmp

RAMPS AND RAMP JUNCTIONS WORKSHEET
General Information Site Information
Analyst SGB Freeway/Dir of Travel I-275 WB
Agency or Company TEC Engineering Junction I-275 WB and SB SR-4
Date Performed 12/7/2015 Jurisdiction ODOT D08
Analysis Time Period PM Build Analysis Year 2037
Project Description I-275 & SR-4 IOS
Inputs
Upstream Adj Ramp
Yes On
No Off
Lup
= 2100 ft
Vu = 290 veh/h
Freeway Number of Lanes, N 4
Ramp Number of Lanes, N 1
Acceleration Lane Length, LA 1500
Deceleration Lane Length LD
Freeway Volume, VF 5600
Ramp Volume, VR 660
Freeway Free-Flow Speed, SFF 55.0
Ramp Free-Flow Speed, SFR 35.0
Downstream Adj Ramp
Yes On
No Off
Ldown = ft
VD = veh/h
Conversion to pc/h Under Base Conditions
(pc/h)V
(Veh/hr)PHF Terrain %Truck %Rv fHV fp v = V/PHF x fHV x fp
Freeway 5600 0.94 Grade 0 0 1.000 1.00 5957
Ramp 660 0.94 Grade 0 0 1.000 1.00 702
UpStream 290 0.94 Grade 0 0 1.000 1.00 309
DownStream
Merge Areas Diverge Areas
Estimation of v12 Estimation of v12
V12
= VF ( P
FM )
LEQ
= (Equation 13-6 or 13-7)
PFM = 0.130 using Equation (Exhibit 13-6)
V12
= 775 pc/h
V3 or Vav342591 pc/h (Equation 13-14 or 13-
17)
Is V3 or V
av34 > 2,700 pc/h? Yes No
Is V3 or Vav34 > 1.5 * V12/2 Yes No
If Yes,V12a
= 2382 pc/h (Equation 13-16, 13-
18, or 13-19)
V12
= VR + (V
F- V
R)P
FD
LEQ = (Equation 13-12 or 13-13)
PFD
= using Equation (Exhibit 13-7)
V12
= pc/h
V3 or V
av34 pc/h (Equation 13-14 or 13-17)
Is V3 or V
av34 > 2,700 pc/h? Yes No
Is V3 or Vav34 > 1.5 * V12/2 Yes No
If Yes,V12a
= pc/h (Equation 13-16, 13-18, or 13-19)
Capacity Checks Capacity Checks
Actual Capacity LOS F? Actual Capacity LOS F?
VFO 6659 Exhibit 13-8 No
VF Exhibit 13-8
VFO = VF - VR Exhibit 13-8
VR
Exhibit 13-10
Flow Entering Merge Influence Area Flow Entering Diverge Influence AreaActual Max Desirable Violation? Actual Max Desirable Violation?
VR12 3084 Exhibit 13-8 4600:All No V12 Exhibit 13-8
Level of Service Determination (if not F) Level of Service Determination (if not F)
DR = 5.475 + 0.00734 v R + 0.0078 V12 - 0.00627 LA
DR = 19.8 (pc/mi/ln)
LOS = B (Exhibit 13-2)
DR = 4.252 + 0.0086 V
12- 0.009 L
D
DR = (pc/mi/ln)
LOS = (Exhibit 13-2)
Speed Determination Speed Determination
MS = 0.301 (Exibit 13-11)
SR= 51.1 mph (Exhibit 13-11)
S0= 50.4 mph (Exhibit 13-11)
S = 50.7 mph (Exhibit 13-13)
Ds = (Exhibit 13-12)
SR= mph (Exhibit 13-12)
S0= mph (Exhibit 13-12)
S = mph (Exhibit 13-13)
Copyright © 2015 University of Florida, All Rights Reserved HCS2010TM Version 6.70 Generated: 12/17/2015 10:24 AM
Page 1 of 1RAMPS AND RAMP JUNCTIONS WORKSHEET
12/17/2015file:///C:/Users/sbusam.TECENG/AppData/Local/Temp/r2k9CDD.tmp

Appendix C


HCS 2010 Signalized Intersection Results Summary
General Information Intersection InformationAgency Duration, h 0.25
Analyst Analysis Date 12/2/2015 Area Type Other
Jurisdiction Time Period PHF 0.92
Urban Street SR-4 Analysis Year 2015 Analysis Period 1> 7:00
Intersection SR-4 & I-275 WB File Name SR 4 & 275 WB AM 2037 No-Build Constrained.xus
Project Description 2037 AM No-Build Constraint
Demand Information EB WB NB SB
Approach Movement L T R L T R L T R L T R
Demand ( v ), veh/h 340 0 1330 715
Signal Information
GreenYellowRed
59.0 49.0 0.0 0.0 0.0 0.04.0 4.0 0.0 0.0 0.0 0.02.0 2.0 0.0 0.0 0.0 0.0
1 3 4
5 6 7 8
Cycle, s 120.0 Reference Phase 2
Offset, s 0 Reference Point End
Uncoordinated No Simult. Gap E/W On
Force Mode Fixed Simult. Gap N/S On
Timer Results EBL EBT WBL WBT NBL NBT SBL SBT
Assigned Phase 8 2 6
Case Number 9.0 8.0 8.0
Phase Duration, s 55.0 65.0 65.0
Change Period, ( Y+R c ), s 6.0 6.0 6.0
Max Allow Headway ( MAH ), s 3.1 0.0 0.0
Queue Clearance Time ( g s ), s 20.2
Green Extension Time ( g e ), s 0.7 0.0 0.0
Phase Call Probability 1.00
Max Out Probability 0.00
Movement Group Results EB WB NB SB
Approach Movement L T R L T R L T R L T R
Assigned Movement 3 18 2 6
Adjusted Flow Rate ( v ), veh/h 370 0 1446 777
Adjusted Saturation Flow Rate ( s ), veh/h/ln 1810 1610 1809 1809
Queue Service Time ( g s ), s 18.2 0.0 40.6 16.7
Cycle Queue Clearance Time ( g c ), s 18.2 0.0 40.6 16.7
Green Ratio ( g/C ) 0.41 0.41 0.49 0.49
Capacity ( c ), veh/h 739 657 1779 1779
Volume-to-Capacity Ratio ( X ) 0.500 0.000 0.813 0.437
Available Capacity ( c a ), veh/h 739 657 1779 1779
Back of Queue ( Q ), veh/ln ( 50 th percentile) 8.1 0.0 17.4 6.9
Queue Storage Ratio ( RQ ) ( 50 th percentile) 0.00 0.00 0.00 0.00
Uniform Delay ( d 1 ), s/veh 26.4 0.0 25.8 19.7
Incremental Delay ( d 2 ), s/veh 2.4 0.0 4.2 0.8
Initial Queue Delay ( d 3 ), s/veh 0.0 0.0 0.0 0.0
Control Delay ( d ), s/veh 28.8 0.0 30.0 20.5
Level of Service (LOS) C C C
Approach Delay, s/veh / LOS 0.0 28.8 C 30.0 C 20.5 C
Intersection Delay, s/veh / LOS 27.0 C
Multimodal Results EB WB NB SB
Pedestrian LOS Score / LOS 2.8 C 2.8 C 1.7 A 0.7 A
Bicycle LOS Score / LOS F 1.7 A 1.1 A
Copyright © 2015 University of Florida, All Rights Rese rved. HCS 2010™ Streets Version 6.70 Generated: 12/17/2015 9:59:54 AM

HCS 2010 Signalized Intersection Results Summary
General Information Intersection InformationAgency Duration, h 0.25
Analyst Analysis Date 12/2/2015 Area Type Other
Jurisdiction Time Period PHF 0.92
Urban Street SR-4 Analysis Year 2015 Analysis Period 1> 7:00
Intersection SR-4 & I-275 WB File Name SR 4 & 275 WB AM 2037 Build Constrained.xus
Project Description 2037 AM Build Constraint
Demand Information EB WB NB SB
Approach Movement L T R L T R L T R L T R
Demand ( v ), veh/h 340 0 1330 727
Signal Information
GreenYellowRed
59.0 49.0 0.0 0.0 0.0 0.04.0 4.0 0.0 0.0 0.0 0.02.0 2.0 0.0 0.0 0.0 0.0
1 3 4
5 6 7 8
Cycle, s 120.0 Reference Phase 2
Offset, s 0 Reference Point End
Uncoordinated No Simult. Gap E/W On
Force Mode Fixed Simult. Gap N/S On
Timer Results EBL EBT WBL WBT NBL NBT SBL SBT
Assigned Phase 8 2 6
Case Number 9.0 8.0 8.0
Phase Duration, s 55.0 65.0 65.0
Change Period, ( Y+R c ), s 6.0 6.0 6.0
Max Allow Headway ( MAH ), s 3.1 0.0 0.0
Queue Clearance Time ( g s ), s 20.2
Green Extension Time ( g e ), s 0.7 0.0 0.0
Phase Call Probability 1.00
Max Out Probability 0.00
Movement Group Results EB WB NB SB
Approach Movement L T R L T R L T R L T R
Assigned Movement 3 18 2 6
Adjusted Flow Rate ( v ), veh/h 370 0 1446 790
Adjusted Saturation Flow Rate ( s ), veh/h/ln 1810 1610 1809 1809
Queue Service Time ( g s ), s 18.2 0.0 40.6 17.0
Cycle Queue Clearance Time ( g c ), s 18.2 0.0 40.6 17.0
Green Ratio ( g/C ) 0.41 0.41 0.49 0.49
Capacity ( c ), veh/h 739 657 1779 1779
Volume-to-Capacity Ratio ( X ) 0.500 0.000 0.813 0.444
Available Capacity ( c a ), veh/h 739 657 1779 1779
Back of Queue ( Q ), veh/ln ( 50 th percentile) 8.1 0.0 17.4 7.1
Queue Storage Ratio ( RQ ) ( 50 th percentile) 0.00 0.00 0.00 0.00
Uniform Delay ( d 1 ), s/veh 26.4 0.0 25.8 19.8
Incremental Delay ( d 2 ), s/veh 2.4 0.0 4.2 0.8
Initial Queue Delay ( d 3 ), s/veh 0.0 0.0 0.0 0.0
Control Delay ( d ), s/veh 28.8 0.0 30.0 20.6
Level of Service (LOS) C C C
Approach Delay, s/veh / LOS 0.0 28.8 C 30.0 C 20.6 C
Intersection Delay, s/veh / LOS 27.0 C
Multimodal Results EB WB NB SB
Pedestrian LOS Score / LOS 2.8 C 2.8 C 1.7 A 0.7 A
Bicycle LOS Score / LOS F 1.7 A 1.1 A
Copyright © 2015 University of Florida, All Rights Rese rved. HCS 2010™ Streets Version 6.70 Generated: 12/17/2015 10:00:58 AM

HCS 2010 Signalized Intersection Results Summary
General Information Intersection InformationAgency Duration, h 0.25
Analyst Analysis Date 12/2/2015 Area Type Other
Jurisdiction Time Period PHF 0.92
Urban Street SR-4 Analysis Year 2015 Analysis Period 1> 7:00
Intersection SR-4 & I-275 EB File Name SR 4 & 275 EB AM 2037 No-build Constrained.xus
Project Description AM No-Build 2037 Constraint
Demand Information EB WB NB SB
Approach Movement L T R L T R L T R L T R
Demand ( v ), veh/h 810 270 640 1055
Signal Information
GreenYellowRed
56.5 50.5 0.0 0.0 0.0 0.04.0 4.0 0.0 0.0 0.0 0.02.5 2.5 0.0 0.0 0.0 0.0
1 3 4
5 6 7 8
Cycle, s 120.0 Reference Phase 2
Offset, s 0 Reference Point End
Uncoordinated No Simult. Gap E/W On
Force Mode Fixed Simult. Gap N/S On
Timer Results EBL EBT WBL WBT NBL NBT SBL SBT
Assigned Phase 4 2 6
Case Number 9.0 8.0 8.0
Phase Duration, s 57.0 63.0 63.0
Change Period, ( Y+R c ), s 6.5 6.5 6.5
Max Allow Headway ( MAH ), s 3.1 0.0 0.0
Queue Clearance Time ( g s ), s 25.2
Green Extension Time ( g e ), s 3.0 0.0 0.0
Phase Call Probability 1.00
Max Out Probability 0.00
Movement Group Results EB WB NB SB
Approach Movement L T R L T R L T R L T R
Assigned Movement 7 14 2 6
Adjusted Flow Rate ( v ), veh/h 880 293 696 1147
Adjusted Saturation Flow Rate ( s ), veh/h/ln 1757 1610 1809 1809
Queue Service Time ( g s ), s 23.2 15.5 15.1 29.5
Cycle Queue Clearance Time ( g c ), s 23.2 15.5 15.1 29.5
Green Ratio ( g/C ) 0.42 0.42 0.47 0.47
Capacity ( c ), veh/h 1479 678 1703 1703
Volume-to-Capacity Ratio ( X ) 0.595 0.433 0.408 0.673
Available Capacity ( c a ), veh/h 1479 678 1703 1703
Back of Queue ( Q ), veh/ln ( 50 th percentile) 9.7 6.1 6.3 12.5
Queue Storage Ratio ( RQ ) ( 50 th percentile) 0.00 0.34 0.00 0.00
Uniform Delay ( d 1 ), s/veh 26.9 24.6 20.8 24.6
Incremental Delay ( d 2 ), s/veh 1.8 2.0 0.7 2.1
Initial Queue Delay ( d 3 ), s/veh 0.0 0.0 0.0 0.0
Control Delay ( d ), s/veh 28.6 26.6 21.5 26.7
Level of Service (LOS) C C C C
Approach Delay, s/veh / LOS 28.1 C 0.0 21.5 C 26.7 C
Intersection Delay, s/veh / LOS 26.1 C
Multimodal Results EB WB NB SB
Pedestrian LOS Score / LOS 2.8 C 2.8 C 0.7 A 1.9 A
Bicycle LOS Score / LOS F 1.1 A 1.4 A
Copyright © 2015 University of Florida, All Rights Rese rved. HCS 2010™ Streets Version 6.70 Generated: 12/17/2015 10:05:24 AM
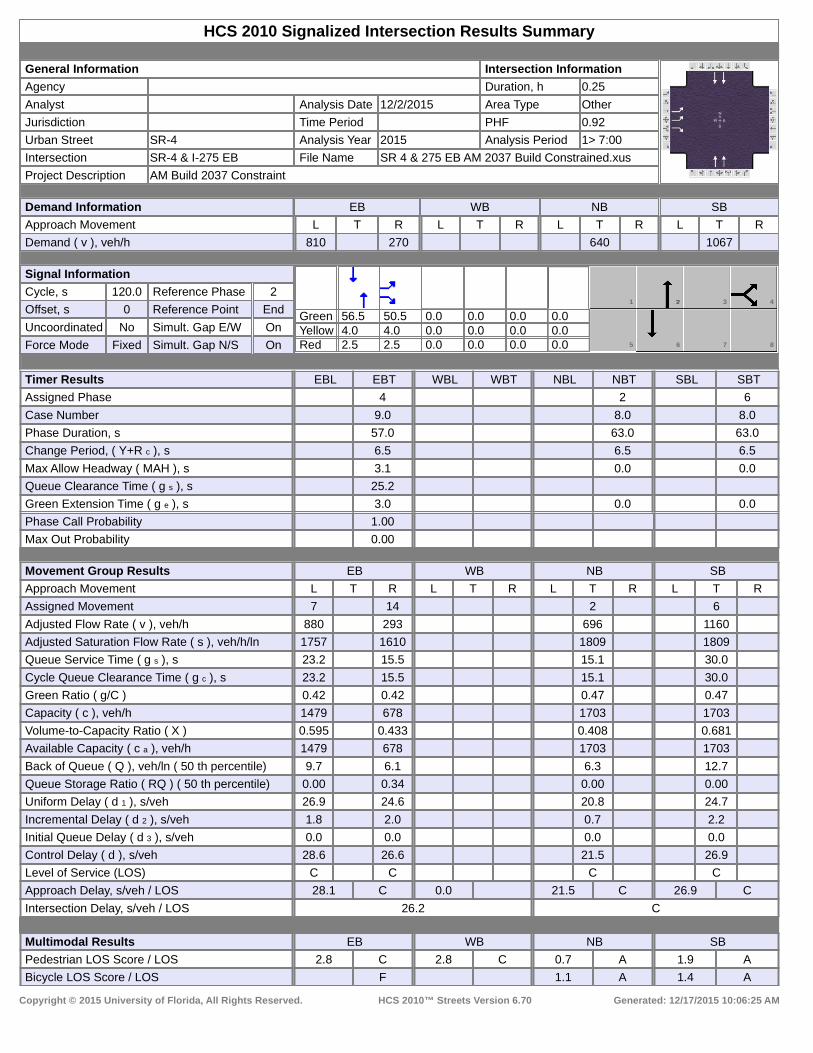
HCS 2010 Signalized Intersection Results Summary
General Information Intersection InformationAgency Duration, h 0.25
Analyst Analysis Date 12/2/2015 Area Type Other
Jurisdiction Time Period PHF 0.92
Urban Street SR-4 Analysis Year 2015 Analysis Period 1> 7:00
Intersection SR-4 & I-275 EB File Name SR 4 & 275 EB AM 2037 Build Constrained.xus
Project Description AM Build 2037 Constraint
Demand Information EB WB NB SB
Approach Movement L T R L T R L T R L T R
Demand ( v ), veh/h 810 270 640 1067
Signal Information
GreenYellowRed
56.5 50.5 0.0 0.0 0.0 0.04.0 4.0 0.0 0.0 0.0 0.02.5 2.5 0.0 0.0 0.0 0.0
1 3 4
5 6 7 8
Cycle, s 120.0 Reference Phase 2
Offset, s 0 Reference Point End
Uncoordinated No Simult. Gap E/W On
Force Mode Fixed Simult. Gap N/S On
Timer Results EBL EBT WBL WBT NBL NBT SBL SBT
Assigned Phase 4 2 6
Case Number 9.0 8.0 8.0
Phase Duration, s 57.0 63.0 63.0
Change Period, ( Y+R c ), s 6.5 6.5 6.5
Max Allow Headway ( MAH ), s 3.1 0.0 0.0
Queue Clearance Time ( g s ), s 25.2
Green Extension Time ( g e ), s 3.0 0.0 0.0
Phase Call Probability 1.00
Max Out Probability 0.00
Movement Group Results EB WB NB SB
Approach Movement L T R L T R L T R L T R
Assigned Movement 7 14 2 6
Adjusted Flow Rate ( v ), veh/h 880 293 696 1160
Adjusted Saturation Flow Rate ( s ), veh/h/ln 1757 1610 1809 1809
Queue Service Time ( g s ), s 23.2 15.5 15.1 30.0
Cycle Queue Clearance Time ( g c ), s 23.2 15.5 15.1 30.0
Green Ratio ( g/C ) 0.42 0.42 0.47 0.47
Capacity ( c ), veh/h 1479 678 1703 1703
Volume-to-Capacity Ratio ( X ) 0.595 0.433 0.408 0.681
Available Capacity ( c a ), veh/h 1479 678 1703 1703
Back of Queue ( Q ), veh/ln ( 50 th percentile) 9.7 6.1 6.3 12.7
Queue Storage Ratio ( RQ ) ( 50 th percentile) 0.00 0.34 0.00 0.00
Uniform Delay ( d 1 ), s/veh 26.9 24.6 20.8 24.7
Incremental Delay ( d 2 ), s/veh 1.8 2.0 0.7 2.2
Initial Queue Delay ( d 3 ), s/veh 0.0 0.0 0.0 0.0
Control Delay ( d ), s/veh 28.6 26.6 21.5 26.9
Level of Service (LOS) C C C C
Approach Delay, s/veh / LOS 28.1 C 0.0 21.5 C 26.9 C
Intersection Delay, s/veh / LOS 26.2 C
Multimodal Results EB WB NB SB
Pedestrian LOS Score / LOS 2.8 C 2.8 C 0.7 A 1.9 A
Bicycle LOS Score / LOS F 1.1 A 1.4 A
Copyright © 2015 University of Florida, All Rights Rese rved. HCS 2010™ Streets Version 6.70 Generated: 12/17/2015 10:06:25 AM


HCS 2010 Signalized Intersection Results Summary
General Information Intersection InformationAgency Duration, h 0.25
Analyst Analysis Date 12/2/2015 Area Type Other
Jurisdiction Time Period PHF 0.92
Urban Street SR-4 Analysis Year 2015 Analysis Period 1> 7:00
Intersection SR-4 & I-275 WB File Name SR 4 & 275 WB PM 2037 No-Build Constrained.xus
Project Description PM No-Build 2037 Constraint
Demand Information EB WB NB SB
Approach Movement L T R L T R L T R L T R
Demand ( v ), veh/h 440 0 1370 794
Signal Information
GreenYellowRed
58.0 50.0 0.0 0.0 0.0 0.04.0 4.0 0.0 0.0 0.0 0.02.0 2.0 0.0 0.0 0.0 0.0
1 3 4
5 6 7 8
Cycle, s 120.0 Reference Phase 2
Offset, s 0 Reference Point End
Uncoordinated No Simult. Gap E/W On
Force Mode Fixed Simult. Gap N/S On
Timer Results EBL EBT WBL WBT NBL NBT SBL SBT
Assigned Phase 8 2 6
Case Number 9.0 8.0 8.0
Phase Duration, s 56.0 64.0 64.0
Change Period, ( Y+R c ), s 6.0 6.0 6.0
Max Allow Headway ( MAH ), s 3.1 0.0 0.0
Queue Clearance Time ( g s ), s 27.1
Green Extension Time ( g e ), s 0.9 0.0 0.0
Phase Call Probability 1.00
Max Out Probability 0.00
Movement Group Results EB WB NB SB
Approach Movement L T R L T R L T R L T R
Assigned Movement 3 18 2 6
Adjusted Flow Rate ( v ), veh/h 478 0 1489 863
Adjusted Saturation Flow Rate ( s ), veh/h/ln 1810 1610 1809 1809
Queue Service Time ( g s ), s 25.1 0.0 43.4 19.4
Cycle Queue Clearance Time ( g c ), s 25.1 0.0 43.4 19.4
Green Ratio ( g/C ) 0.42 0.42 0.48 0.48
Capacity ( c ), veh/h 754 671 1749 1749
Volume-to-Capacity Ratio ( X ) 0.634 0.000 0.852 0.494
Available Capacity ( c a ), veh/h 754 671 1749 1749
Back of Queue ( Q ), veh/ln ( 50 th percentile) 11.3 0.0 18.9 8.1
Queue Storage Ratio ( RQ ) ( 50 th percentile) 0.00 0.00 0.00 0.00
Uniform Delay ( d 1 ), s/veh 27.8 0.0 27.2 21.0
Incremental Delay ( d 2 ), s/veh 4.0 0.0 5.5 1.0
Initial Queue Delay ( d 3 ), s/veh 0.0 0.0 0.0 0.0
Control Delay ( d ), s/veh 31.8 0.0 32.7 22.0
Level of Service (LOS) C C C
Approach Delay, s/veh / LOS 0.0 31.8 C 32.7 C 22.0 C
Intersection Delay, s/veh / LOS 29.3 C
Multimodal Results EB WB NB SB
Pedestrian LOS Score / LOS 2.8 C 2.8 C 1.7 A 0.7 A
Bicycle LOS Score / LOS F 1.7 A 1.2 A
Copyright © 2015 University of Florida, All Rights Rese rved. HCS 2010™ Streets Version 6.70 Generated: 12/17/2015 10:29:42 AM

HCS 2010 Signalized Intersection Results Summary
General Information Intersection InformationAgency Duration, h 0.25
Analyst Analysis Date 12/2/2015 Area Type Other
Jurisdiction Time Period PHF 0.92
Urban Street SR-4 Analysis Year 2015 Analysis Period 1> 7:00
Intersection SR-4 & I-275 WB File Name SR 4 & 275 WB PM 2037 Build.xus
Project Description PM Build 2037
Demand Information EB WB NB SB
Approach Movement L T R L T R L T R L T R
Demand ( v ), veh/h 440 0 1370 810
Signal Information
GreenYellowRed
58.0 50.0 0.0 0.0 0.0 0.04.0 4.0 0.0 0.0 0.0 0.02.0 2.0 0.0 0.0 0.0 0.0
1 3 4
5 6 7 8
Cycle, s 120.0 Reference Phase 2
Offset, s 0 Reference Point End
Uncoordinated No Simult. Gap E/W On
Force Mode Fixed Simult. Gap N/S On
Timer Results EBL EBT WBL WBT NBL NBT SBL SBT
Assigned Phase 8 2 6
Case Number 9.0 8.0 8.0
Phase Duration, s 56.0 64.0 64.0
Change Period, ( Y+R c ), s 6.0 6.0 6.0
Max Allow Headway ( MAH ), s 3.1 0.0 0.0
Queue Clearance Time ( g s ), s 27.1
Green Extension Time ( g e ), s 0.9 0.0 0.0
Phase Call Probability 1.00
Max Out Probability 0.00
Movement Group Results EB WB NB SB
Approach Movement L T R L T R L T R L T R
Assigned Movement 3 18 2 6
Adjusted Flow Rate ( v ), veh/h 478 0 1489 880
Adjusted Saturation Flow Rate ( s ), veh/h/ln 1810 1610 1809 1809
Queue Service Time ( g s ), s 25.1 0.0 43.4 19.9
Cycle Queue Clearance Time ( g c ), s 25.1 0.0 43.4 19.9
Green Ratio ( g/C ) 0.42 0.42 0.48 0.48
Capacity ( c ), veh/h 754 671 1749 1749
Volume-to-Capacity Ratio ( X ) 0.634 0.000 0.852 0.504
Available Capacity ( c a ), veh/h 754 671 1749 1749
Back of Queue ( Q ), veh/ln ( 50 th percentile) 11.3 0.0 18.9 8.3
Queue Storage Ratio ( RQ ) ( 50 th percentile) 0.00 0.00 0.00 0.00
Uniform Delay ( d 1 ), s/veh 27.8 0.0 27.2 21.2
Incremental Delay ( d 2 ), s/veh 4.0 0.0 5.5 1.0
Initial Queue Delay ( d 3 ), s/veh 0.0 0.0 0.0 0.0
Control Delay ( d ), s/veh 31.8 0.0 32.7 22.2
Level of Service (LOS) C C C
Approach Delay, s/veh / LOS 0.0 31.8 C 32.7 C 22.2 C
Intersection Delay, s/veh / LOS 29.3 C
Multimodal Results EB WB NB SB
Pedestrian LOS Score / LOS 2.8 C 2.8 C 1.7 A 0.7 A
Bicycle LOS Score / LOS F 1.7 A 1.2 A
Copyright © 2015 University of Florida, All Rights Rese rved. HCS 2010™ Streets Version 6.70 Generated: 12/17/2015 10:30:43 AM

HCS 2010 Signalized Intersection Results Summary
General Information Intersection InformationAgency Duration, h 0.25
Analyst Analysis Date 12/2/2015 Area Type Other
Jurisdiction Time Period PHF 0.92
Urban Street SR-4 Analysis Year 2015 Analysis Period 1> 7:00
Intersection SR-4 & I-275 EB File Name SR 4 & 275 EB PM 2037 No-build Constrained.xus
Project Description PM No-Build 2037 Constraint
Demand Information EB WB NB SB
Approach Movement L T R L T R L T R L T R
Demand ( v ), veh/h 400 140 1260 1234
Signal Information
GreenYellowRed
60.5 46.5 0.0 0.0 0.0 0.04.0 4.0 0.0 0.0 0.0 0.02.5 2.5 0.0 0.0 0.0 0.0
1 3 4
5 6 7 8
Cycle, s 120.0 Reference Phase 2
Offset, s 0 Reference Point End
Uncoordinated No Simult. Gap E/W On
Force Mode Fixed Simult. Gap N/S On
Timer Results EBL EBT WBL WBT NBL NBT SBL SBT
Assigned Phase 4 2 6
Case Number 9.0 8.0 8.0
Phase Duration, s 53.0 67.0 67.0
Change Period, ( Y+R c ), s 6.5 6.5 6.5
Max Allow Headway ( MAH ), s 3.1 0.0 0.0
Queue Clearance Time ( g s ), s 12.4
Green Extension Time ( g e ), s 1.4 0.0 0.0
Phase Call Probability 1.00
Max Out Probability 0.00
Movement Group Results EB WB NB SB
Approach Movement L T R L T R L T R L T R
Assigned Movement 7 14 2 6
Adjusted Flow Rate ( v ), veh/h 435 152 1370 1341
Adjusted Saturation Flow Rate ( s ), veh/h/ln 1757 1610 1809 1809
Queue Service Time ( g s ), s 10.4 7.7 36.2 35.1
Cycle Queue Clearance Time ( g c ), s 10.4 7.7 36.2 35.1
Green Ratio ( g/C ) 0.39 0.39 0.50 0.50
Capacity ( c ), veh/h 1362 624 1824 1824
Volume-to-Capacity Ratio ( X ) 0.319 0.244 0.751 0.735
Available Capacity ( c a ), veh/h 1362 624 1824 1824
Back of Queue ( Q ), veh/ln ( 50 th percentile) 4.4 3.0 15.2 14.7
Queue Storage Ratio ( RQ ) ( 50 th percentile) 0.00 0.17 0.00 0.00
Uniform Delay ( d 1 ), s/veh 25.7 24.9 23.7 23.4
Incremental Delay ( d 2 ), s/veh 0.6 0.9 2.9 2.7
Initial Queue Delay ( d 3 ), s/veh 0.0 0.0 0.0 0.0
Control Delay ( d ), s/veh 26.3 25.8 26.6 26.1
Level of Service (LOS) C C C C
Approach Delay, s/veh / LOS 26.2 C 0.0 26.6 C 26.1 C
Intersection Delay, s/veh / LOS 26.3 C
Multimodal Results EB WB NB SB
Pedestrian LOS Score / LOS 2.8 C 2.8 C 0.7 A 1.9 A
Bicycle LOS Score / LOS F 1.6 A 1.6 A
Copyright © 2015 University of Florida, All Rights Rese rved. HCS 2010™ Streets Version 6.70 Generated: 12/17/2015 10:32:06 AM

HCS 2010 Signalized Intersection Results Summary
General Information Intersection InformationAgency Duration, h 0.25
Analyst Analysis Date 12/2/2015 Area Type Other
Jurisdiction Time Period PHF 0.92
Urban Street SR-4 Analysis Year 2015 Analysis Period 1> 7:00
Intersection SR-4 & I-275 EB File Name SR 4 & 275 EB PM 2037 Build.xus
Project Description PM Build 2037
Demand Information EB WB NB SB
Approach Movement L T R L T R L T R L T R
Demand ( v ), veh/h 400 140 1260 1250
Signal Information
GreenYellowRed
60.5 46.5 0.0 0.0 0.0 0.04.0 4.0 0.0 0.0 0.0 0.02.5 2.5 0.0 0.0 0.0 0.0
1 3 4
5 6 7 8
Cycle, s 120.0 Reference Phase 2
Offset, s 0 Reference Point End
Uncoordinated No Simult. Gap E/W On
Force Mode Fixed Simult. Gap N/S On
Timer Results EBL EBT WBL WBT NBL NBT SBL SBT
Assigned Phase 4 2 6
Case Number 9.0 8.0 8.0
Phase Duration, s 53.0 67.0 67.0
Change Period, ( Y+R c ), s 6.5 6.5 6.5
Max Allow Headway ( MAH ), s 3.1 0.0 0.0
Queue Clearance Time ( g s ), s 12.4
Green Extension Time ( g e ), s 1.4 0.0 0.0
Phase Call Probability 1.00
Max Out Probability 0.00
Movement Group Results EB WB NB SB
Approach Movement L T R L T R L T R L T R
Assigned Movement 7 14 2 6
Adjusted Flow Rate ( v ), veh/h 435 152 1370 1359
Adjusted Saturation Flow Rate ( s ), veh/h/ln 1757 1610 1809 1809
Queue Service Time ( g s ), s 10.4 7.7 36.2 35.8
Cycle Queue Clearance Time ( g c ), s 10.4 7.7 36.2 35.8
Green Ratio ( g/C ) 0.39 0.39 0.50 0.50
Capacity ( c ), veh/h 1362 624 1824 1824
Volume-to-Capacity Ratio ( X ) 0.319 0.244 0.751 0.745
Available Capacity ( c a ), veh/h 1362 624 1824 1824
Back of Queue ( Q ), veh/ln ( 50 th percentile) 4.4 3.0 15.2 15.0
Queue Storage Ratio ( RQ ) ( 50 th percentile) 0.00 0.17 0.00 0.00
Uniform Delay ( d 1 ), s/veh 25.7 24.9 23.7 23.6
Incremental Delay ( d 2 ), s/veh 0.6 0.9 2.9 2.8
Initial Queue Delay ( d 3 ), s/veh 0.0 0.0 0.0 0.0
Control Delay ( d ), s/veh 26.3 25.8 26.6 26.4
Level of Service (LOS) C C C C
Approach Delay, s/veh / LOS 26.2 C 0.0 26.6 C 26.4 C
Intersection Delay, s/veh / LOS 26.5 C
Multimodal Results EB WB NB SB
Pedestrian LOS Score / LOS 2.8 C 2.8 C 0.7 A 1.9 A
Bicycle LOS Score / LOS F 1.6 A 1.6 A
Copyright © 2015 University of Florida, All Rights Rese rved. HCS 2010™ Streets Version 6.70 Generated: 12/17/2015 10:33:18 AM

Appendix D

INTER‐OFFICE COMMUNICATION
TO: Jennifer Elston, Pavement Engineer, District 8 FROM: Joshua Kieselbach, P.E., Transportation Engineer, Office of Statewide Planning &
Research, Modeling & Forecasting Section SUBJECT: HAM‐4‐10.00, PID 101575 DATE: November 25, 2015 In reply to a request dated September 16, 2015, the request for certified traffic has been completed. Attached are plates with 2017/2037 ADT, AM DHV, and PM DHV as well as a separate plate with truck factors. The K&D factors can be calculated from the plates. If you have any questions, please contact me at [email protected] or (614) 752‐5747. c: M. Byram, OSPR – G. Giaimo, OSPR – File

N
S
TATE OFOH
IO
DE
PA
RT
ME
NT
OF TRANS
PO
RT
TI
NO
A
PLATE 1 OF 4
PID 101575
HAM-4-10.00
4400/5230
4710/4
860
2150/2560
9310/9440
2480/2570
4850/5480
4090/4380
7330/8050
NOVEMBER 25, 2015 NOT TO SCALE
OFFICE OF STATEWIDE PLANNING & RESEARCH
OHIO DEPARTMENT OF TRANSPORTATION
2017/2037 ADT
HAM-4-10.00 PID 101575
14570/16220
18660/20600
12010/12360
26580/28580
22770/24030
11040/11
380
11420/11800
14160/14920
14020/14300
13900/14370
15440/16610
54540/62150
40590/46410
275
4

N
S
TATE OFOH
IO
DE
PA
RT
ME
NT
OF TRANS
PO
RT
TI
NO
A
PLATE 2 OF 4
PID 101575
HAM-4-10.00
1000/1080
5470/6240
4080/4660
NOVEMBER 25, 2015 NOT TO SCALE
OFFICE OF STATEWIDE PLANNING & RESEARCH
OHIO DEPARTMENT OF TRANSPORTATION
2017/2037 AM DHV
HAM-4-10.00 PID 101575
100/120
190/220
1220/126
0
520/54
0
1600/1780
320/340
1920/2120
1280/1330
2880/3110
2170/2250
260/270
740/810
1080/1110
640/640
1380/1450
1160/1180
1340/1380
1410/1480
4
275

N
S
TATE OFOH
IO
DE
PA
RT
ME
NT
OF TRANS
PO
RT
TI
NO
A
PLATE 3 OF 4
PID 101575
HAM-4-10.00
1220/1260
6190/7040
4650/5310
240/290
550/660
890/920
370/38
0
1500/1670
410/440
1910/2110
1330/1370
2830/3040
2240/2390
140/140
350/400
490/540
1210/1250
1570/1660
1590/1640
1350/1390
NOVEMBER 25, 2015 NOT TO SCALE
OFFICE OF STATEWIDE PLANNING & RESEARCH
OHIO DEPARTMENT OF TRANSPORTATION
2017/2037 PM DHV
HAM-4-10.00 PID 101575
1440/1580
4
275

N
S
TATE OFOH
IO
DE
PA
RT
ME
NT
OF TRANS
PO
RT
TI
NO
A
PLATE 4 OF 4
PID 101575
HAM-4-10.00
NOVEMBER 25, 2015 NOT TO SCALE
OFFICE OF STATEWIDE PLANNING & RESEARCH
OHIO DEPARTMENT OF TRANSPORTATION
2017/2037 T24 / AM TD / PM TD
HAM-4-10.00 PID 101575
0.07/0.04/0.04
0.12/0.17/0.05
0.04/0.10/0.03
0.10/0.1
0/0.06
0.03/0
.03/0.
02
0.08/0.05/0.07
0.04/0.04/0.02
0.03/0.03/0.01
0.07/0.12/0.04
0.09/0.05/0.05
4
275

INTER‐OFFICE COMMUNICATION
TO: Jennifer Elston, Pavement Engineer, District 8 FROM: Joshua Kieselbach, P.E., Transportation Engineer, Office of Statewide Planning &
Research, Modeling & Forecasting Section SUBJECT: HAM‐4‐10.00, PID 101575 DATE: December 9, 2015 In reply to a request dated December 4, 2015, the request for certified traffic has been completed. Attached is a plate with 2017/2037 ADT, AM DHV, and PM DHV. Design Designations are in the table below.
SR‐4 Crescentville Rd. Ray Norrish Dr. location north leg south leg east leg west leg
2017 ADT: 43430 44340 9980 4090 2037 ADT: 46740 47670 10230 4140
K: 0.11 0.11 0.11 0.11 2037 DHV: 5160 5430 1100 450
D: 0.60 0.52 0.75 0.51 T24: 0.06 0.07 0.04 0.03
AM TD: 0.06 0.12 0.05 0.01 PM TD: 0.03 0.04 0.02 0.01
Please note that this intersection was balanced with the previous submission dated November 25, 2015. Due to the access to properties east of SR‐4, the northbound direction of the south leg was not balanced exactly. It is believed that a reasonable difference between this intersection and the intersection of the westbound off‐ramp of I‐275 at SR‐4 would be expected. If you have any questions, please contact me at [email protected] or (614) 752‐5747. c: M. Byram, OSPR – G. Giaimo, OSPR – File

2130/2160
1960/1980
2017/20375 ADT
4150/4310
5830/5920
22
10/2
41
0
22
50/2
34
0
24
60/2
69
0
20
70/2
25
0
28
70/3
09
0
19
30/2
07
0
26
30/2
84
0
23
50/2
59
0
2017/2037 A.M. DHV 2017/2037 P.M. DHV
N
PLATE 1 OF 1
PID 101575
HAM-4-10.00S
TATE OFOH
IO
DE
PA
RT
ME
NT
OF TRANS
PO
RT
TI
NO
A
1370/1400
150/150
610/610
26
20/2
70
0
18
24
0/1
94
40
53
0/5
30
3160/3190
320/320
2350/2410
13
80/1
46
0
19
08
0/2
10
50
11
10/1
13
0
100/100
10/10
30/30
30
0/3
30
20
90/2
29
0
70/7
0
150/150
10/10
90/90
30
0/3
10
19
20/2
00
0
30/3
0
140/140
10/10
80/80
60/6
0
24
30/2
64
0
14
0/1
40
400/410
50/50
360/370
20
0/2
00
17
00/1
84
0
30/3
0
21
57
0/2
36
40
22
77
0/2
40
30
22
04
0/2
40
70
21
39
0/2
26
70
140/140
110/110
610/650
250/250
230/230
220/220
270/270
810/830
4 4 4
CRESCENTVILLE RD CRESCENTVILLE RD CRESCENTVILLE RD
DECEMBER 9, 2015 NOT TO SCALE
OFFICE OF STATEWIDE PLANNING & RESEARCH
OHIO DEPARTMENT OF TRANSPORTATION
2017/2037 ADT / AM DHV / PM DHV
HAM-4-10.00 PID 101575

Appendix E

59+0058+0054+00 57+0056+0055+00
59+00 61+0060+00 63+00
PC = 62+5062+00
64+00
MA
TC
HLIN
E
ST
A.
59
+00
MA
TC
HLIN
E
ST
A.
59
+00
N
ST
AT
E
RO
UT
E
4
ST
A
54
+0
0
TO
ST
A
64
+0
0
CA
LC
UL
AT
ED
CH
EC
KE
DH
AM-4-10.0
0LIG
HTIN
G
PL
AN
JC
DS
H:\
2015\
15
068
1\
DW
G\
Sheets\
101057
5_
LP001.d
gn 11/16/2015 1:2
5:1
5
PM
Him
es
33
27
0
40
20
10 HO
RIZ
ON
TA
L
SC
AL
E IN F
EE
T
STA 59+30.0, 60.5’ LT
PROP. 18" PULLBOX, 725.08
(3) NO. 4 AWG 5000 VOLT CABLES
PROP. 1 1/2" DUCT CABLE WITH
PERMANENT CONNECTIONS
EX. IN PULLBOX WITH (3) UNFUSED
CUT AND SPLICE PROP. CABLES TO
PERMANENT CONNECTIONS
EX. IN PULLBOX WITH (3) UNFUSED
CUT AND SPLICE PROP. CABLES TO
(3) NO. 4 AWG 5000 VOLT CABLES
PROP. 1 1/2" DUCT CABLE WITH
(3) NO. 4 AWG 5000 VOLT CABLES
PROP. 1 1/2" DUCT CABLE WITH
(3) NO. 4 AWG 5000 VOLT CABLES
PROP. 1 1/2" DUCT CABLE WITH
REMOVE EX. DUCT CABLE (TYP.)
REMOVE EX. DUCT CABLE (TYP.) REMOVE EX. PULLBOX
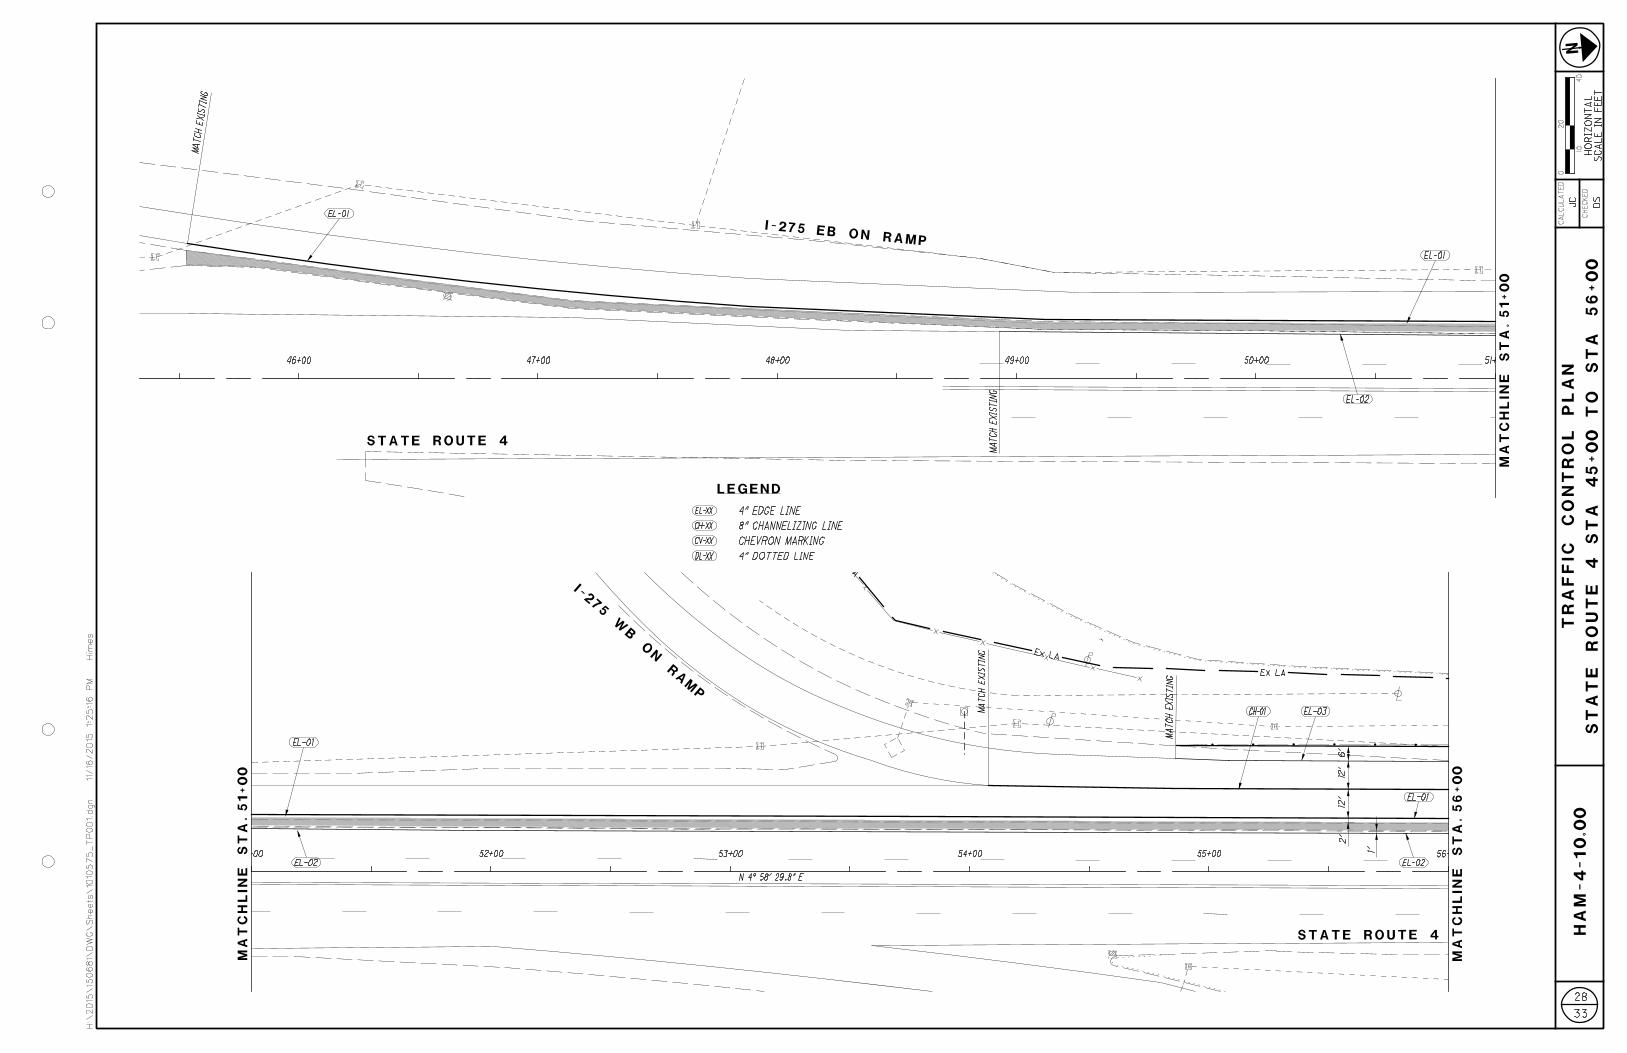
51+0050+0049+0048+0047+0046+00
53+0052+00 54+00 56+0055+0051+00
LEGEND
MA
TC
HLIN
E
ST
A.
51+00
MA
TC
HLIN
E
ST
A.
56
+00
MA
TC
HLIN
E
ST
A.
51+00
N
ST
AT
E
RO
UT
E
4
ST
A
45
+0
0
TO
ST
A
56
+0
0
CA
LC
UL
AT
ED
CH
EC
KE
DH
AM-4-10.0
0T
RA
FFIC
CO
NT
RO
L
PL
AN
JC
DS
H:\
2015\
15
068
1\
DW
G\
Sheets\
101057
5_
TP001.d
gn 11/16/2015 1:2
5:1
6
PM
Him
es
33
28
0
40
20
10 HO
RIZ
ON
TA
L
SC
AL
E IN F
EE
T
8" CHANNELIZING LINE
EL-XX
CH-XX
CV-XX
DL-XX 4" DOTTED LINE
4" EDGE LINE
CHEVRON MARKING
EL-01
EL-01
EL-02
STATE ROUTE 4
EL-01
EL-02
EL-01
EL-02
EL-03CH-01
STATE ROUTE 4
I-275
WB
ON
RA
MP
I-275 EB ON RAMP
2’
12’
12’
6’
1’
MATC
H E
XIS
TIN
G
MATC
H EXIS
TIN
G
MATC
H EXIS
TIN
G
MATC
H EXIS
TIN
G

LEGEND
MA
TC
HLIN
E
ST
A.
61+00
MA
TC
HLIN
E
ST
A.
56
+00
MA
TC
HLIN
E
ST
A.
61+00
MA
TC
HLIN
E
ST
A.
66
+00
N
ST
AT
E
RO
UT
E
4
ST
A
56
+0
0
TO
ST
A
66
+0
0
CA
LC
UL
AT
ED
CH
EC
KE
DH
AM-4-10.0
0T
RA
FFIC
CO
NT
RO
L
PL
AN
JC
DS
H:\
2015\
15
068
1\
DW
G\
Sheets\
101057
5_
TP002.d
gn 11/16/2015 1:2
5:1
8
PM
Him
es
33
29
0
40
20
10 HO
RIZ
ON
TA
L
SC
AL
E IN F
EE
T
2’
12’
12’
6’
1’
2’
12’
12’
6’
1’
12’
12’
12’
12’
8" CHANNELIZING LINE
EL-XX
CH-XX
CV-XX
DL-XX 4" DOTTED LINE
4" EDGE LINE
CHEVRON MARKING
(REMOVE)
STA 59+90
EX. M2-H4
(REMOVE)
STA 61+88
EX. GH-1 AND SUPPORT
EL-01
EL-02
EL-03 CH-01
STATE ROUTE 4
STATE ROUTE 4
ST
A 59+31.
0, 15.0’
LT
BE
GIN T
AP
ER
ST
A 61+
80.5, 20.5’
LT
EN
D T
AP
ER
CH-01EL-03
EL-01
EL-02
CH-02
CH-03
CV-01
CH-02
CH-03
CV-01
CH-01
CH-01
DL-01
STA 61+25
TC-12.30 DESIGN #12 SUPPORT
PROP. GH-1 LEVEL 3 (192" x 108")
59+0058+00 61+0060+0057+0056+00
61+00 63+00
PC = 62+5062+00
65+00
66+00
64+00

MA
TC
HLIN
E
ST
A.
66
+00
LEGEND
ST
AT
E
RO
UT
E
4
ST
A
66
+0
0
TO
ST
A
71+0
0
CA
LC
UL
AT
ED
CH
EC
KE
DH
AM-4-10.0
0T
RA
FFIC
CO
NT
RO
L
PL
AN
JC
DS
H:\
2015\
15
068
1\
DW
G\
Sheets\
101057
5_
TP003.d
gn 11/16/2015 1:2
5:2
0
PM
Him
es
33
30
0
40
20
10 HO
RIZ
ON
TA
L
SC
AL
E IN F
EE
T
STA 69+50
TC-16.21 DESIGN #X SUPPORT
(REMOVE)
STA 69+70
EX. GH-1 AND SUPPORT
48" x 60"
PROP. M2-H3
48" x 60"
PROP. M2-H3
72" x 48"
(MODIFIED)
PROP. M2-H3
STATE ROUTE 4
8" CHANNELIZING LINE
EL-XX
CH-XX
CV-XX
DL-XX 4" DOTTED LINE
4" EDGE LINE
CHEVRON MARKING
PT = 69+83.5
1
69+00
68+00
70+00 71+00
67+00
66+00