i//-3 n92-11340 unclas 0051753 techniqueforcalibratingangularmeasurement...
TRANSCRIPT

NASA Technical Memorandum 104148
(NASA-TM-104148) TECHNIQUE FOR CALISRATING
ANGULAR MEASUREMENT DEVICES WHEN CALIBRATION
STANDARDS ARE UNAVAILABLE (_ASA) 19 p
CSCL 14B
,GB/35
i//-3
N92-11340
Unclas
0051753
TECHNIQUEFOR CALIBRATINGANGULARMEASUREMENT
DEVICESWHENCALIBRATIONSTANDARDSARE
UNAVAILABLE
TOM D, FINLEY
AUGUST 1991
National Aeronautics andSpace Administration
Langley Research CenterHampton, Virginia 23665-5225
https://ntrs.nasa.gov/search.jsp?R=19920002122 2018-07-01T05:08:12+00:00Z

't"

ABSTRACT
A calibration technique is proposed that will allow the calibration of certainangular measurement devices without requiring the use of an absolute standard.The technique assumes that the device to be calibrated has deterministic bias errors.A comparison device must be available that meets the same requirements. The twodevices are compared; one device is then rotated with respect to the other and asecond comparison is performed. If the data are reduced using the techniquedescribed below, the individual errors of the two devices can be determined.
INTRODUCTION
All normal calibration techniques, whether for length, voltage, pressure, resis-tance, etc., involve the comparison of the test device against a measurement systemor standard of known accuracy. Standard practice requires that a measurementdevice must be compared to a calibrated standard having an accuracy at least fourtimes better than the test device (ref. 1). This requirement means that ultimately thestandard must be calibrated by another laboratory with higher accuracy devices untila national or international standards laboratory is reached.
This is not always possible and it is often desirable to be able to determine the
errors in a device when an adequate standard is not available. A technique has beendeveloped that allows the cahbration of angular measurement devices that havecertain types of errors. If a second similar device is av_lable for comparison, theerrors in the two devices can be determined without previous knowledge of theerrors in either device. If certain conditions are met, the technique described belowshows how to extract individual errors in the two devices.
A technique has been developed in which two angular measurement devices suchas protractors, inclinometers, encoders, resolvers, and Hirth couplings (ref. 2, 3) canbe compared and the individual errors extracted. The requirements are that bothunits be stable, the errors in each must be periodic, and a means must be available tocompare the two devices. The last requirement may be simple such as the case whentwo encoders are coupled together, and the comparison involves simply setting tlaeshafts at different angles and reading the outputs of the devices. In other cases, such
as the comparison of two Hirth couplings, an external device such as an autocollima-tor or an accelerometer may be required to monitor the difference between thedevices.
ANALYSIS
Assume two angular measurement devices are to be calibrated and that the errorsin both are repeatable and periodic. This means the error in the two devices can be
represented by:
e 1 = A 1 sin(O) + A 2sin(20) + A 3sin(30) + . . .
+ B 1 cos(O) + B 2 cos(20) + B 3 cos(30) + . . .
O)
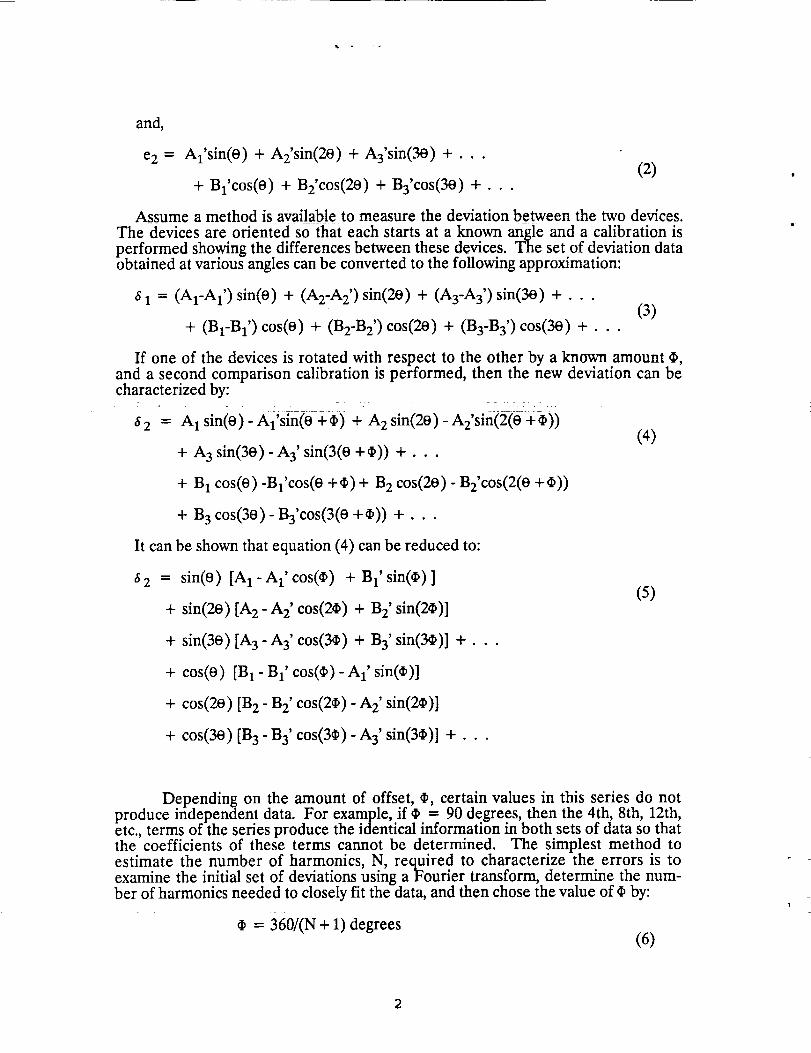
and,
e2 = Al'sin(0 ) + AE'sin(20 ) + A3'sin(30 ) + . . .
+ Bl'COS(0 ) + B2'cos(20 ) + B3'cos(30 ) + . . .(2)
Assume a method is available to measure the deviation between the two devices.
The devices are oriented so that each starts at a known angle and a calibration isperformed showing the differences between these devices. The set of deviation dataobtained at various angles can be converted to the following approximation:
S 1 = (A1-AI')sin(o) + (A2-AE') sin(20) + (A3-A3') sin(30) +...
+ (B1-BI') cos(O) + (BE-BE') cos(20) + (B3-B3') cos(30) + . . .
(3)
If one of the devices is rotated with respect to the other by a known amount _,
and a second comparison calibration is performed, then the new deviation can becharacterized by:
'_2 = Alsin(O)' gl'sin(0 +_) + A2 sin(20 ) - gE'sin(2(0 ÷_))(4)
+ A 3 sin(30) - A 3' sin(3(0 +_)) +...
+ B 1 cos(0) -Bl'COS(O +_) + B 2 cos(20) - B2'cos(2(0 +_))
+ B 3 cos(30) - B3'cos(3(0 +_)) + . . .
It can be shown that equation (4) can be reduced to:
6 2 = sin(0) [A 1 -A 1' cos(_) + B 1' sin(_) ]
+ sin(20) [A 2 - A 2' cos(2_) + B 2' sin(2_)](5)
+ sin(30) [A 3 - A 3' cos(3_) + B 3' sin(3_)] + . . .
+ cos(0) [B 1 - B 1' cos(C) - A 1' sin(_)]
+ cos(20) [B 2 - B 2' cos(2_) - A 2' sin(2_)]
+ cos(30) [B 3 - B 3' cos(3_) - A 3' sin(3_)] + . . .
Depending on the amount of offset, _, certain values in this series do notproduce independent data. For example, if ¢ = 90 degrees, then the 4th, 8th, 12th,etc., terms of the series produce the identical information in both sets of data so thatthe coefficients of these terms cannot be determined. The simplest method to
estimate the number of harmonics, N, required to characterize the errors is toexamine the initial set of deviations using aFourier transform, determine the num-ber of harmonics needed to closely fit the data, and then chose the value of • by:
= 360/(N + 1) degrees(6)
2

The technique works best when there are large changes in the patterns from thetwo sets of measured data. The maximum change occurs when the value of • is halfof the spacing between the most pronounced cycle of error. Even though selecting ahigh value for N allows the periodic data to be more precisely fit, care must be takennot to select N too large. If N is high then • is small and the shifts in the comparison
_natterns are slight and the error caused by small random variations becomes large.the calibration of angular devices N = 3 has been shown to work well. The
aa_proximation to the error sets is good, and setting _, = 90 degrees caused com_,:ler-le differences to appear between the two sets of data.
If we choose • = 90 and limit our approximation to the first three terms, theequation (5) can be simplified to:
62= (A 1 + BI' ) sin(O) + (A 2 +A2' ) sin(20) + (A 3 -B3' ) sin(30)
+ (B 1 -AI' ) cos(0) + (B E +B2' ) cos(20) + (B 3 + A3' ) cos(30)(7)
If the coefficients of equations (3) and (7) can be determined then the indivi;_ualvalues of the original error terms can be calculated. The coefficients of the se:z ofmeasured deviation data can be determined by Fourier analysis, least squares regres-sion, or numerical approximation to continuous Fourier coefficients. Once thesecoefficients are known, there are 12 equations and 12 unknowns which will permitsolving for the coefficients that characterize the errors of the two indwidualmeasurement devices.
SAMPLE CALIBRATION
A comparison was performed using two Hirth couplings, each having a manufac-turer's accuracy specification of less than 1 arc second, as the test devices and aprecision servo accelerometer as an indicator of deviation. The data are shown intable 1. The second set of data, taken with device 2 shifted 90 degrees, appears incolumn 3 of table 1.
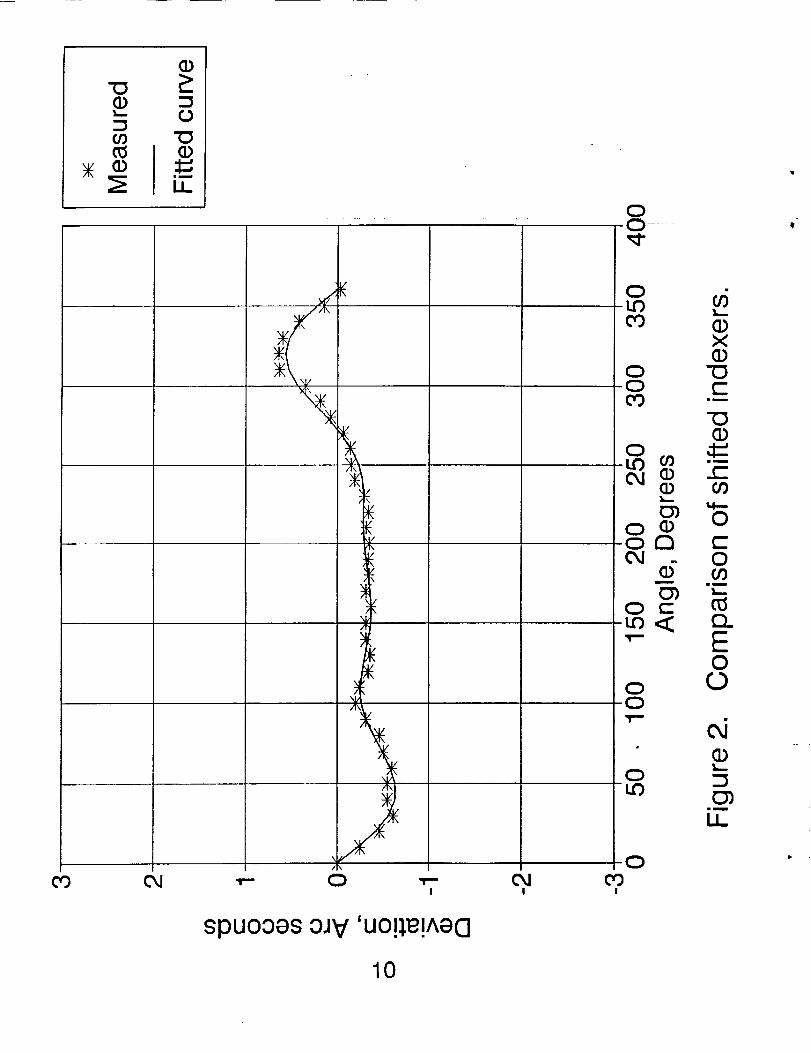
The initial set of data was approximated by a discrete Fourier transform algo-rithm. The first three terms of the series fit the data with a standard deviation of .06seconds (see figure 1). The second series was also fit and the standard deviation wasalso .06 seconds (see figure 2).
The following equations represent the fitted curves. Note that the zero frequencycomponent is included here although it has no meaning since the zero on the divid-ers is arbitrary.
s 1 = .2889 + (-.1556)sin(O) + (1.3389)sin(20) + (-.0111)sin(30)
+ (-.0889)cos(O) + (-.2833)cos(20) + (.1500)cos(30)(8)
6 2 = -.1769 + (-.2895)sin(0) + (-.2929)sin(20) + (-.1476)sin(30)
+ (.1799) cos(0) + (.0019) cos(20) + (-.0091) cos(3O)(9)
3
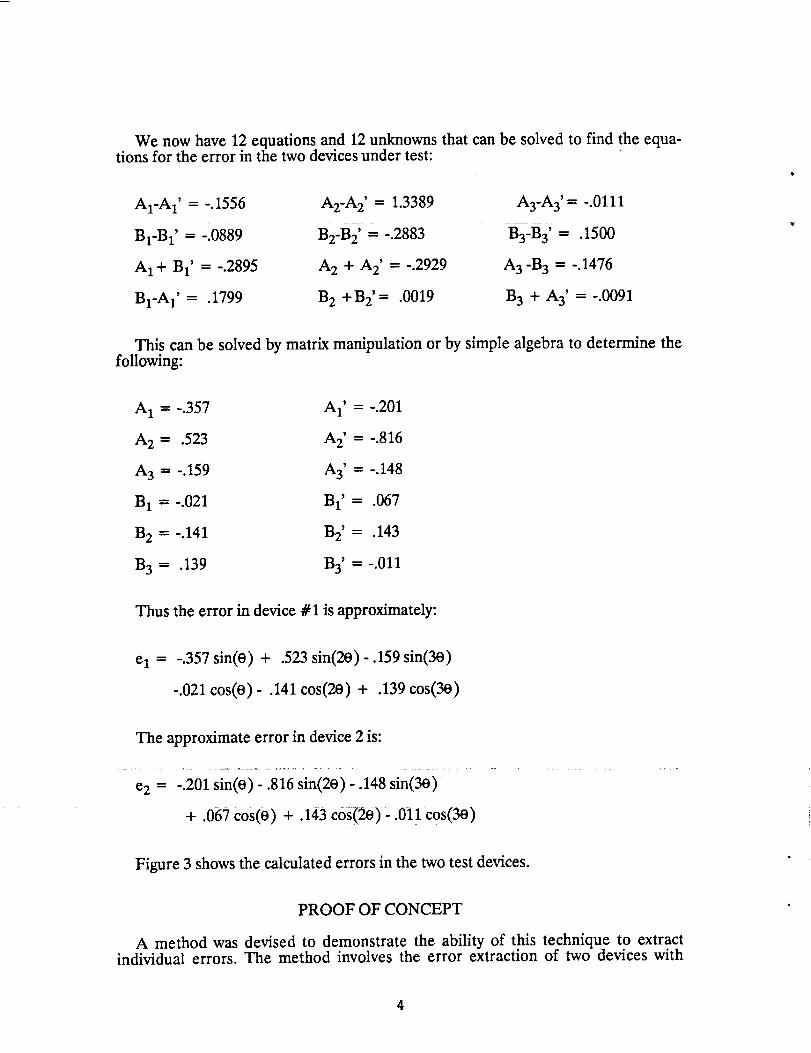
We now have 12 equations and 12 unknowns that can be solved to find the equa-tions for the error in the two devices under test:
A1-A 1' = -.1556
B1-B 1' = -.0889
A 1 + B 1' = -.2895
B1-A 1' = .1799
A2-A2' = 1.3389
B2-B 2' = '.2883
A 2 + A 2' = -.2929
B 2 +B2'= .0019
A3-A 3' = -.0111
B3-B 3' = .1500
A 3 -B 3 = -.1476
B 3+A 3' =-.0091
This can be solved by matrix manipulation or by simple algebra to determine thefollowing:
A 1 - -.357 A 1' = -.201
A 2 = .523 A 2' = -.816
A 3 = -.159 A 3' = -.148
B 1 -- -.021 B 1' = .067
B 2 = -.141 B 2' = .143
B 3 = .139 B 3' = -.011
Thus the error in device # 1 is approximately:
e I = -.357 sin(0) + .523 sin(20) -.159 sin(30)
-.021 cos(0) - .141 cos(20) + .139 cos(30)
The approximate error in device 2 is:
e 2 = -.201 sin(o) - .816 sin(2o) -. 148 sin(3o)
+ .067 cos(e) + .143 cos(2o) -.011 cos(3o)
Figure 3 shows the calculated errors in the two test devices.
PROOF OF CONCEPT
A method was devised to demonstrate the ability of this technique to extractindividual errors. The method involves the error extraction of two devices with
4
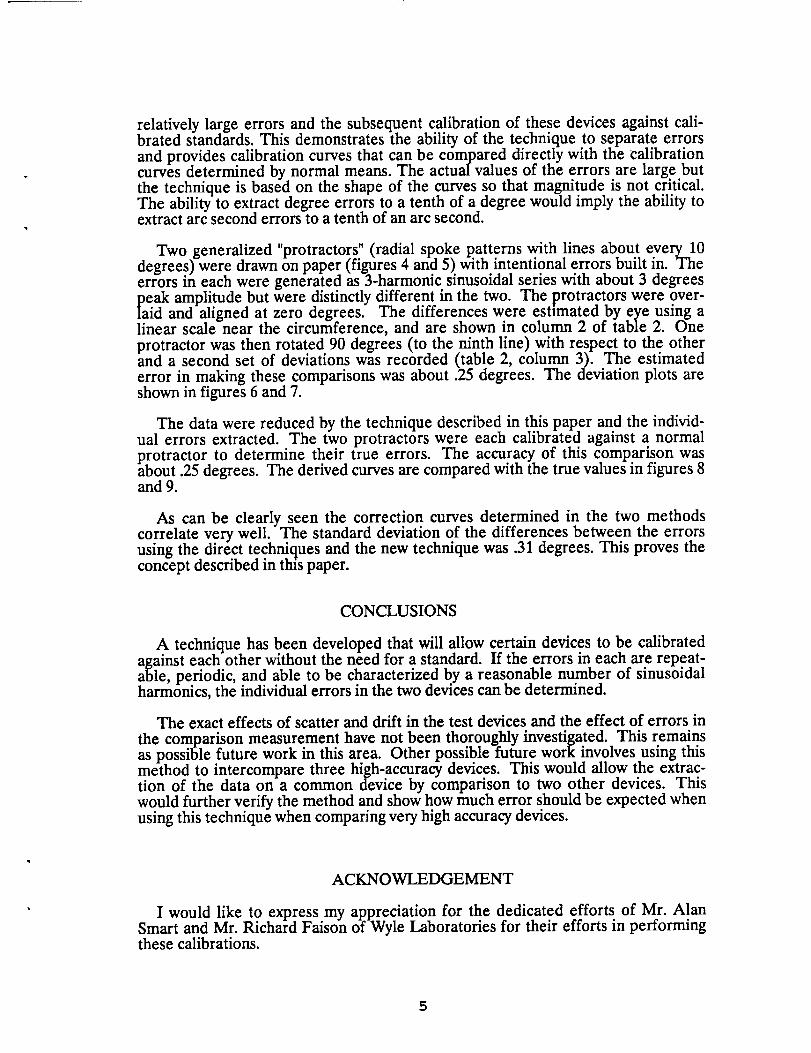
relatively large errors and the subsequent calibration of these devices against cali-brated standards. This demonstrates the ability of the technique to separate errorsand provides calibration curves that can be compared directly with the calibrationcurves determined by normal means. The actual values of the errors are large butthe technique is based on the shape of the curves so that magnitude is not critical.The ability to extract degree errors to a tenth of a degree would imply the ability toextract arc second errors to a tenth of an arc second.
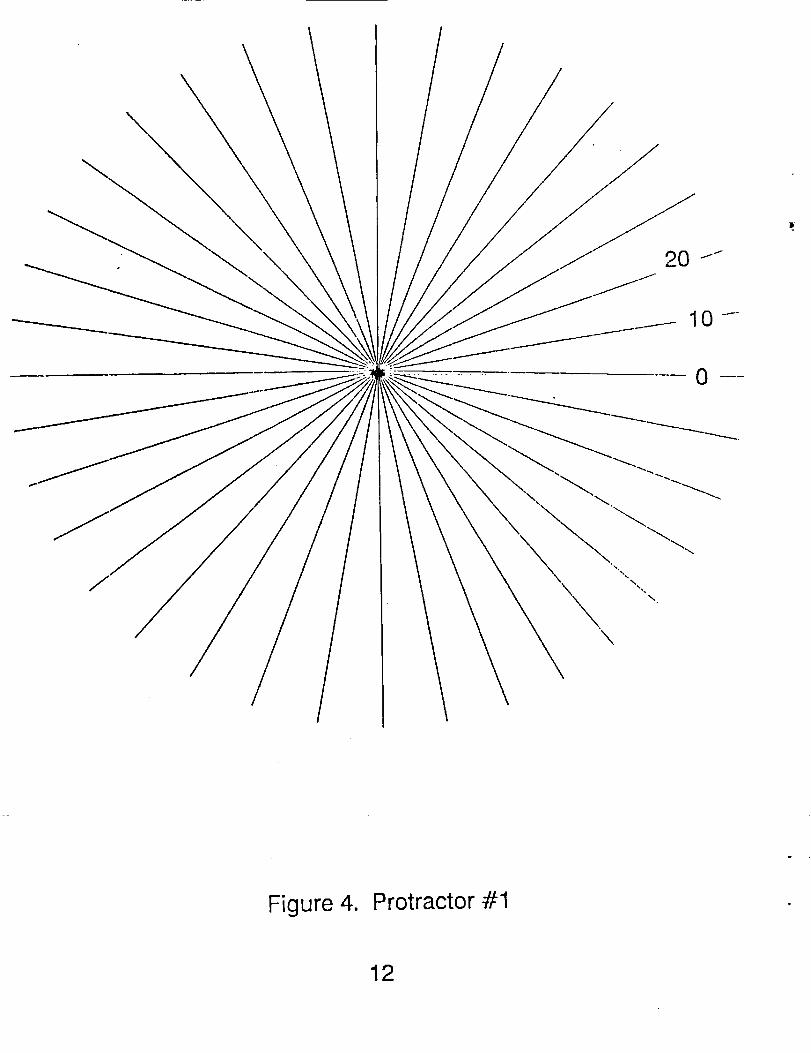
Two generalized "protractors" (radial spoke patterns with lines about every 10degrees) were drawn on paper (figures 4 and 5) with intentional errors built in. Theerrors in each were generated as 3-harmonic sinusoidal series with about 3 degrees_aeak amplitude but were distinctly different in the two. The protractors were over-
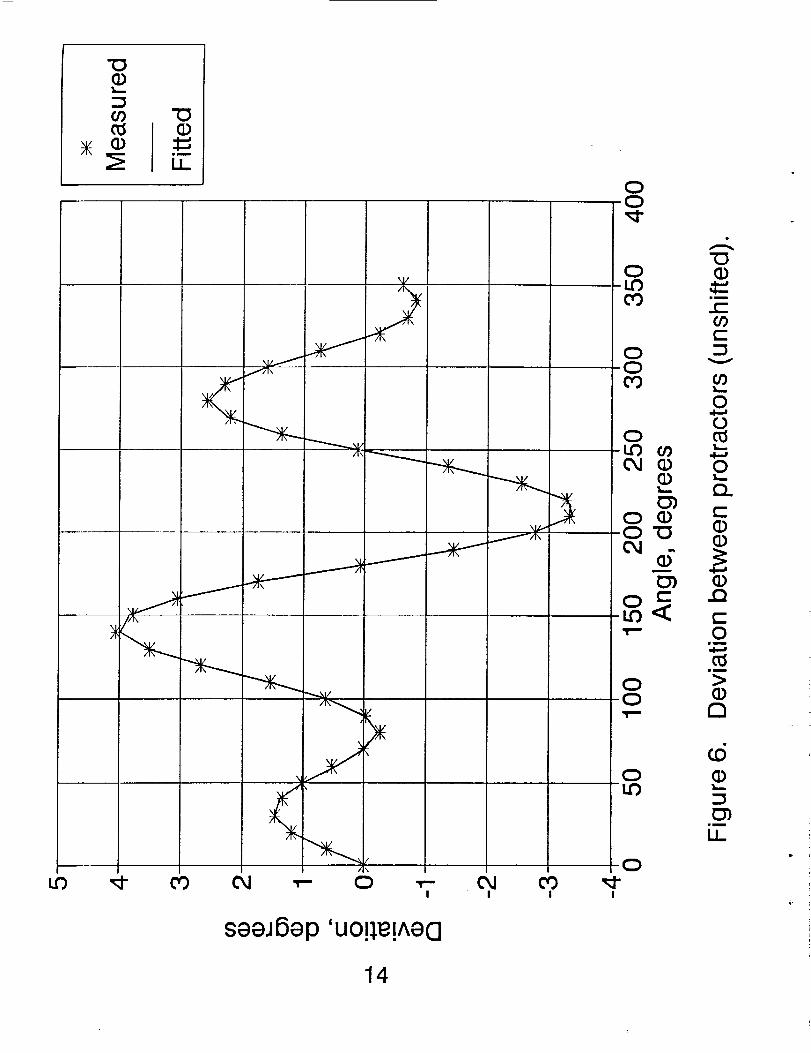
id and aligned at zero degrees. The differences were esUmated by eye using alinear scale near the circumference, and are shown in column 2 of table 2. Oneprotractor was then rotated 90 degrees (to the ninth line) with respect to the otherand a second set of deviations was recorded (table 2, column 3). The estimatederror in making these comparisons was about .25 degrees. The deviation plots areshown in figures 6 and 7.
The data were reduced by the technique described in this paper and the individ-ual errors extracted. The two protractors were each calibrated against a normalprotractor to determine their true errors. The accuracy of this comparison wasabout .25 degrees. The derived curves are compared with the true values in figures 8and 9.
As can be clearly seen the correction curves determined in the twomethodscorrelate very well. The standard deviation of the differences between the errorsusing the direct techniques and the new technique was .31 degrees. This proves theconcept described in this paper.
CONCLUSIONS
A technique has been developed that will allow certain devices to be calibratedagainst each other without the need for a standard. If the errors in each are repeat-able, periodic, and able to be characterized by a reasonable number of sinusoidalharmonics, the individual errors in the two devices can be determined.
The exact effects of scatter and drift in the test devices and the effect of errors in
the comparison measurement have not been thoroughly investigated. This remainsas possible future work in this area. Other possible future work involves using thismethod to intercompare three high-accuracy devices. This would allow the extrac-tion of the data on a common device by comparison to two other devices. Thiswould further verify the method and show how much error should be expected whenusing this technique when comparing very high accuracy devices.
ACKNOWLEDGEMENT
I would like to express my appreciation for the dedicated efforts of Mr. AlanSmart and Mr. Richard Faison of Wyle Laboratories for their efforts in performingthese calibrations.
5
REFERENCES
(1) Safety, Reliability, Maintainability and Quality Provision for the SpaceShuttle, NHB 5300.4 (ID-2), 1979.
(2) Handbook of Dimensional Measurement, Metrology and Inspection Journal,(May 1978).
(3) Francis T. Farago, Handbook of Dimensional Measurements, Second Edition.Industrial Press, Inc., New York, 1982.
6

w
Reference angle
0
deviation (see)
(Phi = 0)0.00
deviation (see)
(Phi = 90)0.00
10 0.44 -0.26
20 0.95 -0.47
30 1.29 -0.62
40 1.28 -0.55
50 1.27 -0.55
60 1.24 -0.60
70 1.08 -0.51
80 0.82 -0.47
90 0.47 -0.32
100 0.05 -0.20
110 -0.40 -0.25
120 -0.72 -0.34
130 -0.91 -0.36
140 -0.96 -0.32
150 -0.96 -0.32
160 -0.84 -0.37
170 -0.50 -0.32
180 -0.09 -0.35
190 0.39 -0.34
200 0.85 -0.35
210 1.45 -0.32
220 1.89 -0.34
230 1.96 -0.30
240 2.00 -0.19
250 1.66 -0.15
260 1.29 -0.14
270 0.73 -0.07
280 0.10 0.07
2-90 -0.44 0.18
300 -0.72 0.34
310 -0.92 0.63
320 -1.10 0.64
330 -1.02 0.59
340 -0.82 0.42
350 -0.43 0.14
Table 1. Deviation between Hirth couplers.
7

Reference angle
(deg)0
deviation, Phi= 0
(deg)0.00
deviation, Phi= 90
(deg)0.00
10 0.61 0.49
20 1.19 0.83
30 1.45 1.20
40 1.33 1.17
50 1.02 1.00
60 0.52 0.43
70 0.00 -0.29
80 -0.26 -0.91
90 -0.03 -1.46
100 0.64 -1.83
110 1.54 -1.83
120 2.67 -1.37
130 3.51 -0.71
140 4.06 0.03
150 3.77 0.46
160 3.05 0.63
170 1.74 0.29
180 0.06 -0.54
190 -1.45 -1.51
200 -2.78 -2.71
210 -3.34 -3.69
220
230
240
250
26O
270
280
290
300
-1.36
0.12
1.36
2.20
2.58
2.29
1.60
0.73310
-4.46
-4.83
-4.57
-3.86
-3.09
-2.17
-1.31
-0.71
-0.40
-0.23
320 °0.23 -0.34
330 -0.70 -0.49
340 -0.81 -0.54
350 -0.61 -0.46
Table 2. Deviation between protractor readings.
8

O
_- O
09 "_
OO
cO
/ \
f
O4I I
O
CO
OOCO
O4 (9O
(Do°oOJ
i
O r-
"T"--
O
0-I..0
0CO
I
spuooes oJV 'uo!_e!Ae(3
0_L_
X0
-0C
iii
io0
c-ogc-
O
c-Oor)
ID
OiE0C)
.Iii.
0
0%wi
Ii
9
],,=_
cO
/
\
__//\
\!
7_
)CN ,-- 0 ,-- Ckl
! !
spuooes oJv 'UO!I_!AaO
0
0LOCO
00
Or)
(1)
_oo
0-0
0
-0
!
r_©X
"0C
-0(I)
c-oo
0
c-O0gL_
C)_
E00
cJ(I)
gl
U_
10

0Im
G)[3
OJ
(1)0
Im
4- a)E3
CO 04 ,'-
++
++
I+
Y_
)K
4-
_++ )K
4-4-I
4-4-+
+I )K_+
)K
I V\
0
I++
++
)K
)K
)K
)K
++
+
4+
+
I
,-- 04I I
spuooes oJV 'JoJJq
11
0-0
o c6-LO _-O3 X
"O0 .__.
-0O3
'13u_
0 .>-
- 0
,,r- o
1,,,,,,,
0 ILl-0
c5(1)
0LO
ii
U_
-003
!
f10--
\
\
/
Figure 4. Protractor #1
12

._--10--
\
\
Figure 5. Protractor #2
13
u3
"0(1)
j_
J\
mI
¢kl _-- 0I
seaJSep 'uo!_e!Ae£1
C_!
COI
0-0
14
0-Lt_
CO
00CO
0t.O co0_1 (1)
(1),&,.,.
0 (1)0"0
c_cym
0-0
'T"'
0t f)
-0,,:$
I
,.-:,
(1)
ii
c-o')(.-
v
I,,,.
0(D
0
(..)
c-(D(1)
..Q
c-O
w_
c_
C_ii
EL

co "13
LO _" CO
/A\
X
seeJ6ep 'UOp,I_!AeC!
COI !
O
O
CO
.,-:,09(1)(D
(D
OOb
(D
im
J::o9
v
09O
OCO ._,
_ Ckl _ 0CD
00 _ _-
"(3 EL
0J _ c--- (I)
o<
c-
O .0
im
>
00
(D
im
LO LLI
15

(1) "O(D
O
\
! I !
O
O _-O
O
O O
(D O')
o_ "_
oJ . iw
O') O
m
(f)O
Oif)
seaJBap 'J0JJ3_
O•a" I_
! !
(i.)
mn
!1
16

(1) "O._ (D
!
I I I I
seeJBep 'JOJJ3
0-0
0-LDCO
0-0CO
17
O3
=m
m
0
000
m
¢.t)(Drr"
(:5").m
Ii
0-0
0LO
I

Report Documentation PageNaTi{3ria_t_'L'I'_OtCS and
1. Report No.
NASA TM-104148
4. Title and Subtitle
2. Government Accession No.
Technique for Calibrating Angular Measurement DevicesWhen Calibration Standards are Unavailable
, =7, Author(s)
Torn D. Finley
9, Performing Organization Name and Address
NASA Langley Research CenterHampton, VA 23665-5225
3. Recipient's Catalog No.
5. Report Date
August 19916. Performing Organization Code
12, Sponsoring Agency Name and Address
National Aeronautics and Space AdministrationWashington, DC 20546-0001
8.' Performing Organization Report No.
10. Work Unit No.
992-35-12-1811. Contract or Grant No.
13. Type of Report and Period Covered
Technical Memorandum14. Sponsoring Agency Code
15. Supplementary Notes
16. Abstract
A calibration technique is proposed that will allow the calibration of certain angular measurementdevices without requiring the use of an absolute standard. The technique assumes that the device tobe calibrated has deterministic bias errors. A comparison device must be available that meets thesame requirements. The two devices are compared; one device is then rotated with respect to theother, and a second comparison is performed. If the data are reduced using the technique describedbelow, the individual errors of the two devices can be determined.
17. Key Words (Suggested by Author(s))
CalibrationStandardsAngular Measurements
19. Security Classif, (of this report)
Unclassified
18. Distribution Statement
Unclassified--Unlimited
Subject Category 35
20. Security Classif. (of this page)
Unclassified
21. No, of pages
18
22. Price
A03
NASA FORM 1626 OCT 86