i: 6==gr sharma formating jo -...
TRANSCRIPT

1 Graduate Trainee, NBFIRA, Gaborone, Botswana2 Corresponding author, Department of Business, Management& Entrepreneurship,
Botswana International University of Science & Technology (BIUST), P/Bag 16, Palapye,Botswana, E-mail:[email protected]/[email protected]
3 Department of Economics, Faculty of Social Sciences, University of Botswana, P/Bag UB00705, Gaborone, Botswana
4 Professor, Centre for Management, Entrepreneurship & General Education, BIUST, Palapye
IDR : VOL. 14, NO. 2, ( JULY-DECEMBER, 2016) : 97-120 |ISSN : 0972-9437|
THE DETERMINANTS OF FINANCIALPERFORMANCE OF NON-BANK FINANCIAL
INSTITUTIONS IN BOTSWANA
Naledi Chikuba1, James Sharka Juana2, Mogale M. Ntsosa3 andLone Ketsitlile4
ABSTRACT
Both non-bank financial institutions and commercial banks play a key role inachieving a stable and sound financial system in an economy of a country. Thisstudy investigates the determinants of non-bank financial institutions financialperformance in Botswana. The analysis used balanced panel data of 30 non-bank financial institutions for the period of 2010-2014. The non-bank financialinstitutions’ financial performance is estimated using both panel random effectsmethod and the Three-Stage-least-squares dynamic model. Return on Assets isused as a proxy for financial performance, whereas capital adequacy, managementefficient, firm size, retained profits from the previous year and macro-economicvariables of Inflation and GDP growth rate have been used as independentvariables. In summary, the empirical results confirm that capital adequacy,management efficiency and inflation have a negative and significant influenceon the financial performance of non-bank financial institutions; while retainedprofits from the previous year have a positive and significant effect on financialperformance. A non-linear relationship between firm size and financialperformance was revealed in the results; however it displayed a non-significantimpact.
1. INTRODUCTION
The financial sector plays a significant role in providing important financialservices to the public, such as savings, loans, and insurance (Sutton andJenkins, 2007). The financial sector is divided into banking sector and non-bank financial sub-sectors. The main focus of this article is on the
98 FRANCIS NATHAN OKURUT, NARAYANA, N., LERATO MAHAMO AND et al.
determinants of the financial performance of the Non-bank financial sectorin Botswana. Non-bank financial institutions (NBFIs) are companies thatcarry out a variety of financial activities of a commercial bank withoutmeeting the legal description of a bank (Saunders & Cornett, 2011).According to the Bank of Botswana Banking Act of 2005, an NBFI is definedas a financial institution that is not legally allowed to accept deposits fromthe public and does not have a full banking license. They aid in the growthof the economy by broadening access to external finance by institutionsneed them most at minimal cost (Mugume, 2008).
Both Non-bank and commercial bank financial intermediation are keyfeatures of a stable and sound financial sector. While commercial banksoffer a set of financial services as a bundled deal, NBFIs unbundle andshape these financial services in order to be able to meet the requirementsof specific clients (Ongeri, 2014). Financial performance refers to how wella firm utilises its resources to give returns to its investors’ (Ongeri, 2014).It can be measured by the Return on Assets (ROA) or the Return-On-CapitalEmployed (ROCE). Al-Tamimi, (2010) and Aubrime, (2005) argued that thedeterminants of non-bank financial institutions’ performance can becategorised into institution specific (internal) and macroeconomic (external)factors. How a NBFI performs financially has critical effects on the economicgrowth of a country. When a NBFI performs relatively well, investors arerewarded for their investment. This, therefore, encourages more investmentand brings about economic growth.
In the last two decades, studies have shown that NBFIs in Sub-SaharanAfrica (SSA) are more profitable as compared to the rest of the world withan average Return on Assets (ROA) of 2% (Flamini et al. 2009). World Bankand International Monetary Fund (1999) identified the role of NBFIs asstrengthening an economy because they provide “multiple alternatives totransform an economy’s savings into a capital investments which act asbackup facilities to commercial banks.”
Botswana’s financial system has experienced a change in its structureover the past decade. It has transformed from being a reasonablyuncompetitive duopoly (which included; Barclays Bank and StandardChartered) in the late 1980s to a more competitive system with the entry ofnew financial institutions during the 1990s and introduction of innovativeproducts and services. (Jeffries and Tacheba, 2009).
Although the relationship between financial Sector development andeconomic growth has been examined in many developing countries, the bulkof the studies are mainly concentrated in the area of commercial banks.Specific studies addressing the causal link between non-bank financialinstitutions and economic growth in sub-Saharan African countries are veryscarce. Non-bank financial institutions increase competition in the financial

DETERMINANTS OF HOUSEHOLD ACCESS TO BANK CREDIT IN LESOTHO 99
sector; hence, promote economic efficiency through increased financialintermediation. However, to meet the objective of promoting economicefficiency, and to maintain a healthy andstable financial system, both banksand non-bankingfinancial institutions have to bewell-developed and offer awide-range of financial services and products. The necessity of promotingthe development of the non-bankinginstitutions is important for anydevelopingeconomy, including the Botswana economy. Therefore, it isnecessary to understand the behaviour of non-bank financial institutionsbecause of their importance to economic growth and development. This paperis designed to assess the factors that determine the financial performanceof non-bank financial institutions sub-sector in Botswana. Specifically, thepaper:
i) Identifies and establish the effect of selected variables on the financialperformance of the non-bank financial institutions sector in Botswana
ii) Draws policy conclusions that will help promote the growth of thenon-bank financial sector in Botswana.
The next section briefly discusses previous studies and section threediscusses the empirical methods. Section four presents the empirical resultsand section five summarises and makes conclusions and policyrecommendations.
2. REVIEW OF LITERATURE
Although many studies have been undertaken to analyse the factors thatdetermine the financial performance of commercial banks, only a few havefocused attention on non-bank financial institutions.
Ongeri (2012) investigated the effect of selected macroeconomic variableson the financial Performance of non-bank institutions in Kenya. The studyemployed Return on Assets (ROA) as a measure for financial performanceagainst the macroeconomic variables such as average quarterly interestrate, inflation rate, GDP growth rate and currency exchange growth rate.The study employed correlation and regression analysis, and found out thatReturn on Assets of NBFIs has a positive and significant relationship withcurrency exchange growth rate and a weak positive relationship withquarterly GDP, inflation rate and average quarterly interest rate. In asimilar study, Mwangi (2013) showed that a negative insignificantcorrelation exists between Return-On-Assets and annual inflation rate, realexchange rate, and annual average lending rate in the aviation industry inKenya.
Sufian and Razali (2008) analysed the determinants of profitability ofNBFIs in Malaysia. The results suggest that NBFIs with higher risks havelower profitability level than those with lower risks, but those with high

100 FRANCIS NATHAN OKURUT, NARAYANA, N., LERATO MAHAMO AND et al.
operational costs usually experience higher profitability margins. The resultsalso show that specialization does not significantly influence NBFIs profitmargins in the country. Similar study by Rahman and Raul (2008) showthat only liquidity conditions and operational efficiency significantlyinfluence NBFIs’ profit margin in Bangladesh. Also, Mazumder (2015) showsthat net profit as a performance indicator is significantly influenced by theinstitution size, operating expenses, term deposits and total equity.
From the above studies, it is evident that the determinants of financialinstitutions profitability differs according to the level of development, andcross country differences in macroeconomic and institution specific. However,it has been consistently shown that ROA, Returns-On-Equity (ROE) aretwo dependent variables that are used to measure the profitability of afinancial institution (NBFI). The macroeconomic variables mostly used inthese studies are inflation, GDP, and interest rate. The institution specificvariables include size, capital adequacy, or liquidity and deposit ratio.
3. METHODOLOGY
In this section, the theoretical framework and the empirical model arediscussed.
3.1.Theoretical framework
This paper follows both the market power and efficient market theories.Market Power Theory captures the role played by internal (institutional-specific) variables in the performance structure of NBFIs while the EfficientMarket Theory captures the effects of external (macroeconomic) variableson the financial performance of non-bank financial institutions.
The market power (MP) theory states that only firms with large marketshare and well-segregated portfolio (product) can win their competitors andearn a monopolistic profit. Moreover, the theory suggests that increasedexternal market forces result in profits. Furthermore, Athanasoglou et al.,(2005) states that the MP hypothesis proposes that the performance of afinancial institution is influenced by the market structure of the businessindustry. The market power theory has two approaches; the Structure-Conduct-Performance (SCP) and the Relative Market Power hypothesis(RMP). According to the SCP approach, the level of concentration in thefinancial transactions market gives rise to possible market power by financialinstitutions, which may elevate their profitability. Financial institutions inmore concentrated markets are most likely to make “abnormal profits” bytheir ability to lower deposits rates and to charge higher loan rates becauseof monopolistic reasons, than firms operating in less concentrated markets,regardless of their efficiency (Tregenna, 2009). The RMP hypothesispostulates that bank or non-bank profitability is influenced by market share.

DETERMINANTS OF HOUSEHOLD ACCESS TO BANK CREDIT IN LESOTHO 101
It assumes that only large banks with differentiated products can influenceprices and increase revenues. They are able to exercise market power andearn non-competitive profits. A firm with MP has the capacity toindependently affect either the total quantity or the prevailing price in themarket. The firm usually has market power by virtue of controlling a largeportion of the market. Vatiero (2010), argued that highly concentratedmarkets may be contestable if there are no obstacles to entry or exit, thistherefore limits the incumbent firm’s ability to increase its price abovecompetitive levels. Market power gives firms the capacity to engage in anti-competitive behaviour. If no individual participant in the market hassignificant market power, then anti-competitive behaviour can take placeonly through collusion, or the exercise of a group of participants’ collectivemarket power.
The efficient market hypothesis (EMH) states that at any period of timein an efficient market, asset prices fully reflect all available informationand competition will cause the full effects of new information on intrinsicvalues to be reflected instantly in actual prices as quoted by Ortiz, Cabello,Jesús, & Johnson (2005). Using this concept in financial sector context then,the EMH postulates that some firms earn high profits because they aremore efficient than others, and that past prices and volume of data have norelationship with the future direction of security prices; hence, one cannotuse past prices to make above average returns on earnings.
According to Athanasoglou et al., (2005), more efficient firms are moreprofitable because of their lower costs. These firms usually gain largermarket shares, which may result in higher levels of market concentration,but without any causal relationship between concentration and profitability.The approach emphasises economies of scale rather than differences inproduction technology or management. Larger firms can have a lower costper unit and higher profits through economies of scale. This permits largefirms to gain market shares.
3.2.Model SpecificationThis paper adopts a panel regression model to analyse the impact of theselected factors on the financial performance of NBFIs in Botswana. Thestudy uses balanced panel data, as each non-bank financial institution hasan equal number of observations over the chosen time period. A Hausmanspecification test was conducted to determine whether random or fixed-effect estimation is appropriate. However, according to the rule of thumb ofthe Hausman test, if the number of cross-section is greater than the time(period), the best estimate to use is that of a random effect estimate otherwisefixed effect is preferred (Gujarati and Porter, 2009). Saona (2011) observedthat the main advantage of using panel data that it is more efficient over

102 FRANCIS NATHAN OKURUT, NARAYANA, N., LERATO MAHAMO AND et al.
time-series and cross-sectional data as it contains more degrees of freedom,more variability and less collinearity among variables.
Past studies that examined the relationship between profitability anddifferent explanatory variables followed panel linear regressions, eitherdynamic or static in their methodologies such as Athanasoglou et al. (2008),Mirzaei (2011), Goddard et al. (2004) and Flamini et al. (2009). Themethodologies used in this study are both the static and the dynamic model.Previous literature which utilized the static model usually applied OLSmethods on Random or Fixed Effects.
The specification of the static econometric model used in the study isbased on the empirical works, and models suggested by Demirgüç-Kuntand Huizinga (1999), Flamini et al. (2009) and Obamuyi (2013).
Five explanatory variables were included in the regression analysis.The general empirical model takes the following form;
ROAi,t = C + �Xi,t + �Zt + �i,t (1)
�i,t = Vi,t + Ui,t
Where:
ROAi,t; is the measure of the financial performance of the ith financialinstitution in a particular year t. This was measured by the Return-On-Asset (ROA) of a financial institution.
‘C’ is the intercept, ‘�’ and ‘� ’ are the slope parameters forinternal(institution-specific) and external(macroeconomic) variables of afinancial institution respectively.‘X’ represents the internal (institutionalspecific) factors of a financial institution, which included; firm size, capitaladequacy and management efficiency. ‘Z’ represents the external(macroeconomic) factors of a financial institution
�i,t is the error term with Vi,t representing the unobserved institution-specific effect and Ui,t is the idiosyncratic error that varies over time betweennon-bank financial institutions.
Previous panel data studies have found out that firm profits tend toindicate persistence over time. That is; current firm profits depend on theprofits from the previous year (Athanasoglou, Brissimis and Delis, 2008).This is due to market structure imperfections and/or the high sensitivityof firm profits to macroeconomic shocks which are serially correlated(Berger et al., 2000: Flamini et al., 2009). Remoundous and Mamatzakis(2003) argued that an OLS estimation method produces inconsistent andbiased estimates in dynamic relationships. Therefore, the study willadopt a dynamic model(a three-stage least square) approach to formthe basis of our estimation which will include a one-period lagged valueof the dependent variable, among the independent variables. This is done

DETERMINANTS OF HOUSEHOLD ACCESS TO BANK CREDIT IN LESOTHO 103
in order to account for the time persistence of profits and specified asfollows:
ROAi,t = C + �ROAi,t–1 + �Xi,t + �Zt + �i,t (2)
Where:
ROAi,t–1; is the one-period lagged profitability measure and � is the coefficientwhich measures the speed of adjustment to equilibrium. � has a valuebetween 0 and 1, this implies that profits are persistent; however, they willeventually return to their equilibrium level. A value close to zero shows ahigh speed of adjustment (thus a fairly competitive industry), whereas avalue close to 1, indicates a very slow adjustment speed.
3.3.Definition and description of variables included in the modelFollowing Sufian and Chong (2008), Flamini et al., (2009), Scott and Arias(2011), Ongeri (2012), and Abbasoglu, Aysan and Gunes (2007), this studyuses ‘ROA’ as the dependent variable. The ROA according to Bank ofBotswana, (2013b) is defined as the ratio of after-tax profit as a percentageof total assets. The ratio measures the earning capacity of the firm’s assetsagainst amount invested in assets. According to Hassan and Bashir (2003),the ROA is used as a reflection of how well management utilised theinstitutions financial and real investment resources to generate profits. Andthus, higher ratio shows the higher performance of the firm. Olalekan andAdeyinka (2013) suggest that financial performance of a financial institutionis best measured by ROA as it is not distorted by high equity multipliers.Also ROA represents a better extent of the ability of a firm to make profitson its portfolio of assets. Flamini et al. (2009) also considered ROA as thekey proxy for financial performance, instead of the alternative return onequity (ROE), because an analysis of ROE disregards financial leverageand the risks associated with it.
The institution specific variables include firm size, capital adequacyand management efficiency, while the macroeconomic variables include GDPgrowth rate, inflation rate and money supply.
Firm size (FMS).This variable accounts for the effects and presence ofeconomies and diseconomies of scale. Theory suggests that because marketstructure affects firm performance a larger institution may be more efficientand enjoy larger earnings from providing services at a lower cost, (Rasiah,2010a). On the other hand, economic theory argues that increaseddiversification leads to higher risks, and this may have negative effects ona firm’s performance. That is, an institution enjoys economies of scale up toa certain level, beyond which diseconomies of scale set in. Thus therelationship is non-linear, (it can be positive or negative). (Athanasoglou etal., 2005; Dietrich and Wanzenrid, 2009; Flamini et al., 2009; Naceur and

104 FRANCIS NATHAN OKURUT, NARAYANA, N., LERATO MAHAMO AND et al.
Omran, 2011). To account for the possibility of a non-linear relationshipbetween firm size and profit, we capture firm size by using the log of firmsize and its square.
Capital Adequacy Ratio (CAR)
According to (Athanasoglou et al. 2005) capital is the amount of own fundavailable to upkeep the firm’s business and act as a buffer in case of adversesituations. Therefore capital acts as a safety net in cases of firm losses, asgreater firm capital reduces the chance of firm distress (Diamond andRaguram, 2000). However, Beckmann (2007) argues that high capital resultsin low revenues since firms with a high capital ratio are risk-averse; theyignore potential (risky) investment opportunities. Capital adequacy ratio isdirectly proportional to the resilience of the firm in times of economicdownturns. It has also a direct effect on the financial performance ofinstitutions by determining its exposure to risky but profitable ventures(Sangmi and Nazir, 2010). The relation between capital and financialperformance is ambiguous, as some studies found a positive relationship(Flamini et al, 2009; and Obamuyi, 2013), while (Kapunda and Molosiwa,2012) and (Berger 1995b) found a negative relationship.
Management Efficiency (MGTE):Is the ratio of total operatingexpenses to total assets of an institution. The fraction of operating expensesto total asset is expected to be negatively related to financial performanceof a firm. (Athanasoglou et al. 2005) explains that this ratio can be used asa proxy for management quality; that is, when expenses are high, it is areflection of poor management efficiency and therefore the low performanceof the financial institution. However, when the level of operating expensesis low, management is efficient and profits will be high.
GDP growth rate (GDP):GDP growth rate represents the totaleconomic activity in a country and it is adjusted for inflation. It is used as aproxy for the business cycle in which firms operate, and controls for changesin earnings owing to differences in business cycles, which then affects thedemand and supply for deposits and loans (Osman, 2011; Obamuyi, 2013).Apositive relationship between Real GDP growth rate and the profitability ofa financial institution is expected. Bikker and Hu (2002) argue that a positiveeconomic growth facilitates high demand for credit that in turn positivelyaffects the financial institute’s profitability. Contrarily, the demand forlending is low during recessions which negatively affect the profitability offinancial institutions.
Inflation Rate (IFR):Inflation rate shows the general price level in theeconomy and measured in terms of changes in consumer prices. Inflation hasan impact on both the real value of costs and revenues. The impact of inflationon the financial performance of a firm can be negative or positive, depending
DETERMINANTS OF HOUSEHOLD ACCESS TO BANK CREDIT IN LESOTHO 105
on whether inflation was anticipated or unanticipated. If the financialinstitutions anticipated well the inflation, the institutions will adjust interestrate to make sure that revenues exceed the costs; in this case, a positiverelationship will be expected. If inflation on the other hand was not anticipatedthe costs increase more rapidly than revenues (Flamini et al., 2009). A positiverelationship between inflation and profitability of NBFIs is expected.
Money Supply (MSS):is represented by the broad money supply (M2/GDP). The relationship between money supply is expected to be positivelyrelated to NBFIs profitability. This is because, as an economy has moremoney circulating in the economy, the money can be channelled to productiveinvestment and more savings to the NBFIs.
3.4.Data sources
There were 3455 Non-Bank Financial Institutions registered with, andreported in NBFIRA’s Statistical Bulletin of 2014. Of this number 7 lifeinsurance companies, 11 general insurance companies, 2 re-insurancecompanies, 16 brokers, and 4 pensions/retirement fund companies wereselected. The selection was based on the number of years these institutionshave been in operation in the country. Secondary data is used for each non-bank financial institution for the period 2010-2014. The data is sourcedfrom the financial reports of all the respective non-bank financialinstitutions, from the NBFIRA Statistical Bulletin (2014), Bank of Botswanaand World Bank financial data.
3.5.Pre-estimation testsTo gauge the adequacy and reliability of the data, the following pre-estimation tests were carried out.
� Multicollinearity Test
� Unit Root Test
� Hausman Test
� Autocorrelation Test
4. PRESENTATION AND DISCUSSION OF EMPIRICAL RESULTS
The section presents and discusses the empirical results of the study. It startswith the descriptive statistics and then proceeds to the estimated parameters.
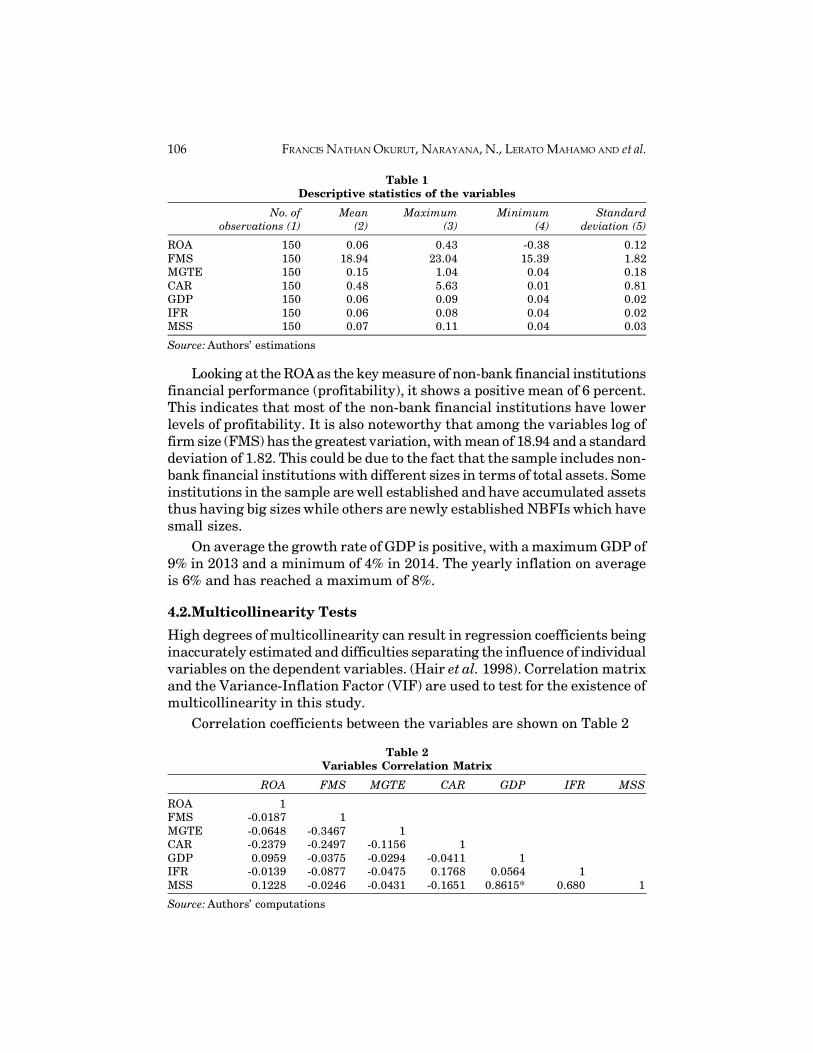
4.1.Descriptive statisticsTable 1 presents the summary statistics of the variables. These include themean, standard deviation and minimum and maximum values of thevariables
106 FRANCIS NATHAN OKURUT, NARAYANA, N., LERATO MAHAMO AND et al.
Table 1Descriptive statistics of the variables
No. of Mean Maximum Minimum Standardobservations (1) (2) (3) (4) deviation (5)
ROA 150 0.06 0.43 -0.38 0.12FMS 150 18.94 23.04 15.39 1.82MGTE 150 0.15 1.04 0.04 0.18CAR 150 0.48 5.63 0.01 0.81GDP 150 0.06 0.09 0.04 0.02IFR 150 0.06 0.08 0.04 0.02MSS 150 0.07 0.11 0.04 0.03
Source: Authors’ estimations
Looking at the ROA as the key measure of non-bank financial institutionsfinancial performance (profitability), it shows a positive mean of 6 percent.This indicates that most of the non-bank financial institutions have lowerlevels of profitability. It is also noteworthy that among the variables log offirm size (FMS) has the greatest variation, with mean of 18.94 and a standarddeviation of 1.82. This could be due to the fact that the sample includes non-bank financial institutions with different sizes in terms of total assets. Someinstitutions in the sample are well established and have accumulated assetsthus having big sizes while others are newly established NBFIs which havesmall sizes.
On average the growth rate of GDP is positive, with a maximum GDP of9% in 2013 and a minimum of 4% in 2014. The yearly inflation on averageis 6% and has reached a maximum of 8%.
4.2.Multicollinearity TestsHigh degrees of multicollinearity can result in regression coefficients beinginaccurately estimated and difficulties separating the influence of individualvariables on the dependent variables. (Hair et al. 1998). Correlation matrixand the Variance-Inflation Factor (VIF) are used to test for the existence ofmulticollinearity in this study.
Correlation coefficients between the variables are shown on Table 2
Table 2Variables Correlation Matrix
ROA FMS MGTE CAR GDP IFR MSS
ROA 1FMS -0.0187 1MGTE -0.0648 -0.3467 1CAR -0.2379 -0.2497 -0.1156 1GDP 0.0959 -0.0375 -0.0294 -0.0411 1IFR -0.0139 -0.0877 -0.0475 0.1768 0.0564 1MSS 0.1228 -0.0246 -0.0431 -0.1651 0.8615* 0.680 1
Source: Authors’ computations

DETERMINANTS OF HOUSEHOLD ACCESS TO BANK CREDIT IN LESOTHO 107
The results reported in Table 2 suggest that there is a problem of highmulticollinearity between money supply (MSS) and inflation rate (IFR), andbetween GDP and money supply (MSS).. Kennedy (2008) points out thatthat multicollinearity is a problem when the correlation is above 0.8. Thecorrelation matrix table above suggests that there could be highmulticollinearity between money supply and GDP growth rate (correlationcoefficient of 0.8615).
Another way to test for correlation was to use the variance inflationfactor (VIF). A VIF of more than 10 indicates high correlation; hence,indicates the presence of multicollinearity problem (Gujarati and Porter,2009).
In Table 3, the results of VIF and tolerance factor shows that there isevidence of high multicollinearity between money supply (MSS) and GDPgrowth rate. Gujarati and Porter (2009) stated that high multicollinearityhas the following remedial measures; one is to drop one of the highly collinearvariables and see if that improves the model. Another one is to just use allthe variables if economic theory speculates so. The values of VIF of moneysupply and GDP growth rate are 20 and 10 respectively suggesting thepresence of multicollinearity among the variables in the model. In this paper,money supply variable was dropped in order to deal with the problem ofhigh multicollinearity.
Table 3Variance Inflation Factor (VIF)
Variable R2 VIF
ROA 0.08 1.06
FMS 0.23 1.29
MGTE 0.19 1.23
CAR 0.23 1.29
GDP 0.90 10.00
IFR 0.07 1.08
MSS 0.95 20.00
Source: Authors’ computations
4.3.Panel Unit Root TestA visual plot of the variables was used to determine which unit root test toconduct. Each variable was plotted to check whether it has an upward/downward trend over the time or not. If the individual variable series doesnot follow a pattern, then it is preferable to estimate the model of the unitroot test without a trend.
From the graphs, all the variables do not show a time trend except forinflation. Therefore only inflation series were estimated with a trend.
108 FRANCIS NATHAN OKURUT, NARAYANA, N., LERATO MAHAMO AND et al.
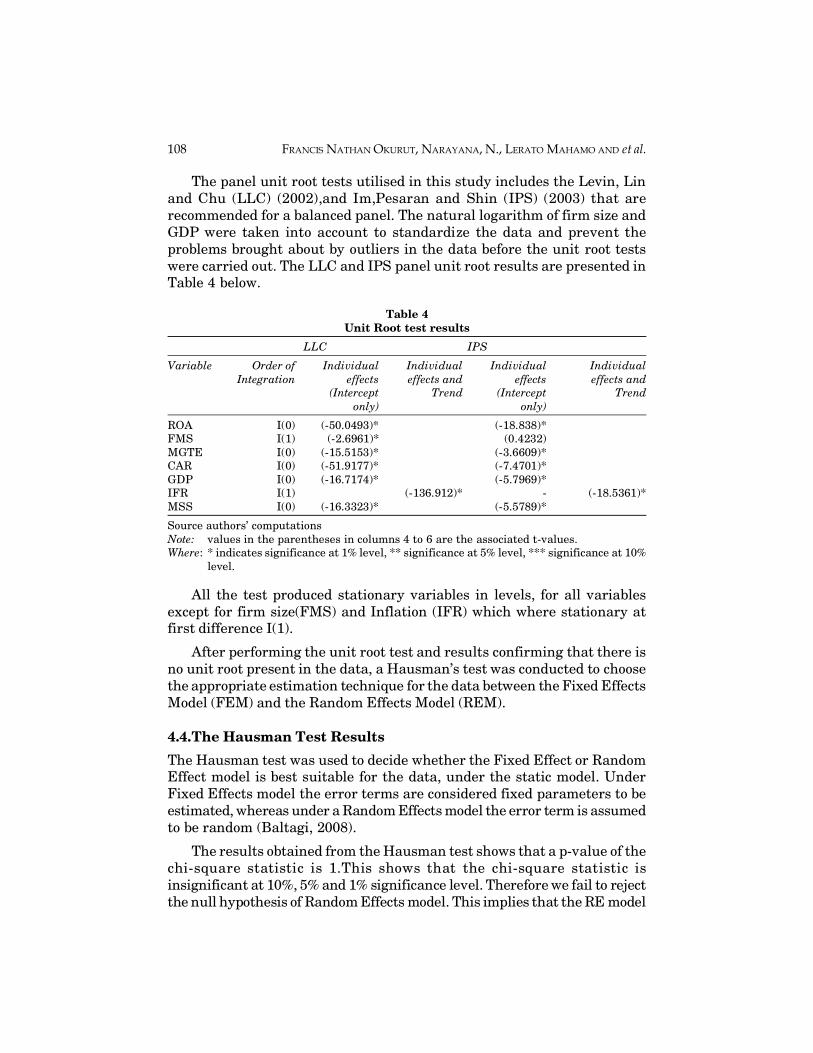
The panel unit root tests utilised in this study includes the Levin, Linand Chu (LLC) (2002),and Im,Pesaran and Shin (IPS) (2003) that arerecommended for a balanced panel. The natural logarithm of firm size andGDP were taken into account to standardize the data and prevent theproblems brought about by outliers in the data before the unit root testswere carried out. The LLC and IPS panel unit root results are presented inTable 4 below.
Table 4Unit Root test results
LLC IPS
Variable Order of Individual Individual Individual IndividualIntegration effects effects and effects effects and
(Intercept Trend (Intercept Trendonly) only)
ROA I(0) (-50.0493)* (-18.838)*FMS I(1) (-2.6961)* (0.4232)MGTE I(0) (-15.5153)* (-3.6609)*CAR I(0) (-51.9177)* (-7.4701)*GDP I(0) (-16.7174)* (-5.7969)*IFR I(1) (-136.912)* - (-18.5361)*MSS I(0) (-16.3323)* (-5.5789)*
Source authors’ computationsNote: values in the parentheses in columns 4 to 6 are the associated t-values.Where: * indicates significance at 1% level, ** significance at 5% level, *** significance at 10%
level.
All the test produced stationary variables in levels, for all variablesexcept for firm size(FMS) and Inflation (IFR) which where stationary atfirst difference I(1).
After performing the unit root test and results confirming that there isno unit root present in the data, a Hausman’s test was conducted to choosethe appropriate estimation technique for the data between the Fixed EffectsModel (FEM) and the Random Effects Model (REM).
4.4.The Hausman Test Results
The Hausman test was used to decide whether the Fixed Effect or RandomEffect model is best suitable for the data, under the static model. UnderFixed Effects model the error terms are considered fixed parameters to beestimated, whereas under a Random Effects model the error term is assumedto be random (Baltagi, 2008).
The results obtained from the Hausman test shows that a p-value of thechi-square statistic is 1.This shows that the chi-square statistic isinsignificant at 10%, 5% and 1% significance level. Therefore we fail to rejectthe null hypothesis of Random Effects model. This implies that the RE model

DETERMINANTS OF HOUSEHOLD ACCESS TO BANK CREDIT IN LESOTHO 109
is the appropriate choice for this study and will be estimated. The nextsection will present the results of the random effects model.
4.5.Econometric resultsThe results of the econometric estimation are presented on Table 5.
Table 5Econometric Results
Dependent Variable ROA
Coefficient Standard Error t-statistic P-value(2) (3) (4) (5)
MGTE -0.322 0.068 -4.681 0.000FMS 0.104 0.182 0.568 0.572FMS2 -0.003 0.004 -0.661 0.511lag1CAR -0.023 0.009 -2.539 0.014lag2CAR -0.026 0.009 -2.752 0.008IFR -0.017 0.021 -0.844 0.403lag1GDP -0.460 0.472 -0.972 0.335C 10.134 11.48 0.882 0.382
Weighted Statistics
R-squared 0.459365 Mean dependent var 0.015922Adjusted R-squared 0.377095 S.D. dependent var 0.045580Prob (F-statistic) 0.000107 Sum squared resid 0.059529F-statistic 5.583597 Durbin-Watson stat 1.769937
Source: Authors’ computations
In the static RE model above, a one and two period lag was introducedto the firm size, annual GDP growth rate, and capital adequacy explanatoryvariables. Economic theory and previous empirical studies were used tobase the decision on which explanatory variables to lag. Gujarati and Porter(2009) argued that economic agents take time to adjust and react to changingconditions in the economy; therefore, some variables might have an influenceon other variables after some time.
The Durbin-Watson statistic is 1.76, which indicates the absence of serialcorrelation, as its value is close to two. The p-value of the F-statistic for theRE model is 0.000107. This means that the null hypothesis that parametersare jointly equal to zero is rejected at 1% significance level. This suggeststhat more than one variable in the model explains the variation in ROA.The R2of the model is 0.459. This means that 45.9% of the variation in ROAis explained by the chosen explanatory variables.
The estimated results show that there is a negative, but significantrelationship between Capital adequacy ratio and NBFIs’ with profitability.The coefficient of capital adequacy is significant at first lag, and shows ahigher significance level at second lag. This suggests that the profits thatare gained by NBFIs are not immediately used for reinvestment or to hedge

110 FRANCIS NATHAN OKURUT, NARAYANA, N., LERATO MAHAMO AND et al.
against risky conditions, and NBFIs only use their capital to hedge againstrisky conditions, such as bad loans or for reinvestment only after aconsiderable lag.
Similarly, there is a negative, but significant relationship betweenmanagement efficiency and profits. This implies that as managementefficiency increases NBFIs profits decrease in Botswana. The possible reasonis that improvement in management efficiency has cost implications forNBFIs, hence, reduction in profits.
Both the RE and Three-Stage-Least Squares model results show thatfirm size has an insignificant influence on profitability in Botswana. Thisimplies that the size of NBFIs in Botswana does impact profitability. Thiswas also supported by Athanasoglou et al. (2008), and Sufian Chong (2008),who found an insignificant influence of firm size on profitability in Europeand Philippines.
4.5.Results of the Three-Stage-Least-Squares (3SLS) estimationThe three-stage-least-squares (3SLS) is viewed as a more appropriatedynamic model in order to overcome the problem of biasness and inconsistentestimates produced by the Random Effect Model, as suggested by Arellanoand Bond (1991), and that the estimators lack efficiency as a result of notexploiting all the available instruments. However, efficiency of estimatescan be achieved by using the lagged value of the dependent variable (in ourcase the lagged value of ROA), plus the lagged values of the independentvariables as instruments.
Table 6Three Stage Least Squares
Coefficient Standard Error t-statistic P-value(2) (3) (4) (5)
C(1) 0.100 0.065 1.542 0.127C(2) 0.518 0.081 6.399 0.000C(3) -0.012 0.024 -0.529 0.059C(4) -0.164 0.080 -2.059 0.043C(5) 0.014 0.106 0.131 0.895C(6) -0.013 0.006 -0.466 0.783C(7) 1.347 0.923 1.458 0.149C(8) -0.018 0.009 -1.909 0.060
Equation: ROA= C(1) + C(2)*ROA(-1)+ C(3)*CA(-1) + C(4)* Mgte + C(5)*D(FMS)+ C(6)*(FMS2)+ C(7)*D(GDP)+ C(8)*INFLTNInstruments: ROA(-1) CA(-1) Mgte(-1) FMS(-1) GDP(-1) INFLTN(-1)
Number of Observations: 150R-squared: 0.5074Adjusted R-Squared: 0.4535D W: 1.851

DETERMINANTS OF HOUSEHOLD ACCESS TO BANK CREDIT IN LESOTHO 111
The lagged ROA coefficient is significant at 1% level, which confirmsthe dynamic nature of the model specification. Furthermore the coefficientis positive, which shows a moderate persistence of profit and the highlysignificant value of the coefficient implies that in Botswana’s financial systemthere exist a fairly competitive structure in the non-bank financial sector.This shows that non-bank financial companies in Botswana are able topreserve a substantial amount of their revenue from one year to another.This results were also reported in empirical studies done by Flamini et al(2009) for Sub-Saharan Africa and Athanasoglou et al. (2008),however theywere contradictory to the findings of Goddard et al. (2004) who found outthat the statistical evidence for profit persistence was weak among theEuropean banks.
As with the RE model, coefficients of both management efficiency capitaladequacy ratio were negative, but significant. The negative coefficient ofmanagement efficiency implies that an increase in operation costs reducesthe non-bank financial institutions’ profits. The negative effect could bedue to the fact that the management only passes a smaller portion of theincrease in operation cost to customers while the remaining part of the costreduces their profits, possibly because of competition among the numerousNBFIs in Botswana. This result is consistent with the findings of suchWilliam (2012), Athanasoglou et al. (2008), and Obamuyi (2013).
The negative sign of capital adequacy ratio implies that NBFIs inBotswana do not adequate capital to hedge against profit downturns andthat NBFIs do not have the average capital for a safe and sound NBFIsector. This is evidenced by the report during the year of study there hasbeen seven liquidated insurance companies, and a total of six acquisitiontransfers, which included three pension funds and three general insurancecompanies, and that twenty five micro lenders ceased their operation citingamong others challenges of high operational costs and low capital to expandtheir business opportunities.
With the macroeconomic variables, only inflation rate has a significanteffect on the profitability of NBFIs in Botswana. The empirical results showthat inflation as a proxy of annual change of the Consumer Price Indexnegatively and significantly affects profitability. This could be due to eitherNBFIs do not have adequate capital to hedge against inflation or theirinability to forecast the future movements of inflation rate accurately; hence,losing out on the opportunity to adjust their interest rates accordingly toreflect the general increase in price levels so as to increase their profits.Similar findings were also obtained by Sufian and Chong (2008), and Abreuand Mendes, (2002). However, on contrary the study by Athanasoglou et al(2005), Al Manaseer (2007) found a positive relationship between inflationand profitability in Greece and Middle East countries respectively.

112 FRANCIS NATHAN OKURUT, NARAYANA, N., LERATO MAHAMO AND et al.
5. CONCLUSION
This research endeavours to investigate the effect of institution-specific andmacro-economic variables on the financial performance of non-bank financialInstitutions in Botswana.
Financial performance (profitability) is measured by Return on Assets(ROA) variable in this study. Firm-size, capital adequacy and managementefficiency were the institution-specific variables, while Real GDP growthrate and inflation were taken as macro-economic variables. The analysisemployed both the Random Effect static model and the Three-Stage-Least-Squares Dynamic model. Generally, most of the variables were found to besignificant determinants of NBFIs’ financial performance in Botswana.However, these results add to the notion of ambiguity of the determinantsof financial performance of NBFIs. Of specific interest in the empiricalfindings is the negative relationship between management efficiency andNBFIs profitability. Suggesting that NBFI managers should focus on efficientcost management to improve NBFIs financial performance in the country.
The empirical finding of both capital adequacy and inflation beingnegative, but significant determinants of NBFIs’ financial performance inBotswana suggests that NBFIs do not have enough capital to hedge againstthe risk of bad loans and unanticipated inflation.
The findings show that Real GDP growth rate from 2010 to 2014 had nosignificant effect on the financial performance of NBFIs in Botswana. Thissuggests that although Real GDP has been growing in Botswana, the positiveimpact could have only been realised by the commercial banks of the country.
The findings further provide an idea that the one period lagged ROA;that is retained profits from the previous year has a major influence onprofitability in the NBFI sector in Botswana. This is indisputably true, asfirms profits are also an important source of equity. Therefore, an increasein NBFIs’ revenue base will consequently lead to higher overall profits andpromotes financial stability.

DETERMINANTS OF HOUSEHOLD ACCESS TO BANK CREDIT IN LESOTHO 113
Appendix I: Panel Unit Root Tests Results (Visual plot of the variables)

114 FRANCIS NATHAN OKURUT, NARAYANA, N., LERATO MAHAMO AND et al.

DETERMINANTS OF HOUSEHOLD ACCESS TO BANK CREDIT IN LESOTHO 115
116 FRANCIS NATHAN OKURUT, NARAYANA, N., LERATO MAHAMO AND et al.
ReferencesAbbasoglou, A., Aysan, A., & Gunes. (2007), Concentration, Competition,Efficiency and
Profitability of the Turkish Banking Sector in the Post-Crises period. BogaziaUniversity Research Papers.
Abreu, M., & Mendes, V. (2002), Commercial bank interest margins and profitability:Evidence from EU countries. University of Porto Working paper series, 122, 93-97.
Albertazzi, U., & Gambacorta, L. (2009), Bank Profitability and the business cycle.Journal Of financial Stability, 5(4), 393-409.
Ally, Z. (2013), Comparative Analysis of Financial Performance of Commercial banks inTanzania. Research Journal of Finance and Accounting, 4(19).
AL-Manaseer, M. (2007), The determinants of Islamic and traditional bank profitability:Evidence from the Middle East. PhD Thesis, University of the West of England.
Al-Tamimi, H. (2010), Factors Influencing Performance of the UAE Islamic andconventional National Banks. Global Journal of Business Research, 4(2).
Arellano, M., & Bond, S. (1991), Some tests for specification for panel data: Monte Carloevidence and an Application to employment equations. Review of Economic Studies,58(2), 277-297.
Athanasoglou, P., Brissimis, S., & Delis, M. (2008), Bank-specific,Industry-Specific andMacroeconomic determinants of bank profitability. Journal of InternationalFinancial Markets, Institutions and Money, 18(2), 121-136.
Athanasoglou, Sophocles, N., & Matthaios, D. (2005), Bank-Specific,Industry-specificand Macroeconomic determinants of bank profitability. Bank of Greece WorkingPaper, 25(3), 85-94.
Aubrime, U. (2005), Determinants of Bank Profitability:Company-Level Evidence FromNigeria. University of Nigeria.
Baltagi, B. (2008), Panel Data Econometrics (4th edition ed.). Chichester: John Wileyand Sons.
Beck T, D.-K., R, L., & V, M. (2000), Financial Structure and Economic: Firm,Industry,and Counrty Evidence. Carlson School of Management, University of Minnesota.
Beckman, R. (2007), Profitability of Western European Banking System: panel evidenceon structural and Cyclical determinants. Banking and Financial Studies, 17.
Berger, A., Davies, S., & Flannery, M. (2000), Comparing market and SupervisoryAssessments of Bank performance: Who knows what when. Journal of Money,Creditand Banking, 32(3), 641-667.
Berger, A., Herring, R., & Szego, G. (1995), The role of capital in financial institutions.Journal of Banking and Finance, 19(3), 393-430.
Bikker, J., & Hu, H. (2002), Cyclical patterns in profits, provision and lending of banksand procyclicality of the new Basel Capital requirements. BNL Quarterly Review,221, 143-175.
Botswana-Government. (2002), National Development Plan 9. Gaborone: Governmentof Botswana.
Botswana-Government. (2014), Non-Bank Financial Institutions Annual Report.Gaborone, Botswana: Non-Bank Financial Institutions Regulatory Authority.

DETERMINANTS OF HOUSEHOLD ACCESS TO BANK CREDIT IN LESOTHO 117
Bourke, P. (1989), Concentration and other determinants of Bank Profitability in Europe,North America and Australia. Journal of Banking and Finance, 13(1), 65-79.
Claessens, S. (1998), Systematic Bank and Corporate Restructuring: Experiences andLessons for East Africa. The Worl Bank Group.
Demirguc-Kunt, A. (2006), Finance and Economic Development: The Role of Government.Oxford University Press.
Demirguc-kunt, A., & Huizinga, H. (1999), Dterminants of commercial bank interestmargins and profitability: Some International Evidence. The World Bank EconomicReview, 13, 379-408.
Demirguc-Kunt, Asli, & Levine, R. (2001), Financial Structure and Economic Growth: ACross Country Comparison of Banks, Markets, and Developments. MIT Press.
Diamond, D. (1984), Financial Intermediation and Delegated Monitoring. Review OfEconomic Studies, 51(3), 393-414.
Diamond, D., & Raghuram, R. (2000), A Theory of Bank Capital. The Journal of Finance,55(6), 2431-2465.
Dietrich, A., & Wanzenried, G. (2009), What Determines the Profitability of CommercialBanks? New Evidence from Switzerland. 12th Conferenceof the Swiss Society forFinancial Market Researches. Geneva.
Fama, E. (1970), Efficient Capital Markets; A Review of Theory and Empirical Work.The Journal of Finance.
Flamini, C, V., McDonald, G., & S, L. (2009), The Determinants of Commercial BankProfitability in Sub-Saharan Africa.
Francis, E. M. (2011), Determinants of commercial banks profitability in Sub-SaharanAfrica. Economic Perspective for least developed Countries.
Goddard, J., Molyneux, P., & Wilson, J. (2004), Dynamics of Growth and Profitability inbanking. Journal of money, credit and banking.
Gujarati, D. N., & Porter, D. C. (2009), Basic econometrics. New York: McGraw-Hill.
Gul, S., Irshad, F., & Zaman, K. (2011), Factors affecting bank profitability in Pakistan.The Romanian Economic Journal.
Hair, J., Anderson, R., & Tatham, R. (1998), Multivariate Data Analysis (5th Editioned.). London: Prentice Hall International.
Haron, S. (1996), Competition and Other External Determinants of the Profitability ofIslamic banks. Islamic Economic Studies, 4(1), 49-61.
Hassan, K., & Bashir, A.-H. (2003), Determinants of Islamic Banking Profitability. 10thAnnual Conference, Marrakesh-Morocco: ERF Paper.
Haung, G., & Song, F. (2006), The determinants of capital structure: Evidence fromChina. China Economic Review, 17(1), 14-36.
Helwege, J., & Liang, N. (1996), Is tere pecking order? Evidence from a panel of IPOfirms. Journal of Financial Economics, 40(3), 429-458.
Hoffmann, S. P. (2011), Determinants of the Profitability of the US Banking Industry.International Journal of Business and Social science, 2(22), 225-262.
Investor Words. (2015), Retrieved from http://www.investorwords.com/16429/financial_performance.html
118 FRANCIS NATHAN OKURUT, NARAYANA, N., LERATO MAHAMO AND et al.
Investor Words. (2015), Retrieved from http://www.investorwords.com/16429/financial_performance.html
Jefferis, K. (2009), Overview of the Botswana Banking Sector. Gaborone: USAID.
Jefferis, K., & Tacheba, A. (2009/10), Botswana Financial Sector Overview. CapitalResources.
Kapunda, S. M., & Molosiwa, T. K. (2012), Economic Performance of Commercial BanksIn Botswana: A structure-Conduct-Performance Approach. International Journalof Economics and Business Studies, 2(1), 3-12.
Kayawe, T., & Amusa, A. (2003), Concentration in Botswana Banking Sector. SAJEMSNS, 6(4).
Kennedy, P. (2008), A Guide to Econometrics. sixth edition: Blackwell Publication.
Levine, R. (1997), Financial Development and Economic Growth: Views and Agenda.Journal of Economic Literature, 35(2), 688-726.
Loayza, N., Beck, & Levine. (2000), Finance and the Sources of Growth. Journal ofFinancial Economics, 58, 261-300.
Mazumder, M. (2015), Stimulants of profitability of non-bank financialinstitutions:Evidence from Bangladesh. International Journal of Business andManagement Review, 3(10), 32-41.
Mirzaei, A. (2011), Bank specific and macroeconomic determinants of profitability inMiddle Eastern Banking. Iranian Economic Review, 15(29).
Molyneux, P., & Thornton, J. (1992), Determinants of European Bank Profitability: ANote. Journal of Banking and Finance, 16(6), 1173-1178.
Mugume, A. (2008), Efficiency in Uganda’s Banking Industry. The African Journal ofBusiness and Law, 2(2).
Mwangi, F. (2013), The Effect of Macroeconomic Variables on the Financial Performanceof Aviation Industry In Kenya. University of Kenya.
Myers, S., & Majluf, N. (1984), Corporate Financing and Investment decisions whenfirms have Information that Investors do not have. NBER Working Paper, No.W1396.
Naceur, S. B., & Omran, M. (2011), The Effects of Bank Regulations, Competition, andfinancial Reforms on bank’s performance. Emerging Markets Review, 12(1), 1-20.
NBFIRA. (2014), Non-Bank Financial Institutions Annual Report. Gaborone, Botswana:Non-Bank Financial Institutions Regulatory Authority.
Obamuyi, T. (2013), An Analysis of the deposits and lending behaviours of banks in Nigeria.International Journal of Engineering and Management Science, 4(1), 46-54.
Oladele, P. O., Sulaimon, A. A., & Akeke, N. (2012), Determinants of Bank Performancein Nigeria. International Journal of Business and Management Tomorrow, 2(2).
Olalekan, A., & Adeyinka, S. (2013), Capital Adequacy and Bank Profitability: EmpiricalEvidence from Nigeria. American International Journal of Contemporary Research,3(10), 87-92.
Ongeri, G. M. (2014), The Effects of Macroeconomic Variables on the Financial Performanceof Non-Bank Financial Institutions in Kenya. University of Nairobi.

DETERMINANTS OF HOUSEHOLD ACCESS TO BANK CREDIT IN LESOTHO 119
Ortiz, E., Cabello, A., Jesus, R., & Johnson, R. (2005), Exchange rates, Market efficiencyand Purchasing Power Parity: Long-Run Test For the Latin American Currencies.Latin American Journal of Economics, 36(141).
Osman, J. B. (2011), Development Impact of non-bank financial intermediaries oneconomic growth in malaysia: An empirical Investigation. International Journal ofbusiness and social science, 2(14), 187-194.
Pasiouras, F., & Kosmidou, K. (2007), Factors Influencing the profitability of domesticand foreign commercialbanksin the European Union. Research in InternationalBusiness and Finance, 21(2), 222-237.
Pervan, M., Pelivan, I., & Arneric, J. (2015), Profit persistence and determinants ofbank profitability in Croatia. Economic Research, 28(1), 284-298.
Raghuram, G., Rajan, & Zingales, L. (1998, June), Financial Dependence and Growth.The American Economic Review, 88(3), 559-586.
Rahman, G., & Raul, R. (2012), Determinants of Profitability of Non-Bank FinancialInstitutions in a Developing Country: Evidence From Bangladesh. Dhaka: UnitedInternational University .
Rajan, R., & Zingales, L. (1995), What do we know about Capital Structure?Smomeevidence from International data. Journal of Finance, 50(5), 1421-1460.
Rasiah, D. (2010a), Review of Literature and Theories on determinants of Commercialbank Profitability. Journal of Performance Management, 23(1), 23-29.
Remoundos, P., & Mamatzakis, E. (2003), Determinants of Greek commercial banksprofitability. Journal of financial Economics, 53(1), 84-93.
Saeed, M. S. (2014), Bank-related,Industry-related and Macroeconomic factors affectingbank profitabiliry:A Case of the United Kingdom. Research Journal of Finance andAccounting, 5(2).
Sangmi, M., & Tabassum, N. (2010), Analyzing Financial Performance of CommercialBanks In India: Application of CAMEL Model. Pakistan Journal of CommercialSocial science, 4(1), 40-55.
Saunders, A., & Cornett, M. M. (2011), Financial Institutions Management: A RiskManagement (7 edition ed.). McGraw-Hill Higher Education.
Scott, J. w., & Arias, J. C. (2011), Bank Profitability Determinants. Business IntelligenceJournal, 4(2), 209-229.
Sinha, P., & Sharma, S. (2014), Determinants of bank profits and its persistence inIndian Banks: A study in a dynamic panel data framework. MPRA paper.
Sufian, F. (2011), Profitability of the Korean banking Sector: Panel Evidence on bank-specific and macroeconomic determinants. Journal of Economics and Management,7(1), 43-72.
Sufian, F., & Razali Chong, R. (2008), Determinants of Non-bank Financial InstituionsProfitability. AAMJAF.
Sullivian, O. (1985), Determinants and Impact of Private Foreign Direct Investment inHost Countries. Management International Review, 25, 28-35.
Sutton, C. N., & Jenkins, B. (2007), The Role of the Financial Services Sector in ExpandingEconomic Opportunity. Harvard University.
120 FRANCIS NATHAN OKURUT, NARAYANA, N., LERATO MAHAMO AND et al.
Tregenna, F. (2009), Contracting out of service Activities and The Effects on the SectoralEmployment Patterns in South Africa. University of Cambridge.
UNCTAD. (2003), Investment Policy Review Botswana. United Nations: Geneva.
Vatiero, M. (2010), The Ordoliberal Notion of Market Power; An InstitutionalistReassessement. European Competition Journal, 6(3), 689-707.
William, B. (2012), The determinants of profitability of the commercial banks in Ghanaduring the Recent Years of Global Financial Crisis. Aarhus University.