i-abstract - research-repository.uwa.edu.au · web viewdetailed information on the soil analysis...
TRANSCRIPT

SOIL PROPERTIES AND NEIGHBORING FOREST COVER AFFECT ABOVEGROUND BIOMASS AND FUNCTIONAL COMPOSITION DURING TROPICAL FOREST
RESTORATION
Toledo, R. M. (Corresponding author, [email protected]) 1, 2
Santos, R.F.([email protected]) 1
Baeten, L. ([email protected]) 2
Perring, M. P. ([email protected]) 2, 3
Verheyen, K. ([email protected]) 2
1 LEPaC, Departamento de Ecologia, Instituto de Biociências, Universidade de São Paulo.
Rua do Matão, 321, Travessa 14, CEP:05508-090, São Paulo-SP, Brasil
2 Forest & Nature Lab, Ghent University. Geraardsbergsesteenweg 267, 9090 Melle-
Gontrode, Belgium
3 Ecosystem Restoration and Intervention Ecology Research Group, School of Biological
Sciences, The University of Western Australia, 35 Stirling Highway, Crawley, WA 6009,
Australia
Running head: Soil and forest cover affect tropical forest restoration
Print journal page estimate: 0.7 page for figures, 0.5 pages for tables, 9.3 pages for text
(7743 words), total 10.5 pages
1
1
1
2
3
4
5
6
7
8
9
10
11
12
13
14
15
16
17
18
19
23
I-ABSTRACT
QUESTIONS
We studied the importance of soil properties and neighbouring forest cover in affecting plant
community biomass and assembly during the tropical forest restoration process. We also
investigated how compositional responses depended on traits expected to influence
individual success.
LOCATION
Forest restoration sites (N=32) distributed across anthropogenic grasslands in six mixed-use
agricultural watersheds in Eastern São Paulo state (Brazil).
METHODS
We identified and measured all woody individuals (DBH ≥5 cm) in four 200 m² plots per site.
Then we translated these measurements into aboveground biomass (AGB), and related
AGB variability to neighbouring forest cover, soil texture and chemical fertility with mixed
effect models. We assessed the effect of these predictors on different species groups,
arranged according to variation in wood density, tree height or habitat selectivity, through
multivariate abundance models.
RESULTS
AGB ranged between 0 and 104.7 ton/ha (median of 10.4 ton/ha), with high variation within,
as well as between, watersheds. Sand percentage, forest cover, and the interaction between
soil nutrient concentrations and sand percentage were good predictors of measured AGB.
The most parsimonious model projected a seven growing-seasons AGB recovery of 70.90
ton/ha, when a site is on fertile soils with 10% sand and surrounded by forest cover of 50%.
In contrast, only 5.24 ton/ha is predicted on acidic-poor soils with 67% sand and 0% forest
2
4
20
21
22
23
24
25
26
27
28
29
30
31
32
33
34
35
36
37
38
39
40
41
42
56

cover. Increasing forest cover favoured smaller trees and habitat-generalists while increasing
sand percentage inhibited taller-species and forest-specialists. Sand percentage constrained
softwoods in fertile soils.
CONCLUSION
Our results confirm that the likelihood of restoration to pre-disturbance conditions is
constrained in contexts of higher degradation, such as when agricultural use adversely
affects soil properties and/or motivates extreme deforestation. Lower AGB found on sandy
soils suggests that forest recovery is sensitive to local drought intensification. Given regional
projections for extended dry seasons, restoration approaches could consider targeting
alternative reference states, rather than historical/undisturbed ones, under highly altered
environments, while aiming to improve soil and microclimate conditions to allow moist
tropical forest recovery where feasible.
Key words: Atlantic rainforest, disturbance, dispersal, environmental filters,
landscape ecology, recovery, traits
Nomenclature: Brazilian Flora 2020 (http://floradobrasil.jbrj.gov.br; accessed on 6 Jun
2016)
II-INTRODUCTION
Conceptual and practical advances in the field of restoration ecology have encouraged
the launch of forest restoration programs across the globe (Perring et al. 2015a, Suding et al.
2015). Restoration endeavours also occur in tropical hotspots for biological conservation
(Calmon et al. 2011; Wuetrich, 2007), and native tree plantations are widely used as a
central restoration technique (see Rodrigues et al. 2009; Lamb et al. 2005). However,
restoration outcomes from these plantations can be highly variable and hard to predict (Holl 3
7
43
44
45
46
47
48
49
50
51
52
53
54
55
56
57
58
59
60
61
62
63
64
65
6689

& Zahawi 2014). Variability is likely due to regeneration processes being forged by the
interplay of biotic and abiotic legacies (Flinn & Vellend, 2005; Hobbs et al. 2009), as well as
varying disturbance regimes at the local and landscape levels (Suding, 2011; Holl & Aide,
2011). Consequently, to aid restoration practice, and better develop policy
recommendations, we require a greater understanding of the major factors involved in
successful forest recovery (Maron et al. 2012).
Forest restoration takes place as a sequence of interventions aimed to mitigate known
obstacles for secondary succession (del Moral et al. 2007). Projects based in diverse native-
tree-plantations initially target overcoming poor seed dispersal and manipulating species
assembly by re-introducing a selected species pool and managing mortality rates (e.g. by
reducing herbivory and controlling competition). Afterwards, the growth of the planted trees
is expected to reestablish light competition, and facilitate recolonization through seed arrivals
(Reid et al. 2015), and improve the establishment of old-growth forest species. However, the
risk of incomplete transition from a tree plantation to a self-recovering connected forest can
be high, and this disconnect is often attributed to a mixture of local and landscape
constraints (Cramer et al. 2008; Suding 2011).
Locally, the main concerns are edaphic legacies induced by deforestation and
agricultural land-use (Markewitz et al. 2004, Randrianarison et al. 2016). The negative effect
of environmental legacies on the recruitment, growth and reproduction of species is referred
to as environmental limitation (Baeten et al. 2009). For instance, forest recovery can be
directly affected by lower water-holding capacity of sandy soils, exacerbated by agriculturally
driven soil organic matter loss (Matson et al. 1997) or by livestock-mediated soil erosion, with
mortality concentrated on certain species groups (Martinez-Garza et al.2013). Nonetheless,
environmental changes may also promote an asymmetric effect on the species pool, and
4
10
67
68
69
70
71
72
73
74
75
76
77
78
79
80
81
82
83
84
85
86
87
88
89
90
1112
then a few species become overabundant, indirectly constraining forest recovery. As an
example, successional inhibition has been attributed to fern overabundance on acidified soils
in the Brazilian Atlantic Forest domain (Ribeiro et al. 2013). These early responses to
environmental filters can also cause long-term implications for tropical forest succession. For
example, Lebrija-Trejos et al. (2010) showed that structural development (i.e. crown area,
basal area, and tree density) in tropical dry-forests shapes the local environment (i.e. light,
temperature and moisture). This changed local environment altered the trajectory of
community assembly through selecting species with certain functional traits.
At a broader scale, “helpful” neighbourhoods, such as well-forested landscapes, can be
very beneficial to the restoration process (de Rezende et al. 2015). Ideally, neighbouring
forests are functionally connected to the restoration site, and propagules are shared with
restoration plantings through seed-rain (Barbosa & Pizo, 2006; Zahawi et al. 2013), but
studies indicate that relatively short distances between forest patches pose an effective
barrier to seed dispersal (Kauano et al. 2013; Souza et al. 2014). Other processes are also
moderated by the landscape arrangement because forest surroundings tend to be moister
and colder (Baker et al. 2014) and are more likely to obtain nutrients by lateral diffusion, for
instance through animal translocation (Wolf et al. 2013) or litter fall. Overall, forest cover
within a set radius of the target restoration site provides a good proxy of these
neighbourhood effects on biomass recovery and community assembly.
Aboveground biomass (AGB) is a straightforward proxy to assess forest restoration
success, and responses to environmental conditions, by combining forest-recovery
outcomes in terms of stem density, tree growth and composition. Non-destructive AGB
estimation is relatively well established for tropical forests (Ducanson et al. 2015), and
empirical evidence indicates biomass as the main driver of changes in ecosystem process
5
13
91
92
93
94
95
96
97
98
99
100
101
102
103
104
105
106
107
108
109
110
111
112
113
114
1415

rates during tropical forest succession (Lohbeck et al. 2015). Hence, low AGB represents a
poor restoration outcome, and in general, indicates poor conditions for restoration.
Total AGB combines primary production from different species groups in variable
proportions, and in part, relative abundances respond to the scarcity or abundance of
resources that favour alternative competitors (Lasky et al. 2014). Dominance in term of AGB
is therefore expected to reflect environmental conditions, and quantifying these patterns may
reveal local inhibitors for the restoration process. In particular, we expected softwood-
species to be more likely to be excluded if pronounced drought is a key mortality driver,
since denser woods enhance plant resistance to xylem cavitation, fire, wind, and grazing
(Poorter & Markesteijn, 2008). In turn, favourable edaphic conditions support the
development of productive forests, and maximum height (Hmax) then becomes an important
trait associated with the competitive ability for light (Shamp & Aarssen, 2009). We also
anticipated harsher restoration conditions to be less adverse for species of low specialization
to mature forest environments. This prediction is also partly due to results that have shown
the vulnerability of forest-specialists to deforestation and landscape fragmentation (Pardini et
al. 2010; Banks-Leite et al. 2014).
In this study we assessed results from a Brazilian restoration program, to quantify the
effect of edaphic conditions and the influence of neighbouring forest cover on biomass
accumulation and its composition. Our main hypothesis is that total AGB recovery responds
to local edaphic conditions and to the amount of forest cover in the neighbouring area. Also,
we hypothesize that some species groups are particularly sensitive to local conditions,
affecting the community assembly as a whole, and favouring generalists species more
adapted to open anthropogenic woodlands.
6
16
115
116
117
118
119
120
121
122
123
124
125
126
127
128
129
130
131
132
133
134
135
136
137
1718

III-METHODS
Study Area
In 2007 the PRMC program (“Projeto de Recuperação de Matas Ciliares”) started the
implementation of over 500 restoration demonstration sites in private lands across São
Paulo state, south-eastern Brazil (Wuetrich, 2007; Chazdon, 2008). For the present study,
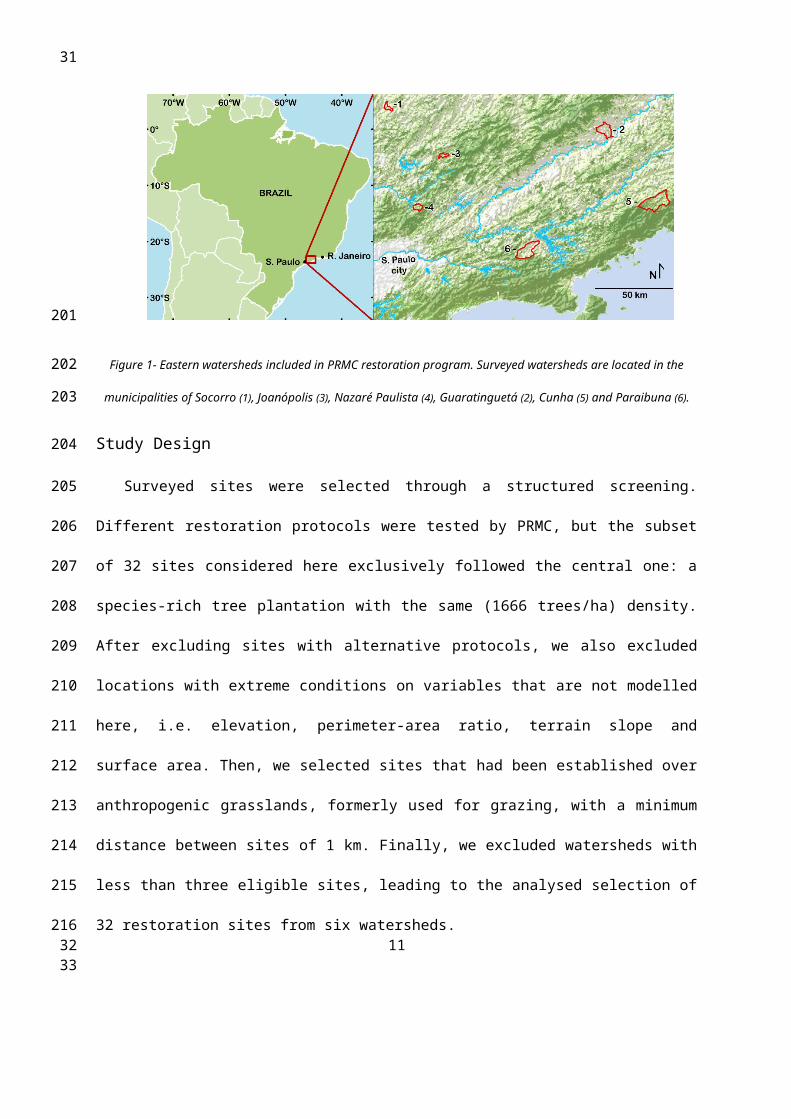
restoration sites were selected within the boundaries of the Serra do Mar coastal forests
(Olson et al. 2001); these sites are underlain by granite-gneiss lithology in the “Atlantic
plateau” geomorphic and botanical provinces (Scudeller et al. 2001). Restoration sites were
situated within six watersheds, and distances between watersheds ranged from 30 to 150
km (Figure 1). Across the restoration sites, elevation ranges from 550 to 1510 m above sea
level, annual precipitation ranges from 1400 to 1700 mm, and the dry season (average
rainfall below 50 mm/month) varies between 3 and 5 months (Hijmans et al. 2005).
Deforestation of these lands was stimulated by coffee cultivation in the early 19th century,
exposing the soil to rainfall and increasing surface runoff and erosion. A few decades later,
coffee plantations were replaced by dairy farming (Dean, 1991). The still prevalent pastures
are now spread around scattered croplands, forestry plantations, as well as urban and forest
patches.
7
19
138
139
140
141
142
143
144
145
146
147
148
149
150
151
152
153
154
155
2021

Figure 1- Eastern watersheds included in PRMC restoration program. Surveyed watersheds are located in the
municipalities of Socorro (1), Joanópolis (3), Nazaré Paulista (4), Guaratinguetá (2), Cunha (5) and Paraibuna (6).
Study Design
Surveyed sites were selected through a structured screening. Different restoration
protocols were tested by PRMC, but the subset of 32 sites considered here exclusively
followed the central one: a species-rich tree plantation with the same (1666 trees/ha)
density. After excluding sites with alternative protocols, we also excluded locations with
extreme conditions on variables that are not modelled here, i.e. elevation, perimeter-area
ratio, terrain slope and surface area. Then, we selected sites that had been established over
anthropogenic grasslands, formerly used for grazing, with a minimum distance between sites
of 1 km. Finally, we excluded watersheds with less than three eligible sites, leading to the
analysed selection of 32 restoration sites from six watersheds.
Restoration sites were implemented between the autumn of 2007 and the subsequent
summer following similar protocols. Several local nurseries produced the seedlings; they
adopted a broad species list and supplied individuals about 40 cm tall. Planting holes were
prepared systematically before planting, typically in a 3 by 2 m grid and species were mixed
at random. Dead saplings were replaced in the following growing-season, with species
8
22
156
157
158
159
160
161
162
163
164
165
166
167
168
169
170
171
172
173
2324
identity selected at random from the general planting list. Native and invasive grasses were
controlled during the implementation phase, through herbicide application and manual
control, but woody individuals were maintained. We note that detailed records of the species
introduced at each site were taxonomically imprecise, and that the supply of species
especially varied for replacement, but the mix of species was never planned to be different. It
is therefore unlikely that there were major biases in planted species abundances among
sites at project initiation. We have therefore assumed that the planted species-groups mix
was essentially identical at all sites, and subsequent differences in growth and community
assembly are due to site and landscape factors (Data for each species are listed in Appendix
S1).
Data Collection
These restoration trials were surveyed seven growing-seasons after the beginning of
implementation. Four vegetation plots (4 x 50 m) were randomly demarcated within each
restoration site. Woody individuals with diameter at breast height (DBH) ≥ 5 cm had their
height and DBH recorded, and were identified to the species level; multi-stemmed individuals
were included when the sum of cross-section areas at breast height was larger than the
corresponding cut-off area (i.e. 19.6.cm²). Those that could not be consistently identified in
the field had leaf/floral samples taken to allow further identification at the ESA herbarium
(ESALQ-USP). We have adopted the minimum DBH of 5 cm as required by the allometric
equation we used (Chave et al. 2014), as detailed further below.
Composite soil samples were taken inside each vegetation plot at 0-20 cm depth, by
combining three sub-samples collected in the major axis of the parcel, at least 20 m apart
from each other. These samples were analysed at IAC (Instituto Agronômico de Campinas),
using their standard procedure for fertility and texture evaluation, which included pH (CaCl2);
9
25
174
175
176
177
178
179
180
181
182
183
184
185
186
187
188
189
190
191
192
193
194
195
196
197
2627
H+Al (potential acidity SMP-Buffer); P, K, Ca and Mg (Resin); Organic Matter (photometry),
and Sand contribution (0.053-2.000 mm).
To assess the amount of habitat around the restoration sites, land-cover maps were
produced using visual interpretation of orthophotos taken in 2005, two years before the
plantings. The mapped area included an 800-m wide external buffer-zone for each
restoration site, within which we measured the percentages of forest habitat cover from each
plot at 0-200 m, 0-400 m and 0-800 m buffers; here we refer to the variable assessed
through the resulting ratios as “forest cover”.
AGB of each surveyed tree was calculated with the allometric equation for AGB of
tropical forests proposed by Chave et al. (2014). Accordingly, field measured tree height,
and DBH was combined with specific wood density (WD) gathered from literature. Compiled
data and references are presented in the Supplementary Information Appendix S1, in
addition to WD information; this dataset included specific maximum height (Hmax) and a
species categorization on specialization in moist-forests. Individual biomass was summed to
give a plot level biomass estimate. We evaluated variability in plot-level estimates across
restoration sites against predictor variables (i.e. soil properties and neighbouring forest
cover).
We then investigated whether these same predictors had effects on the abundance of
particular species groups in the restoration sites. Species were grouped on the basis of traits
that we expected to influence assembly given the environmental conditions, as noted in the
Introduction. Traits were wood density, height and habitat preference. Other traits could have
been considered, but these were the traits that were best quantified among the surveyed
species.
10
28
198
199
200
201
202
203
204
205
206
207
208
209
210
211
212
213
214
215
216
217
218
219
220
2930
The median density of 0.58 g/cm3, observed among sampled species, was used as a
cut-off density to group soft- and hard-woods. Likewise, 14 m, the median Hmax in our species
poll, was adopted as the cut-off height to separate the groups of “shorter” and “taller”
species. To classify sampled species according to habitat specialization, we first accessed
the geographical distribution of identified species through the Global Biodiversity Information
Facility (GBIF, 2016), and then we compared each occurrence map to the terrestrial
ecoregions map (Olson et al. 2001). Species solely found within broadleaf tropical moist-
forests domains, with no presence recorded at natural non-moist-forest habitats were
considered as “forest-specialists”, while “generalist-species” presented a broader distribution
that overlapped with moist-forest habitats but also included records from non-forest natural
habitats such as tropical savannas and scrublands.
Data Analysis
Aboveground biomass
All data were analysed using R.3.2.0 (R foundation for Statistical Computing, Vienna,
AT). Linear mixed models were used (nlme package, version 3.1-128, R-Core team) to
evaluate the effects of edaphic conditions and forest cover on AGB density (ton/ha). For
greater goodness of fit and to satisfy model assumptions on error distributions, we square-
root-transformed AGB.
Forest cover expressed in percentages, soil chemical fertility and sand-percentage, were
tested as fixed effects, as well as the interaction between chemical fertility and sand
percentage. While forest cover and sand contribution were expressed in percentages, soil
chemical properties needed to be translated into a single dichotomous categorical variable,
given the correlation among chemical aspects, which collectively define broad groups of soil
chemistry. To separate soil groups, we first quantified soil chemistry dissimilarity between
11
31
221
222
223
224
225
226
227
228
229
230
231
232
233
234
235
236
237
238
239
240
241
242
243
244
3233

sites using pairwise Gower distances, and then we performed hierarchical clustering of the
sites based on the full dissimilarity matrix with average linkage using the vegan package
(version 2.3-5, https://cran.r-project.org/web/packages/vegan). We retained two chemical-
fertility groups: one of sites with soils that were richer in nutrients and less acidic (‘fertile
soils’ hereafter), and the other included more acidic soils with lower nutrient concentrations
(‘poor/acidic soils’ hereafter) (see Appendix S2). Then the mixed-effect model was
completed by adding restoration site as a random term to capture between-site variation that
was not explained by the other predictors.
To explore whether plot-level variation in biomass was derived from population
differences (i.e. differences in stem density (trees/ha)), and/or average tree growth rates (i.e.
differences in stem volume (cm3/tree)), models with the same fixed and random terms were
fitted to these additional response variables. Likewise, we investigated if the evaluated
environmental filters affected species richness, and/or diversity. Richness (a simple tally of
the number of species in a plot) and Shannon diversity index (H’) were calculated at plot
level, with R package “vegan”. Then, Shannon diversity was transformed to “effective
species number” (exp(H’)), where species are weighted precisely by their abundances (Jost,
2006). We also tested if any of these models could be significantly improved by nesting
within watershed as an additional random term, or by adding restoration site areal extent as
a fixed term (restoration sites vary from 0.2 to 3.5 ha). However, the effect of including these
variables was never significant, and they were dropped from the final presented models.
Plant community assemblage
As explained above, sampled species were bundled in contrasting groups according to
specific wood density (≤0.58 g/cm3 or >0.58 g/cm3), specific Hmax (≤14 m or >14 m) and
habitat preference (forest-specialists or generalists). Then we evaluated the particular effect
12
34
245
246
247
248
249
250
251
252
253
254
255
256
257
258
259
260
261
262
263
264
265
266
267
268
3536

of AGB predictors we have tested (i.e. forest cover, soil chemical group and sand
percentage) on the relative abundance of each contrasting group. Pairwise comparison for
each species grouping (i.e. WD, Hmax and habitat preference) was enabled through linear
models for multivariate abundance data using the mvabund package (version 3.11.9,
https://cran.r-project.org/web/packages/mvabund). Model-based analysis of multivariate
abundance data was performed at the site scale, by considering average values for
response and explanatory variables among the four plots of each one of the 32 restoration
sites.
Only individuals identified at the species level were considered in these analyses,
representing 84.9% of the total AGB surveyed. Species list, groups and references are
presented in Appendix S1. Significance of the fitted effects were tested with ANOVA using
adjusted p-values (9,999 permutations) and then predicted abundances were estimated, also
using the mvabund package. Lastly, a Spearman’s rank correlation test was used to
investigate whether there was association between traits-based groupings and if any
considered group was related to higher or lower total biomass.
IV-RESULTS
Variation in potential explanatory variables and above ground biomass
Among the 128 plots, AGB ranged from zero to 104.7 ton/ha, with a median of 10.4
ton/ha. Averaging plots across restoration sites led to AGB ranging from 0.4 to 84.4 ton/ha
(median = 12.0 t/ha). Stem density ranged from 0 to 1800 individuals/ha (median = 425.0
individuals/ha), thereby ranging between no recruitment at all, and 8% higher than the initial
plantation density. In total 1216 individuals were sampled, 12 could not be identified due the
condition of the plants, and 1092 were identified up to the species level. About half of
species (53 of a total of 104 species) had fewer than four individuals in the entire survey.13
37
269
270
271
272
273
274
275
276
277
278
279
280
281
282
283
284
285
286
287
288
289
290
291
2923839

Sand percentage ranged from 10% to 67% (median = 51.8%). The two soil
categories based on acidity and nutrient concentrations (‘chemical fertility’ hereafter)
contrasted better in Ca, Mg, and P concentrations (acidic/poor medians (in mmol/dm3): Ca =
6.0, Mg = 2.0 and P = 4.0; fertile medians: Ca = 25.0, Mg = 8.0, and P = 7.0). Also,
“poor/acidic” soils presented a median pH of 4.2, (interquartile range, 4.0 to 4.3); while fertile
soils presented a median pH of 4.8, (interquartile range, 4.5 to 4.9). Detailed information on
the soil analysis is provided in the supplementary material (Appendix S2). Forest cover within
the 200-m buffer ranged from 0% to 50% (median=10.4%), average forest cover for each
restoration site for each of the buffer range is provided in Supplementary Material (Appendix
S3).
Biomass Model
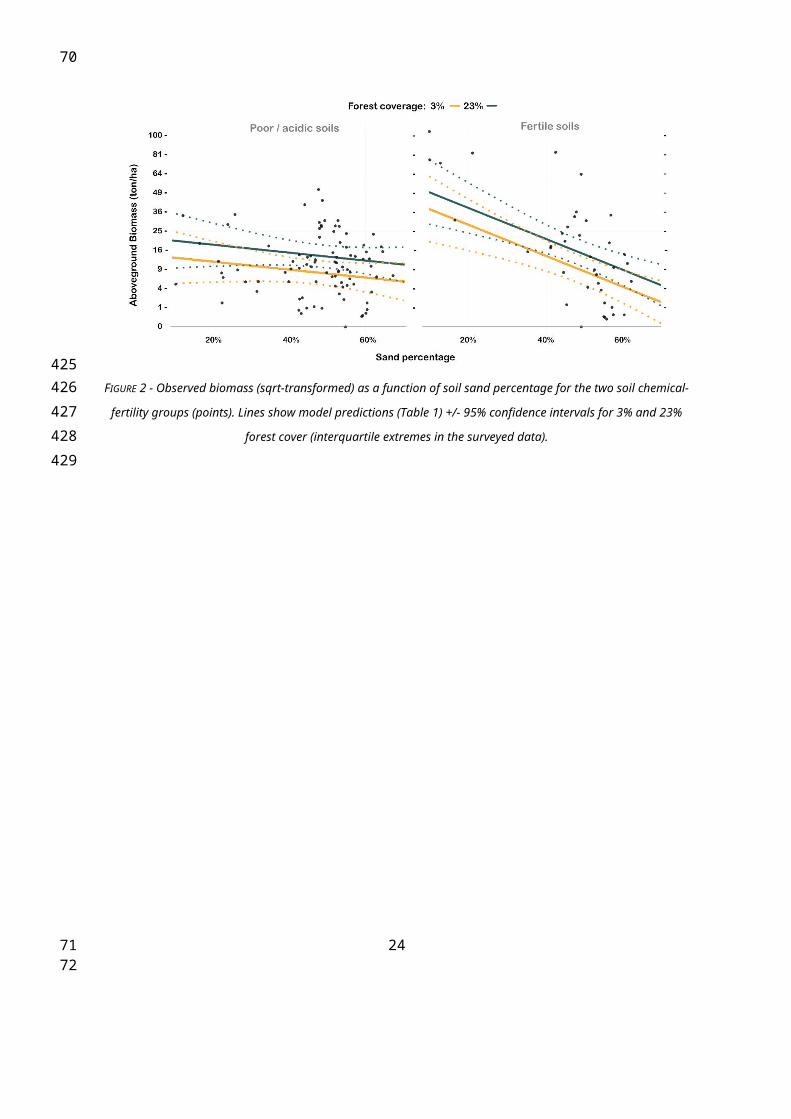
AGB was significantly influenced by environmental factors acting at a local scale. In
particular, AGB decreased as sand percentage increased, but the effect depended on
chemical fertility. The effect of increasing sand percentage was minor on acidic/poor soils
because they showed low AGB along the entire sand-percentage gradient, but the decline in
AGB was strong on fertile soils (Table 1; Figure 2). On the other hand, neither chemical
fertility nor sand percentages presented any significant interactions with forest cover. AGB
also increased as forest cover increased within 200 m of the site. Interestingly, no significant
effect from forest cover was detected with enlarged buffer zones. The absence of a
significant forest cover effect with 400-m and 800-m buffer zones was observed with AGB,
tree density, and mean stem volume as response variables (results not shown).
Survival of planted species at the restoration sites appeared to drive AGB variability:
stem density was related to the same set of explanatory variables as AGB. In contrast,
growth of trees (as represented by stem volume) was only influenced by forest cover and,
14
40
293
294
295
296
297
298
299
300
301
302
303
304
305
306
307
308
309
310
311
312
313
314
315
316
4142

surprisingly, not by the edaphic factors at any given site. This is despite the fact that higher
stem volumes of any given individual will be associated with higher AGB for any given wood
density.
AGB correlated strongly with species richness and Shannon diversity (exp(H’)); however,
species richness and Shannon diversity were solely associated with the interaction between
sand percentage and chemical fertility and were not associated with any single
environmental predictors (Table 1).
15
43
317
318
319
320
321
322
323
324
4445
TABLE 1 EFFECTS OF SOIL SAND PERCENTAGE, SOIL FERTILITY GROUP AND FOREST COVER ON THE PLOT-LEVEL BIOMASS
(TON/HA), STEM DENSITY (TREES/HA), STEM VOLUME (AVERAGE CM³/TREE) AND SHANNON DIVERSITY. RESULTS SHOW AN
ANOVA TABLE RESULTING FROM LINEAR MIXED MODELS; SEE TEXT FOR MODEL STRUCTURE.
Response Predictor denDF F-valuep-
value
Biomass (square root)
Sand(%) 92 8.756 0.004**
Soil group 92 0.424 0.516Forest
coverage 92 11.979 <0.001**
Sand:Soil 92 5.458 0.022 *
Stem density
Sand(%) 92 9.814 0.002**
Soil group 92 0.082 0.776Forest
coverage 92 3.910 0.051 .
Sand:Soil 92 8.040 0.006**
Average stem volume
(square root)
Sand(%) 90 3.162 0.079
Soil group 90 2.665 0.106Forest
coverage 90 12.859 <0.001**
Sand:Soil 90 0.856 0.357
Species richness
Sand(%) 90 2.899 0.092
Soil group 90 0.239 0.626Forest
coverage 90 1.036 0.311
Sand:Soil 90 7.808 0.006**
Shannon (exponential)
Sand(%) 901.7669
7 0.187
Soil group 90 0.9645 0.329Forest
coverage 900.6487
2 0.423
Sand:Soil 904.4331
1 0.038 *
16
46
325
326327
4748

FIGURE 2 - Observed biomass (sqrt-transformed) as a function of soil sand percentage for the two soil chemical-
fertility groups (points). Lines show model predictions (Table 1) +/- 95% confidence intervals for 3% and 23%
forest cover (interquartile extremes in the surveyed data).
17
49
328329
330331332
5051
Community Models
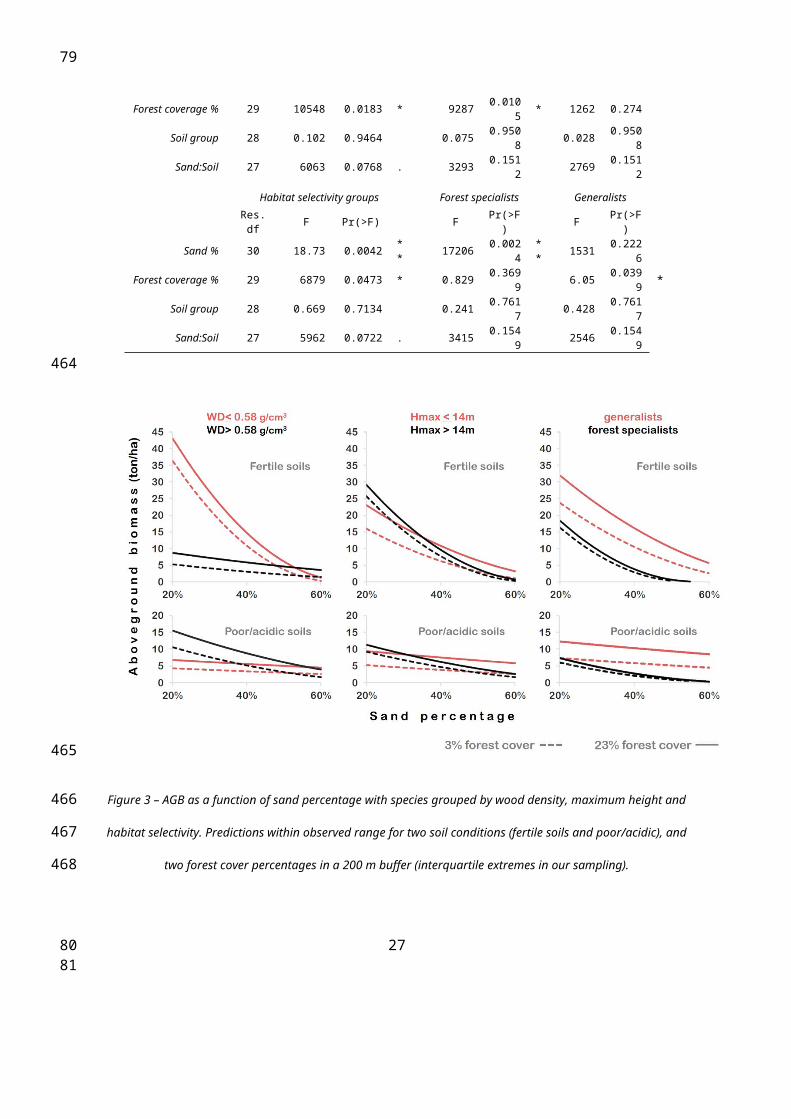
Tree community-composition responded to environmental context. Sand percentage
affected all trait groupings. AGB from softwoods, taller-species and forest-specialists
negatively correlates with sand percentages. Moreover, the resulting model predicts the
absence of forest-specialists once the sand fraction is over 55%, despite the substantial
contribution from forest-specialists to the total AGB predicted for fertile non-sandy soils
(>30%).
Forest cover in the 200 m buffer affected AGB predictions for all trait groupings except
wood density. AGB from shorter-species and generalist-species positively correlates with
forest cover. In contrast, chemical fertility, alone, was not a good predictor of AGB for any of
these groups. However, the interaction between fertility and sand percentage was highly
significant for WD groups. The negative effect of sand percentages on softwood AGB was
highly significant on fertile soils, and non-significant on acidic/poor soils (Table 2 and Figure
3).
No clear correlation was found between species groupings. AGB share between WD
groups did not correlate to habitat selectivity or Hmax ratios, despite the preponderance of
softwood-species among forest-specialists (18:26 spp.) and of hardwoods among shorter
species (28:51 spp.). Still, a moderate correlation was found between AGB shares of forest
specialists and taller species, and hence between generalists and shorter species ratios
(Spearman ρ = 0.525, p=0.002), which is consistent with preponderance of shorter-species
among habitat-generalists (47:78 spp.), and of taller-species among forest-specialists (18:26
spp.). Surprisingly none of these groupings was a good predictor of total AGB. The biomass
share between WD and Hmax groups weakly correlated to total AGB (ρ = 0.375, p=0.035 and
Spearman ρ = 0.356, p=0.046, respectively) but not to habitat-selectivity groups.
18
52
333
334
335
336
337
338
339
340
341
342
343
344
345
346
347
348
349
350
351
352
353
354
355
356
5354

TABLE 2 - ANOVA RESULTS FOR LINEAR MODEL FITS FOR THE MULTIVARIATE ABUNDANCE DATA, WITH SPECIES
GROUPS AS RESPONSES. “GLOBAL TEST” SHOWS THE OVERALL EFFECTS OF THE PREDICTORS ON THE MULTIVARIATE
ABUNDANCE DATA, WHEREAS THE “UNIVARIATE TEST” SHOWS EFFECTS OF THE PREDICTORS ON THE INDIVIDUAL SPECIES
GROUPS.
Predictor "Global test" Univariate test
Wood density groups (WD) WD ≤ 0.58 g/cm3 WD > 0.58 g/cm3
Res. df F Pr(>F) F Pr(>F) F Pr(>F)
Sand % 30 8.1 0.0373 * 5974 0.0483 * 2126 0.1525
Forest coverage % 29 7646 0.0350 * 4796 0.0697 . 2.85 0.0995
Soil group 28 2181 0.3504 1528 0.4056 0.653 0.4296
Sand:Soil 27 13973 0.0037 **
13693 0.0029 **
0.279 0.5920
Maximum height groups (Hmax) Hmax ≤ 14m Hmax > 14m
Res. df F Pr(>F) F Pr(>F) F Pr(>F)
Sand % 30 11299 0.0153 * 2008 0.1666 9291 0.011 *
Forest coverage % 29 10548 0.0183 * 9287 0.0105 * 1262 0.274
Soil group 28 0.102 0.9464 0.075 0.9508 0.028 0.9508
Sand:Soil 27 6063 0.0768 . 3293 0.1512 2769 0.1512
Habitat selectivity groups Forest specialists Generalists
Res. df F Pr(>F) F Pr(>F) F Pr(>F)
Sand % 30 18.73 0.0042 **
17206 0.0024 **
1531 0.2226
Forest coverage % 29 6879 0.0473 * 0.829 0.3699 6.05 0.0399 *
Soil group 28 0.669 0.7134 0.241 0.7617 0.428 0.7617
Sand:Soil 27 5962 0.0722 . 3415 0.1549 2546 0.1549
19
55
357
358
359
360
361
5657

Figure 3 – AGB as a function of sand percentage with species grouped by wood density, maximum height and
habitat selectivity. Predictions within observed range for two soil conditions (fertile soils and poor/acidic), and two
forest cover percentages in a 200 m buffer (interquartile extremes in our sampling).
V-DISCUSSION
Assessing the varying results from the restoration program PRMC, and investigating
their relationships with local environmental context, provides the opportunity to refine general
predictions for tropical forest restoration. Combining plot-level estimates to the site scale
confirmed our observations that restoration outcomes ranged from open fields to dense
regenerating forests. The average vegetation presents the appearance of an early stage low-
stature woodland as indicated by a mean stem density of 475 trees/ha, with relatively small
average tree size (averages: height = 6 m, DBH = 11 cm). AGB accumulation was
particularly constrained by sandy soils, and by lower forest cover within 200 m of the
restoration site. These factors also promoted particular patterns of community assembly, and
critically both are often intensified by agricultural land-use. Notably, our results suggest that 20
58
362
363
364
365
366
367
368
369
370
371
372
373
374
375
3765960
unfavourable environmental contexts are not exceptions in areas designated for restoration
(given the low median AGB across plots). Instead, such conditions can be prevalent, which
will have marked effects on the cost-efficiency and success-rates of large restoration
programs previously announced for tropical forests (Calmon et al. 2011, Durigan et al. 2013).
Lastly, in the light of ecological theory, we discuss the role of environmental drivers in
engendering variability in AGB accumulation and community composition, focusing on how
our results can assist successful restoration programs.
Aboveground Biomass responses
The extensive database analysed by Poorter et al. (2016) indicates an average AGB
recovery of 122 ton/ha during the first twenty years of neotropical secondary forests, with
higher AGB yields in the first years. Hence the expected AGB recovery in the seven growing
seasons investigated here would be around or above 40 ton/ha. However, we observed an
average seven growing-seasons AGB accumulation of 16 ton/ha, suggesting that recovery
conditions are largely poor in the studied rural landscapes. Our analysis pointed to forest
cover and sand percentage as major drivers of AGB recovery; chemical fertility, in turn, did
not affect AGB recovery by itself, but it was involved with an interaction with sand
percentage.
Our model results predict low AGB recovery on sandy soils regardless of chemical
fertility, with similar performance on non-sandy acidic/poor soils. However, much higher AGB
is predicted for non-sandy fertile soils. Accordingly, Holl & Zahawi (2014) attributed a
supporting role for soil chemical-fertility on tropical forest recovery. Also, Poorter et al. (2016)
reported a minor effect of chemical-fertility on AGB uptake, compared to water availability.
This pattern is possibly dynamic given that forest growth both affects and is influenced by
soil properties (Honnay et al. 2002; Lebrija-Trejos et al. 2010). Even so, this interdependent
21
61
377
378
379
380
381
382
383
384
385
386
387
388
389
390
391
392
393
394
395
396
397
398
399
400
6263

relation (growing forests and soil underneath them) raises an interesting point: diverging
recovering trajectories may perpetuate if differences in edaphic conditions persist along the
recovery process. Therefore, long-term assessments are needed to properly investigate if
initially diverse recovering forests will converge in the future, as expected by practitioners.
Sandier soils are associated with higher seedling mortality due to lower water-holding
capacity (Hallett et al. 2014). Interestingly, in our study, sand percentage was highly
significant as a predictor of stem densities, but was not significant for average stem size,
suggesting a stronger link to mortality rates as compared to growth rates. This reinforces the
argument that the connection between observed sand percentage and AGB is likely due to
drought mortality. Webb et al. (2005) found diminishing rainy days correlating to decreasing
forest cover across São Paulo state. At the broader scale, tree mortality and forest die-off
intensification have been associated with “hotter drought”, which can be attenuated at
“buffered-refugia” if landscape heterogeneity provides climate relicts where growing trees
have cooler-moister conditions (Allen et al. 2015). It seems reasonable to assume that hotter
drought is intensified by the agricultural matrix in the studied region, and that soil
heterogeneity can amplify or attenuate water shortage. Our results suggest that patches of
non-sandy soils are favourable for AGB recovery due to better moisture regulation, possibly
at levels that are closer to those found under tropical forests and gaps.
If human-induced drought intensification is such an important recovery driver, perhaps
the effective spontaneous recovery reported for landscapes with greater forest cover (de
Rezende et al. 2015; Zahawi et al. 2013; de la Peña-Domene et al. 2014) results from
greater microclimate buffering, where proximity to forest relicts ameliorates microclimatic
differences between forests and open grasslands. Still, we found no significant interaction
between forest cover and sand percentage, which could indicate climatic buffering.
22
64
401
402
403
404
405
406
407
408
409
410
411
412
413
414
415
416
417
418
419
420
421
422
423
424
6566

Similarly, we found no significant interaction between forest cover and soil fertility, showing
no evidence of nutrient buffering by lateral diffusion. In this case, it is suggested that the
consistent forest cover effect that we observed is most likely related to biotic connection, e.g.
through seed dispersal.
Intriguingly, the amount of forest cover in the 200 m buffer was the most significant
predictor of AGB. This pattern was related to the average size of trees, but not with the
number of trees. Hence if, as our data indicate, there is no significant interaction between
forest cover and soil properties, larger trees in forested landscapes may not be related to
favourable edaphic conditions, but possibly result from particular species assemblages, with
greater abundance of species that grow faster during early forest recovery, as we discuss in
the following section
Tree community assemblage
Strong correlations were observed between AGB and species richness, as well as
between AGB and exp(H), adding weight to the perspective that restoring diversity is
important for AGB recovery (Perring et al. 2015b). Here, effective species number exp(H’)
and species richness were consistently higher in non-sandy fertile soils. Moreover, functional
composition presented some clear responses to environmental variables, by means of tree-
assemblage singularities.
In our observations, softwood-species were highly prevalent, and taller-species
presented a minor dominance in conditions of higher AGB recovery, which is consistent with
findings from Rüger et al. (2012), relating higher intrinsic growth rates to taller stature and
lower WD among tropical trees. Similar relations were found by Wright et al. (2010) for fast-
growing and short-lived species, given they are light-demanding pioneer tropical trees,
particularly benefiting from faster growth rates, which is consistent with early stages here 23
67
425
426
427
428
429
430
431
432
433
434
435
436
437
438
439
440
441
442
443
444
445
446
447
4486869
surveyed. Biomass share among WD groups also indicated that softwood species are more
sensitive to sand percentage, supporting the sand-drought relation, which is also reflective of
lower endurance to drought in softwood species (Poorter & Markesteijn 2008). However,
softwood species were predicted to be always rare in poor/acidic soils, regardless of sand
percentage. We did not observe taller-species prevalence in productive forest (as indicated
by fertile soils), as would be predicted by increased light competition (Shamp & Aarssen
2009). This lack of a relationship may be attributed to the early stage we surveyed, when
growth speed is more important to AGB composition than the achievable height or longevity.
However, under unfavourable edaphic conditions, reduced contributions from taller and/or
softwood species is potentially a persistent pattern, given that the reduced AGB uptake
evident under these conditions is still far smaller than expectations for tropical forest
succession.
Above-ground biomass from forest-specialists presented a high sensitivity to sand
concentration, and this can be considered particularly challenging for biodiversity
conservation because the pool of species which better represents the restoration target are
predicted to disappear where sand percentage is greater than 55%. Also, the rarity of forest
specialists in sandier, and consequently drier, environments may be a pattern that persists
into the future, because the positive effect from forest cover was only significant for
generalist-species and shorter trees; then forest-specialist-species are unlikely to arrive from
neighbouring forests.
In part, the local diversity we have surveyed reflects the status of regional diversity
(following Ricklefs, 1987), and we note that a large proportion of current Atlantic Forest is
relatively recent second growth (Lira et al. 2012), favouring short-living and fast-growing
pioneer species. Pardini et al. (2010) showed an abrupt loss of forest-specialist taxa (but not
24
70
449
450
451
452
453
454
455
456
457
458
459
460
461
462
463
464
465
466
467
468
469
470
471
472
7172
habitat generalists), in landscapes where Brazilian Atlantic Forest cover was reduced to
between 31% and 11%. In the present study, half of the landscapes were above 11% forest
cover, and only 3 in 32 restoration sites presented more than 31% of forest cover. Therefore,
the positive correlation between forest cover and the relative abundance of habitat
generalist-species is the expected pattern since remnant forests are largely disturbed and
because high forest cover rates (e.g. >50%) were never found in our study region.
A lower regional level of diversity, together with poor dispersal, implies the surpassing of
a biotic threshold for recovery (Hobbs et al. 2009). On the other hand, the general absence
of endemic old-growth forest-species on sandy soils could indicate an abiotic threshold to
recovery. These ideas require further testing, accompanied by monitoring of restoration
sites. Future studies could also benefit from the compositional description of neighbouring
forests, together with target restoration sites being surrounded by greater variation in forest
cover than investigated here (Table SI3). If sufficient variation in both these variables could
be assessed, i.e. multiple community compositions at multiple different forest covers, it may
be possible to segregate the importance of dispersal limitation and reduced regional diversity
on the success of restoration in target sites.
Implications for restoration planners and practitioners
Palmer et al. (1997) highlight the importance of finding the appropriate spatial scale for
successfully restoring ecosystem function. Our AGB model demonstrates the relevance of
recovery drivers operating at the local scale: there was no influence of forest cover at radii of
400 and 800 m, while there was significant variation in AGB, which reflected the large
variation in soil properties among watersheds. Similarly, Holl & Zahawi (2014) have pointed
that edaphic conditions may greatly vary across short distances in a tropical region. Also,
Rezende et al. (2015), Kauano et al. (2013) and Souza et al. (2013) reported the limited
25
73
473
474
475
476
477
478
479
480
481
482
483
484
485
486
487
488
489
490
491
492
493
494
495
496
7475

reach of benefits from remnant habitat proximity (up to 200 m). These findings indicate that
landscape heterogeneity within 200 m must be assessed in restoration actions.
Restoration practitioners can easily assess the environmental predictors we evaluated in
this study in the pre-implementation phase, i.e. when planning where and what to restore.
Simple mitigation actions may be effective in some conditions, but these require tests and
observation. Restoration assessment standards (e.g. Chaves et al. 2015) can be usefully
applied to boost this learning process, along with updating and fine-tuning outcome
predictions. For example, predictive models could be improved by quantifying the effect of
techniques to increase soil water-holding capacity (e.g. organic matter or biochar
incorporation) or ameliorate the microclimate (e.g. windbreaks or buffering woody
agriculture) on restoration success. Also, acknowledging the land-use legacy effect on
ecosystem recovery may also indicate how current agricultural practices can avoid creating
hostile environments for future recovery (e.g. by implementing soil conservation and habitat
protection practices).
VI-CONCLUSION
We have shown that sandy soils can severely constrain tropical forest restoration, that
favourable soil chemical properties are highly effective at promoting AGB in non-sandy soils,
and that neighbouring forest cover consistently supported woody biomass recovery. Along
with total AGB response, the tree-community composition changed with varying
environmental conditions. In these early stages of recovery, biomass from softwoods and
forest-specialist species was particularly sensitive to sand percentage, and AGB from small
trees and generalist species was the most positively affected by forest cover. Notably, forest
specialist-species were absent in drought-prone sites whenever sand percentage increased
above 55%. Our results corroborate the need for fine-scale evaluations to predict restoration
26
76
497
498
499
500
501
502
503
504
505
506
507
508
509
510
511
512
513
514
515
516
517
518
519
520
7778
outcomes and suggest that degradation associated with agricultural practices constrains the
likelihood of restoration to pre-disturbance conditions, particularly where soil has been
degraded and/or massive deforestation has been carried out. When abiotic conditions are
favourable, native tree planting may likely be a successful technique depending on biological
drivers of forest succession. However, further abiotic disturbance implies the necessity of
manipulating edaphic conditions, coupled with the long-term presence of alternative
communities. Given projections for increasing drought in this region, across scales,
alternative restoration targets must be considered for drought-prone conditions.
VII-ACKNOWLEDGEMENTS
The authors gratefully acknowledge the financial support - grant 2013/24851-0, São
Paulo Research Foundation (FAPESP), and cooperation from Biodiversity and Natural
Resources Coordination – CBRN - São Paulo state). We thank two anonymous reviewers,
Adriana Martini, Mara Marinho and Marcelo Ferreira for valuable comments on earlier drafts
of this article. The authors declare no conflict of interest.
VIII-REFERENCES
Allen, C.D., Breshears, D.D. & McDowell, N.G. 2015. On underestimation of global
vulnerability to tree mortality and forest die‐off from hotter drought in the Anthropocene.
Ecosphere 6: 1-55.
Baeten, L., Bauwens, B., De Schrijver, A., De Keersmaeker, L., Van Calster, H.,
Vandekerkhove, K., Roelandt, B., Beeckman, H. & Verheyen, K. 2009. Herb layer changes
(1954‐2000) related to the conversion of coppice‐with‐standards forest and soil
acidification. Applied Vegetation Science 12: 187-197.
Baker, T.P., Jordan, G.J., Steel, E.A., Fountain-Jones, N.M., Wardlaw, T.J. & Baker, S.C.
27
79
521
522
523
524
525
526
527
528
529
530
531
532
533
534
535
536
537
538
539
540
541
542
543
8081

2014. Microclimate through space and time: Microclimatic variation at the edge of
regeneration forests over daily, yearly and decadal time scales. Forest Ecology
Management 334: 174–184.
Banks-Leite, C., Pardini, R., Tambosi, L.R., Pearse, W.D., Bueno, A.A., Bruscagin, R.T.,
Condez, T.H., Dixo, M., Igari, A.T., Martensen, A.C. & Metzger, J.P., 2014. Using
ecological thresholds to evaluate the costs and benefits of set-asides in a biodiversity
hotspot. Science, 345: 1041-1045.
Barbosa, K.C. & Pizo, M.A. 2006. Seed rain and seed limitation in a planted gallery forest in
Brazil. Restoration Ecology 14: 504–515.
Calmon, M., Brancalion, P.H.S., Paese, A., Aronson, J., Castro, P., da Silva, S.C. &
Rodrigues, R.R. 2011. Emerging threats and opportunities for large-scale ecological
restoration in the atlantic forest of Brazil. Restoration Ecology 19: 154-158.
Chave, J., Réjou-Méchain, M., Búrquez, A., Chidumayo, E., Colgan, M.S., Delitti, W.B.C.,
Duque, A., Eid, T., Fearnside, P.M., Goodman, R.C., (. . .) & Vieilledent, G. 2014. Improved
allometric models to estimate the aboveground biomass of tropical trees. Global Change
Biology 20: 3177–3190.
Chaves, R.B., Durigan, G. & Brancalion, P.H.S. & Aronson, J. 2015. On the need of legal
frameworks for assessing restoration projects success: New perspectives from São Paulo
state (Brazil). Restoration Ecology 23: 754-759.
Chazdon, R.L. 2008. Beyond deforestation: Restoring forests and ecosystem services on
degraded lands. Science 320: 1458–1460.
Cramer, V.A., Hobbs, R.J. & Standish, R.J. 2008. What's new about old fields? Land
abandonment and ecosystem assembly. Trends in Ecology & Evolution 23:104-112.
28
82
544
545
546
547
548
549
550
551
552
553
554
555
556
557
558
559
560
561
562
563
564
565
566
8384
Dean, W. 1997. With broadax and firebrand: The destruction of the Brazilian Atlantic Forest.
University of California Press.
de la Peña-Domene, M., Martínez-Garza, C., Palmas-Pérez, S., Rivas-Alonso, E. & Howe,
H.F. 2014. Roles of birds and bats in early tropical-forest restoration. PLoS One 9:
e104656.
de Rezende, C.L., Uezu, A., Scarano, F.R. & Araujo, D.S.D. 2015. Atlantic forest
spontaneous regeneration at landscape scale. Biodiversity and Conservation 24: 2255-
2272.
del Moral, R., Walker, L.R. & Bakker, J.P. 2009. Insights gained from succession for the
restoration of landscape structure and function, in: Walker, Lawrence R., Joe Walker, and
R.J.H. (Ed.), Linking Restoration and Ecological Succession. Springer, New York, pp. 19–
44.
Duncanson, L.I., Dubayah, R.O. & Enquist, B.J. 2015. Assessing the general patterns of
forest structure: Quantifying tree and forest allometric scaling relationships in the United
States. Global Ecology & Biogeography 24: 1465-1475.
Durigan, G., Guerin, N. & da Costa, J.N.M.N. 2013. Ecological restoration of Xingu Basin
headwaters: motivations, engagement, challenges and perspectives. Philosophical
Transactions of the Royal Society of London B: Biological Sciences 368: 20120165.
Flinn, K.M. & Vellend, M. 2005. Recovery of forest plant communities in post-agricultural
landscapes. Frontiers in Ecology and the Environment 3: 243–250.
Hallett, L.M., Standish, R.J., Jonson, J. & Hobbs, R.J. 2014. Seedling emergence and
summer survival after direct seeding for woodland restoration on old fields in south‐western
Australia. Ecological Management & Restoration 15: 140-146.
29
85
567
568
569
570
571
572
573
574
575
576
577
578
579
580
581
582
583
584
585
586
587
588
589
8687

Hijmans, R.J., Cameron, S.E., Parra, J.L., Jones, P.G. & Jarvis, A. 2005. Very high
resolution interpolated climate surfaces for global land areas. International Journal of
Climatology 25: 1965–1978.
Hobbs, R.J., Higgs, E., Harris, J. A. 2009. Novel ecosystems: implications for conservation
and restoration. Trends in Ecology Evolution 24: 599–605.
Holl, K.D. & Aide, T.M. 2011. When and where to actively restore ecosystems? Forest
Ecology and Management 261: 1558-1563.
Holl, K.D. & Zahawi, R. A. 2014. Factors explaining variability in woody above-ground
biomass accumulation in restored tropical forest. Forest Ecology and Management 319:
36–43.
Honnay, O., Bossuyt, B., Verheyen, K., Butaye, J., Jacquemyn, H. & Hermy, M. 2002.
Ecological perspectives for the restoration of plant communities in European temperate
forests. Biodiversity & Conservation 11: 213-242.
Jost, L. 2006. Entropy and diversity. Oikos 113: 363-375.
Kauano, E.E., Cardoso, F.C.G., Torezan, J.M.D. & Marques, M.C.M. 2013. Micro- and meso-
scale factors affect the restoration of atlantic forest. Nature & Conservation 11: 145–151.
Lamb, D., Erskine, P.D. & Parrotta, J.A. 2005. Restoration of degraded tropical forest
landscapes. Science 310: 1628-1632.
Lasky, J. R., Uriarte, M., Boukili, V. K., Erickson, D. L., John Kress, W., & Chazdon, R. L.
2014. The relationship between tree biodiversity and biomass dynamics changes with
tropical forest succession. Ecology Letters 17: 1158-1167.
Lebrija-Trejos, E., Pérez-García, E. A., Meave, J. A., Bongers, F. & Poorter, L. 2010.
30
88
590
591
592
593
594
595
596
597
598
599
600
601
602
603
604
605
606
607
608
609
610
611
8990

Functional traits and environmental filtering drive community assembly in a species-rich
tropical system. Ecology 91: 386–98.
Lira, P.K., Tambosi, L.R., Ewers, R.M. & Metzger, J.P. 2012. Land-use and land-cover
change in Atlantic Forest landscapes. Forest Ecology and Management 278: 80–89.
Lohbeck, M., Lebrija-Trejos, E., Martínez-Ramos, M., Meave, J.A., Poorter, L. & Bongers, F.
2015. Functional trait strategies of trees in dry and wet tropical forests are similar but differ
in their consequences for succession. PLoS One 10: e0123741.
Markewitz, D., Davidson, E., Moutinho, P. & Nepstad, D. 2004. Nutrient loss and
redistribution after forest clearing on a highly weathered soil in Amazonia. Ecological
Applications 14:177-199.
Maron, M., Hobbs, R.J., Moilanen, A., Matthews, J.W., Christie, K., Gardner, T.A., Keith,
D.A., Lindenmayer, D.B. & Mcalpine, C.A. 2012. Faustian bargains ? Restoration realities in
the context of biodiversity offset policies. Biological Conservation 155: 141–148.
Martinez-Garza, C., Tobon, W., Campo, J. & Howe, H.F. 2013. Drought mortality of tree
seedlings in an eroded tropical pasture. Land Degradation & Development 24: 287–295.
Matson, P.A., Parton, W.J., Power, A.G. & Swift, M.J. 1997. Agricultural intensification and
ecosystem properties. Science: 277: 504-509.
Olson, D.M., Dinerstein, E., Wikramanayake, E.D., Burgess, N.D., Powell, G.V.N.,
Underwood, E.C., D’amico, J. A., Itoua, I., Strand, H.E., (. . .) & Kassem, K.R. 2001.
Terrestrial ecoregions of the world: A new map of life on earth. Bioscience 51: 933.
Palmer, M.A., Ambrose, R.F. and Poff, N.L., 1997. Ecological theory and community
restoration ecology. Restoration Ecology, 5: 291-300.
31
91
612
613
614
615
616
617
618
619
620
621
622
623
624
625
626
627
628
629
630
631
632
633
9293

Pardini, R., de Arruda Bueno, A., Gardner, T.A., Prado, P.I. & Metzger, J.P., 2010. Beyond
the fragmentation threshold hypothesis: regime shifts in biodiversity across fragmented
landscapes. PloS One, 5, p.e13666, doi: 10.1371/journal.pone.0013666.
Perring, M.P., Standish, R.J., Price, J.N., Craig, M.D., Erickson, T.E., Ruthrof, K.X., Whiteley,
A.S., Valentine, L.E. & Hobbs, R.J. 2015a. Advances in restoration ecology: Rising to the
challenges of the coming decades. Ecosphere 6: 1-25, doi: 10.1890/ES15-00121.1.
Perring, M.P., Jonson, J., Freudenberger, D., Campbell, R., Rooney, M., Hobbs, R.J. &
Standish, R.J. 2015b. Soil-vegetation type, stem density and species richness influence
biomass of restored woodland in south-western Australia. Forest Ecology Management
344: 53–62.
Poorter, L. & Markesteijn, L. 2008. Seedling traits determine drought tolerance of tropical
tree species. Biotropica 40: 321-331.
Poorter, L., Bongers, F., Aide, T.M., Zambrano, A.M.A., Balvanera, P., Becknell, J.M.,
Boukili, V., Brancalion, P.H.S., Broadbent, E.N., (. . .) & Rozendaal, D.M.A. 2016. Biomass
resilience of neotropical secondary forests. Nature 530: 211-214.
Randrianarison, A., Schlaepfer, R., Mills, R., Hervé, D., Razanaka, S., Rakotoarimanana, V.,
Carrière, S.M. & Buttler, A. 2016. Linking historical land-use to present vegetation and soil
characteristics under slash‐and‐burn cultivation in Madagascar. Applied Vegetation
Science 19: 40-52.
Reid, J.L., Holl, K.D. & Zahawi, R.A. 2015. Seed dispersal limitations shift over time in
tropical forest restoration. Ecological Applications 25: 1072-1082.
Ribeiro, S.C., Botelho, S.A., Fontes, M.A.L., Garcia, P.O. & Almeida, H.D.S. 2013. Natural
regeneration of deforested areas dominated by Pteridium aquilinum (L.) Kuhn located in the
32
94
634
635
636
637
638
639
640
641
642
643
644
645
646
647
648
649
650
651
652
653
654
655
656
9596

Serra da Mantiqueira mountain range. Cerne 19: 65-76.
Ricklefs, R.E. 1987. Community diversity: relative roles of local and regional processes.
Science 235: 167-171.
Rodrigues, R.R., Lima, R.A.F., Gandolfi, S. & Nave, A.G. 2009. On the restoration of high
diversity forests: 30 years of experience in the Brazilian Atlantic forest. Biological
Conservation 142: 1242–1251.
Rüger, N., Wirth, C., Wright, S.J. & Condit, R. 2012. Functional traits explain light and size
response of growth rates in tropical tree species. Ecology 93: 2626–2636.
Schamp, B.S. & Aarssen, L. W. 2009. The assembly of forest communities according to
maximum species height along resource and disturbance gradients. Oikos 118: 564-572.
Scudeller, V.V., Martins, F.R. & Shepherd, G.J. 2001. Distribution and abundance of
arboreal species in the atlantic ombrophilous dense forest in Southeastern Brazil. Plant
Ecology 152:185-199.
Souza, J.T., Ferraz, E.M.N., Albuquerque, U.P. & Araújo, E.L. 2014. Does proximity to a
mature forest contribute to the seed rain and recovery of an abandoned agriculture area in
a semiarid climate? Plant Biology 16: 748–756.
Suding, K., Higgs, E., Palmer, M., Callicott, J.B., Anderson, C.B., Baker, M., Gutrich, J.J.,
Hondula, K.L., LaFevor, M.C., (. . .) & Schwartz, K.Z.S. 2015. Committing to ecological
restoration. Science 348: 638–640.
Suding, K.N. 2011. Toward an era of restoration in ecology: Successes, failures, and
opportunities ahead. Annual Review of Ecology, Evolution, and Systematics 42: 465–487.
Webb, T.J., Woodward, F.I., Hannah, L. & Gaston, K.J. 2005. Forest cover–rainfall
33
97
657
658
659
660
661
662
663
664
665
666
667
668
669
670
671
672
673
674
675
676
677
678
9899
relationships in a biodiversity hotspot: The Atlantic forest of Brazil. Ecological Applications
15: 1968-1983.
Wolf, A., Doughty, C.E. & Malhi, Y. 2013. Lateral diffusion of nutrients by mammalian
herbivores in terrestrial ecosystems. PLoS One 8: 1–10, e71352,
doi:10.1371/journal.pone.0071352.
Wright, S.J., Kitajima, K., Kraft, N.J.B., Reich, P.B., Wright, I.J., Bunker, D.E., Condit, R.,
Dalling, J.W., Davies, S.J., (. . .) & Zanne, A.E. 2010. Functional traits and the growth–
mortality trade-off in tropical trees. Ecology 91: 3664–3674.
Wuethrich, B. 2007. Reconstructing Brazil’s Atlantic rainforest. Science 315.5815: 1070–
1072.
Zahawi, R. A., Holl, K.D., Cole & R.J. & Reid, J.L. 2013. Testing applied nucleation as a
strategy to facilitate tropical forest recovery. Journal of Applied Ecology 50: 88–96.
Supporting information
Appendix S1. Species list and species grouping classification
Appendix S2. Statistics of soil chemical variables within soil groups
Appendix S3. Geographic information for surveyed restoration sites
34
100
679
680
681
682
683
684
685
686
687
688
689
690
691
692
693
694
101102