i always feel like somebody’s watching me · rupert sheldrake is a biologist and author of more...
TRANSCRIPT
_____________________________________________________________________________________________
STatistics Education Web: Online Journal of K-12 Statistics Lesson Plans 1
http://www.amstat.org/education/stew/
Contact Author for permission to use materials from this STEW lesson in a publication
I Always Feel Like Somebody’s
Watching Me
Mary Richardson
Grand Valley State University
Paul Stephenson
Grand Valley State University
Published: September 2014
Overview of Lesson
In this activity students will have the opportunity to collect and explore data. Students will
perform an experiment in order to test The Psychic Staring Effect. The Psychic Staring Effect is
the idea that people can sense that they are being stared at. The activity can be used to illustrate
large-sample confidence intervals and hypothesis tests on proportions; two-way table analysis
and the chi-square test; the binomial distribution and the binomial test. We have written the
activity in three independent parts so that the instructor can choose to complete all three parts of
the activity or only one or more of the three parts.
GAISE Components
This activity follows all four components of statistical problem solving put forth in the
Guidelines for Assessment and Instruction in Statistics Education (GAISE) Report. The four
components are: formulate a question, design and implement a plan to collect data, analyze the
data by measures and graphs, and interpret the results in the context of the original question. All
three parts of this activity are at the GAISE Level C.
Common Core State Standards for Mathematical Practice
1. Make sense of problems and persevere in solving them.
2. Reason abstractly and quantitatively.
4. Model with mathematics.
5. Use appropriate tools strategically.
6. Attend to precision.
Common Core State Standard Grade Level Content (High School)
S-ID. 5. Summarize categorical data for two categories in two-way frequency tables. Interpret
relative frequencies in the context of the data (including joint, marginal, and conditional relative
frequencies). Recognize possible associations and trends in the data.
S-IC. 1. Understand statistics as a process for making inferences about population parameters
based on a random sample from that population.
_____________________________________________________________________________________________
STatistics Education Web: Online Journal of K-12 Statistics Lesson Plans 2
http://www.amstat.org/education/stew/
Contact Author for permission to use materials from this STEW lesson in a publication
NCTM Principles and Standards for School Mathematics
Data Analysis and Probability Standards for Grades 9-12
Formulate questions that can be addressed with data and collect, organize, and
display relevant data to answer them:
understand the meaning of measurement data and categorical data, of univariate and
bivariate data, and of the term variable;
compute basic statistics and understand the distinction between a statistic and a
parameter.
Select and use appropriate statistical methods to analyze data:
display and discuss bivariate data where at least one variable is categorical.
Develop and evaluate inferences and predictions that are based on data:
understand how sample statistics reflect the values of population parameters and use
sampling distributions as the basis for informal inference.
Understand and apply basic concepts of probability:
understand the concepts of sample space and probability distribution and construct
sample spaces and distributions in simple cases;
compute and interpret the expected value of random variables in simple cases.
Prerequisites
Before beginning parts A. and B. of this activity, students should have been introduced to general
confidence interval and hypothesis testing concepts (i.e. confidence level, interpretation of a
confidence interval, null and alternative hypotheses, p-value, and how to make a statistical
conclusion). The activities can be used to reinforce specific formulas that have previously been
discussed, or to introduce and apply new formulas.
Before beginning part C. of this activity, students should have some exposure to the binomial
distribution and also to the general concepts of hypothesis testing.
Learning Targets
After completing part A. of this activity, students will be able to construct and interpret a large-
sample confidence interval for a proportion. Students will be able to perform a hypothesis test
on a proportion and make a conclusion in a problem’s context.
After completing part B. of this activity, students will be able to tally outcomes for two
categorical variables into a two-way contingency table. Students will be able to calculate
expected counts for the cells within a contingency table and use the counts to calculate a test
statistic for performing a chi-square test. Students will be able to perform the test and to use the
results to make a conclusion in a problem’s context.
After completing part C. of this activity, students will be able to identify the characteristics of a
Binomial experiment. Students will be able to reason about the expected value of a Binomial
random variable. Students will have a better understanding of how to calculate a p-value.
_____________________________________________________________________________________________
STatistics Education Web: Online Journal of K-12 Statistics Lesson Plans 3
http://www.amstat.org/education/stew/
Contact Author for permission to use materials from this STEW lesson in a publication
Time Required
The time required for each part of the activity is roughly one class period (assuming that the data
collection is to be performed along with the completion of the respective activity part). If the
data has previously been collected then each part of the activity would take roughly 30 minutes.
Materials Required
Students will need a pencil and their graphing calculator. The teacher will provide students with
the Activity Worksheet (at the end of this lesson) and some mechanism or instructions for
incorporating randomness (the calculator could be used for this task).
Instructional Lesson Plan
The GAISE Statistical Problem-Solving Procedure
I. Formulate Question(s)
The overall question of interest will be the same for all three activity parts.
Begin the activity by introducing The Psychic Staring Effect. The Background material provided
here and on the Activity Sheet was adapted from: http://en.wikipedia.org/wiki/Staring.
The Psychic Staring Effect is the idea that people can sense that they are being stared at and it
has been studied heavily, by many different researchers, with different results. In 2003, Rupert
Sheldrake wrote the controversial book “The Sense of Being Stared At,” which contained a great
deal of anecdotal evidence for the phenomenon: “Many people have had the experience of
feeling that they are being looked at, and on turning around find that they really are. Conversely,
many people have stared at other people's backs, for example in a lecture theater, and watched
them become restless and then turn round.”
After students reported the phenomenon to him in the late 19th century, psychologist Edward B.
Titchener suggested that the effect was an illusion, and that when a person turned to check
whether they were being watched, the initial movement of their head might attract the focus of
somebody behind them who was previously only looking in their general direction. By the time
the person had turned their head fully, the second person would be looking directly at them,
giving the mistaken impression that they had been staring at them all along.
Discuss some Background information about Rupert Sheldrake. The information provided here
and on the Activity Sheet was adapted from: http://www.sheldrake.org/about-rupert-sheldrake.
Rupert Sheldrake is a biologist and author of more than 80 scientific papers and ten books. He
was among the top 100 Global Thought Leaders for 2013, as ranked by the Duttweiler Institute,
Zurich, Switzerland’s leading think tank. He studied natural sciences at Cambridge University.

_____________________________________________________________________________________________
STatistics Education Web: Online Journal of K-12 Statistics Lesson Plans 4
http://www.amstat.org/education/stew/
Contact Author for permission to use materials from this STEW lesson in a publication
He then studied philosophy and history of science at Harvard University, before returning to
Cambridge, where he took a Ph.D. in biochemistry (1967).
Dr. Sheldrake has performed research in the area of developmental and cell biology. He has also
investigated unexplained aspects of animal behavior, including how pigeons find their way
home, the telepathic abilities of dogs, cats and other animals, and the apparent abilities of
animals to anticipate earthquakes and tsunamis. He subsequently studied similar phenomena in
people, including the sense of being stared at, telepathy between mothers and babies, telepathy in
connection with telephone calls, and premonitions. Although some of these areas overlap the
field of parapsychology, he approaches them as a biologist, and bases his research on natural
history and experiments under natural conditions, as opposed to laboratory studies.
Note: Sheldrake’s web page provides additional background materials and also contains
additional information that is not presented here.
After introducing The Psychic Staring Effect and Sheldrake, explain to students that the goal is
to perform one of Sheldrake’s experiments to see if a statistical analysis of class data supports
Sheldrake’s claims.
II. Design and Implement a Plan to Collect the Data
Once the data has been collected it can be used for all three of the activity parts.
The teacher should divide students into pairs and explain the data collection procedure. One
person will be the Looker and the other the Subject. The Subject should sit with his or her back
to the Looker and keep his or her eyes closed. Lookers either ‘look’ or do ‘not look’ at the
Subjects in a series of 10 trials according to a random sequence. This random sequence can be
generated by a random number generator on a calculator or by tossing a fair coin.
The Looker should stand about 3 feet behind the Subject’s back, and either ‘look’ or ‘not look’ at
the Subject in accordance with the random sequence of trials. The teacher might wish to instruct
the Lookers to look down at the data collection sheet if they are not looking at the Subject on a
particular trial. To signal the beginning of each trial, the teacher should give a signal to the
entire class, so that all trials are performed simultaneously. The teacher should say “Trial one:
begin.” (Since all Lookers are following different random sequences of instructions, the
teacher’s voice will give no relevant clues to the Subjects.) The Subject then says “looking” or
“not looking”, and the Looker records the looking status and the Subject’s response on the Data
Collection Sheet. The Subject should not spend long thinking, but guess quite quickly, 10
seconds are long enough. The Looker should records the Subject’s guess and then proceed to
the next trial. For the next trial the teacher should say, “Trial two: begin.” And so on. The same
procedure is repeated for all 10 trials.
_____________________________________________________________________________________________
STatistics Education Web: Online Journal of K-12 Statistics Lesson Plans 5
http://www.amstat.org/education/stew/
Contact Author for permission to use materials from this STEW lesson in a publication
After the series of 10 trials has been completed, the Lookers hand in their Data Collection
Sheets. The Lookers and Subjects then trade places. Each new Looker starts with a new data
sheet.
Assuming a class size of 30 students is split into 15 pairs with each student within a pair playing
the role of the Looker, 300 total trials would be produced for the class. After all of the trials
have been completed collect the results for the pairs via the Data Collection Sheets and tally the
class results on the white board.
Note: 300 total trials will be performed; however, we expect the Looker to be Looking at the
Subject in only half of these trials. It is this half that will be used for part of the data analysis
that follows.
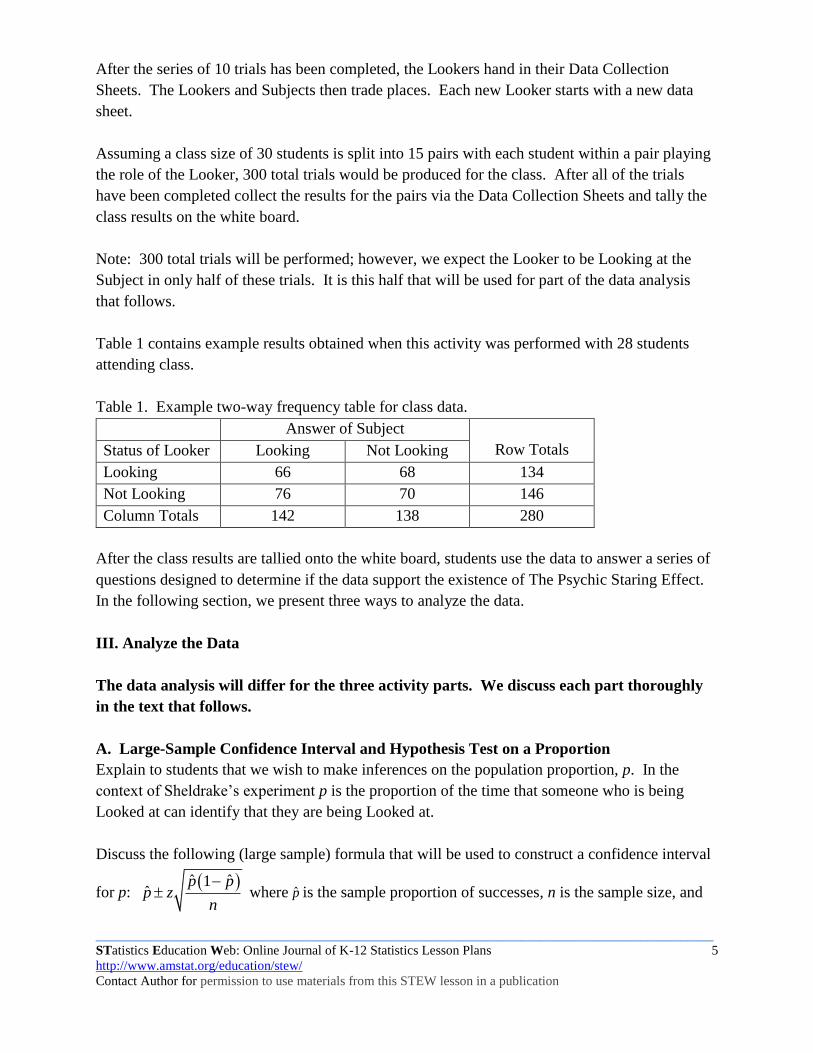
Table 1 contains example results obtained when this activity was performed with 28 students
attending class.
Table 1. Example two-way frequency table for class data.
Answer of Subject
Row Totals Status of Looker Looking Not Looking
Looking 66 68 134
Not Looking 76 70 146
Column Totals 142 138 280
After the class results are tallied onto the white board, students use the data to answer a series of
questions designed to determine if the data support the existence of The Psychic Staring Effect.
In the following section, we present three ways to analyze the data.
III. Analyze the Data
The data analysis will differ for the three activity parts. We discuss each part thoroughly
in the text that follows.
A. Large-Sample Confidence Interval and Hypothesis Test on a Proportion
Explain to students that we wish to make inferences on the population proportion, p. In the
context of Sheldrake’s experiment p is the proportion of the time that someone who is being
Looked at can identify that they are being Looked at.
Discuss the following (large sample) formula that will be used to construct a confidence interval
for p: ˆ ˆ1
ˆp p
p zn
where p̂ is the sample proportion of successes, n is the sample size, and
_____________________________________________________________________________________________
STatistics Education Web: Online Journal of K-12 Statistics Lesson Plans 6
http://www.amstat.org/education/stew/
Contact Author for permission to use materials from this STEW lesson in a publication
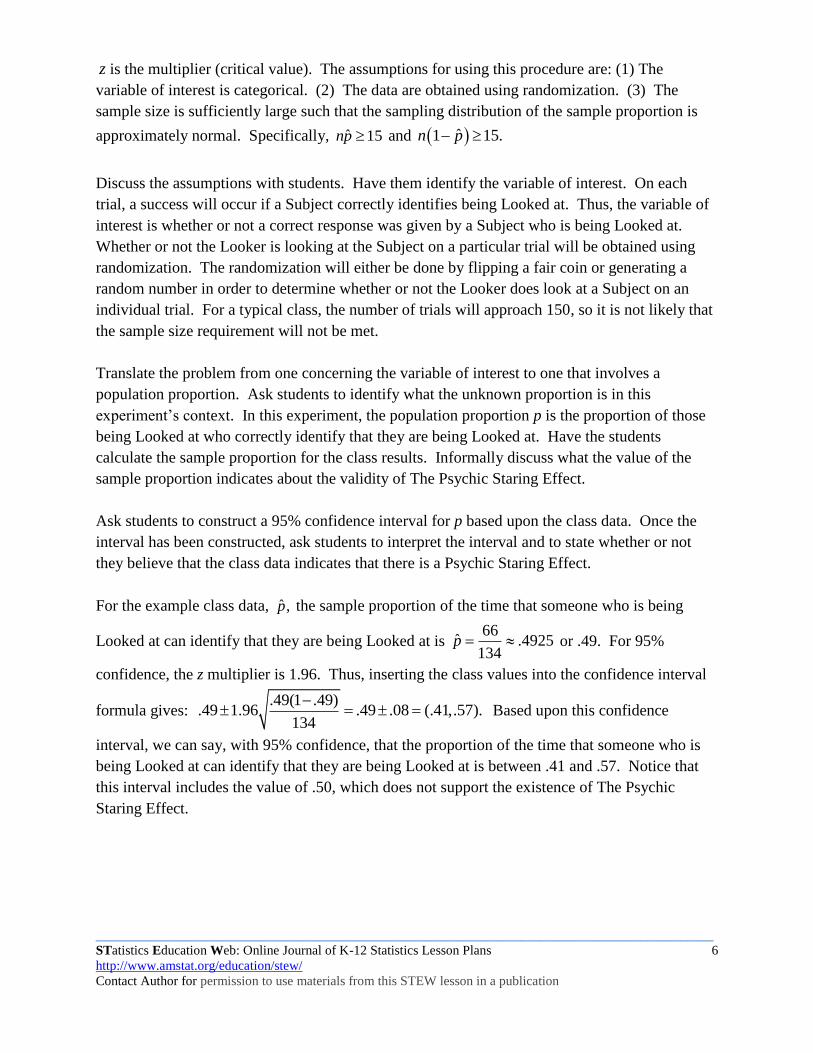
z is the multiplier (critical value). The assumptions for using this procedure are: (1) The
variable of interest is categorical. (2) The data are obtained using randomization. (3) The
sample size is sufficiently large such that the sampling distribution of the sample proportion is
approximately normal. Specifically, ˆ 15np and ˆ1 15.n p
Discuss the assumptions with students. Have them identify the variable of interest. On each
trial, a success will occur if a Subject correctly identifies being Looked at. Thus, the variable of
interest is whether or not a correct response was given by a Subject who is being Looked at.
Whether or not the Looker is looking at the Subject on a particular trial will be obtained using
randomization. The randomization will either be done by flipping a fair coin or generating a
random number in order to determine whether or not the Looker does look at a Subject on an
individual trial. For a typical class, the number of trials will approach 150, so it is not likely that
the sample size requirement will not be met.
Translate the problem from one concerning the variable of interest to one that involves a
population proportion. Ask students to identify what the unknown proportion is in this
experiment’s context. In this experiment, the population proportion p is the proportion of those
being Looked at who correctly identify that they are being Looked at. Have the students
calculate the sample proportion for the class results. Informally discuss what the value of the
sample proportion indicates about the validity of The Psychic Staring Effect.
Ask students to construct a 95% confidence interval for p based upon the class data. Once the
interval has been constructed, ask students to interpret the interval and to state whether or not
they believe that the class data indicates that there is a Psychic Staring Effect.
For the example class data, ˆ ,p the sample proportion of the time that someone who is being
Looked at can identify that they are being Looked at is 66
ˆ .4925134
p or .49. For 95%
confidence, the z multiplier is 1.96. Thus, inserting the class values into the confidence interval
formula gives: .49(1 .49)
.49 1.96 .49 .08 (.41,.57).134
Based upon this confidence
interval, we can say, with 95% confidence, that the proportion of the time that someone who is
being Looked at can identify that they are being Looked at is between .41 and .57. Notice that
this interval includes the value of .50, which does not support the existence of The Psychic
Staring Effect.
_____________________________________________________________________________________________
STatistics Education Web: Online Journal of K-12 Statistics Lesson Plans 7
http://www.amstat.org/education/stew/
Contact Author for permission to use materials from this STEW lesson in a publication
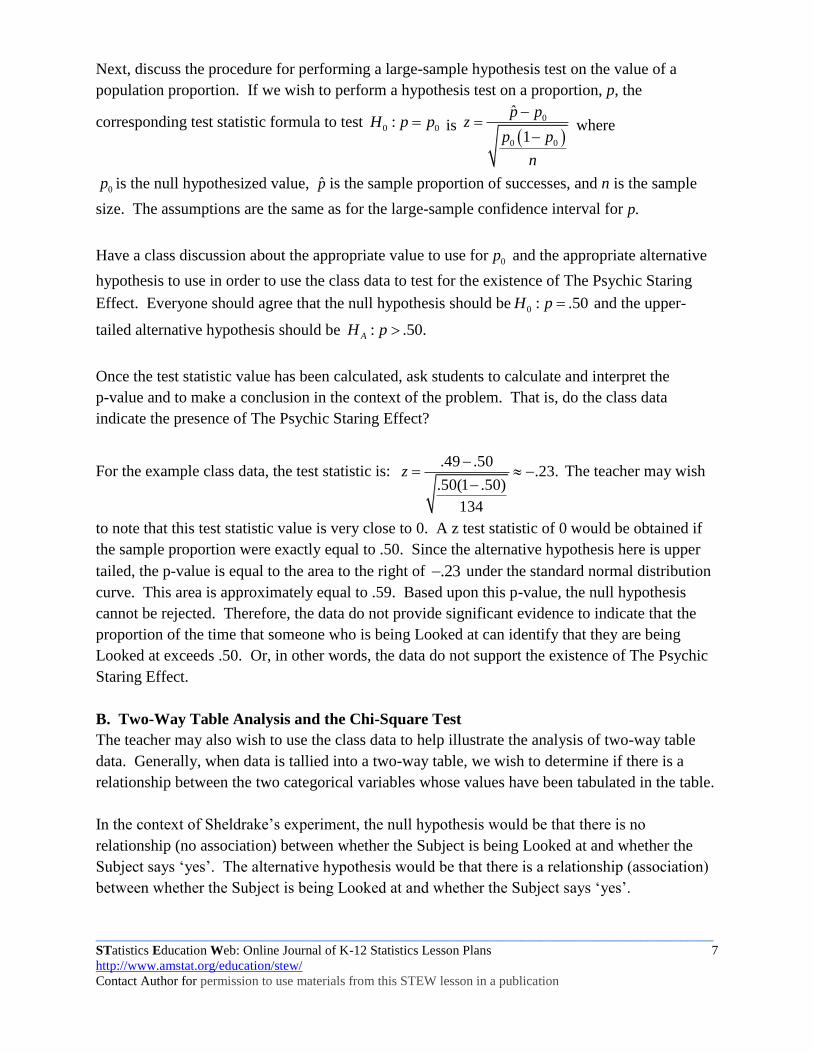
Next, discuss the procedure for performing a large-sample hypothesis test on the value of a
population proportion. If we wish to perform a hypothesis test on a proportion, p, the
corresponding test statistic formula to test 0 0:H p p is
0
0 0
ˆ
1
p pz
p p
n
where
0p is the null hypothesized value, p̂ is the sample proportion of successes, and n is the sample
size. The assumptions are the same as for the large-sample confidence interval for .p
Have a class discussion about the appropriate value to use for 0p and the appropriate alternative
hypothesis to use in order to use the class data to test for the existence of The Psychic Staring
Effect. Everyone should agree that the null hypothesis should be 0 : .50H p and the upper-
tailed alternative hypothesis should be : .50.AH p
Once the test statistic value has been calculated, ask students to calculate and interpret the
p-value and to make a conclusion in the context of the problem. That is, do the class data
indicate the presence of The Psychic Staring Effect?
For the example class data, the test statistic is: .49 .50
.23..50(1 .50)
134
z
The teacher may wish
to note that this test statistic value is very close to 0. A z test statistic of 0 would be obtained if
the sample proportion were exactly equal to .50. Since the alternative hypothesis here is upper
tailed, the p-value is equal to the area to the right of .23 under the standard normal distribution
curve. This area is approximately equal to .59. Based upon this p-value, the null hypothesis
cannot be rejected. Therefore, the data do not provide significant evidence to indicate that the
proportion of the time that someone who is being Looked at can identify that they are being
Looked at exceeds .50. Or, in other words, the data do not support the existence of The Psychic
Staring Effect.
B. Two-Way Table Analysis and the Chi-Square Test
The teacher may also wish to use the class data to help illustrate the analysis of two-way table
data. Generally, when data is tallied into a two-way table, we wish to determine if there is a
relationship between the two categorical variables whose values have been tabulated in the table.
In the context of Sheldrake’s experiment, the null hypothesis would be that there is no
relationship (no association) between whether the Subject is being Looked at and whether the
Subject says ‘yes’. The alternative hypothesis would be that there is a relationship (association)
between whether the Subject is being Looked at and whether the Subject says ‘yes’.
_____________________________________________________________________________________________
STatistics Education Web: Online Journal of K-12 Statistics Lesson Plans 8
http://www.amstat.org/education/stew/
Contact Author for permission to use materials from this STEW lesson in a publication
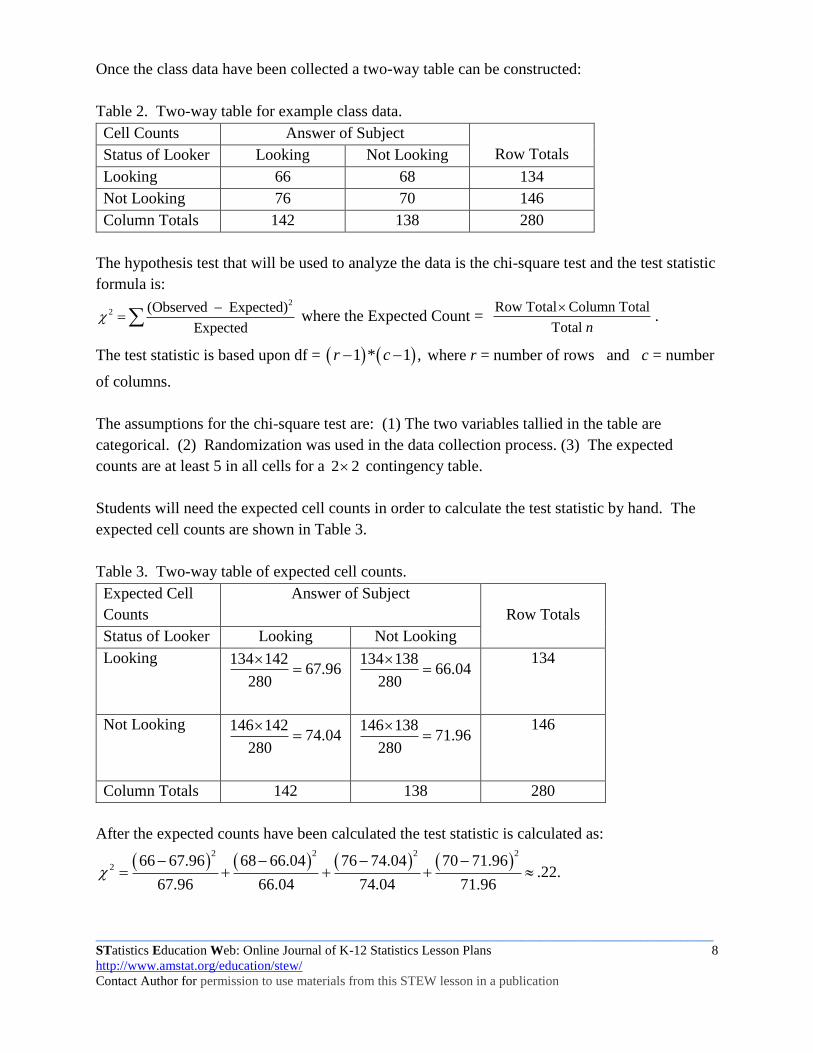
Once the class data have been collected a two-way table can be constructed:
Table 2. Two-way table for example class data.
Cell Counts Answer of Subject
Row Totals Status of Looker Looking Not Looking
Looking 66 68 134
Not Looking 76 70 146
Column Totals 142 138 280
The hypothesis test that will be used to analyze the data is the chi-square test and the test statistic
formula is: 2
2 (Observed Expected)
Expected
where the Expected Count =
Row Total Column Total
Total n
.
The test statistic is based upon df = 1 * 1 ,r c where r = number of rows and c = number
of columns.
The assumptions for the chi-square test are: (1) The two variables tallied in the table are
categorical. (2) Randomization was used in the data collection process. (3) The expected
counts are at least 5 in all cells for a 2 2 contingency table.
Students will need the expected cell counts in order to calculate the test statistic by hand. The
expected cell counts are shown in Table 3.
Table 3. Two-way table of expected cell counts.
Expected Cell
Counts
Answer of Subject
Row Totals
Status of Looker Looking Not Looking
Looking 134 14267.96
280
134 13866.04
280
134
Not Looking 146 14274.04
280
146 13871.96
280
146
Column Totals 142 138 280
After the expected counts have been calculated the test statistic is calculated as:
2 2 2 2
266 67.96 68 66.04 7
67.96 66.04 74
6 74.04 70 71.96.2
.04 71.9.
62
_____________________________________________________________________________________________
STatistics Education Web: Online Journal of K-12 Statistics Lesson Plans 9
http://www.amstat.org/education/stew/
Contact Author for permission to use materials from this STEW lesson in a publication
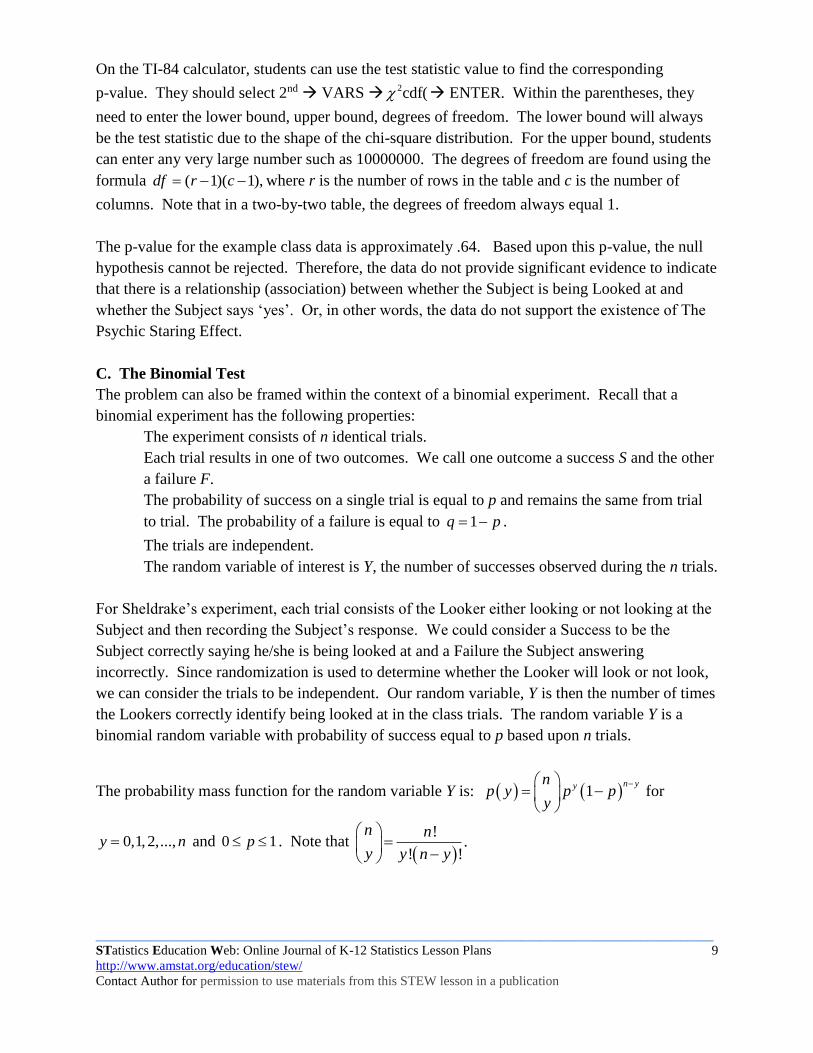
On the TI-84 calculator, students can use the test statistic value to find the corresponding
p-value. They should select 2nd VARS 2cdf( ENTER. Within the parentheses, they
need to enter the lower bound, upper bound, degrees of freedom. The lower bound will always
be the test statistic due to the shape of the chi-square distribution. For the upper bound, students
can enter any very large number such as 10000000. The degrees of freedom are found using the
formula ( 1)( 1),df r c where r is the number of rows in the table and c is the number of
columns. Note that in a two-by-two table, the degrees of freedom always equal 1.
The p-value for the example class data is approximately .64. Based upon this p-value, the null
hypothesis cannot be rejected. Therefore, the data do not provide significant evidence to indicate
that there is a relationship (association) between whether the Subject is being Looked at and
whether the Subject says ‘yes’. Or, in other words, the data do not support the existence of The
Psychic Staring Effect.
C. The Binomial Test
The problem can also be framed within the context of a binomial experiment. Recall that a
binomial experiment has the following properties:
The experiment consists of n identical trials.
Each trial results in one of two outcomes. We call one outcome a success S and the other
a failure F.
The probability of success on a single trial is equal to p and remains the same from trial
to trial. The probability of a failure is equal to 1q p .
The trials are independent.
The random variable of interest is Y, the number of successes observed during the n trials.
For Sheldrake’s experiment, each trial consists of the Looker either looking or not looking at the
Subject and then recording the Subject’s response. We could consider a Success to be the
Subject correctly saying he/she is being looked at and a Failure the Subject answering
incorrectly. Since randomization is used to determine whether the Looker will look or not look,
we can consider the trials to be independent. Our random variable, Y is then the number of times
the Lookers correctly identify being looked at in the class trials. The random variable Y is a
binomial random variable with probability of success equal to p based upon n trials.
The probability mass function for the random variable Y is: 1n yy
np y p p
y
for
0,1,2,...,y n and 0 1p . Note that
!.
! !
n n
y y n y
_____________________________________________________________________________________________
STatistics Education Web: Online Journal of K-12 Statistics Lesson Plans 10
http://www.amstat.org/education/stew/
Contact Author for permission to use materials from this STEW lesson in a publication
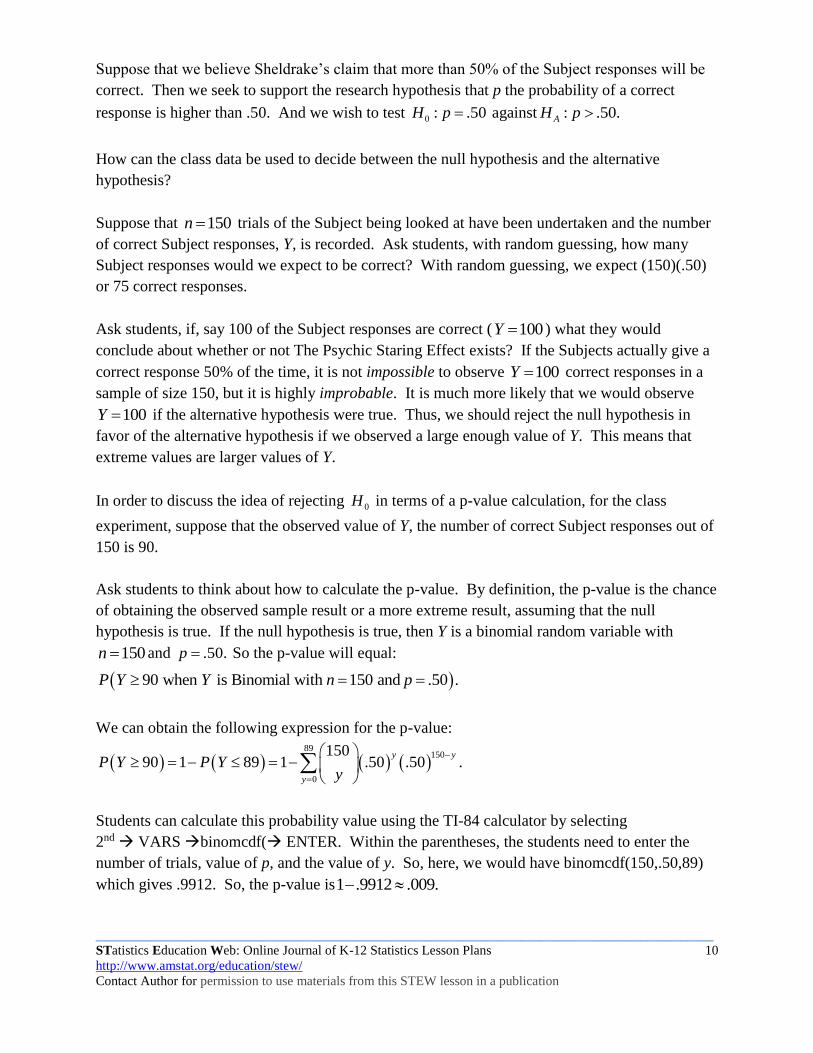
Suppose that we believe Sheldrake’s claim that more than 50% of the Subject responses will be
correct. Then we seek to support the research hypothesis that p the probability of a correct
response is higher than .50. And we wish to test 0 : .50H p against : .50.AH p
How can the class data be used to decide between the null hypothesis and the alternative
hypothesis?
Suppose that 150n trials of the Subject being looked at have been undertaken and the number
of correct Subject responses, Y, is recorded. Ask students, with random guessing, how many
Subject responses would we expect to be correct? With random guessing, we expect (150)(.50)
or 75 correct responses.
Ask students, if, say 100 of the Subject responses are correct ( 100Y ) what they would
conclude about whether or not The Psychic Staring Effect exists? If the Subjects actually give a
correct response 50% of the time, it is not impossible to observe 100Y correct responses in a
sample of size 150, but it is highly improbable. It is much more likely that we would observe
100Y if the alternative hypothesis were true. Thus, we should reject the null hypothesis in
favor of the alternative hypothesis if we observed a large enough value of Y. This means that
extreme values are larger values of Y.
In order to discuss the idea of rejecting 0H in terms of a p-value calculation, for the class
experiment, suppose that the observed value of Y, the number of correct Subject responses out of
150 is 90.
Ask students to think about how to calculate the p-value. By definition, the p-value is the chance
of obtaining the observed sample result or a more extreme result, assuming that the null
hypothesis is true. If the null hypothesis is true, then Y is a binomial random variable with
150n and .50.p So the p-value will equal:
90 when is Binomial with 150 and .50 .P Y Y n p
We can obtain the following expression for the p-value:
89
150
0
15090 1 89 1 .50 .50 .
y y
y
P Y P Yy
Students can calculate this probability value using the TI-84 calculator by selecting
2nd VARS binomcdf( ENTER. Within the parentheses, the students need to enter the
number of trials, value of p, and the value of y. So, here, we would have binomcdf(150,.50,89)
which gives .9912. So, the p-value is1 .9912 .009.
_____________________________________________________________________________________________
STatistics Education Web: Online Journal of K-12 Statistics Lesson Plans 11
http://www.amstat.org/education/stew/
Contact Author for permission to use materials from this STEW lesson in a publication
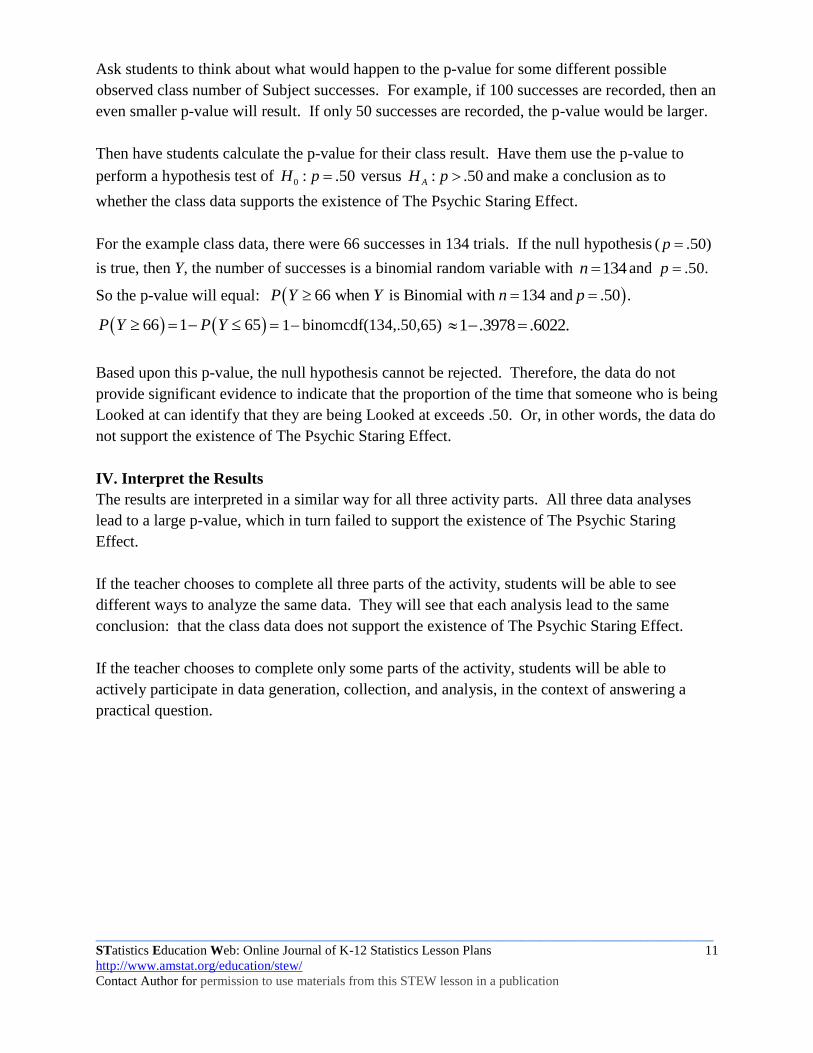
Ask students to think about what would happen to the p-value for some different possible
observed class number of Subject successes. For example, if 100 successes are recorded, then an
even smaller p-value will result. If only 50 successes are recorded, the p-value would be larger.
Then have students calculate the p-value for their class result. Have them use the p-value to
perform a hypothesis test of 0 : .50H p versus : .50AH p and make a conclusion as to
whether the class data supports the existence of The Psychic Staring Effect.
For the example class data, there were 66 successes in 134 trials. If the null hypothesis ( .50)p
is true, then Y, the number of successes is a binomial random variable with 134n and .50.p
So the p-value will equal: 66 when is Binomial with 134 and .50 .P Y Y n p
66 1 65P Y P Y 1 binomcdf(134,.50,65) 1 .3978 .6022.
Based upon this p-value, the null hypothesis cannot be rejected. Therefore, the data do not
provide significant evidence to indicate that the proportion of the time that someone who is being
Looked at can identify that they are being Looked at exceeds .50. Or, in other words, the data do
not support the existence of The Psychic Staring Effect.
IV. Interpret the Results
The results are interpreted in a similar way for all three activity parts. All three data analyses
lead to a large p-value, which in turn failed to support the existence of The Psychic Staring
Effect.
If the teacher chooses to complete all three parts of the activity, students will be able to see
different ways to analyze the same data. They will see that each analysis lead to the same
conclusion: that the class data does not support the existence of The Psychic Staring Effect.
If the teacher chooses to complete only some parts of the activity, students will be able to
actively participate in data generation, collection, and analysis, in the context of answering a
practical question.
_____________________________________________________________________________________________
STatistics Education Web: Online Journal of K-12 Statistics Lesson Plans 12
http://www.amstat.org/education/stew/
Contact Author for permission to use materials from this STEW lesson in a publication
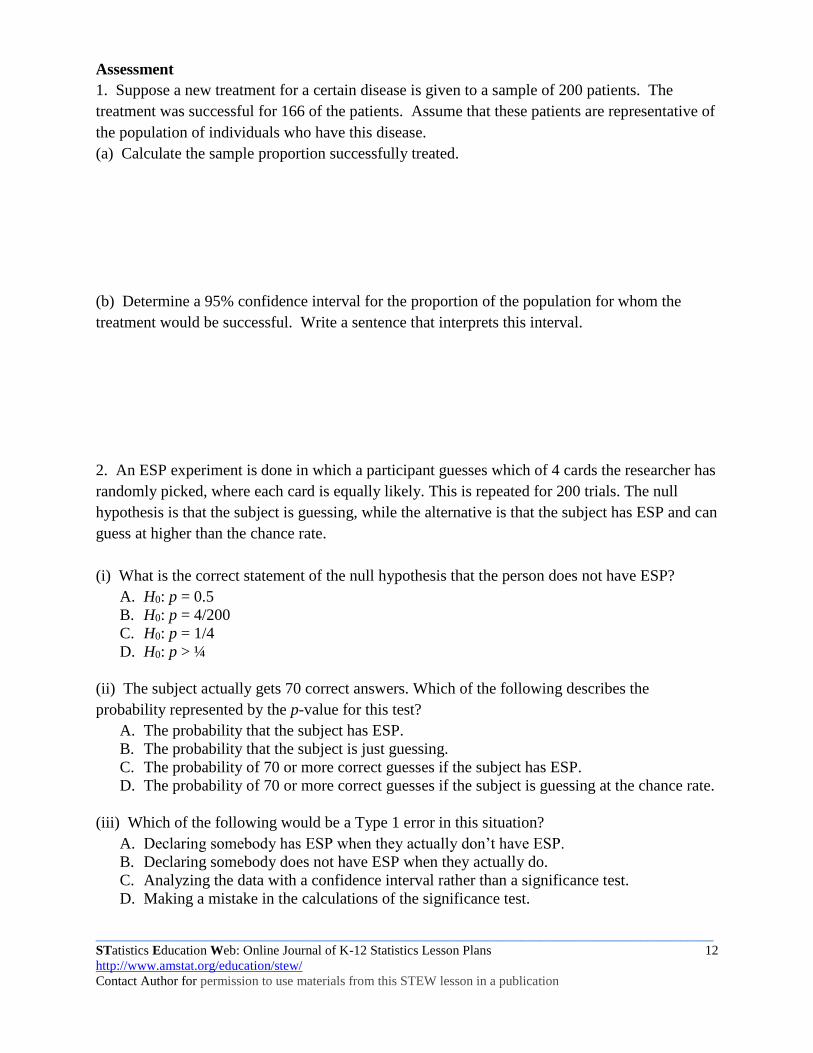
Assessment
1. Suppose a new treatment for a certain disease is given to a sample of 200 patients. The
treatment was successful for 166 of the patients. Assume that these patients are representative of
the population of individuals who have this disease.
(a) Calculate the sample proportion successfully treated.
(b) Determine a 95% confidence interval for the proportion of the population for whom the
treatment would be successful. Write a sentence that interprets this interval.
2. An ESP experiment is done in which a participant guesses which of 4 cards the researcher has
randomly picked, where each card is equally likely. This is repeated for 200 trials. The null
hypothesis is that the subject is guessing, while the alternative is that the subject has ESP and can
guess at higher than the chance rate.
(i) What is the correct statement of the null hypothesis that the person does not have ESP?
A. H0: p = 0.5
B. H0: p = 4/200
C. H0: p = 1/4
D. H0: p > ¼
(ii) The subject actually gets 70 correct answers. Which of the following describes the
probability represented by the p-value for this test?
A. The probability that the subject has ESP.
B. The probability that the subject is just guessing.
C. The probability of 70 or more correct guesses if the subject has ESP.
D. The probability of 70 or more correct guesses if the subject is guessing at the chance rate.
(iii) Which of the following would be a Type 1 error in this situation?
A. Declaring somebody has ESP when they actually don’t have ESP.
B. Declaring somebody does not have ESP when they actually do.
C. Analyzing the data with a confidence interval rather than a significance test.
D. Making a mistake in the calculations of the significance test.
_____________________________________________________________________________________________
STatistics Education Web: Online Journal of K-12 Statistics Lesson Plans 13
http://www.amstat.org/education/stew/
Contact Author for permission to use materials from this STEW lesson in a publication
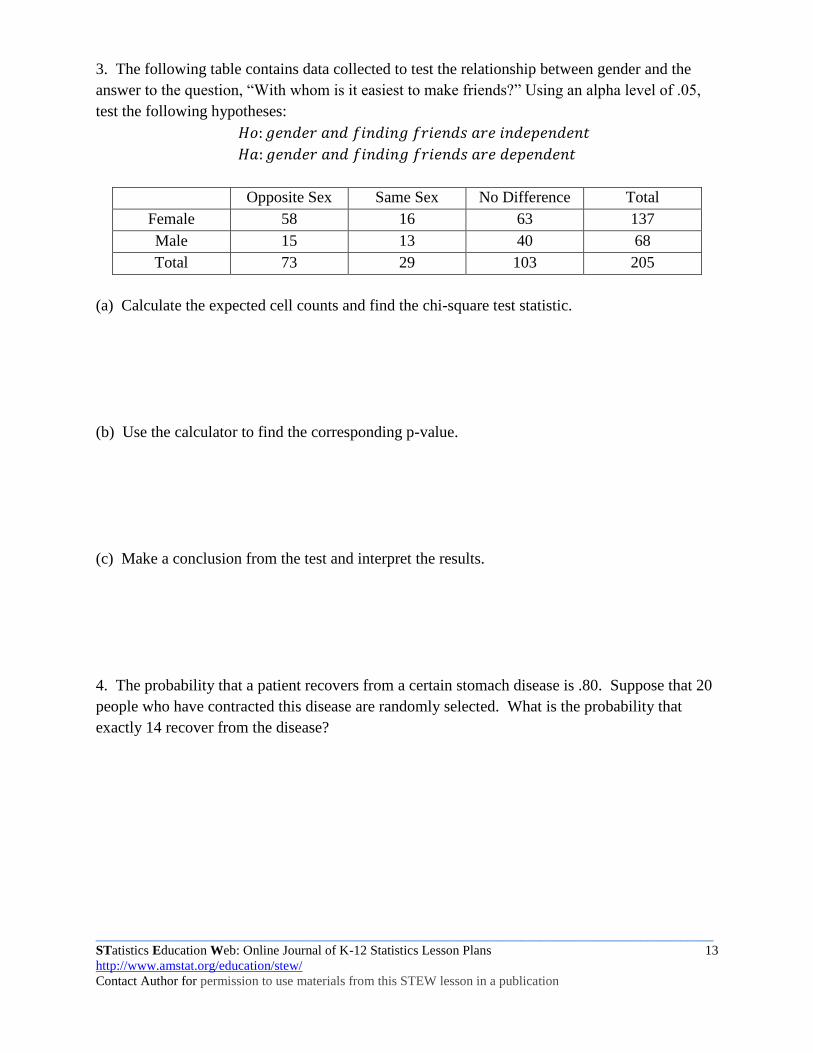
3. The following table contains data collected to test the relationship between gender and the
answer to the question, “With whom is it easiest to make friends?” Using an alpha level of .05,
test the following hypotheses:
𝐻𝑜: 𝑔𝑒𝑛𝑑𝑒𝑟 𝑎𝑛𝑑 𝑓𝑖𝑛𝑑𝑖𝑛𝑔 𝑓𝑟𝑖𝑒𝑛𝑑𝑠 𝑎𝑟𝑒 𝑖𝑛𝑑𝑒𝑝𝑒𝑛𝑑𝑒𝑛𝑡
𝐻𝑎: 𝑔𝑒𝑛𝑑𝑒𝑟 𝑎𝑛𝑑 𝑓𝑖𝑛𝑑𝑖𝑛𝑔 𝑓𝑟𝑖𝑒𝑛𝑑𝑠 𝑎𝑟𝑒 𝑑𝑒𝑝𝑒𝑛𝑑𝑒𝑛𝑡
Opposite Sex Same Sex No Difference Total
Female 58 16 63 137
Male 15 13 40 68
Total 73 29 103 205
(a) Calculate the expected cell counts and find the chi-square test statistic.
(b) Use the calculator to find the corresponding p-value.
(c) Make a conclusion from the test and interpret the results.
4. The probability that a patient recovers from a certain stomach disease is .80. Suppose that 20
people who have contracted this disease are randomly selected. What is the probability that
exactly 14 recover from the disease?
_____________________________________________________________________________________________
STatistics Education Web: Online Journal of K-12 Statistics Lesson Plans 14
http://www.amstat.org/education/stew/
Contact Author for permission to use materials from this STEW lesson in a publication
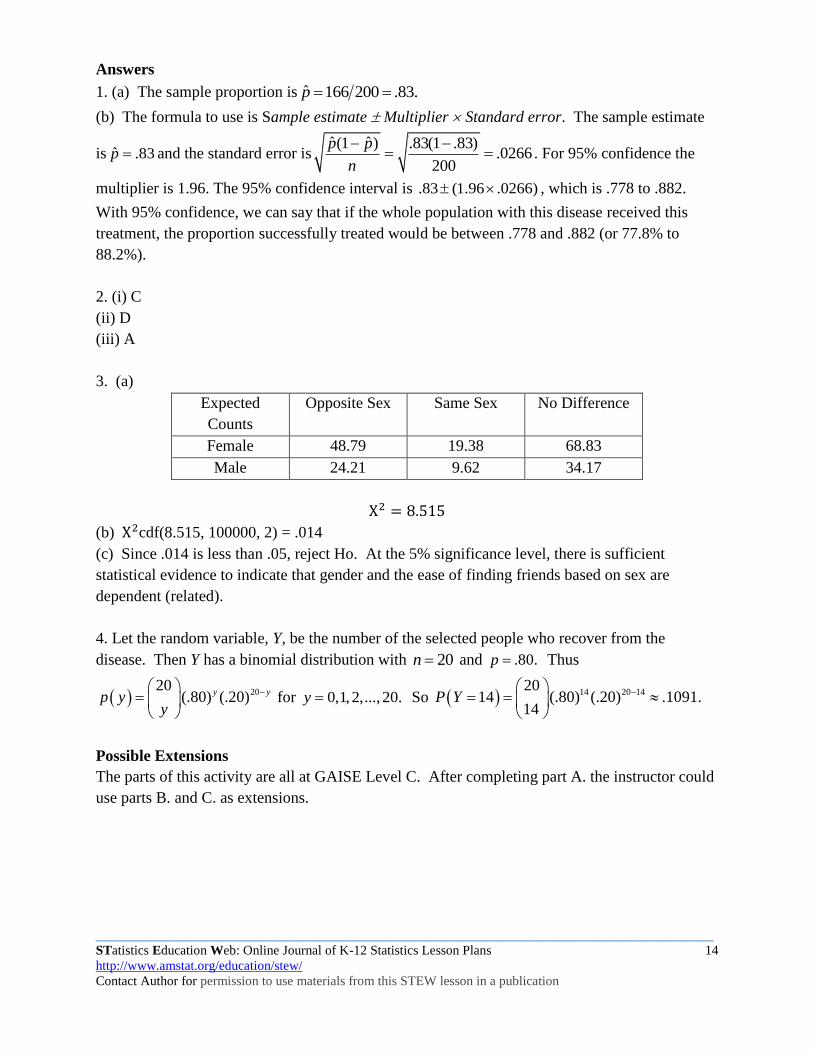
Answers
1. (a) The sample proportion is ˆ 166 200 .83.p
(b) The formula to use is Sample estimate Multiplier Standard error. The sample estimate
is ˆ .83p and the standard error isˆ ˆ(1 ) .83(1 .83)
.0266200
p p
n
. For 95% confidence the
multiplier is 1.96. The 95% confidence interval is .83 (1.96 .0266) , which is .778 to .882.
With 95% confidence, we can say that if the whole population with this disease received this
treatment, the proportion successfully treated would be between .778 and .882 (or 77.8% to
88.2%).
2. (i) C
(ii) D
(iii) A
3. (a)
Expected
Counts
Opposite Sex Same Sex No Difference
Female 48.79 19.38 68.83
Male 24.21 9.62 34.17
Χ2 = 8.515
(b) Χ2cdf(8.515, 100000, 2) = .014
(c) Since .014 is less than .05, reject Ho. At the 5% significance level, there is sufficient
statistical evidence to indicate that gender and the ease of finding friends based on sex are
dependent (related).
4. Let the random variable, Y, be the number of the selected people who recover from the
disease. Then Y has a binomial distribution with 20n and .80.p Thus
2020
(.80) (.20)y yp yy
for 0,1,2,..., 20.y So 14 20 1420
14 (.80) (.20) .1091.14
P Y
Possible Extensions
The parts of this activity are all at GAISE Level C. After completing part A. the instructor could
use parts B. and C. as extensions.
_____________________________________________________________________________________________
STatistics Education Web: Online Journal of K-12 Statistics Lesson Plans 15
http://www.amstat.org/education/stew/
Contact Author for permission to use materials from this STEW lesson in a publication
References
1. Guidelines for Assessment and Instruction in Statistics Education (GAISE) Report, ASA,
Franklin et al., ASA, 2007. http://www.amstat.org/education/gaise/.
2. Assessment questions 1, 2, and 3 from: Mind on Statistics. Fourth Edition by Utts/Heckard,
2012. Cengage Learning.
3. Assessment question 4 and some ideas for discussion of the binomial distribution taken from
Mathematical Statistics with Applications 7th Edition by Wackerly, Mendenhall, and Scheaffer.
Thomson*Brooks/Cole 2008.
_____________________________________________________________________________________________
STatistics Education Web: Online Journal of K-12 Statistics Lesson Plans 16
http://www.amstat.org/education/stew/
Contact Author for permission to use materials from this STEW lesson in a publication
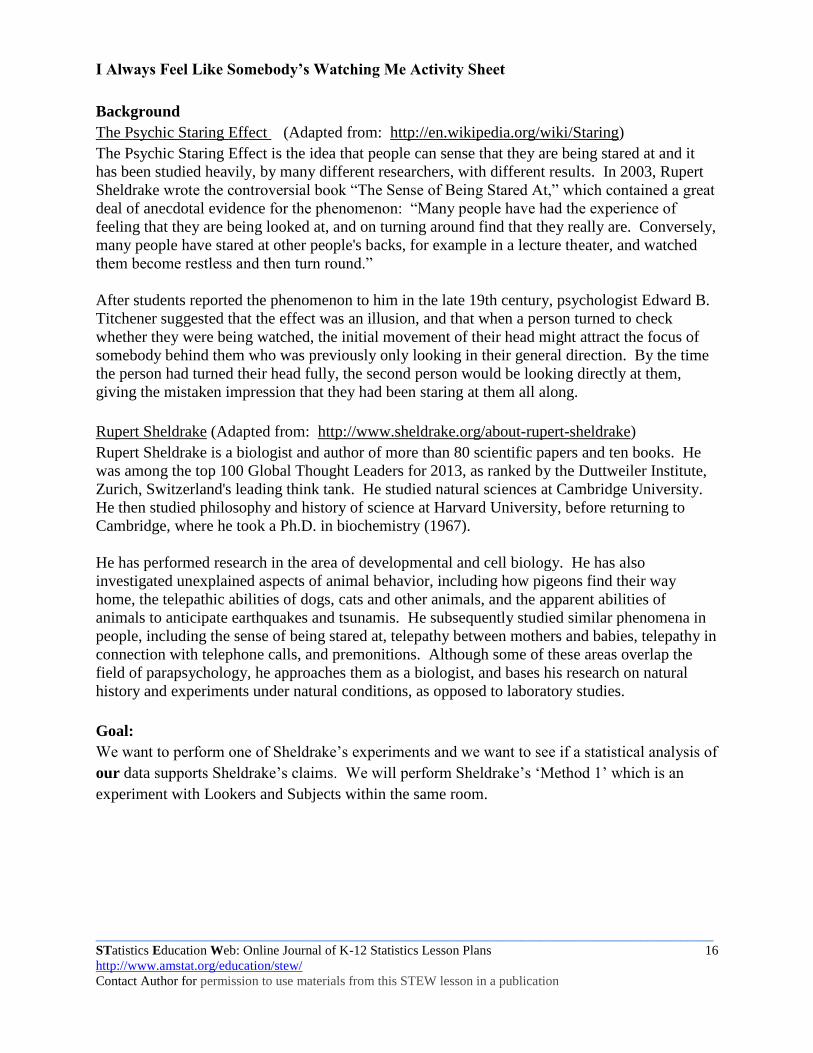
I Always Feel Like Somebody’s Watching Me Activity Sheet
Background
The Psychic Staring Effect (Adapted from: http://en.wikipedia.org/wiki/Staring)
The Psychic Staring Effect is the idea that people can sense that they are being stared at and it
has been studied heavily, by many different researchers, with different results. In 2003, Rupert
Sheldrake wrote the controversial book “The Sense of Being Stared At,” which contained a great
deal of anecdotal evidence for the phenomenon: “Many people have had the experience of
feeling that they are being looked at, and on turning around find that they really are. Conversely,
many people have stared at other people's backs, for example in a lecture theater, and watched
them become restless and then turn round.”
After students reported the phenomenon to him in the late 19th century, psychologist Edward B.
Titchener suggested that the effect was an illusion, and that when a person turned to check
whether they were being watched, the initial movement of their head might attract the focus of
somebody behind them who was previously only looking in their general direction. By the time
the person had turned their head fully, the second person would be looking directly at them,
giving the mistaken impression that they had been staring at them all along.
Rupert Sheldrake (Adapted from: http://www.sheldrake.org/about-rupert-sheldrake)
Rupert Sheldrake is a biologist and author of more than 80 scientific papers and ten books. He
was among the top 100 Global Thought Leaders for 2013, as ranked by the Duttweiler Institute,
Zurich, Switzerland's leading think tank. He studied natural sciences at Cambridge University.
He then studied philosophy and history of science at Harvard University, before returning to
Cambridge, where he took a Ph.D. in biochemistry (1967).
He has performed research in the area of developmental and cell biology. He has also
investigated unexplained aspects of animal behavior, including how pigeons find their way
home, the telepathic abilities of dogs, cats and other animals, and the apparent abilities of
animals to anticipate earthquakes and tsunamis. He subsequently studied similar phenomena in
people, including the sense of being stared at, telepathy between mothers and babies, telepathy in
connection with telephone calls, and premonitions. Although some of these areas overlap the
field of parapsychology, he approaches them as a biologist, and bases his research on natural
history and experiments under natural conditions, as opposed to laboratory studies.
Goal:
We want to perform one of Sheldrake’s experiments and we want to see if a statistical analysis of
our data supports Sheldrake’s claims. We will perform Sheldrake’s ‘Method 1’ which is an
experiment with Lookers and Subjects within the same room.
_____________________________________________________________________________________________
STatistics Education Web: Online Journal of K-12 Statistics Lesson Plans 17
http://www.amstat.org/education/stew/
Contact Author for permission to use materials from this STEW lesson in a publication
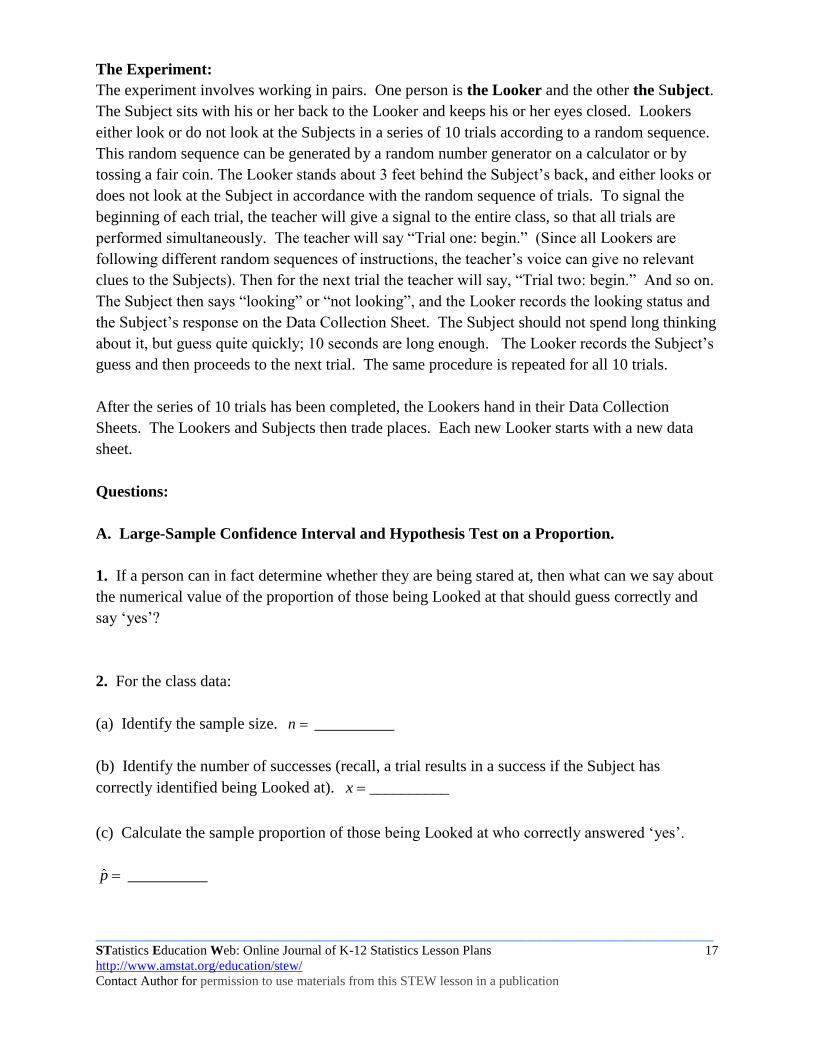
The Experiment:
The experiment involves working in pairs. One person is the Looker and the other the Subject.
The Subject sits with his or her back to the Looker and keeps his or her eyes closed. Lookers
either look or do not look at the Subjects in a series of 10 trials according to a random sequence.
This random sequence can be generated by a random number generator on a calculator or by
tossing a fair coin. The Looker stands about 3 feet behind the Subject’s back, and either looks or
does not look at the Subject in accordance with the random sequence of trials. To signal the
beginning of each trial, the teacher will give a signal to the entire class, so that all trials are
performed simultaneously. The teacher will say “Trial one: begin.” (Since all Lookers are
following different random sequences of instructions, the teacher’s voice can give no relevant
clues to the Subjects). Then for the next trial the teacher will say, “Trial two: begin.” And so on.
The Subject then says “looking” or “not looking”, and the Looker records the looking status and
the Subject’s response on the Data Collection Sheet. The Subject should not spend long thinking
about it, but guess quite quickly; 10 seconds are long enough. The Looker records the Subject’s
guess and then proceeds to the next trial. The same procedure is repeated for all 10 trials.
After the series of 10 trials has been completed, the Lookers hand in their Data Collection
Sheets. The Lookers and Subjects then trade places. Each new Looker starts with a new data
sheet.
Questions:
A. Large-Sample Confidence Interval and Hypothesis Test on a Proportion.
1. If a person can in fact determine whether they are being stared at, then what can we say about
the numerical value of the proportion of those being Looked at that should guess correctly and
say ‘yes’?
2. For the class data:
(a) Identify the sample size. n __________
(b) Identify the number of successes (recall, a trial results in a success if the Subject has
correctly identified being Looked at). __________x
(c) Calculate the sample proportion of those being Looked at who correctly answered ‘yes’.
p̂ __________
_____________________________________________________________________________________________
STatistics Education Web: Online Journal of K-12 Statistics Lesson Plans 18
http://www.amstat.org/education/stew/
Contact Author for permission to use materials from this STEW lesson in a publication
3. Construct a 95% confidence interval for the proportion of correct guesses for those being
Looked at (that is, the proportion of time that those who were being looked at said ‘yes’).
(a) give the formula:
(b) plug the appropriate class data into the formula:
(c) give the confidence interval:
(d) interpret the interval – state whether or not the interval supports The Psychic Staring Effect:
4. Does the class data provide significant evidence to indicate that the proportion of ‘yes’
guesses is higher than 50% for those being Looked at?
(a) state the appropriate hypotheses:
(b) summarize the data into an appropriate test statistic:
(c) find the p-value:
_____________________________________________________________________________________________
STatistics Education Web: Online Journal of K-12 Statistics Lesson Plans 19
http://www.amstat.org/education/stew/
Contact Author for permission to use materials from this STEW lesson in a publication
(d) report a conclusion in the context of this problem:
(e) in the context of this problem, explain what a type 1 error would be:
(f) in the context of this problem, explain what a type 2 error would be:
_____________________________________________________________________________________________
STatistics Education Web: Online Journal of K-12 Statistics Lesson Plans 20
http://www.amstat.org/education/stew/
Contact Author for permission to use materials from this STEW lesson in a publication
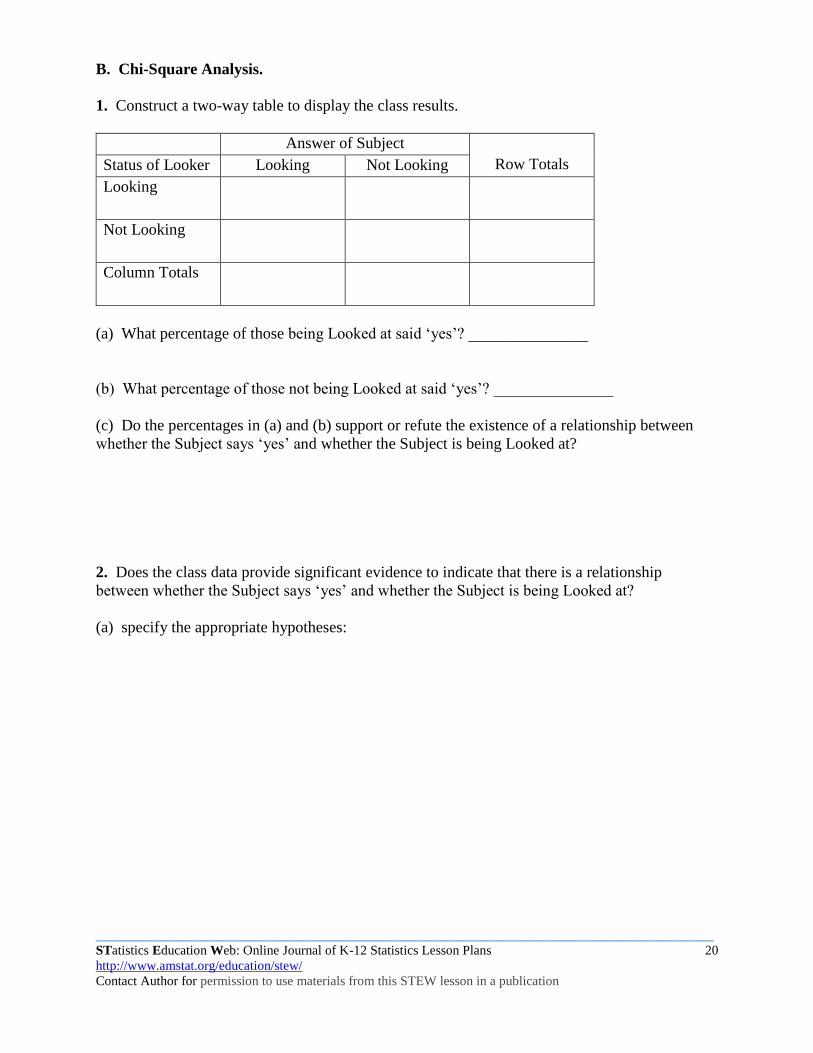
B. Chi-Square Analysis.
1. Construct a two-way table to display the class results.
Answer of Subject
Row Totals Status of Looker Looking Not Looking
Looking
Not Looking
Column Totals
(a) What percentage of those being Looked at said ‘yes’? _______________
(b) What percentage of those not being Looked at said ‘yes’? _______________
(c) Do the percentages in (a) and (b) support or refute the existence of a relationship between
whether the Subject says ‘yes’ and whether the Subject is being Looked at?
2. Does the class data provide significant evidence to indicate that there is a relationship
between whether the Subject says ‘yes’ and whether the Subject is being Looked at?
(a) specify the appropriate hypotheses:
_____________________________________________________________________________________________
STatistics Education Web: Online Journal of K-12 Statistics Lesson Plans 21
http://www.amstat.org/education/stew/
Contact Author for permission to use materials from this STEW lesson in a publication
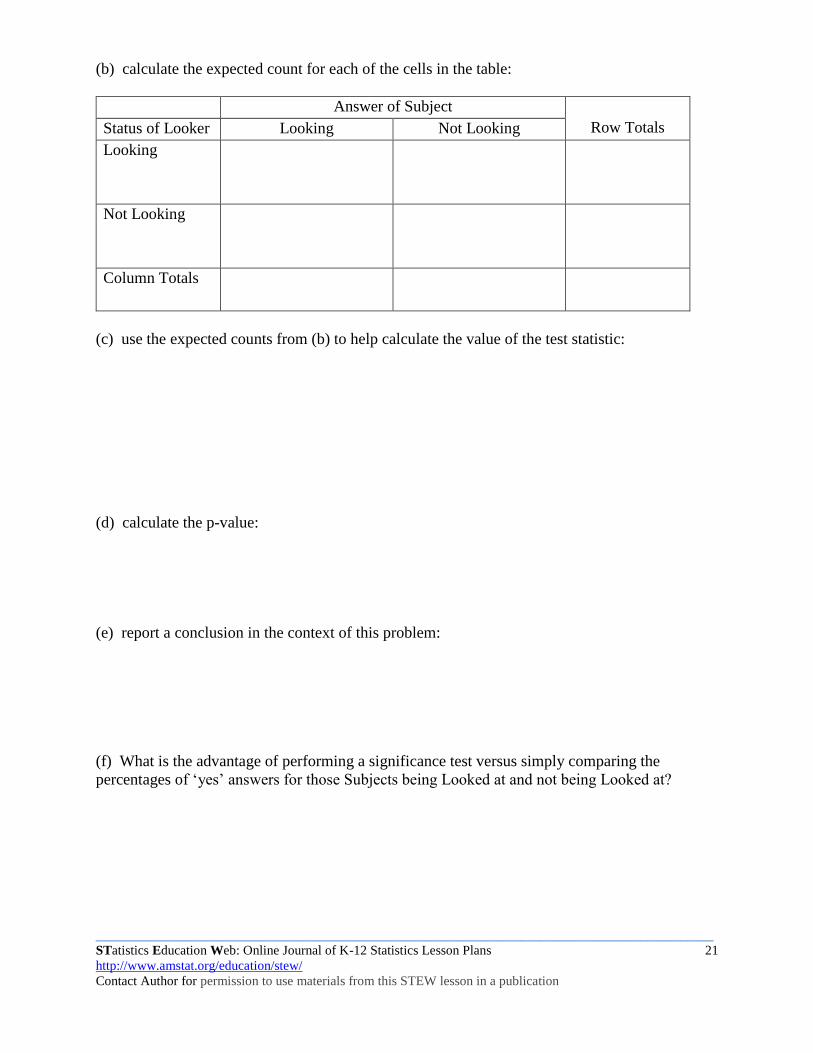
(b) calculate the expected count for each of the cells in the table:
Answer of Subject
Row Totals Status of Looker Looking Not Looking
Looking
Not Looking
Column Totals
(c) use the expected counts from (b) to help calculate the value of the test statistic:
(d) calculate the p-value:
(e) report a conclusion in the context of this problem:
(f) What is the advantage of performing a significance test versus simply comparing the
percentages of ‘yes’ answers for those Subjects being Looked at and not being Looked at?
_____________________________________________________________________________________________
STatistics Education Web: Online Journal of K-12 Statistics Lesson Plans 22
http://www.amstat.org/education/stew/
Contact Author for permission to use materials from this STEW lesson in a publication
C. Binomial Distribution and Binomial Test.
We want to develop a statistical model for our Sheldrake experiment. Once we have developed a
model, we can use it to help determine whether or not our class results support the existence of
The Psychic Staring Effect.
(a) Consider all of the cases in which the Subject was being Looked at. In considering these
cases, can we claim that our experiment consisted of n identical trials? Explain why or why not
and identify the value of n for the class.
(b) What were the two possible outcomes on each of these identical trials?
(c) Which of the outcomes would we consider to be a success?
(d) Would the probability of success, p, remain the same from trial to trial? Explain why/why
not.
(e) Explain why the trials can be viewed as independent.
_____________________________________________________________________________________________
STatistics Education Web: Online Journal of K-12 Statistics Lesson Plans 23
http://www.amstat.org/education/stew/
Contact Author for permission to use materials from this STEW lesson in a publication
(f) Let’s consider the random variable of interest Y, to be the number of successes observed
during the n class trials. What type of probability distribution does this random variable have?
Now, suppose that we believe Sheldrake’s claim that more than 50% of the Subject responses
will be correct thus validating the existence of The Psychic Staring Effect. Then we seek to
support the research hypothesis that p, the probability of a correct response on each trial is higher
than .50 and we wish to test 0 : .50H p against : .50.AH p
How can we use the class data to decide between the null hypothesis and the alternative
hypothesis?
(g) Suppose that 150n trials of the Subject being looked at have been undertaken and the
number of correct Subject responses, Y, is recorded. With random guessing on each trial, how
many Subject responses would we expect to be correct? _______________
(h) Suppose that all 150 of the Subject responses are correct ( 150Y ). What would we
conclude about whether or not The Psychic Staring Effect exists? Explain your answer.
(i) What types of values of Y would lead to the rejection of the null hypothesis? Large values or
small values? _______________
(j) For the class experiment, suppose that the observed value of Y, the number of correct Subject
responses out of 150 was 65.
Recall that, by definition, the p-value is the chance of obtaining the observed sample result or a
more extreme result, assuming that the null hypothesis is true. Also recall that extreme means
contradictory to the null hypothesis.
If our null hypothesis is true, then Y is a binomial random variable with n __________ and
p __________.
_____________________________________________________________________________________________
STatistics Education Web: Online Journal of K-12 Statistics Lesson Plans 24
http://www.amstat.org/education/stew/
Contact Author for permission to use materials from this STEW lesson in a publication
So the p-value will equal: ( 65 when is BinomialP Y Y with the values given for n and p
above). Circle the correct inequality.
We can obtain the following expression for the p-value: _______________
And we can calculate _______________ using the TI-84 calculator by selecting
2nd VARS binomcdf( ENTER.
Within the parentheses, you will need to enter the number of trials, value of p, and the value of y.
So, here, the p-value is: __________
(k) Now that we have calculated the p-value for 65 successes, what can we say about the
p-value for the following numbers of successes:
If there were 90 successes, the p-value would be LARGER/SMALLER than the p-value that was
calculated for 65 successes. Circle the correct choice and explain your choice.
If there were 50 successes, the p-value would be LARGER/SMALLER than the p-value that was
calculated for 65 successes. Circle the correct choice and explain your choice.
(l) Does the class data provide significant evidence to indicate that the proportion of ‘yes’
guesses is higher than 50% for those being Looked at?
(i) state the appropriate hypotheses:
(ii) the number of successes for the class was Y = ______________
(iii) calculate the p-value for the class value of Y:

_____________________________________________________________________________________________
STatistics Education Web: Online Journal of K-12 Statistics Lesson Plans 25
http://www.amstat.org/education/stew/
Contact Author for permission to use materials from this STEW lesson in a publication
(iv) use the p-value to help make a decision about whether or not the null hypothesis should be
rejected and report a conclusion in the context of this problem (be sure to state whether or not
our class data support the existence of The Psychic Staring Effect):
Data Collection Sheet
Name of Looker____________________
Name of Subject____________________
Trial
Looker
Looking (yes) /
Not Looking (no)
Subject
Says Being Looked At (yes)/
Says Not Being Looked At (no)
1
2
3
4
5
6
7
8
9
10
Summary:
Looking
Guess by Subject
Yes No
Yes
No