i~ if i~j4 for calou~ating the boundart-layer reynolds number in a region of increasing velocity....
TRANSCRIPT

tl
I~J [,
II
',{ .1
I
i r t, .
o apY' ,No. III/r I , '
2 /I~ A OR If 0.. 413 05
NATIONAL ADVISORY OOMlnT~¥i",FO:a AERONAUTIOS
I ' .
I '
A OONCISE THEORETIOAL ME~~on;FO~ PROFILE-DRAG OAtCULAT!O~ , I " 't ~ .. ~
By Gerald E. Nitzb'er~'
Ames Aeron~utical '~~bor~ory !'!l:offett Field,' C~lii~
" , "("'t.-"" ~ ... r'" ~ r .. -c ...
r
Februa.ry 1944
, , ' , ~:0,
"">-, .. ,~. IJ '!"r)
" ) :, I .. (::
1 ~ f' I' (
, '
\,~
","
I 1'1
" (
,I ,
t ,
•• I~!!U~!II~J " .. ',~, :,:;~~, I~ , .. I
https://ntrs.nasa.gov/search.jsp?R=20110020378 2020-04-20T03:32:17+00:00Z

BEST
AVAILABLE
COpy

•
...
3 1176013653358 :L
NATIONAL ADVISORY COMMITTEE FOR AERONAUTICS
D 1!SL SiJZ 0 8" J211fid.-_____ iill_
r
A conCISE THEORETICAL METHOD FOR PROFILE-DRAG CALCULATION
B~ Gerald E. Ni~zberg
• . SUMMAltY
In this report a method is presented fo~ the ~ -calculation of the profile drag of airfoil sections. The method requlres only a knowledge of the theoretical velocity distribution and can be applied readily'once thlS dlstributl0n is ascertained. Comparison of calculated and experimental drag characteristics for several airfoils shows a satisfactory agreement. Sample calculatlons are included •
INTRODUO!tl ION
H. B. Squire and A. D. Young developed a method, pres~nted in reference 1, for calculating the prQfl1e drag over an arbitrary airfoil. This method requires a kno\Tledge of the velocJ.ty distribution over the airfOll t and of the estimated position of transition from 1amlnar to turbulent flow. !rhe velocity ¢ist-ribution can be obtained by the method of reference 2. Using these data the g't'o,",th of the boundary la~er can be computed, the region of the laminar flow being ana~yzed by means of a step-by-step solution of Pohlhausenls equation, and the turbulent region by & similar method of solution of an equation developed in reference 1. From the thickness of the boundary layer and the l~cal velocity at the airfoil traillng edge, Squire and Young evaluate the profile drag by meaus of a semi-empirical formula. This procedure is very laborious because of the step-by-step computatlons involved, and its ap~lication is limited by lack of a method for estimating the position of transition.
E. N. Jacob$ and A. E. von Doenhoff (reference 3) give formulas for ~stimating the transition position for velocity d1~tributions having maximum velocity far
~

2
back, and T~ ,an karmen an! C. Ml1Iikan (reference 4) lndicate a means for obtaining this information for velocity distributi~ns with maximum velocity far forward. In theso references methods are presented for directly calculating the boundary-layer growth in the laminar region 4 These methods, taken in conjunction with the concise graphical method for analyzing the region of turbulent flow, which is developed in the present report, make it possible to oa1culate qUlckly the profile~ drag coefficient of an arbitrary airfoil. This procedu~o is outlined in a readily usable form. Several illustrative eXamples are worked in detail and the oalculated results are compared with experimental measurement s.
i1HEORl'
The profile drag of an airfoil in free air is account~d for by the momentum loss in the wake far downstream. It is possible to·calculate this momentum loss by tracing the boundary-layer growth along the airfoil surface and its development, as the wake, after leaving the airfoll trailing edge. i1he growth of the 'booundary layer is a fUnction of the chordwise velocity distribution over the airfo~l. In studYlng this growth the essential factors are:
1. Position of transition from laminar to turbu-lent flow '
2_ Boundary-layer thickness at trans~tion
3. ~rowth of the turbulent boundary layer ,
Once the thick~ess of the boundary layer at the traillng ed b 8 has been computed the pressure recovery in the \fah:e can 'be accounted for by the semi-empirical theory of Sq~ire and Young o ~hese various steps will nOw be considered in detail.
1. ~ransition Roini.- ~he profile drag of airfoils is markedly affected by tpe ~osition of transition from lamina.r to tUl'bulent flow. For smooth airfoils in low turbulence streams' at Reynolds numbers of the order of 5,000,000, ~rans~t1on generally occurs close to the

•
•
3
lam1nar s~paration point. Surface roughness, stream turbulence, or an extr,emely high Reynolds number can move transition forward of this point. For airfoils havin~ maximum velocity far forward~ however, there is no practical method available for predicting the extent of this movement of transition ahead of the sepapation p01nt. In such cases therefore, transition position will be assumed to coincide with separation. It is convenient to make this simplifioation because reference 4 cont~~ns a d1rect method for calculating the separation pOlnt of airfoils having maximum velocity far forward. !'h1S ::'lethod approximates the forward portion of the ChOl'duise velocity distri'but ion by two straight lines. !'he region ahead of maximum velocity is represented by
= a( ~ ) and the region directly behind maximum velocity by
J- = (a + b) xm - b! .z.. \ '0 c" c,
( 2)
where the subscript m designates the coordinate of the nftximum velocity point. It can be shown from refer~ ence,4 that the velocity at separation VB is a junc-tion of the slopes of the approximating straight lines and the maximum velocity Vm; namely,
(.3)
where ~~ is the function of b/a plotted in figure 1.
For low-drag a~rfoll8 which have maximum velocity far back, separation occurs so closely behind maximum vole city tha.t trans it ion may be aesumed to 1 ie at that position, except at very high Reynolds numbers where it is possible for transition to mo.ve' ahead of the maximum velocity pOint. As is pointed" out in reterence 3, existing experimental data taken in flight indicate that transiti'olf will occur I in a region of increasing velocity if the boundary-layer neynolde n~mber reaches a value of the ord'er of 8000 to 91500. It is poss i ble to apply this criterion by using the relation given in reference 3
4
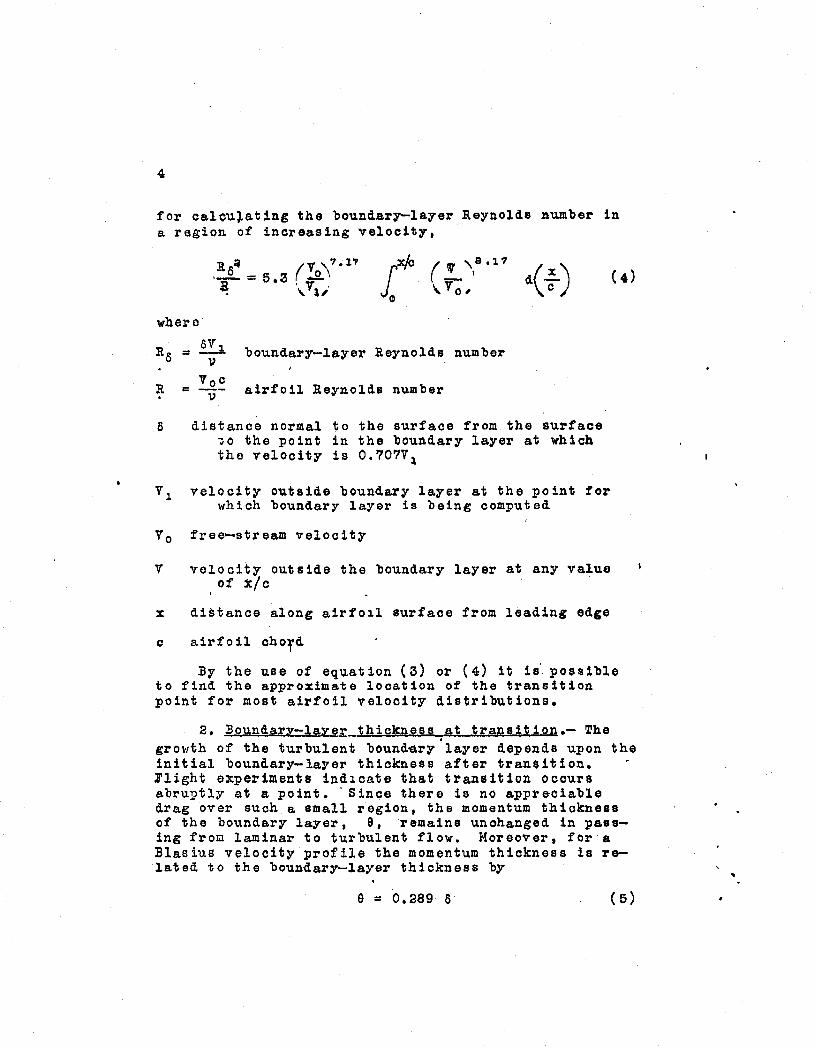
for calou~ating the boundarT-layer Reynolds number in a region of increasing velocity.
where
8V 1 R8 = -u- boundary-layer Reynolds number
R
v
c
airfoil Reynolds number
distance normal to the surface from the surface ~o the point in the boundary layer at which the velocity is O.707V~
velocity outside boundary layer at the point for which boundary layer is being computed
free-stream velocity
velocity outside the boundary layer at any value . of x/c
distance along airfoll surface from leading edge
airfo il cho,d
:8y the use of equation (3) or (4) it is' pouible to find the approximate location of the transition point for most airfoil velocity distributions.
2. BoundarY-laye~_thickness ,at transition.- ~he
growth of the turbulent bound~ry layer depends upon the initial boundary-layer thickness after transition. Flight experiments indlcate that transition occurs abruDtly at a point •. Since there is no appreciable drag over such a small region. the momentum thiokness of the boundary layer, 9 • remains unohanged in passing froLl laminar to turbulent flow. Uoreover, for a Blasius velocity profile the momentum thickness is related to the boundary-layer thickness by
9 = 0.289 8 ( 5)
..
5
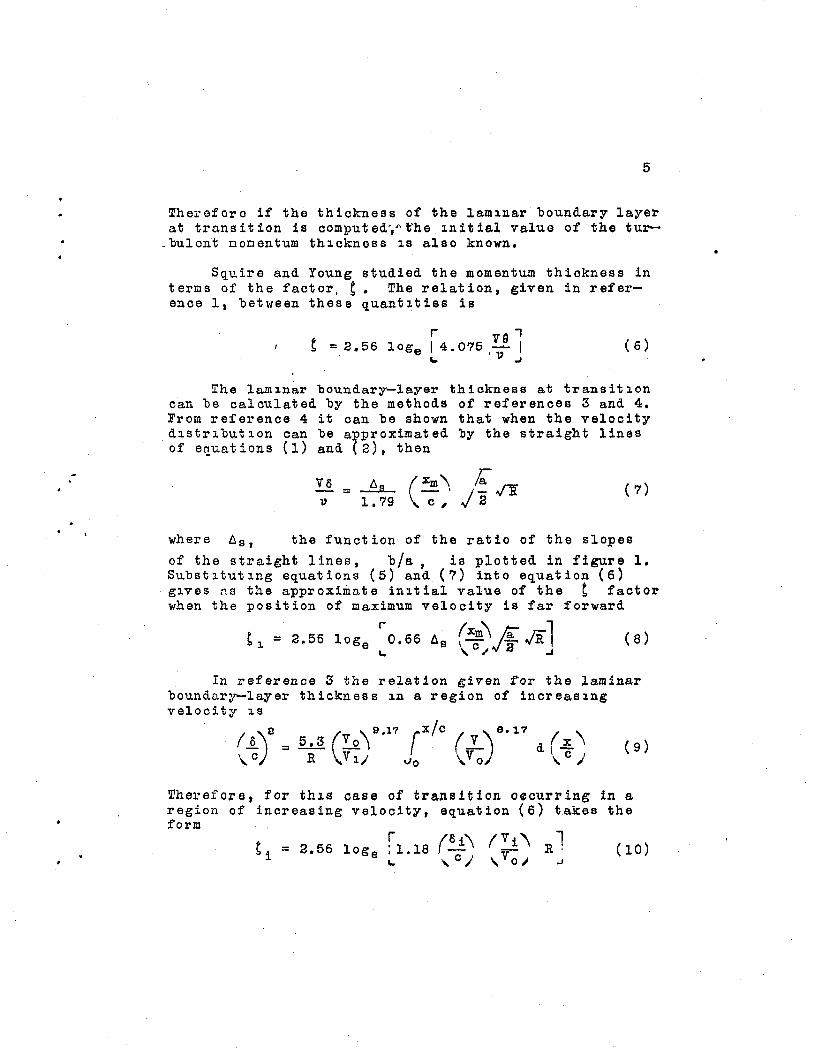
Therefore if the thickness of the lamlnar boundary layer at transition is computed',"t'he l.nitial value of the tur
_ bulcnt I:10oentum th1ckness 1S also known.
Sq~ire and Young studied the momentum thickness in terms of the factor, b. The relation, given in reference I, between these quantl.ties is
r va 1 t = 2.56 loge 14.075 ........ I ~ ''D oJ
(6)
The lamlnar boundary-layer thickness at transitlon can be calculated by the methods of references 3 and 4. From reference 4 it can be shown that when the velocity d1strlbutlon Can be approximated by the straight lines of equations (1) and (2), then
va = ~ 'D 1.79 (
xm\ Ta rw c, J"2 '" A
( 7)
where D. s , the funct ion of the ratio of the slopes
of the straight lines, b/a, is plotted in figure 1. Substl.tutlng equations (5) and (7) into equation (6) glveS ns the approximate inltial value of the t factor when the position of maximum velocity is far forward
~l = 2.56 loge r O• 66 D.s (xm\ ~ JRl (8) I.. '\. 0 .; Ja oJ
In reference 3 the relation given tor the laminar boundar~layer thickness In a region of increasl.ng velocity 1S
(l..)S = 5.3 (V o.'\9.17 rX/
C (l)8.1? d (.!.. \ (9) \ C R V 1/ vo V 0 \. 0 )
Therefore, for thlS case of transition o~curring in a region of increasing velocity, equation (6) takes the form
( 10)

6
Dquation (8) for the "double-roof" velocity distributions and equation (10). for trlow-drag lt velocity dist~ibutions are adequate for finding the initial value of the ~ factor for most airfoils.
3. ~bu1en~ bo~ar~layer growth.- The analysis
of the turbulent boundary layer is based on equation (11) (1). 8 of reference 1).
where
t =
=
the
10.41 R a
t
factor
intensity of skin friction
V' -6.13 V
Prime indicates derivative with respect to (x/c)
.. .
Squire and Young use a step-by-step 1ntegration to solve this equation. ~his process is very laborious and can be simplified to ~ direct graphical evaluation without loss of accuracy, The simplification is as follows:
Divide the velocity distribution 1n the turbulent region at those pos it ions where it s· slope changes rap idly. ApprOXlLHl.te each of these segments by a curve of the form
.! = c Ie
+ L
where K and L are constants deter~ined by making curve 12 pass through the end pOints of the velocitrdistribution segment under consideration. For a region of decreaslng velocity, substituting equation (12) in equatiQn (11) leads to
= KFR+ 6.13
d( V \ \-v;;,
I V \
,Vo '

7
or KFR.+ 6.13 ( 13)
where
It is also possible to separate the varlables of equat lon (11) by replaclng the actual velocity d.istribution ln each segment by lts average velocity and avera~e bradient. This alternative method leads to an lntegral of form similar to the left-hand side of equatlon (13) and gives the same value for the ~ factor. There lS, therefore, no need for further considerlng this alternative proced.ure.
~he left slde of equation (13) cannot be integrated byeleneAtary means. By numerical integration
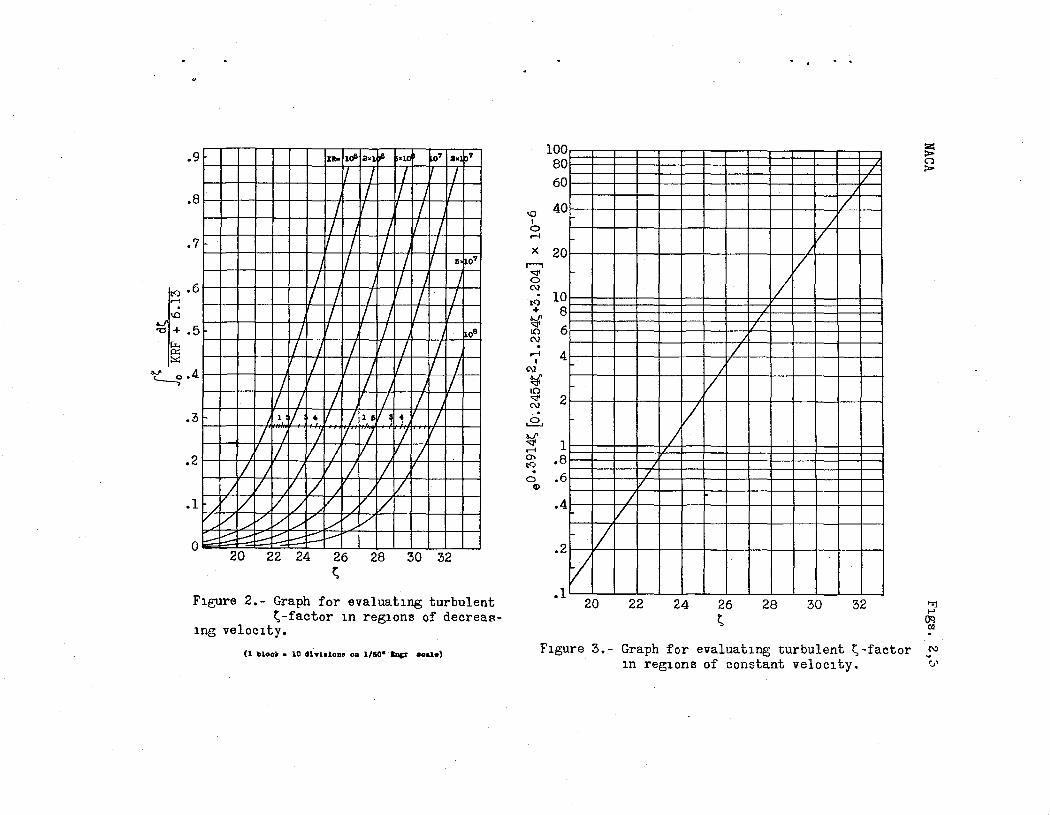
haS been evaluated for the usual range of ~ and KR.. These values are given in, table I and plotted in figure 2.
Therefore, when tu I, i, and loge C;;) are known, the
value of ~Q may be found from figure 2 by using equation (13) ln the form
I ::; r h~ d C = tJ 0 KFIl. + 6.13
loge (~'\ +ft1 d t , a I 0 KFR + 6 • 1 3
Equation (14) applies only in regions over which the velocity decreases« When the velooity remains oonstant, equation (11) simplifies to
(14)

8
which can be solved by the use of figure 3.
In a region over which the velocity is inoreaslng. equatlo~ (14) is replaced by
(v \ rtl rta UR-6.13
:: loge I .:...&. + \,V ~I \'0 KF.a- 6.13
values for the integral appearing in equation (16) have been evaluated and are given in table II and figure 4.
It is rarely neoessary to divide the velocity dis-'tribution in the reg10n ~f turbulent flow into any more than t:1.ree segments. In each of these segments either equatlon (14), (15). or (16) will apply. l1herefore the inc~ease of t through the turbulent reg10n can be calculated directly by the use of figures 2, 3, and 4.
Calcul~1on of the drag coeffic1ent.- SqUire and Young !:a.ve shown in reference 1 that when the ;f'lnal value of the momentum thickness, e~, and the relative
velocity at the trailing edge of an airfoil are known the drag coefficient can be caloulated by the relation
I' e :\ Iv:\ 3. a CD = 2 I -1.: J.
,cl ,Vol
where the subscript ~ indioates values at the traifing eU5e. The previous analysis has been ln terms of the t factor; so, to avoid hav1ng to convert to terms of mO;lcntu~1 thickness, lt is possible to use equation ( 6) r e\Tr itt en as

9
va O.3914~ = 0.2454 e = X (18)
Substituting into e~uation (17) gives as the profi1edraG coeff~cient
= 2>" ~ (V ~ '\ a • a ( 19 ) OD It '\ V o ,'
In figure 5, ~ is plotted as a function of t. Therefore, when the value of tT has been computed, AT
can be read from figure 5, and the profile drag can then be calculated by equat~on (19).
APPLICA~ION
T~e oethod for calculatlng the profile drag, which is outllned in the previous section, can best be illustrat ed b.y ~ndioat ing the actual st eps in the ca1cu1at ion of several examples.
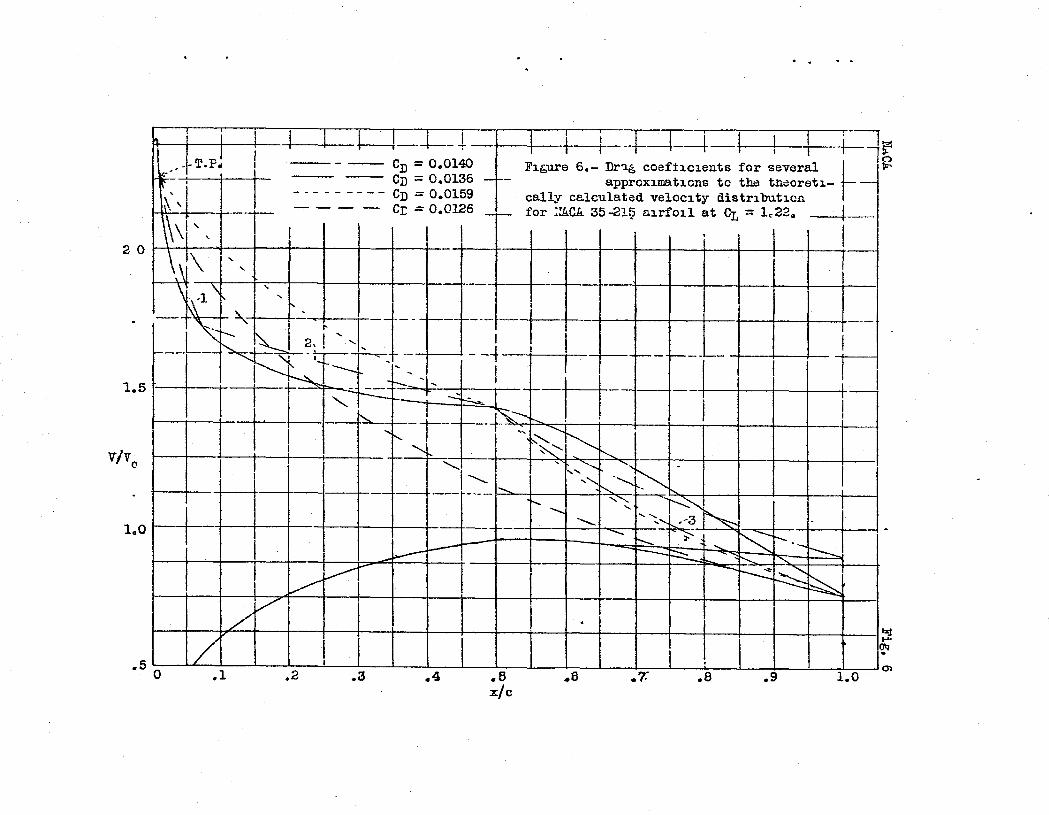
EXao.12le 1. Lo,~ag airfoil at high 1 itt.- The ~elocity distribution for the NACA 35~2l5 airfoil was computed at a lift coefficient of 1.22 by the method of reference 2 and is given by the SOlld line in figure 6. The trailing-edge velocity was obtained by extrapolating the calculated velocity gradient near the trailing edge. D1SGanCes along the airfoil surface are nearly the same as distancas along the chord except at the leading edge. Slnce at the leadlng edge the method of reference 4 for lamin~r boundary layers applles, and this method is'not significantly affected by replacing d~stances along the surface by their chordwise component, it is possible to make the simplification o~ using chordwise distances instead of actual lengths along the airfoil surface. ~h1S simplificetion is usually permissible.
Tho computed velocity distribution has stagnation point at x/c = 0.0270 on the lower surface and a maximum velocity of 2.392 times free stream at x/c = 0.0037 on the up~er surface. Behind this point the velocity reaches vjv o = 20210 at x/c = 0.0108. Therefore, fro~ e~uation (1)

10
2.392 78.0 a = =
0.0270 + 0.0037
and equation ( 2)
b 2.392 - 2.210
25.6 = = 0.0108 - 0.0037
frort figu~o-l, sitice b/a = 0.33,
4>s = 1. 054, 6~ = 6.0
equation (3) gives as the velocity at transition (separat:..on)
Vs = 2.392 = ~ 27 trio
1.054
which corresponds to a value of x/c = 0.0090. If th~ Reynolds number is taken tobe 5.75 x lOS, the t factor a.t transJ.tion by .equation (8) is
The l)Osit ions in the turbulent region of the upper surface at which the velocity gradient changes abruptly are a.ppro~inate1y: x/c = 0.0727, vIvo = 1.725 and
x/c = 0.50, VIVo = 1.432. USlng vivo = 0.768 as the trailing-edge velooity, it is now possible to trace the grouth of t. ~y equation (12)
Ie R = ~ Q.0727 1 (1 '\
1.725;
0.0090) 06 6
\ 5.75 x 1 = 2.62 x 10
f-L-\ 2.27)
and then from equation (14) and figure 2
( 2.27 \ Il = 0.042 + loge' ----) = 0.316
,1.725
so that froD figure 2
"-
t x/c = Q.073
= 24,05
S imilo.rly
FroLl
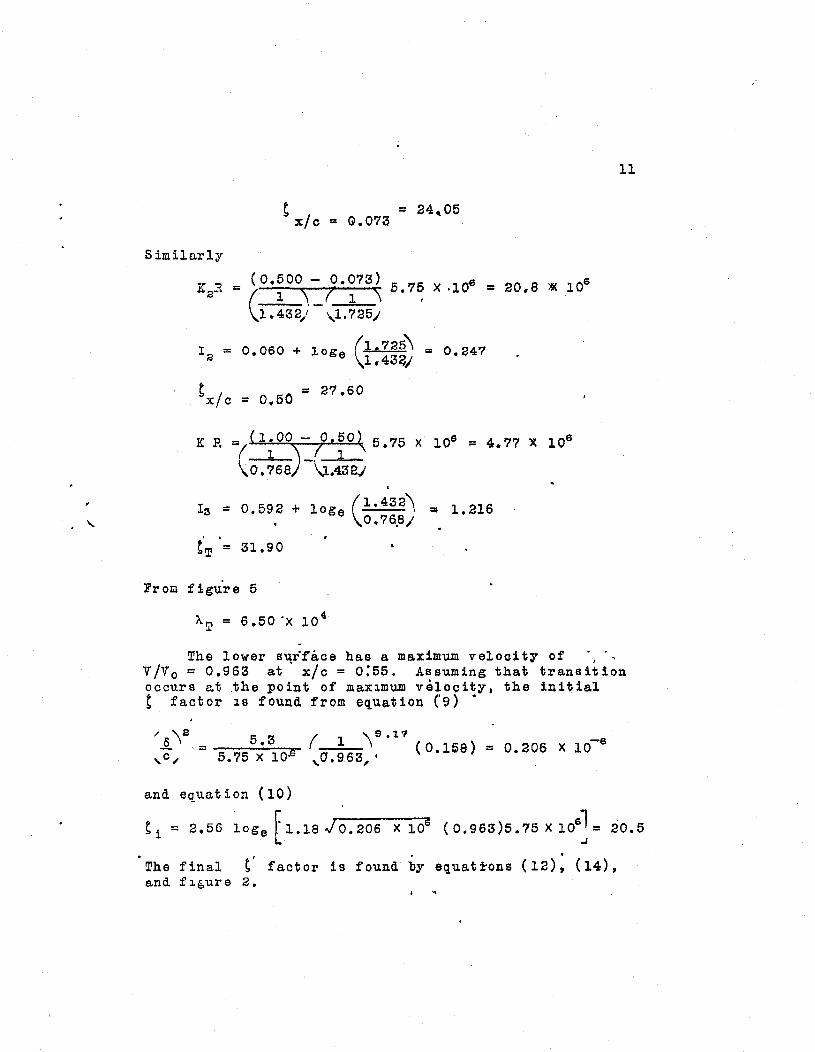
X..,3 = (0.500 - 0.073) 5.75 X ,106 = 20.8 ~ lOS '" (1 \ _( 1 \ . 1.432/ \.1.7251
I = 0 060 + log (1.725\ = 0.247 :3' e 1,,43~1
t x/c = 0.50 = 27.60
X R
. I:s := 0.592 + 10 (1.432'1
ge 0.76,81 = 1.216
,
tT = 31.90
figure 5
Ar.'I = 6.50·X J;
10 4
11
The lower s~rface has a maximum velocity of , vivo = 0.963 at x/c = 0:55. Assuming that transition occurs at .the point of max1mum velocity, the initial t factor 16 found from equation (9) •
0.206 X 10-s
and equation (10)
ti = 2.56 loge rl.lsJO.206 X 106 (0.963)5.75xlosl= 20.5
~ J
The final t' factor is found by equa-trons (12), (14), and f~E.ure 2.

12
and
KR= { 1.00 - c., 5{) l
( 1 '\ / 1 \
0.768 1 \0.963 I
I = 0.022 + log (0.9~\ = -0.248 \0.768/
10.88 X 10⁶
from figure 5
f..T = 0.69 X 10⁴ , Finally, substituting the value of f..~ of the upper
plus the lower surface in equation (19) gives
o = 2(6.50 + 0.6~) X 104
(0.768)9.9 = 0.0140 D 5.75 X 10⁸
Ex~ili 2. ~ransition ahead of maximum velooity.·· As another illustration of the methods for caloulating the profile drag, the drag of the experimental velocity distribution for the NAOA 66,2-420 airfoil at zero angle of attack, given in reference 5, will be calculated for transition fixed at x/c = 0.10 on both surfaces at a Reynolds nu~ber of 6.35 X 10 6 , corresponding to a Mach number of 0.194. ~he upper and lower surfaces are treated as belng divided into two turbulent regions each. These div1sions are shown on .the plot of the experimental velocity distribution (fig. 7). The analysis is based on e~uation (9), (10), (12), and (16). For ~he upper surface:
( s "s = .5.3 (0.252 ~ 10-e = g. 0395 X 10-6 "c; 6.35 (5.3)
~ ;- -3 61 loi = 2.56 loge L 1.1.8 (0.199 X 10 ) 1.2 (6.35) 10 ~= 19.2
\~~ (0.60 - 0.10) o~106 = 41.2 X'lOG
( 1 )_ (_1_\ ,1.20 \1.32;

Il = 0.001 + iog (1.320
) = 0.095 •• I ,1.2,
fron figure 4
(1.00 - 0.60) K2~ = ~(~--~\----(~----~)-
\.O~S6) - \ 1~32 I;a = 0.333 + log (1.32) = 0.761
,0.86 .
from figure 2
and figure 5 gives
4 A.T = 2.42 X 10
For the lover surface;
::: 6.28 x lOs
13
ti = 2.56 loge [1.1~ (0.223 X10"'~) 0.60 - 0.10
1.12 (6.35) 108] = 19.3
= 72.2 » 10 6
1 \ 1 1.' .. 12,. -', 1 • 18 )
(1.18 \ Il = 0.00 + log -, = 0.053,
\+..12, t o•so = 26.0
Kelt = (1.00 - O.60} 6.35 xIO G = 8.06 X lOG ( 1 \_(-L) ,0.86/ ,1.181
1;a = 0.286 + log (1.1S, = 0.602, tT = 28.8 ,0'.86)

14
and froM figure 5
A.T = 1.92 X 10 4
The drab coefficient is therefore
( 0 • e G ) 2. 2 = O. 009 e
The profile drag of most airfoils oan be calculated by the use of the operations involved in these two examples.
DISCUSSION AND CONCLUSIONS
The graphical method for analyzing the turbulent region, ~resented and illustrated in the previous sections, uses a rough approximation to the velocity distribution. It is possible to use such an. approximation because the growth of the turbulent boundary layer seems rather insensitive to the actual shape of the veloc1ty d1stribution in a region over whioh the velocity gradient does not change markedly. This pOlnt can be illustratecl by oonsldE'ring- the upper ~urface velocity d1Str1bution of the -r . .A.CA 35-215 ai=fo11 in figure G. It is seen that the tnI"o111ent r~gJ6n has'three markedly different reg10ns. 'h~n the ca~~ulati:n is ~ased on these natural divisio~s, the val~~ ~v~~d fo~ the profiledrag coefficient ~s 0 "140 (6ia~~~ 1). Further division of the velocity eLstr 4 butiJ! fa:~~ to chan€e this value. On the other hand, if' the'lil.acural d:ivJ S10ns are not taken lnto accouut, the cal~ulated drag coeff1cient 1. considerably in e,'ror. For example, if the above turbulent region ).s treated as a Single segment. the drag coeffic1ent is 0,OL26, and when treated as two segments tho drag coefficient is 0.0159.
~he theoretical velocity distributions obtained by the method of reference 2 have the shortcomin€ of having a stagnation point at the trail~ng edge. In order to compensate for this incorrect trailing-edge velocity, it is necessary t~ extrapolate the velooity gradi~nt from ahead of about xl c = 0:9. The e·rr or involved in such

15
an approx1mation is rather small because changes in the skin frlction, due to trail lng-edge velocity variations, are cotlpensated for by the corresponding changes in the pressure drag. Thls can be illustrated by assumlng for the tral11ng-edge velocity in figure 6 a value of VIVo = 0.90. The calculated profile-drag coefficient for th1s ne" tro.lling-edge velocity is 0.0136, which is in satlSfactory agreement with the previously calculated value of 0.01'1:0.
The experimentally measured velocity distributions and prof lIe-drag coefficients for a wide range of lift coeffic1ents of the NLCA 35-215 airfoil are presented in reference 6. Theodorsenfs method, reference 2, also was us ed to calculat e the theoret lcal v'eloci ty distributlons for the NAOA 35-215 airfoil at a number of 11ft coefflcients. The calculations were made a~ specific 11ft coefficients rather than specific angles of attack because the dutrlbut ions thus obtained more nearly approxir.l£1t e exper lmental m easuremen t s. The prof ile-drag coefficients at these lifts were calculated from both the theoretical and the e~erimental velocity distributlons. ~he values thus obtained are compared with the experioento.lly measured polar in figure 8. The position of transition for the lo,~drag range of lift coefficients was found experimentally to lie from 5 to 10 percent of the ChOl'a, length behlnd the POSlt ion of maximum velocity. The cal culat ed low-dl'ag coefficient s as su.me trans it lon to occur at the posltion of maximum velocity and consequently these computeQ. values are h .. gher than the experinental values.
T~le :'1roflle-drag coefficients and experimental pressure dlstributlons over a wide range of Mach numbers, and corresponding Reynolds numbers, are given ln reference 5 for an NAOA 66,2-420 airfoil. The procedure of the present report has been used to calculate the drag at Vo.rlO'l.tS Each numbers for the smooth al.rfoil with transltiofi :ixed at xle = 0.10, both at 0° angle of attack. T~ese calculated values are compared w1th the experimefitally measured profile drags 1n £igure 9. The values for the smooth- airfoil are in good agreement with experioental measurements up to about 1,1 = 0 0 53, which corresponds to a Reynolds number Qf 16 X 106
• Above this l:ach number the measured drag increases rapidly because transition moves ahead of the posit~on of maximum veloclty. Slnce the turbulence level of the tunnel is hlghor than that of free air, the boundary-layer Reynolds number at transition is well below the value of 8000 which

16
was mentioned. as a crite.l'ion for transition on a smooth airfoJ.l J.n flight. lior~over, as is shown 1n reference 7, 'compres21bility effects produce a profound change in boundl'ry-layer Rtlynolds number at trans"it ion. SOt lack-1ng !':J:.olrloclGe of the proper transition criterion to use fOl' t1:<., uir..d tunnel in which these tests were ml:\d-e, t"'ans1t:O.l on the smooth.. airfoil was assumed to occur at th~ tla:arn;:.ll velocity position. 'l'he calculated values for the case of transition fixed at x/c = 0.10 are unlfornly 10, ... er than the experimental points because the theory does not account for the drag of the ~arbor~ndum used to fix tranSition. ~~en tranSition was fixed at x/c 1:1 0.60, the experil!1entail~' measured drag coefficient was abo~t 0.0009 abov~ the measured v~lues for the smooth airfoil. 'l'hi~ drag 1ncrease 1S due chiefly to the cc~borundum strip. Since transition at x/c = 0.10 ~aS fixe~ by a similar carborundum strip, it is to bo expected. that the drag of the carborundum in this Case also vill be about 0.0009. When thJ.$ amount is added to the t~doretically calculated drag, the calculated values are ln s~tisfactory agreement with the experimental measur OLl en t s.
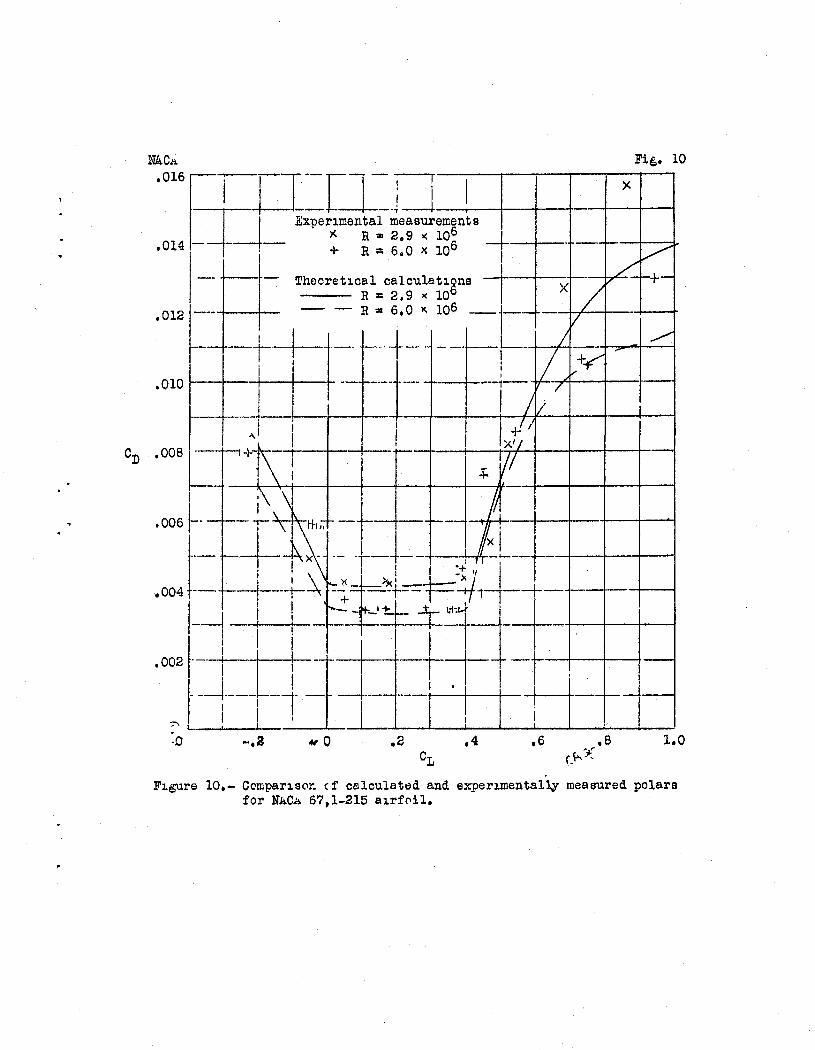
As a ~urther comparison of the results predicted, by the _'ethods presc.ll&sd here, with experl.mental measurements, )olars for tee NACA 67,1-216 a1~foil have been calculated for Reynolds numbers of 2.9 X 10 6 and 6.0 x lO~. 'l'he expe~lmentally measured polars at these Reynolds nucbers and a simple method for computing the ve~.ocit~· ovel' low-drag airfoils at various lift coeffiClonts 0'0 2,ll'esenteo. 1n l'eftlronce S. In figure 10 the experinontal measurc.ments are compared with the theoretic~lly calculated polars. The large discrepancies in the drag coofficients for hiGh lift coeffl.ciente may be due to "t'l1."bulont separ~tion" on the upper surface of the aJ.rfoil. Such a breakdown of the flow is believed to occu~ ,~en a thick turbulent boundary layer is subjected ~o a stoep adverse pressure gradlent. To determino the 1~mits of appllcabilJ.ty of the present method, polare vore calculated for a number of widely different airfoils. Satlsfactory agream~nt with experimental measurements waS fovnd u? to lift cooffieients for which the drag coefficl.~nt of the surface of highest drag on the airfoil waS sOmEH,h.:1.ii g",~~at'3r than 0.01. With higher lift coefficientS the ca~~~lated drag coefficients were p~ogressJ.vely lower than t:le T.l0aSilred values. It is also seen frOM figure 10 that on lncorrect var1atlon of the lift coefficients with
. ,

17
Reynolds number oorresponding to the end pOlnts of the low-draG region is predicted by the present method. This shortcom~ng results from the lack of an adequate critorlOn for determining the tran'~iition-point movement caused by the velocity peak at the forward part of the aufoil. This' peak ar is-es' fr om the superpos i"t ion of small addit~onal and basic low-drag velocity distributions.
The Droblem of sudden shifts in transition point with swall changes in lift coefficient is not limited to low-ara~ airfol1s. In figure 11 the calculated polar of the NACA 23015 airfoil is compa~ed wi~h the experimental meaSurements given in reference 8. It is seen that the abrupt dreg increas~ ~n the' w~nd tunnel at small negative l~ft coeff~cients occurs at a different lift coefficient from that l')red~cted. Uoreover, figure 11 indicates that the drag coefficients for conventional as well as low-drag air!olls can be calculated for wide ranges of lift coef-f icient s.
Ames Aeronautical Laboratory, lj!1t~onal Adv~so.ry Comm~ttee for Aeronautics,
iioffett ll'l.eld, Callf.
REFERENCES
1. Squlre, H. B., and Young, A. D.: The Calculation of of the Proflle Drag of Aerofoils. R. & H. No. 1838, Brl.tl.sh A.R.C., 1938.
• 2. T~eodorsen, Theodore: Theory of Wing Sections of Arbitrary Shape. NACA Rep. No. 411, 1931.
3. Jacobs, E. N., and von Doenhoff, A. E.: Formulas fOl' Use in Boundary-Layer Calculations on LowDl'ag llings. _ ~TACA AOR, Aug. 1941.
-' , 4. von ~!1rDan, Th., and MIllikan, C. B.: On the Theory of Lnninar ~oundary Layers Involving Separation. RACA Rep. No. 504, 1934.
18
5. Hood, Hanley J., and Anderson, Joseph L.: Tests of an lTACA 66,2-420 Airfoil of 5-Foot Ohord- at High Speed. NACA ACR., Sept. 1942.
6. Allen, H. Julian, and Frick, Charles W., Jr.: Expe~inlental Investigation of a New Type of Lo,~Drag iT~ng-Nacelle Oombination. N'AOA AOR, July 1942.
7. Allen, H. Julian, and Nitzberg, Gerald E.: The E~fect o~ Oompressibility on the Growth o~ the Lao1nar Layer on Low-Drag Wings and ~odies. lTACA ACR, Jan. 1943.
8. Jacoos, Eastman N.-, Abbott, Ira. H., and Davidson, ,i11 ton: Prel iminary Low--Drag-Airfo II and Flap Data From Tests at Large Reynolds Numbers and LO\1 Tur'bulence. NACA AOR and Supplement, liarch 1942.

t TABL:iJ 1.- VALUES OF r
oJo KRF+6.13 FOR OALOULATIlirG t
A REGION OF DECREASING VELOCITY
19
IN'
-......-----;-- - ---..----..-1 -.-- . t 108 2XI0s 5Xl0 f3 10'" 2X10'" 5X10'" 10 A
18-.~5~0~.~0~7~8~7~~0-.0~4~1~7~~0-.~0~17~~~~O~.~O~O~8~8~0~.~0~0~4~4~l~0-.O~0~1~9~~0~.~0009 19.5 I .1220 .0666 .0287 .0145 .0073 .0030 .0015 20.5 .1827 .1039 .0459 .0237 .0120 .0049 .0025 21.5 .2628 .1571 .0723 .0380 .0195 .0080 .00"10 22.5 .3623 .2300 .1112 .0601 .0314 .0130 .0066 23.5 .4793 .3210 .166l: .0931 .0497 .0209 -.0106 24.5 .6104 .4305 .2396 .1403 .0774 .0332 .0170 25.5 .7518 .5555 '.3321 .2048 .1176 .0520 .0270 26.5 .9006 .6925 .4420 .2881 .1738 .0798 .0425 27.5 1.0544 .8383 .5676 .3901 .2479 .1208 .0659 28.5 1.2116 .9900 .7050 .5086 .3409 .1774 .1001 29.5 1.3708 1.1458 .8508 ~6406 .~520 .2520 .1485 30.5 1.5313 1.3041 1.0023 .7824 ,b'/76 .3454 .213'9 31.5 1.6930 1.4640 1.1581 .9314 .>;'l47 .4560 .2975 32.5 1.8551 1.6251 11.3166 1.0852 .d~03 .5813 .3993 33.5 2.0175 1.7867 1.4766 1.2421 1.0118 .7183 .5173
t TABLE II.- VALUES OFf: dt,. FeR CAJ~CtnATING t
o ~:RF-6 .13
-,-,}C3.
C>'j 106
14.5,0.0113 15.5 .0194 16.5 .0335 17.5 .05G6 18.5 .10<.1:4 19.5 .1968 20.5 • <.1: v 45 21.5 22.5 23.5 24.5 25.5 26.5 . 27.5 28.5 29.5
IN A REGION OF INCREASING VELOCITY
2X10 G
0.0047 .0087 .0154 .0270 .0449 .0609 .1494 .3009 .8890
5X10 6
0.0020 .0036 .0062 .0107 .0182 .0309 .0528 .0917 .1663 .3340
-,-10'" I 2XIO'"
0.0011 0.0003 .0019 .0007 .0032 .0014 .0054 .0025 .0091 .0043 .0152 .0073 .0255 .0123 .0429 .0206 .0732 .0345 .1287.0582 .2410 .1001 .5510 .1795
.3580
I 5XI0
7
0.0001 .0003 .0006 .0011 .0018 .0030 .0050 .0082 .0135 .0222 .0367 .0612 .1045 .l866 .3720
8 10
.0001
.0003
.0006
.0012
.0022
.0038
.0064
.0107
.0178
.0292
.0483
.0810
.1421
.2610

NACA Fig. 1
-
.1 .2 .3 bIB.
.9
.8
.7
~5 .6
'0 + .5 J:>.. 0::; ~
"'" ~.4
.:3
.2
.1
o
/
--
n- Idi a'l ~ xl( 0" a. p" '/ I / I
I I I II I II I
1/ / / / I 7 I
1/ I I 5 07
/ II I II I 1 / I
I V I / I
I 7 08
I / I / / / 7 / / 1/ /
/ ! / / II / / / ~/
1 V • 11 7 16 17 . ~ / / / / 11 '1 I
II V I / 1/ / / / / II / 7
J / / 1/ J J ,/ V V / / v V V ./
,/ V ./ V ./ -'" 7
v V -~ V ..... -f.-::: 20 22 24 26 28 30 32
~
Flgure 2.- Graph for evaluatlng turbulent ~-factor In reglons of decreas
Ing veloclty.
(1 block. 10 41YloloDII on 1/50" IDU acale)
100 80 60
\Q 40 I 0 .-l
X 20 ..---. ~ 0 C\l · 10 t<) + 8 ~ lO 6 C\l · .-l 4 I
C\l
~ lO ~ 2 C\l · ..2..
~ 1 .-l ()\ .8 t<) . 0 .6
Q)
.4 ,/
.2 / Y
.1 20
/
V /
/
/
22 24
/ I
26 ~
1/
/ /
28
I V
/
V
30
/ /
J /
32
~ C"l >
'"rj .....
CJll CIl
Flgure 3.- Graph for evaluatlng turbulent s-factor ~ In reglons of constant veloclty. ~'

·9t I I I I I i1 tll1 t1il atrl4t' I .81 I I I I I I II I I I II '" '" II I
.7 , I I I I I I " III II I II " I I I
I '" Y I , I' I R I II
I '" ft I I I I I " 1 "I II " I Ii I' I I , .,
"Z , I " .. .v, , I 1 1 1 , I II ..
.21 , , , , '{' JI 1 /1 ..
.1, 1 1 1 X 1/1 VI :,1, r, A U ,
u~ ~---:t::J I I 1 16 18 20 22 24 26 28
~
Fl~e 4.- Graph for evaluating turbulent ~
velOCIty. factor In regions of increasing
(1 block • 10150")
100 80 60
40
20
10 8
~ 6 • 0 rot 4 x ..(
2
1 .8 7
.6 /
.4 V l-
l-.2
.1 20
V V
V I
/ I
I
I
I
I I
II 22 2:4
I
7
/
I
I I
26 ~
, II
I; I I
V, t/
V, ,
/ 1
I I ,
I ,
I I I
I
I
I
,
I:
I I
Ii I
2A 3«D
1/
/
I
I
I
I
'112
I
:
i
I
I : ,
I
~ -") :>
"".Ii ... ~ 17J)
Figure 5.- Variation oj' X 1II'1i1tRl tumrlo>lI1]elITlt ~-:lfall::1tOJ]". !" 01
.~ Ii+- I I w---=r-= ~ --r---r=~r ~T -+ I--t I ! ! ~l~ __ --r T. P" I -- - -- CD = 0.0140 Fl.t;ure 6.- Dr'lt, coefhcl.ents for several I I ~ ~-;-----+ -- CD ::; 0.0136 -t-- approxmahons to tll.!d thdoreh- r I '~' ! I ----- ---- CD := 0.0159 cally calculated ve1ocl.ty distnbuhcn \\ l ' T ,- - -,- CJ: = 1°00126 - - for ;:r.Ch. 35 "'l~, "ufo,l ~t Or. = 'f2. I :
2 0 I \ \1\ I"" - 1-: t~ 1" '- I I -r I - I
i f __
L " l~ I 2,! - 'k I LJ I ! I I . -1--~FlrJ·· --1 I I :~----~ 1 t1 1.5t-, -r i -t-~ --f=4- ~~--,--+-+- I I I' I I,
I I I t-i "tl
f! ____ --~~~- I I I J
i I 'r-.- " 0.. -....... ~ I
I I I! "~'I "r--.. i , ,LI-1 I - j ~l:::-"I~ ,,,~<~~ i I I 1 !
. I"-- ......... '~ '"' r-----.'" -........ _±-,3 ~
I I I --~-- - r-~ , L::;::r----
. ~I.---- - ~ t'--.." t:::--.
v/v()
I 1 0 0
! ~ -r--:: .................... ~l I I ~~
J lafl I I I I I I I 1'1 I ! ! I I I I I~ o .1 .2 .3 .4 .8 .. 6 .7. .8 .9 1.0 .
x/c

I~I-I--I ~I --I~I i I---'~
I _ '_ --Tt-='- -, I~-- , ~i~-t--t-r-t-i-l f .J.---.¥-=F=-f~ - -,--- -- ~ l--~-L-y-:-=-±:===t--=-1=-- -:-1:::- --:=P-=-= I ~- i I I I 1 I L __ - - -=-- - - -+- - ~1 _} _ __ - 2 ' I :-r-y 1'2 I' I I
~. j . I " 'L I I
1.0I-fj-- - I r I I I -- --::-- •• -1--1 - -4--1 I--~-t+--l-jj---t-+- I +--k-t- ~-L
I -4-t-. ~ ~-. ---,- -1-- I-'-J --L-t--rl---;----~--+--L-J----vivo IH-f--H I ,I I I I , I .
I , . , , J I I I .
- --T----I~-I- I~- j---t--)--- i-i-r-t-t .5t-ri---i--~+11 T~-~- + - -
I - -- -1--. _L J I l! I --J ---1- -J -- ---L.--
--+----+-+---t--l-r--r-! -1-- r---r- -I
I . I ! I I l--.-l___ _ _ ~
o .1 .2 .3 .4 .5 06 .7 .8 .9 1.0 ~ x/c ~ o •
Figure 7.- Approx1ruatlon to expe~Lmental ve10clty dlstrlbutlon for RaCk 66,2-420 alrfol1 at ~= 0 ; -,J
transltlon flXed at x/c = 0.10.

CD
•
I~:~I--r-I I I I I I I 1--' I I ' I i i I I~
.Ol4-+-+--l--i--~-H--~+;-r+-I--1· -1-h7iJ-L- J .. '-i + Experimental measurements : I I I J. -1 II
- - --Calc"J.lated fr"m thaC'retl.cal v61ccl.ty --t-;- ',' ;4/ 17 I .012
I dl.sUl.buhon I ~ ~ / ) I I I Celculated frnm experimental v-a10cl.ty H· I ----:-r- ;-rt----t--l--
_Lttidl.st~l.~~~-H ---L-L- i ~ :: I w I I r I I ! I 1\ Ii), I i
.010r---t- f I I ! - i i-t---;---f- ; i xt-- I --4---1-++ -i --t-J -- -:- --+ --+- -J_ 1/ t--+-J -~+'i-t-+-+1-~ 1-+---t/r-1'-+i- I ~-1 .008
~+--H--i---t-+---l--xY i Tl- -] ~I j'lil~1 I I ~ x~:I-t-i--+-- -l---~--+-:--+--
.0061 . i! -L~ __ L- L_ : ,I -1- ~ . I .
.004:
.002 -.6 -.4
, ,
I I I I J I I H--: f--n ! I !--ii II I -.2 o .2 .4 .6 .8 1.0 1.2 1.4
~
Fl.gure 8.- Comparl.so~ of calculated and experl.mentally measured polars for NaCA 35-215 al.rfol.l at R = 5.75 X lOb.
"'" .... OIl • OJ

NACA .0200 f-
Fig. 9
I ! I - -- r--t --/-
,
.0180 , Theoretlca1 calcu1atlons
-- I ---- Transltlon at x/c ::: 0.60 -- -- " " " ::: 0,10
I
.0160
.0140
.0120
CD .0100
.0080 ~_
• 0060
.0040 --
.0020 J-
--- -----t-I -+--- Experlrrenta1 measurements
+ Smooth alrfo~l )(. Transltlon fixed at x/c ::: 0.60--
[ 1:l .. II II .. = 0 0 10 J
I ---~-----"t--r--1-- r--- - -r---
+1= ---- -
-...!--- --y-- -
-t I ,
-----r--'---- --I I D "-1-- IS --r-- -- f-- --1--4----
(oJ A D. I~
l=+-~~=-- ---- ~
---I -I
"I , I I +---- --_.+- -t-- :-- i
-e-++--r---- ~ t f----l---r--- ---
-- -----L---+-.j---r---_ . -I . I X j I ' X .x I xi .ix x X >< + -n 1- _-x -- -T-"-- -:-
-t -It I-+ -~ 1---i - +-+--t-i-
+- ~o_ "r'
=~~ -~- -~ ~+=t-- ' -- _ ..
t+--=t--- ----
_tj-i- --I lib--I
.1 ,2 .3 .4 .5 .6
Flgure 9.- Comparlson of calculated proille dra6 coefflclents ~lth measured values at varlOUS Mach numbers for RaGA 66,2-420,
NAC.i. Fi€,. 10 '016ql_L-l_--[~_"n_-TT1_
I Experlmental measurem~t --l- >< R ;II 2.9 >( 106 -+ .014 -- - j- + R = 6.0 x 10⁶ I --1--. _.- - V-
, ./ Theoretlca1 calCu1atlgns I X /" "-1-+---- R = 2.9 x 10 I
-- +---~.-
-----+--1---.012 - - R ... 6. 0 x. 106 -1 -- ----+-1/-+--1--·
---rti- ,-"-- - -+-! _-I---.L-I-J -++'+-=--=-I-~/
.010 m --f---- ---_~ __ j_/~,-A-V ---+--,1---1
"1+H- i Ill' CD .OOB ~~f-~ -- I )VI,--+._--l-_+---+_-t
• 006 ~" - c-- ~- rh;;+·-t - -H.-l-i, ,_-+I_-I-_+ __ +-~
.004 I I I "t='+" 1
---1--1 '+--1 1- -.002" i l-L
H- I --+-t -1---1---1---1---
---+--, --1- -+-+ j · I -~----I--~ L-! I I -.-L ,_--1..1 _-'-_.L...' _-'-_':';"'_~ __ I "0 -.2 ~O .2 1.0
F1gure 10.- Ccmparlso~ cf celculat~d and experlmental~ measured po1ars for N~C~ 67,1-215 s1rf0i1.

.014
r I I I !. 1 Iii 1 ! ! I J ~ , I , '!--t-- -I I' I' I 14
I, i, L I I I m -I-- 1 I I I I /
•
012
1 1 .1 I -H-' !4= . ++ -+ 1 ' i I I '_' I iii I I -11 i ~
.0101 '''l ! 1 I -+i ++-->--tt!. ' --+-+_" . + +-~- ., I' OJ. I . I I ~~ I I I , ,
+~..L' 1---1 .008\ I I I +=r+ , ..;:;:..+ +1 + I J----+
I I I " t r--r=::::-+- , I I I , On fl I I I '" '- +·li"'~t ttl I I I lj .0061 I I +-+-e-+rr-r---i---- · I I i=:_J .00':1:
T
+ Experimental measurement
---- Theoret~cal calculat~on
.002' " -.8 I I I -.4 -.2 .2 .8 1.0 1.2 -.6 o .4 .6 1.4
Or. Figure 11.- CODlpar1scn of calculated and exper1mentally measured polars for ~Ch 23015 airfoil at
R = 5.9 x 10⁶ • ~ OIl . ..... .....

End of Document