i is for investigation outbreak investigation methods from mystery to mastery
TRANSCRIPT
I is for Investigation
Outbreak Investigation Methods from Mystery to Mastery

Session I
Recognizing an Outbreak

Session Overview
• Overview of outbreak investigation
• Identifying a potential outbreak
• Verifying the diagnosis and confirming the
outbreak
• Defining and finding cases
• Orienting data by person, place, and time

Learning Objectives
• Identify steps of an outbreak investigation
• Develop a case definition
• Identify a process for case finding in an outbreak
• Apply methods used to orient data by person, place, and time
• Create and interpret epidemic curves

Overview of Outbreak Investigation

What is an Outbreak?The occurrence of more cases of a disease than
expected for a particular place and time
Expected number of cases
Nu
mb
er
of c
ase
s
Days

Basic Steps of an Outbreak Investigation
1. Verify the diagnosis and confirm the outbreak
2. Define a case and conduct case finding
3. Tabulate and orient data: time, place, person
4. Take immediate control measures
5. Formulate and test hypothesis
6. Plan and execute studies
7. Implement and evaluate control measures
8. Communicate findings

Exceptions to the Rule
Basic steps provide a model for systematic outbreak investigations
•No two outbreaks are alike!
•Steps of an outbreak could…– occur in a different order
– occur simultaneously
– be repeated

Identifying a Potential Outbreak

Outbreak Information Sources
• Laboratory-confirmed reports of notifiable diseases
• Clinician reports of notifiable disease and unusual increases in disease
• Concerned parent/citizen reports to health department
• Media

Gathering Information from Case Reports
Collect:
– As much information as possible
– Negative as well as positive information
– Food history
• 3 days (72 hrs) to 5 days, if unknown agent
• Within incubation period, if known agent
– Exposure sources such as water, people, animals

Disease Surveillance: Case Report
What questions would you ask an ill person?
WHO: age, sex, occupation, any others ill
WHAT: physical condition, symptoms, medication, and medical care sought
WHEN: when did the affected become ill
WHERE: city/school, address, telephone number of ill person(s)
WHY/HOW: suspected cause of illness, risk factors, modes of transmission, notes on people who did not become ill

Disease Surveillance:What Next?
• File the report and stop?
• Investigate further?

Deciding to Investigate
• Ideally, all reports of possible outbreaks
should be investigated to:
– Prevent other persons from becoming ill
– Identify potentially problematic practices
– Add to the knowledge of infectious diseases

Why Investigate?
• Surveillance detects increases in cases of disease
• Characterize the problem
• Prevention and control
• Research and answer scientific questions
• Train epidemiologists
• Political / legal concerns

Maybe You Should Investigate...
• If illness is severe (life-threatening)
• If there are confirmed clusters or large numbers of a similar illness
• If foodborne illness is from a food handler
• If illness is associated with commercially-distributed food
• If there is outside pressure to investigate (media, politicians)

Maybe You Shouldn’t Investigate...
• If affected persons might not have the same illness
• If affected persons are not able to provide adequate
information for investigation
• If the diagnosis and/or clinical symptoms are not
consistent with the related exposures
• If there are repeated complaints made by the same
individual(s) for which prior investigations revealed no
significant findings

Verifying the Diagnosis and Confirming the Outbreak

Verify the Diagnosis
Evaluate:
Predominant signs and symptoms
Incubation period
Duration of symptoms
Suspected food
Suspected toxin, virus, or bacteria
Laboratory testing of stool, blood, or vomitus

Identify the Pathogen
• Ensure all suspect patients
have the same pathogen
• Identify the potential
incubation period for
hypothesis generation
• Can proceed while waiting
for laboratory diagnosis

Verify the Diagnosis
Potential reasons for negative laboratory results:
•Illness could be due to an organism that wasn’t tested for
•Mishandling of specimen resulting in death of the pathogen (during storage, transport, processing, or culture)
•Specimens collected too late in the illness

Defining and Finding Cases
Case Definition
A standard set of criteria for deciding whether an individual should be classified as having the disease of interest, including:
•Clinical criteria (signs, symptoms, and laboratory tests)
•Person, place, and time criteria

Case Definition
• Can be modified as more data are obtained
• Should not include a possible cause of the outbreak

Case Finding
• Contact local care providers
• Contact schools, large businesses
• Contact state health department / neighboring health departments
• Ask case-patients if they know of others who are ill
Additional sources may be appropriate, depending on the outbreak.

Orienting Data by Person and Place

Descriptive Epidemiology
• Comprehensively describes the outbreak– Person– Place– Time
• Line listings
• Graphs– Bar graphs– Histograms
• Measures of central tendency

Line Listing Signs/Symptoms Lab Demographics
Case #
Report Date
Onset Date
Physician Diagnosis
N V J HAIgM Sex Age
1 10/12/02 10/5/02 Hepatitis A 1 1 1 1 M 37
2 10/12/02 10/4/02 Hepatitis A 1 0 1 1 M 62
3 10/13/02 10/4/02 Hepatitis A 1 0 1 1 M 38
4 10/13/02 10/9/02 NA 0 0 0 NA F 44
5 10/15/02
10/13/02Hepatitis A 1 1 0 1 M 17
6 10/16/02 10/6/02 Hepatitis A 0 0 1 1 F 43

Bar Graph (Person)

Histogram (Person)

Measures of Central TendencyMean (Average)
• Equals the sum of all values divided by the number of values.
• Example: – Cases: 7,10, 8, 5, 5, 37, 9 years old– Mean = (7+10+8+5+5+37+9)/7– Mean = 11.6 years of age

Measures of Central TendencyMedian (50th percentile)
• The value that falls in the middle position when the measurements are ordered from smallest to largest
• Example: – Ages: 7,10, 8, 5, 5, 37, 9 – Ages sorted: 5, 5, 7, 8, 9,10, 37 – Median age = 8

Calculate a Median Value
• If the number of measurements is odd:– Median = value with rank (n+1) / 2 – n = the number of values
• Example: – 5, 5, 7, 8, 9,10, 37 – n = 7– (n+1) / 2 = (7+1) / 2 = 4– The 4th value = 8

Calculate a Median Value
• If the number of measurements is even:– Median=average of the two values with:
• rank of n / 2 and rank of (n / 2) + 1
• Example– 5, 5, 7, 8, 9, 10, 12, 37 – n = 8– (8 / 2) = 4, so “8” is the first value– (8 / 2) + 1 =5, so “9” is the second value– (8 + 9) / 2 = 8.5– The median value = 8.5

Descriptive Epidemiology: Place
Spot map
•Shows where cases live, work, spend time
•If population size varies between locations being compared, use location-specific attack rates instead of number of cases

Descriptive Epidemiology: Place
Source: http://www.phppo.cdc.gov/PHTN/catalog/pdf-file/LESSON4.pdf
Orienting Data by Time
Epidemic Curves

Descriptive Epidemiology: Time
02468
101214161820
Day
# o
f C
as
es

Descriptive Epidemiology: Time
• An epidemic curve (epi curve) is a graphical depiction of the number of cases of illness by the date of illness onset
• Can provide information on the outbreak’s:– Pattern of spread– Magnitude– Outliers– Time trend– Exposure and / or disease incubation period

Epi Curve: Pattern of Spread
The overall shape of the epi curve can reveal the type of outbreak (the pattern of spread)
•Common source– Intermittent– Continuous– Point source
•Propagated

Common Source Outbreak
• People are exposed to a common harmful source
• Period of exposure may be – brief (point source) – long (continuous) or – intermittent

Epi Curve: Common Source Outbreak with Point Source Exposure
Pattern of Spread

Epi Curve: Common Source Outbreak with Continuous Exposure
Pattern of Spread

Epi Curve: Common Source Outbreak with Intermittent Exposure
Pattern of Spread

Epi Curve: Propagated Outbreak
Pattern of Spread

Epidemic Curves: Magnitude of the Outbreak
Magnitude

Epi Curves Provide Information about the Time Trend of an Outbreak
• Date of illness onset for the first case• Date when the outbreak peaked • Date of illness onset for the last case
Nu
mb
er
of c
ase
s
Days

Clues from the Epi Curve
• Incubation period– The time from the moment of exposure to an
infectious agent until signs and symptoms of the disease appear
• Period of exposure– Point source outbreak– Timeframe during which the exposure likely
occurred
Using Epi Curves to Estimate the Incubation Period
• Use when timing of exposure is known and agent is unknown
• Estimated incubation period is between – Time of suspected exposure – Time of peak of epi curve

Using Epi Curves to EstimatePeriod of Exposure
• Use when incubation period for the disease is known
• Period of exposure is between– Peak of epi curve counting back the average
incubation period – Earliest case, counting back the minimum
incubation period

Centers for Disease Control. Hepatitis–Alabama. MMWR 1972:21:439-444
Calculating the Exposure Period
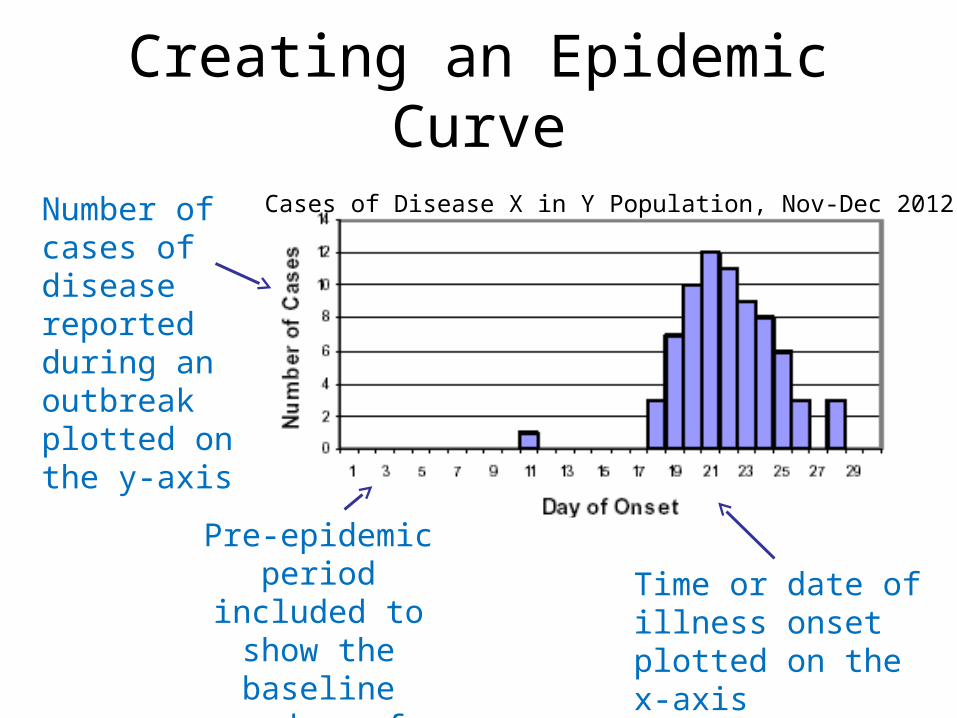
Creating an Epidemic Curve
Cases of Disease X in Y Population, Nov-Dec 2012Number of cases of disease reported during an outbreak plotted on the y-axis
Time or date of illness onset plotted on the x-axis
Pre-epidemic period included to show
the baseline number of cases

Creating an Epidemic Curve
Cases of Disease X in Y Population, Nov-Dec 2012Descriptive title
Axis labels

Epi Curve X-axis Units
• Depends upon the incubation period• Begin with a unit one quarter the length of
the incubation period
Example:
1. Mean incubation period for influenza = 36 hours
2. 36 x ¼ = 9
3. Use 9-hour intervals on the x-axis for an outbreak of influenza lasting several days

Epi Curve X-axis Units
• For an unknown incubation period– Graph several epi curves with different time
units – Choose units that best represent the data
• Units may range from hours to months, depending on the outbreak duration and known or suspected incubation period

ExampleX-axis Considerations
05
101520253035404550
10/1-10/7 10/8-10/14 10/15-10/21 10/22-10/28
Week of Onset
# o
f C
ases
X-axis unit of time = 1 week X-axis unit of time = 1 day

Session Summary
• Outbreak– The occurrence of more cases of disease than
expected for a given place and time• Outbreak investigation
– Decision to investigate depends on several factors
– Verification of the diagnosis allows for identification of the incubation period and is necessary to hypothesize about the exposure
– Case definition classifies case-patients related to the outbreak and is used to conduct additional case finding

Session Summary
• Descriptive epidemiology– Characterizes the outbreak by time, place, and
person– Is essential for hypothesis generation
• Measures of central tendency – Assess distribution of data– Include mean and median
• Epi curves, spot maps, and line listings are ways to summarize time, place, and person elements of descriptive statistics

References and Resources• Centers for Disease Control and Prevention (1992). Principles of
Epidemiology, 2nd ed. Atlanta, GA: Public Health Practice Program Office.
• Centers for Disease Control and Prevention. Outbreak of Meningococcal Disease Associated with an Elementary School--Oklahoma, March 2010; MMWR April 6, 2012 / 61(13);217-221. http://www.cdc.gov/mmwr/preview/mmwrhtml/mm6113a1.htm?s_cid=mm6113a1_w
• Centers for Disease Control and Prevention. Brainerd Diarrhea. Division of Bacterial Disease; October 2006. http://www.cdc.gov/ncidod/dbmd/diseaseinfo/brainerddiarrhea_g.htm
• FOCUS Workgroup. An Overview of Outbreak Investigations. FOCUS on Field Epidemiology (1):1. http://cphp.sph.unc.edu/focus/issuelist.htm

References and Resources• FOCUS Workgroup. Anatomy and Physiology of an Outbreak
Investigation Team. FOCUS on Field Epidemiology (1):2. http://cphp.sph.unc.edu/focus/issuelist.htm
• Hall, J.A., et al. Epidemiologic profiling: evaluating foodborne outbreaks for which no pathogen was isolated by routine laboratory testing: United States, 1982-9. Epidemiol Infect. 2001;127:381-7
• Nelson, A. Embarking on an Outbreak Investigation. FOCUS on Field Epidemiology (1):3. http://cphp.sph.unc.edu/focus/issuelist.htm
• Torok, M. Case Finding and Line Listing: A Guide for Investigators FOCUS on Field Epidemiology (1):4. http://cphp.sph.unc.edu/focus/issuelist.htm
• Torok, M. Epidemic Curves. FOCUS on Field Epidemiology (1):5. http://cphp.sph.unc.edu/focus/issuelist.htm