i manual b - software products · arcview® shape files or data interchange format (*.dxf) files....
TRANSCRIPT

Help&
Manual
1
Bio
tas

Table of ContentsAbout Biotas........................................................................................................................................................ 4Getting Started..................................................................................................................................................... 4
Open Data File............................................................................................................................................... 4Close File....................................................................................................................................................... 4Open Overlay File.......................................................................................................................................... 4Selecting Files................................................................................................................................................ 5Database.........................................................................................................................................................5Show Data Modifiers..................................................................................................................................... 5Printing...........................................................................................................................................................5Save File.........................................................................................................................................................5Save the Work Space..................................................................................................................................... 6Sort Data........................................................................................................................................................ 6Graphics......................................................................................................................................................... 6Colors and Symbols....................................................................................................................................... 6
Data Filters...........................................................................................................................................................8Stratify Data................................................................................................................................................... 8Subset Data.................................................................................................................................................... 8Subset and Filter Examples............................................................................................................................9Linking Files................................................................................................................................................ 10
Data Analysis.....................................................................................................................................................11Descriptive Statistics....................................................................................................................................11Spatial Association.......................................................................................................................................11Density Binning............................................................................................................................................11
Spatial Analysis................................................................................................................................................. 12Point Pattern Analysis Basics.......................................................................................................................12CSR : Complete Spatial Randomness.......................................................................................................... 12CSR - Contiguous Quadrats......................................................................................................................... 12CSR - Scattered Quadrats............................................................................................................................ 13Quadrat Variance......................................................................................................................................... 14Spatial Autocorrelation................................................................................................................................ 14
Home Range...................................................................................................................................................... 16About Home Ranges.................................................................................................................................... 16Data Area Curves......................................................................................................................................... 16Plotting Data................................................................................................................................................ 16Confidence Intervals.................................................................................................................................... 17Overview of Home Range Methods.............................................................................................................17
Buffer Points...........................................................................................................................................17Minimum Convex Polygon.....................................................................................................................18Confidence Ellipse................................................................................................................................. 18Harmonic Mean...................................................................................................................................... 19Kernel..................................................................................................................................................... 19Voronoi1 Polygons..................................................................................................................................20
Habitat Use........................................................................................................................................................ 21Habitat Analysis - Type I Design.................................................................................................................21Habitat Analysis - Type II Design................................................................................................................21Habitat Analysis - Type III Design.............................................................................................................. 22Compositional Analysis............................................................................................................................... 22
Compositional Analysis - Data Format Options.....................................................................................22Compositional Analysis - Home Range Level........................................................................................22Compositional Analysis - Study Site Level............................................................................................ 23
Neu's Method............................................................................................................................................... 23Neu's Result Fields................................................................................................................................. 24Neu's Habitat Proportions.......................................................................................................................24
Movement Analysis........................................................................................................................................... 26Movements...................................................................................................................................................26
Circular Statistics:.................................................................................................................................. 26Linear Statistics:..................................................................................................................................... 26
Regression and Correlation................................................................................................................................27Regression....................................................................................................................................................27
2

Linear regression.................................................................................................................................... 27Polynomial regression............................................................................................................................ 27
Temporal Autocorrelation............................................................................................................................27Runs Test................................................................................................................................................28
Sampling............................................................................................................................................................ 29Random Sampling........................................................................................................................................ 29
Simple Random Sampling...................................................................................................................... 29Stratified Random Sampling.................................................................................................................. 29
Computer Aided Design.................................................................................................................................... 30Add Shape ................................................................................................................................................... 30Adjust Lines................................................................................................................................................. 30Adjust Points ............................................................................................................................................... 30Adjust Polygons........................................................................................................................................... 31Altering Shapes............................................................................................................................................ 31
Charts and Graphs..............................................................................................................................................32Geographical Information (GIS)........................................................................................................................34
Identify Data................................................................................................................................................ 34Plotting Data................................................................................................................................................ 34Zooming....................................................................................................................................................... 34Finding Distances.........................................................................................................................................34Grab and Move............................................................................................................................................ 35Spatial Analysis............................................................................................................................................35
Create Buffers.........................................................................................................................................35Creating a Grid....................................................................................................................................... 35Merge Overlays...................................................................................................................................... 37Shape Overlap........................................................................................................................................ 37Point in Polygon..................................................................................................................................... 38
Projections......................................................................................................................................................... 39Datums......................................................................................................................................................... 39Equatorial Mercator..................................................................................................................................... 40Lambert Conformal......................................................................................................................................40Latitude and longitude..................................................................................................................................41Stereographic projection.............................................................................................................................. 43Universal Transverse Mercator (UTM)....................................................................................................... 43
Grids.................................................................................................................................................................. 45Creating a Grid.............................................................................................................................................45Grid Size...................................................................................................................................................... 45Grid Colors...................................................................................................................................................46Grid Confinement.........................................................................................................................................46Grid Limitations........................................................................................................................................... 46
Simulated Data...................................................................................................................................................47Simulated Point Patterns.............................................................................................................................. 47Simulated Data - Simple Distributions.........................................................................................................47Simulated Data - Complex Distributions..................................................................................................... 47Simulated Data - User Defined Random Data............................................................................................. 48Simulated Data - Random Data Limits........................................................................................................ 48Permutations.................................................................................................................................................49
Data Permutation Example.....................................................................................................................49Pascal Scripts.....................................................................................................................................................51
Pascal Scripts - Basics..................................................................................................................................51Pascal Scripts - Variables.............................................................................................................................51Pascal Scripts – Structure.............................................................................................................................52Pascal Scripts - Procedures and Functions...................................................................................................53Pascal Scripts - Control Statements............................................................................................................. 54Pascal Scripts – Arrays................................................................................................................................ 56Pascal Scripts – Conventions....................................................................................................................... 57Available Functions..................................................................................................................................... 58
Array Functions...................................................................................................................................... 58String Functions......................................................................................................................................59Trigonometry Functions......................................................................................................................... 60Random Functions..................................................................................................................................61
3

About BiotasBiotas is software designed to analyse spatial data. You may evaluate Biotas for a fixed time perioddetermined by the software. After the evaluation time has expired, you may either purchase anaccess code to license your copy of Biotas or you must remove the software from your computer.Use the standard Windows® "Add/Remove Programs" option available from the Windows® ControlPanel.
Getting Started
Open Data File
Menu: Files > Open Data File
Biotas opens several basic data file types including database files, Excel files, and text files.Overlays of shape or geographical features can also be opened and accessed by Biotas.
Database files may either be a dBASE (*.dbf), Paradox (*.db), or Microsoft® Access (*.mdb)file format. Text files should be stored in either comma (often with the *.csv or *.txt extension)or tab separated values (usually *.txt). Any of these text file formats may be created frommost common database and spreadsheet programs. If a comma or tab is not found in textfile data record, the each record in the text file will be parsed by spaces. This is aninconsistent method of data storage and Biotas uses it only as a legacy format. All new textfiles should be either tab or comma delineated.
When a file is opened, Biotas will present a variable definition screen where at least the fieldsthat represent data point locations, "X,Y" must be defined. Once these fields are defined allfiles with the same point location fields will open without requiring redefinition. Other optionsinclude selecting the variables that include date and time data if time dependent analysis is tobe performed.
Close File
Menu: File > Close File
The close file dialog box allows for closing of all files that were opened or generated (e.g.home range contours). Closing a file deletes them from local memory but not from a diskdrive. If generated files were not first saved to a disk, then they will be permanently deleted.
Clicking on the 'Close Files' button will close the files. Click on the 'Finished' button to exit thiswindow.
Open Overlay File
Menu: File > Open File > Open Overlay
File Overlay imports formats currently supported include ArcView® shape files (*.shp),MapInfo (*.mpf), and Data Interchange (*.dxf) formats.
4

Graphical results can also be exported to an ArcView® compatible shape file format.Previous results can, therefore, be imported later as a coverage for comparison withouthaving to re-analyze the data.
An overlay file can be opened in two ways. Either directly from either the menu item"File/Open Files" or "File/Open Overlay Files". Two methods of opening overlays are providedbecause (1) data files may be of the type "Point" and (2) it is an easy and convenient way toopen all files through a common interface. However, the standard open file option will only go to the specific folder designated for datafiles and display files corresponding to the default file extension. This can be a problem withArcView® shape files when Windows® has registered file extensions turned off (theWindows® default state) since the supporting database for a shape file will have the samename as the shape file (only the non-displayed file extension is different). Thus the databasefile may appear to be the shape file to open. This will happen if the default file extension isset to "dBASE (*.dbf). By opening overlays with the "File/Open Overlay Files" menu item thiscan be avoided.
Selecting FilesMost forms that process data display a list view of the data file names, point or shape count,and the file type. Also displayed are the file's display attributes. You may click on any columnheader to short the columns by type. Left click on the check box to the left of each data filethat you wish to process in an analysis. Right click to check or uncheck all the files.
DatabaseDatabases consist of row and columns (also known as fields) of data. The records representthe individual data in any one row and field combination. Each field require a unique name inthe database.
Show Data Modifiers Menu: Data > Show Modifiers
The data modifiers window displays generic information and all the active modifiers for a file.
This display if for information content only. Changes to these modifiers must be performed inthe respective modifier's window.
Printing Menu: File > Print
Currently, printing is for the graphics canvas and charts only. Data and output log informationcan be copied and pasted into a spreadsheet, wordprocessor, or database program forprinting.
Save File Menu: File > Save
Shape Viewer saves files in a variety of formats depending on the data to be saved.
5

Data files are saved as database or text files. Graphics are saved as Windows® Metafiles, Bitmaps and JPEG files,
ArcView® shape files or Data Interchange Format (*.dxf) files.
The graphic canvas and charts can also be saved to the Windows® clipboard to be copiedand pasted into other applications, such as word processors.
To save a data file, first select the file as the active spreadsheet tab. Select "Save" or "SaveAs" from the main menu. Select "Spreadsheet" as the file type to save. You will be presentedwith a New Database dialog window. Select the fields you want to export and continue tosave the file.
Save the Work Space Menu: File > Save Work Space
If this menu item is clicked, then any currently opened shapes will be available for reopening atonce by clicking on the "open last work space" menu item. Only files that already have disk basedfile names will be saved and reopened. Shapes that are generated but not stored, such as homerange contours, will not be stored and retrieved.
Sort Data Menu: Data > Sort
Files may be sorted on any of the field variables. Sorting may be done on both single file andlinked files. To sort data select the fields in order of the sort. That is, the field selected first will besorted first and then the field selected second will be sorted second, etc.. If the check box next tothe field name is checked the data will be sorted in ascending order, if it is unchecked then thedata in that field will be sorted in descending order.
When linked databases are used it is usually necessary to either apply an index on the fields orperform a sort because linked databases will by default sort on the linked field. Therefore, if this isnot the normal order of the data, it is necessary to force the data to be retrieved in a more normalorder using a sort.
Graphics
To select what files/shapes to plot check the box next to the file/shape in the legend. If theshape is not checked, it will not be plotted in the graphics canvas. To change the colors of ashape outline left click on the desired color in the color bar. More color options can be foundby pressing the ">>" button to the right of the color bar.
The color selected will be identified by the "FG" letters (Foreground). Change the point styleby left clicking on one of the options on the "Point Styles" tab. The shapes will be filled if the"fill shape" box is check. On the "Line and Fill Styles" tab page, click on either the lines or fillstyles buttons provided.
Colors and Symbols Menu: Canvas > Colors and Symbols
This form is used to make changes to display graphics colors and styles. To make individualchanges to a shape's graphic styles quickly, use the built in functions on the Legend Tab.
6

Once all the desired shape styles has been selected click on the "Apply" button to make thechanges permanent. Changes will only be displayed on the canvas when the "Update" buttonis clicked. This is to prevent constant and often lengthy redrawing while changing manygraphic style options.
Files may also automatically have their color and line styles changed when each file is loadedby selecting the desired option from the "on new file" button
7

Data Filters
Stratify Data Menu: Data > Stratify
Stratification is used to separate a file into non-overlapping groups of equal value. Ifgroupings should or might contain overlapping members then use the Subset function.
There are 5 basic type of strata. The default is "null" or "no strata". If a file has strata and "nostrata" is selected then all strata will be removed. This is the same as closing all the stratafiles.
The remaining strata methods are:
By Record: Stratifies the data by record number. This is useful to look at sections of data that was previously sorted on a variable.
By Variable: Stratifies the data on a variable of your choice. If the variable is a date or time variable, it is better to use the Date or Time strata methods.
By Date/Time: Stratifies the data by date or time. The exact degree of strata width can be selected here as either by day, week, month, or year. Use the "Increment By" value to select the number of days, weeks, months or years in each strata. A date or time variable must be defined to use the date or time strata features. Use the Redefine Variables button to assign a field as date or time if one was not already assigned.
The increment is used determine the bin width of the strata. If no increment is desired, then strataare created so that each unique value in the selected field is a unique strata.
Each strata can be started at any initial value in the file. The unique field values are shown anddisplayed in a drop down box. If more than one file is selected then the initial values box willdisplay only those field values contained in all the selected files. If no value is selected then thefield is sorted and the strata is begun at the first value in the field.
Subset Data Menu: Data > Subset
Subsets on data are used to define possible overlapping subsets of data. If the subsets areto have unique members, then use the Stratify function instead.
To use the subsets functions on a file, the file must either be a database file, or have adatabase file associated with it (such as ESRI® shape files). If the file is a text file or othertype of shape list (such as MapInfo, or a DXF file), then save the shape as a database orshape file format and reopen the file.
Data subsets are actually a group of filters applied to the data. Subsets of a file are a list ofrelated filters that partitions the data as desired. Subsets can contain the same shapes indifferent result sets. Therefore, new shapes are created and stored for each subset fileresult. This can consume a lot of memory if filters are poorly written.
8

New subset filters are added by the "New" button, and each subset filter is accessed by thetabs at the bottom of the window displaying the current filter. To save or import a filter rightclick on the filter display memo.
You can use Filters on any GIS Layer to show only a subset of that layer's data. To accessthe Filters Window, select the Filters toolbar button or the Filters option from the popup menuaccessible by right clicking on the current map or map legend (image below).
Filter data is a method of limiting the records that are displayed and used. A filter is like aquery, but differs in complexity and how the data is retrieved from the database file. Filters,therefore, are typically limited to simple comparisons. Filters are applied to a single file. Tocreate new subsets of data use the Subset function.
Biotas provides a very simple and easy to use filter builder. Each file may only have one filterlist in use at any one time. Filters are built by first selecting a file. Then a field variable ischosen on which to create a comparison. A comparison operator is then selected for thisvariable.
Available comparison operators are: = equal to <> not equal to > greater than < less than >= greater than or equal to <= less than or equal to
Once a comparison operator is chosen, then a value from the chosen variable is selected.Biotas lists all available values from the chosen variable field so a valid filter may beconstructed. Clicking on the 'Add" button adds the filter to the filter list.
Complex, multi-comparison and multi-variable filters may be constructed by then selectingeither the 'AND' or 'OR' button. Then a second filter may be constructed that will further limitthe data to be used. The 'Undo Last' will progressively remove the added filters from thedisplayed list.
The filter will not be stored or used unless the 'Apply Filter' button is clicked. To turn off thefilter for a file (i.e. display and use all of the data) without clearing it, deselect the 'filter on'check box.
Subset and Filter Examples
A typical filter is built by defining a relationship between a field and a value in that field, such as:
Country="USA"
Additional operators my be included to further define the filter:
Country="USA" OR Country="UK"
Blank records do not appear unless explicitly included in the filter. For example:
Country="USA" OR Country IS NULL
9

Complex filters can use braces "( )" to order which parts of the filter are performed first. Filterelements within braces are performed first, then this result set is compared to the rest of thefilter outside the braces.
Country="USA" AND ( State="California" OR State="New York" )
Linking Files Menu: Data > Link
Disk based files can be linked by using a single parent to child link (called a one-to-one link)using the link form. This one-to-one linking method will work with dBASE, text and Excel files.
The link form is used as follows: 1. The parent database is either selected from a disk source or provided by
default by the software. 2. Either browse or type in the full path and name of the file you will link the
parent file to (Note: Microsoft Access tables can only be linked by using the Visual SQL Generator).
3. Once the parent and child tables are selected, click on one field form eachtable to act as the linking field. The fields do not have to have the same name but it is less confusing if you name the linking fields the same in each table.
4. Click on the Link button to create the link between the tables.
10

Data Analysis
Descriptive Statistics
The software comes with a small set of univariate statistical functions.
The available files that are currently opened will be displayed in the file list box. Selecting anyfile will bring up a list of the fields in that file. Check on any fields that should be analysed withthe descriptive statistics listed next to the file list box. To process the selected fields in thefiles check the box next to the file name and select the statistics you want to analyse. Youmust identify the fields to analyse uniquely in each file.
Right click on the output sheet for options for saving or copying the output results.
Only numeric fields can be analysed with descriptive statistics. Empty field values will beignored.
Spatial Association Menu: Analysis > Spatial Association
Spatial Association is a grid based test that compares the presence and absence of differentpoint patterns in each grid quadrat. There are two basic methods included in Biotas: pairwise and multivariate comparisons.
The pair wise tests are most useful for comparisons if there was a significant multivariatetest result. The pair wise test can also be used on their own, but caution should be paid to thefact that with many pairwise tests there is an increased change of either a negative orpositive association being "detected" by chance alone (a statistical Type I error).
Pairwise results are based on a Chi-squared test between all possible pairs of point patternsselected for comparisons. Yates correction factor is calculated to account for bias resultingfrom cases of low cell frequencies. Three association indicies are also calculated, the Ochiai,Dice, and Jaccard indicies. Each index has a range from 0 (no association) to 1 (maximumassociation). See Jabson and Vegelius (1981) or Ludwid and Reynolds (1988) for moreinformation on these and other association indicies.
The multivariate test used in Biotas is the one described by Schulter (1984). Schulter's testcan sometimes not detect an association even if one is present (a statistical Type II error) ifnegative associations and positive associations cancel each other out.
The covariation option compares quadrat densities rather than simple presence andabsence. The covariation option is under development and not yet available.
Density Binning Menu: Analysis > Density Binning
Density binning is useful for visually summarizing density data overan area. It is a grid based spatial quantitizer that converts pointpattern into two dimensional density bins. The number of points thatfall within each quadrat are summed and the quadrat color isadjusted to visually indicate the quadrat's point density. The celldensity is also entered into the shapes data record in the field"CellValue" which other tests can access for additional analysis.
11

Spatial Analysis
Point Pattern Analysis Basics
Point pattern analysis includes quadrat and distance analysis routines. The type of analysis youperform will depend on your data and analysis needs.
Point pattern analysis can be categorized as one of two basic types:
1. Measures of dispersion compare the location of points relative to a study area.
2. Measures of arrangement compare the location of points relative to each other.
CSR : Complete Spatial Randomness
Complete spatial randomness (CSR) test are designed to ascertain if the point pattern beingstudied represents a random or non-random spatial process. It is often desirable to test if apoint pattern is random before carrying out more complicated analysis.
Randomness of a spatial process may vary depending on the spatial scale being studied.That is, a point pattern may be random at a local scale, but non-random at a landscape ortemporal scale. Varying the scale of the analysis can therefore provide much informationabout the dynamics of the point process both in regards to the landscape and with the pointpattern itself.
Bitoas has several CSR tests. Of these tests, there are two basic types:
Two basic types of CSR tests:1. Quadrat (e.g. spatial dispersion) based tests
2. Distance (e.g. nearest neighbor) based comparisons
Quadrats can be either artificial, such as a regular grid or random quadrats placed over astudy area, or they can represent natural boundaries already present in the landscape. Anexample of the later includes habitat analysis.
CSR - Contiguous Quadrats Menu: Analysis > Complete Spatial Randomness > Spatial Dispersion > Contiguous
Quadrats
This is a complete spatial randomness test using contiguous quadrats. Contiguous quadratsare constructed in a regular grid over the study site. The original placement of the grid can beadjusted as desired, as well as the grid cell size, grid cell type, and other features. SeeWorking With Grids for more information.
12

Three contiguous quadrat tests options are available: Poisson, Chi-squared test Variance/Mean T-Test Negative Binomial test
The Poisson and Variance/Mean ratio test for a random Poisson distribution, while theNegative Binomial tests for a clumped distribution that follows a negative binomialdistribution. Whatever model is selected, it is important to remember that even if an observedpoint patter follows a specific theoretical distribution, one should be cautious in correlatingwhat caused the resulting point patterns distribution (Ludwig and Reynolds 1988).
Because the Poisson test is a Chi-squared statistic, the bias of the test may be affected whenquadrat frequencies for any cell count falls below 5. You can adjust minimum quadrat countused in the test by selecting the "Group Cell Frequencies Below" value and checking thecheck box to process this value. You can also elect to process the raw data and thenmanually post combine frequency counts less than 5.
To combine result frequencies:1. Click and drag one frequency value over another in the results grid (see
image below). 2. Then click on the recalculate button.
CSR - Scattered Quadrats Menu: Analysis > Complete Spatial Randomness > Spatial Dispersion > Scattered
Quadrats
This is a complete spatial randomness test using scattered quadrats.
Scattered quadrat analysis consists of placeing circular quadrats, usually at random, over adefined study area and then testing if the density distribution of points that occur in thesequadrats fallows an expected Poisson distribution.
The scattered quadrat method suffers from the fact that if quadrats overlap, points can beincluded in more than one quadrat, making the assumption of independence invalid. Thisbecomes more of a problem as the number or the size of the quadrats increases relative tothe size of the study area. The use of contiguous quadrats removes this limitation (but doesnot remove other limitations of quadrat analysis).
To overcome this limitation, as well as to add additional test oportunities, scattered quadratsin Biotas can be constructed in non-random locations based on a point file of your choice.The scattered quadrat centers will be located on the points in this file you select. This alsoprovides for direct analysis of point densities around specific known points (e.g. densities ofdisease or genetic abnormalities near a point source). Since selected point sources are not
13

random, you can use the permutation procedure to construct a significance level associatedwith the densities contained within the quadrats near your selected point centers.
Quadrat Variance Menu: Analysis > Complete Spatial Randomness > Spatial Dispersion > Quadrat
Variance
Quadrat variance tests are appropriate for conditions where the point pattern underinvestigation is continuous over a study area. One can then use either a belt transect dividedinto quadrats or a blocks. Transect quadrats or blocks can then be combined into varioussizes to quantitize the distribution of the point pattern between differing quadrat sizes.
Biotas creates its own "belts" internally using a grid defined by the user. Each row of the gridis a "belt", and specific, random or all rows can be included in the analysis. All that is neededto analyse data using a quadrat method, therefore, is a data file with a point pattern.
Biotas uses three quadrat variance techniques:1. Paired Quadrat Variance (PQV)
Blocks of fixed size are paired at a given distance. Since block size is constant, only the distance affect the variance estimate. Variances are calculated for all possible pairs of quadrats at a given distance.
2. Two Term Local Quadrat Variance (TTLQV) Blocks are increased sequentially in size by adding single quadrats to each block for each variance estimate calculated. Therefore, both distance and size are included in the variance estimate.
3. Randomly Paired Quadrat Variance (RPQV)Variation of the PQV, but quadrat pairs are selected at random from all possible quadrat pairs at a given distance. Once quadrats are selected for a pair comparison at a given distance, they are not used again to estimate a variance at the current given distance or any other distance.Therefore, the RPQV method is the one of the three that maintains independence between variances and statistical probabilities can be computed.
Spatial Autocorrelation Menu: Analysis > Complete Spatial Randomness > Spatial Dispersion > Spatial
Autocorrelation Quadrat based Complete Spatial Randomness may find that a point pattern is randomlydistributed, but that may only tell part of what may be happening with the point pattern. Thepoint pattern may be randomly distributed at a specified quadrat size, but that same pointpattern may still exhibit spatial correlation between neighboring grid quadrats (Figure 1).Even if points are non-randomly distributed, a spatial correlation test can determine if thereare any secondary spatial features associated with the data.
14

Figure 1. Different point patterns that producethe same quadrat frequency values. However,the spatial association between neighboringquadrats is still quite different at the specifiedquadrat size.
Biotas uses Moran's I statistic to test for spatial autocorrelation using a quadrat basedanalysis of either 4 (square) or six (hexagon) sided grid cells. If adjacent cells have similarpoint density values compared to non-adjacent cells, then spatial correlation would be said toexist at the tested quadrat size level.
There are three ways to compare adjacent grid cells if a square cell is used. These are inorder from left to right in the below graphic, and borrowing from the vocabulary of chess:Queens Case, Bishops Case, and Rooks Case (Figure 2).
Figure 2. Adjacent quadrat types.
The Queens case has a biased diagonal value for square grid cells due to the fact that thegrid cell centers of a square on the diagonal are not the same distance as cells in thehorizontal and vertical direction. It is recommended to add a weighting factor to adjacentdiagonal cells under this case, but you can elect to not add the diagonal weight to theQueens case by unchecking the "Weight Queen's Case Diagonals" box on the Modifiers tab.
Checking the "Compensate For Edge Effects" will only have an affect if you have defined acontainment polygon file in the "Format Grid" window.
Selected files will be analysed separately unless the "Group Files (Single Grid)" on theModifiers tab is checked.
15

Home Range
About Home RangesA home range can be simply defined as "the area used by an animal in the course of itsactivities". However, while such a simple definition seems elegant and attractive, it is difficultto quantify in practice. The choice of a method used to delineate what is a home range, or even a study site,boundary is too broad a topic to be covered here. You are instead encouraged to do athrough review of the current literature on the subject.
The different home range methods are easy to apply and compare in Biotas. Home rangeestimators are not statistical tests, and it is completely valid, and recommended, to choose amethod only after such comparisons. Contrary to popular myth, the more "modern" orcomplex analyses are not always the best description of land use. The final selection should,therefore, be based on your independent research and your study's unique parameters andobjectives.
Data Area Curves Menu: Analysis > Home Range
Data area curves are used to determine the change in the area of a home range contour asdata is collected. Typically, the point at which the contour area is observed to not increaseappreciable with additional data is the sample sized generally expected to determine anindividual animals home range.
Results are plotted in the chart tab. Data area contours are mostly used for Minimum ConvexPolygon home range estimators, but it has utility for any of the estimators provided withBiotas.
Plotting Data Menu: Data
Plotting options for home range estimators are used to determine the types of graphicaloutput desired for a calculation. Because graphics use vectors to plot home ranges, somehome range methods require an additional estimate from a grid to plot a smooth contours .More grid cells means more fine details and often smoother contours, but increasescalculation time.
Plotting options vary between estimators but include any of the following: Confidence Interval The contour percent utilization. Must be integer values,
separated by commas.
Extra Grid Padding Additional quadrats sometimes necessary to plot larger confidence intervals.
Grid Size Alternative method of determining the number of cells in a grid used for plotting
Quadrat Edge Length The length along one grid cell side.
16

Confidence Intervals
The Ellipse, Harmonic Mean and Kernel estimators allow for plotting multiple contours atonce. If multiple contours are desired, the contour percentages (without any % symbol) areentered and separated by a comma (e.g. 95,75,50). These values must be integers only.
For large contour percentages (85%-99%) with the Harmonic Mean and Kernel estimators, itis possible for the calculated contour extent to reach beyond the grid limits. If this occurs, thecontour will not be plotted. Most contours should plot with a extra grid padding of 10% of therow grid count. Biotas does not automatically alter grid size or count to compensate forunplotted contours.
There may be various reasons why a contour failure may have occurred, and they should beinvestigated rather than just corrected for (maybe incorrectly) by software. Potential problemsmay exist in the data set itself, poorly chosen methods or parameters, software problems,etc.. And initial attempt to correct this problem is to moderately increase the number of extragrid cells used to perform grid calculations. Continue to other tests of the data if thiscontinues to fail.
Overview of Home Range Methods
Biotas calculates the most common home range, or spatially explicit estimators fordelineating data points.
Home range estimators in Biotas: Minimum Convex Polygon Frequency Ellipse Harmonic Mean Fixed and Adaptive Kernel Dirichlet Tessellations Circular Buffers
Select the "output log" option on the Modify tab to output area, perimeter, and polygonvertices. Polygon vertex output will include both "Total Area" and "Shape Area" values. Totalarea is the sum of all shape areas if there are multiple polygons in a result set (such as withKernel and Harmonic Mean). If there is only one polygon, total area = shape area.
Each home range method has certain assumptions about the underlying data. Theseassumptions should be checked before using any specific Estimator. There are numerouspapers and discussions on the merits of each estimator which should be exhaustively studiedto select the proper estimator for any particular study. Caution should also be noted, that the more recent estimators, such as the Adaptive Kernel,might provide visually intriguing estimates but may not include the most meaningful oraccurate biological information. Home range estimators are a tool to investigate biologicalphenomenon, not an end in themselves.
Buffer Points Menu: Analysis > Home Range > Create Buffer
Buffering creates a contour that includes all of the area within a specified distance from apoint or line.
17

To create a buffer :1. Select the files to be buffered. 2. Select the buffer radius and the buffer count. If buffer count is greater than
1, buffers radii will increment by your buffer radius. That is, if radius = 100 and buffer count = 3, then buffers of radius 100, 200 and 300 will be created.
3. Select your color options. You can select to have the buffer filled, or not. If the buffer count is greater than 1, you can also create a gradation of colorsbetween buffers by selecting from the start color and end color option buttons.
Buffering can take a long time with large data sets. Buffering is slower with smaller bufferradii.
Minimum Convex Polygon Menu: Analysis > Home Range
The Minium Convex Polygon (MCP) is the "classical" method of home range estimation. TheMCP is a non-statistical method in regards that it has no assumptions about the distributionof the data. However, the full 100% MCP estimator is sample size sensitive. Sample sizeeffects can be investigated by calculating data area curves.
Biotas provides the following MCP methods when using less than 100% of the data points.
Stationary Arithmetic Mean Stationary Arithmetic Median Stationary Harmonic Mean Stationary Harmonic Mean Areal Moment Moving Arithmetic Mean Moving Arithmetic Median Moving Harmonic Mean Moving Harmonic Mean Areal Moment Cluster Grouping
Most methods, except for cluster grouping, will usually give similar results for most datapercentages >75%.
Confidence Ellipse Menu: Analysis > Home Range
Frequency ellipses are a parametric statistical technique of estimating home range based onthe assumption that the data is bivariate normally distributed. If data is distributed in thisfashion, then the frequency ellipse is a good technique to use for home range estimation. Ifmultiple contours are desired, the contour percentages (without any % symbol) are enteredand separated by a comma (e.g. 95,75,50).
18

Biotas has three different distributions used todetermine the confidence ellipse: Chi Squared Adjusted Chi Squared F Distribution
The F distribution should be used if one desires a probability ellipse that the next pointsampled will fall within a specific area. Descriptive home range ellipses should use theAdjusted Chi-Squared.
Harmonic Mean Menu: Analysis > Home Range
The harmonic mean calculates home range contours by using the reciprocal deviations (i.e.linear distances) from grid points to data points. Interpolation of these values along a gridcreates a smooth contour that can be plotted and used to demarcate a home range.However, the Harmonic Mean contour is grid size dependent. This means that the same datawill give different results and areas depending on the grid size selected.
The nature of the grid size harmonic mean area output is well documented and can be easilyverified youself by using different grid settings. However, how this affects biologicalinterpretation of home range and land use is far from clear. Since the definition of a homerange is far from perfect itself, having a method that produces varying results for the samecontour percentage may be of considerable value.
Harmonic mean contours in Biotas can include data of most any integer percentage above10%.
Kernel Menu: Analysis > Home Range
The kernel estimator includes both the fixed and adaptive kernel. There is a wealth ofliterature on kernel density estimation and an examination of this literature is recommended.
The window width parameter (simply, how "wide" is the kernel at any point) for either thefixed or adaptive kernel may be estimated by three methods:
User defined Special Functions (ad hoc) Least Squares Cross Validation (LSCV)
The user is expected to be familiar with these three methods as a detailed description forthem is beyond the scope of this publication. For reference to information about theseparameters estimation methods the user is directed to Silverman, 1990.
The adaptive kernel comes with an additional sensitivity parameter accessible by clicking onthe ">>" button. See appropriate kernel literature for what value to use (such as Silverman, ).The default is 0.5.
Contours can include data of most any integer percentage above 10%. If the data points arenot continuous, the Least Squares Cross Validation may fail. In this case, add a randomdisplacement to the data by checking the "Random" check box and entering a range for therandom displacement.
19

Voronoi1 Polygons Menu: Analysis > Home Range
Voronoi polygons are a spatially exhaustive description of a point pattern. Each "tile" in aVoronoi polygon represents the unique space around each point in the point pattern that isnearer to that point than to any other point. This polygon technique therefore is the onlytechnique that assigns an area of use for each point as well as for all points in the pointpattern (Wray et.al. 1992). This point specific area can provide additional information forhabitat, or landscape use analysis. However, in any addition analysis, it should be noted thatarea assigned to each point is correlated to the area of its neighbors (Pielou 1969).
Biotas also provides for the calculation of the Delauny Triangulation of points in the pointpattern. The calculation of the Voronoi polygons and Delauny Triangulations are often relatedand directly tied (one must be done to create the other) in many other software programs, butBiotas uses separate computational methods to arrive at each pattern. Despite thiscomputational difference used by Biotas, there is a simple mathematical relationship betweenthe two polygon techniques: the Voronoi Polygons can be constructed from the midpointperpendicular bisectors of the Delauny Triangulations between points. DelaunyTriangulations have very different geometric features than the Voronoi polygons, and are onlyincluded here for geometric comparisons.
As pointed out by Wray et.al., the Voronoi polygon technique requires a boundary area tolimit the most outwardly tiles in the pattern. This is done in Biotas with the "Frame RelativeSize ±" value. The boundary limit is a ± percentage of the data range.
To make us of Voronoi polygons, the tiles that include an edge on the boundary area areoften deleted. The boundary tiles and their area are based on an arbitrary boundary size andare therefore themselves of arbitrary area. The size of the boundary is only of minorsignificance when electing to exclude boundary tiles, since few tiles will close at largerboundary sizes. Therefore, the boundary size can be adjusted to any amount desired.
You can further limit the tiles used in the final output by either checking the "No Edge Tiles"check box, or assigning a data percent use value less than 100%. The later method providesa means of creating the equivalent of Voronoi polygon contours. Note that if you assign botha percent use value less than 100% and check the "No Edge Tiles" box, then the datapercent will be removed first, then the edge tile, with the result that the total removed will maynot directly relate to the requested percent to remove.
If you are not interested in the separate tile areas, you can check on the "Outline Only" checkbox. This will create a single contour from all adjacent quadrats similar to other home rangemethods.
1. First described by Dirichlet in 1850, and later rediscovered by others, this geometric pattern ismore properly referred to as Dirichlet Domains after the original founder. But due to its repeatedrediscovery, this pattern has many synonymous names including, among the most commonlybeing used, Voronoi Polygons or Thiessen Polygons. One name or another will be more incommon usage depending on your field of work. Although the nomenclature choice to use Voronoirather than Dirichlet is technically incorrect, Voronoi is the name used for these domains in Biotasonly to greater clarify the distinction from Delauny Triangulations.
20

Habitat UseHabitat use is the examination of how a point pattern utilizes polygon features whichrepresent different habitats, or land use characteristics on a local or landscape level.
Habitat use tests can be categorized as a special measure of dispersion test where thequadrats used for the comparison are defined as the habitat polygons in a coverage filerather than by a grid.
There are three recognized habitat analysis designs Type l Type ll and Type lll. These vary intheir assumptions and appropriate habitat use calculation methods.
Habitat Analysis - Type I Design
Criteria for a Type I habitat analysis include: Individual animals are not recognized. This means measurements are
recorded or analysed on the population level Usage and availability is measured as a single collection of values for the
entire study area. Individual areas of use are not considered If there is only one observation per individual, the design becomes a Type I
design
A Type I design is the easiest to implement as measurements of use can range from directcounts, usage counts of auxiliary index variables in habitat types (droppings, footprints, etc.),aerial surveys, locational methods (GPS, radio telemetry, etc.), and so on. Neu's is a example ofa habitat analysis test for at Type I design.
Habitat Analysis - Type II Design
Criteria for a Type II habitat analysis include: Individuals are recognised and used. Usage is measured at a level of used by each individual (such as use in a
home range). Availability is measured either as a single collection of values for the entire
study area or within individual areas of use (e.g. a home range). If there is only one observation per individual, the design becomes a Type ldesign.
A Type II design is mostly used with trapping, radio tracking or other data that records habitatuse of individual animals. Johnson's and Quade's tests are examples of habitat analysis testsfor at Type II design.
21

Habitat Analysis - Type III Design
Criteria for a Type III habitat analysis include: Individuals are recognized and used. Habitat use between individuals must be delineated by the data. Allows for simultaneous analysis of individual and population level
analysis.
A Type III design is mostly used with trapping, radio tracking or other data that recordshabitat use of individual animals. Compositional analysis is an example of a habitat analysistest for at Type III design.
Compositional Analysis Menu: Analysis > Habitat Use > Compositional Analysis
Compositional analysis is applied here as a multivariate technique for habitat use analysis,and terminology herein is relevant to this field.
For other habitat use methods see or Johnson's methods of habitat use analysis.
Compositional Analysis - Data Format Options
In Biotas, compositional analysis comparisons can take three forms:1. Locations to Home Range
One or more animal locations file (must be a point file) are compared to local available habitat files (must be polygon coverages).
2. Home Ranges to Study Site One or more local habitat files (must be a polygon coverage) are compared to a single regional study site coverage (must be a polygon coverage).
3. Locations to Study Site One or more animal locations files (must be a point file) are compared to a single regional study site coverage (must be a polygon coverage).
Compositional Analysis - Home Range Level
Home range level analysis consists of comparing data point habitat occurrences to theavailable habitats within a home range boundary. If you want to compare data pointoccurrence, or home range composition, to the available habitats in a study site, see thestudy site level analysis. The study site option is not used in this analysis level, and will begrayed out.
22

1. Open the compositional analysis window. 2. Select the comparison method: "Locations to Home Range". 3. Check the files to be use in the analysis. 4. From the drop down list box select the home range file (must be a polygon
coverage) each point file is associated with. 5. From the drop down list box select the data field that identifies the habitat
types in the selected home range file. The habitat types within the home range should be calculated before using compositional analysis with the shape overlap function.
6. Click on the calculate button
Once the calculations are complete, a results window will be displayed.
Compositional Analysis - Study Site LevelStudy site level analysis consists of either comparing data point habitat occurrences to theavailable habitats within a study site, or comparing the habitats in a home range boundary tothe habitat composition in a study site. If you want to compare data point habitat occurrencesto a home range, see the home range level analysis.
1. Open the compositional analysis window. 2. Select the comparison method: 1) "Home Ranges to Study Site" or 2)
"Locations to Study Site". 3. Check either the 1) home range or 2) location files to be use in the
analysis. 4. If you are performing a "Home Ranges to Study Site" analysis, from the
drop down list box select the data field that identifies the habitat types in the selected home range file. The habitat types within the home range should be calculated before using compositional analysis with the shape overlap function.
5. Select the study site file. 6. From the drop down list box select the data field that identifies the habitat
types in the selected study site file. 7. Click on the calculate button
Once the calculations are complete, a results window will be displayed.
Neu's Method Menu: Analysis > Habitat Use > Neu's Method
Neu's method is a Type l habitat analysis method.
Biotas only currently calculates Neu's method from point data files. Locations of animals orother events related to habitat use must be in a point file format. The habitat layers must bein a polygon GIS format. Biotas will determine for each point the habitat polygon it is in andcalculate the frequencies of habitat use in each habitat type.
23

To test data files for habitat selection using Neu's method do the following:1. Open your data point files and your habitat file. Only one habitat file can be
processed at a time.2. Open the Neu habitat calculation window.3. Select the point file(s) to process.4. Select the habitat file to process.5. Select the field in the habitat file that describes the habitat each polygon represents.
This field will be used to group polygons into habitat types.
Steps 1-5 must be performed to enable the calculate button. Once enabled, click on thecalculate button. After calculations are complete, a habitat use window will be displayed showing habitat useproportions, confidence intervals for habitat use, and results of a Chi-squared test.
Neu's Result Fields Menu: Analysis > Habitat Use > Neu's Method
The habitat proportions window displayed after completion of a Neu's habitat analysis has sixfields of data results displayed. These are reviewed here.
Neu test results fields include: Habitat
The habitat types defined in the selected habitat file, grouped using the selected habitat field.
Observed CountThe number of data locations that were found in each of the the uniquehabitat types.
Habitat ProportionThe proportion of each habitat type in the selected habitat file.
Expected UseThe number of observations expected to be observed in each habitat type.
Selection RatioThe ratio of observed / expected counts.
Standardized (Selection) Ratio A standardization of the selection ratio. This allows for comparisons
between studies. The standardized selection ratio sums to 1 and can be used as a relative index of use between habitat types. If, for example, the standardized selection ratio is 0.25 for one habitat and 0.75 for another, it can be said there is a 3 fold difference in selection between the two habitat types.
Neu's Habitat Proportions Menu: Analysis > Habitat Use > Neu's Method
The habitat proportions window is displayed after completion of a Neu's habitat analysis. Thewindow is broken into 2 tabs (Figure 1).
24

Figure 1. Neu's results window tabs.
The first tab contains the numeric results of the analysis. The top of the first tabs panel has atable showing the proportions of observed and expected use for each habitat. The table hasseveral columns that relate to data proportions and interpretation. Biotas calculates a Chi-squared statistic testing the null hypothesis (Ho) that observed use does not differ fromexpected use. The bottom half of the first tab has a text window displaying this Chi-squaredtest results. By varying the available data (see below) multiple Chi-squared tests can bedisplayed in this text window.
The second tab contains a graphic showing the confidence interval bars for observed use ineach habitat and the calculated expected use values (shown as red squares). Expectedvalues that fall outside of the observed use confidence bars indicate departure which habitatshave observed use that differs from expected use if the Chi-squared test result rejected thenull hypothesis.
Further analysis can be performed depending on the nature of the data. The followingprovides some examples:
If one or more habitats should not be included in the analysis, uncheck the check box foreach habitat(s) and click on the recalculate button. This will remove the habitat fromconsideration for both the Chi-squared test and the confidence intervals.
If one or more habitats have expected values less than 5, the Chi-squared test can bebiased. To remove this bias either do as in (1) above, or click on one habitat and drag it intoanother habitat to combine habitats until all expected values in each habitat is greater than 5(Figure 2). Click on the recalculate button to re-test the new proportions.
Figure 2. Drag and drop to combine habitatproportions.
25

Movement Analysis
Movements Menu: Analysis > Movements
Movement analysis finds the distances, angular change in direction, and velocities betweenlocations for a total of N - 1 points (N = the total number of points in the data file).
The movement data summaries then can be used to test if the observed movement had adirectional component using one of three statistical tests. These include two circularstatistics, Rayleigh's test and Rao's spacing test, and one linear statistic computed as a Runstest.
Circular Statistics: The raw angular change in direction movement data is non-linear datasince it represents directional degree values on a range from 0 to 360. The Rayleigh's andRao's test are both circular statistic tests that account for this nonlinear data format. TheRayleigh's test is more well known since it's probability values are more easy to findpublished or estimated with a Chi-squared value. However, recent improved estimates forthe Rao probability values has made this test more accessible for computer calculations.
While Rayleigh's and Rao test are both circular statistics, they examine very differentcomponents of the data. This difference should be known so you can can more accuratelyselect the appropriate test for your data.
Rayleigh's test is used to examine the significance of the mean direction in the movementdata. The Rao test, in contrast, is based on the assumption is that if the data is uniform,then successive observations should be evenly spaced around the 360 degree arc.Departure from this even distribution indicates clumping of the data for the Rao test.Clearly, the Rao test is less powerful than the Rayleigh's test if the data had a meandirection. However, the Rao test is more powerful than the Rayleigh's test if the data hasno single directional mean component, but still has patches of local clumping. The Raotest is then more appropriate if significantly different mean direction of movements occurover time.
Biotas uses a Chi-squared approximation test for the Rayleigh probability value whichgives very accurate results for sample sizes greater than 30. With sample sizes less than30 the Chi-squared approximation will give good estimated probability values.
Biotas probability estimate for the Rao test are accurate within a sample size range up to1000. For more reading on circular statistics, it is recommended to review an appropriatebook on the subject.
Linear Statistics: While the raw movement data is a circular variable, the change indirection between movements can be reduced to a binomial variant if only the change indirection is considered as "left turn" versus "right turn". A Runs Test of randomness forthe change in direction moved may then be calculated. Movement analysis also providesfor a moving average calculation, in case it is determined the binomial variant has aperiodicity, for any user defined length (M), for movement values. The Runs test is mostpowerful when considering movements within a confined area, such as a home range, orbody of water (lake, estuary, etc.). This is most useful for ascertaining circular movementpaths that occur around the periphery of such a containing space over time.
Moving average values are provided for all inter-location values, but only represent therequested average length when M > t < N - M, for t = 1 to N. To use movement analysisfor velocities, a Date or Time variable must be set for the file. Use the "redefine variableoption" on the Modifiers tab to add or change a date or time variable associated with a file.
26

Regression and Correlation
Regression Menu: Analysis > Regression
Biotas performs both simple regression and polynomial regression on on independentvariable and one dependent variable. The independent and dependent variables areassigned by clicking on the "Variable" button and clicking on one data field in each list thatcorresponds to the independent variable or dependent variable list. This variable assignmentmust be done separately for each file being processed.
Linear regression is a well covered topic in many statistic books, so it will not be covered indepth here. You are suggested to review this topic for limitations and expectations oflinear regression.
Biotas performs only a univariate linear least squares regression on one dependentvariable. The output shows the linear regression equation, slope, and correlationcoefficient (R) values for the regression. Two statistical tests are also included: thesignificance of the slope (F Test) and if the intercept differs from zero (T-Test).
The correlation coefficient R ranges from -1 to 1. A value near -1 means a strongnegative linear association, while a value near +1 means a strong positive linearrelationship. A value near 0 means no linear relationship exists. In contrast, thecoefficient of determination R2 (i.e. R Squared) equals the proportion of variability inthe dependent variable explained by the linear relationship.
Polynomial regression creates a best fitting XN polynomial equation that is the best fittingcurve through the bivariate data. The polynomial equation takes the format of:
f(x) = C + X - X2 + X3 - X4... XN ...etc.
The degree N (i.e. how many X factors raised to a power N) of the polynomial function isdetermined the numeric spin button window next to the polynomial regression option. "C"is a constant value. Unlike the linear regression test, there is no statistic fixed to the non-linear regression and is a purely descriptive function. The "Scale Values To Minimum"option will rescale the equation and the output chart so that the minimum value = the datasets minimum value, else zero will be assumed to represent the minimum.
Temporal Autocorrelation
Temporal autocorrelation in Biotas uses the time series autocorrelation function (ACF) to testthe univariate temporal correlation of variables. The ACF test the randomness of residualswith respect to the following function:
Yt = Et + C * Et - 1 + R
The function depicts a value "Y" at time "t" equal to the expected value "E" at time "t" plus theexpected value at "t - 1" multiplied by a fixed constant "C" plus a random amount of whitenoise "R". Therefore, the events at time t and t + 1 will be correlated to a degree dependingon the magnitude and sign of C.
If the series under consideration only consists of white noise then the series is purely randomand no time series effect exists. To test for this, on can examine the expected number of "up"and "down" turns in the series as a
27

Runs Test. In large sample size from a purely random series the number of "up" or "down"turns in the series should fall within the range 2n/3 ± 1.96(8n/45)½. Anything outside thisrange would indicate a non-random series component.
28

Sampling
Random Sampling Menu: Analysis > Random Sample
You can randomly sub-sample your data in Biotas using both a random sample and arandom sample method. With either a simple or stratified random sample you can elect tosample either a specific number of items or a percentage of total items in the file. You mayalso randomly sample with or without replacement. Sampling with replacement has betterdefined statistical properties, but if your sample size is small you may repeated sample thesame item so you will not have a total number of unique sampled items. The reasons forrandomly sampling data will dictate which method you select.
Simple Random Sampling: This sampling method randomly samples items regardless ofany specific spatial or data features assigned to each item. This is the simplest type ofsampling method. If your data represents a homogeneous population the simple randomsampling is the best choice since it will minimize the sampling variance and error.However, if items in your data have well defined strata that can affect the representationitems in your sample with respect to that strata, then you should consider performing astratified random sample.
Stratified Random Sampling: This sampling method is intended to be used when data haswell defined strata. That is, if you use a simple random sample on data that has welldefined strata, then sampled items from some rare strata may be under represented inthe total sample.
For example, let's assume you have a point file that represents trees on a landscape. Treedistribution may be related to soil types and you want to sample an equal number of treesfrom each soil type. You have already used a soil GIS layer in Biotas () to determine what soiltype is associated with each tree and placed this soil type information in a new field called"soil type" into your tree file. Since you wish to sample trees so that an equal number of treesare present in the sample from each soil type, you would select the field "soil type" in yourtree file as the stratification field, and assign an equal percentage to each value in this field.
29

Computer Aided Design
CAD (Computer Aided Design) functions are methods to change the location and shape of objectson the canvas. All shapes visible (Points, Lines, and Polygons) may be moved or altered.
Add Shape Menu: Canvas > Add Shape
Section not completed.
Adjust Lines
Lines and polygons consist of one or more line segments. Each line segment begins andstarts at a node point. A line or polygon shape can be altered by changing the location of anyof its nodes. The shape's color or shape styles can also be changed.
To move a node of a line: 1. Select the Pick Tool from the toolbar. 2. Place the cursor over the line that is to be altered and click on the line. The
line should be highlighted and the nodes are made visible. 3. To move a node, place the cursor over the node. If the cursor is positioned
correctly over a point shape, the cursor will change and a "+" sign will appear near the cursor indicating that the move cursor is active for that point.
4. At this point press and hold down the left mouse button over the node. Then while holding the mouse button down, move the mouse and node point to the new location.
5. Releasing the mouse button will put the node point in its new location.
Adjust Points
Point shapes can only be altered by moving their location, or changing their color or shapestyles.
To move a point shape: 1. Select the Pick Tool from the toolbar. 2. Place the cursor over the point to move. If the cursor is positioned correctly
over a point shape, the cursor will change and a "+" sign will appear near the cursor indicating that the move cursor is active for that point.
3. Press and hold down the left mouse button 4. While holding the mouse button down, move the mouse and point to the
new location. 5. Releasing the mouse button will put the point in its new location. If the point
shape is associated with at data file, the corresponding spreadsheet data values for the location will also be updated.
30

Adjust Polygons
Lines and polygons consist of one or more line segments. Each line segment begins andstarts at a node point. A line or polygon shape can be altered by changing the location of anyof its nodes. The shape's colors and line styles can also be changed.
To move a node of a polygon:1. Select the Pick Tool from the toolbar. 2. Place the cursor over the polygon that is to be altered and left click inside
the polygon. The polygon should be highlighted and the nodes are made visible.
3. To move a node, place the cursor over the node. If the cursor is positionedcorrectly over a point shape, the cursor will change and a "+" sign will appear near the cursor indicating that the move cursor is active for that point.
4. At this point press and hold down the left mouse button over the node. 5. While holding the mouse button down, move the mouse and node point to
the new location. 6. Releasing the mouse button will put the node point in its new location.
If you press and hold down the left mouse button while the pointer is within the polygon, youcan drag the entire shape to another location on the canvas.
Click outside the polygon to deselect it
Altering Shapes Menu: Canvas > Edit Shape
Points, lines and polygons may be changed by using the CAD Pick Tool to alter shapes.
Before a shape can be adjusted it must be selected.
To select a shape and alter it:1. First select the CAD Pick tool from the toolbar. 2. The Canvas cursor should change to correspond to the toolbar icon. 3. Click on the shape to be adjusted. You must click inside a polygon to
select it.4. Points and lines must be clicked near to be selected. You do not have to
select the shape on the Legend. The shape you want will be inferred by the program.
5. If the shap can not be selected, right click on the item in the legend and select "Order > Bring To Front" from the popup window.
31

Charts and Graphs
You can create Charts using any GIS Layer asa data source. Access the Charts Window,select the Charts Toolbar Button or the Chartsoption from the popup menu accessible by rightclicking on the current map or map legend.
The charts window has to panels that displaythe list of files you can chart and the fields foreach file. When you select a file to chart, a listof that files fields are displayed fro you to selectfrom to chart. Charts only function for numericfields (decimal, integer) or date fields. If a fieldis listed as "Text" but you know it contains onlynumeric data, then you can also chart this field.
To chart data in a file, you must first select(check on) the file you wish to chart from, thenselect (check on) the fields in that file you wishto chart (Figure 1).
Figure 1. To create a chart, you must select both thefile to chart and the field(s) to chart.
If a file is not checked on, no selected fields will be charted. The chart that is created for allselected files will correspond to the chart type button depressed (Figure 2).
Figure 2. Select chart type to chart. For example, a Linechart is selected in this Figure.
Charts features can be edited by using appropriate the chart editors. Each editor is availableeither by right clicking on the chart and selecting from the popup list, or by double clicking onthe chart item for selected chart features (i.e. axis, legend or data).
The chart data editor (Figure 3) allows you to make changes to the currently selected dataset. You can change the data's color in the chart, the type of chart used to display the data,as well as the data itself. The Series Order is the front to back order of the data relative toother data in the chart. You can also show label flags for each data item in the chart byselecting the checking the Show Flags check box.
32

Figure 3. Chart data editor window is used to edit datadisplay properties.
The chart axis editor (not shown) allows you to set features for the horizontal or vertical axis.You can set the axis caption, increment, format, etc.
33

Geographical Information (GIS)
Identify Data Menu: Canvas > Identify Shape
Select the Identify Data toolbar button. Left click on any point shape in the canvas. The dataassociated with this point will be displayed.
Plotting Data Menu: Data
Plotting options for home range estimators are used to determine the types of graphicaloutput desired for a calculation. Because graphics use vectors to plot home ranges, somehome range methods require an additional estimate from a grid to plot a smooth contours .More grid cells means more fine details and often smoother contours, but increasescalculation time.
Possible estimator plotting options can include: Confidence Interval The contour percent utilization. Must be integer values, separated by commas.
Quadrat Edge Length The length along one grid cell side.
Extra Grid Padding Additional quadrats sometimes necessary to plot larger confidence intervals.
Grid Size Alternative method of determining the number of cells in a grid used for plotting
Zooming Menu: Canvas > Zoom In / Out
Zooming allows for enlarging parts of the graphic canvas to see finer detail in an area. Tozoom an are, select the zoom tool. Click on the graphic canvas and while depressing the leftmouse button, drag the mouse to create a boundary definition. The canvas will enlarge thevisible area to this defined boundary. Zooming does not function with just a mouse click likesome other programs. To zoom out, either click the zoom out button or right click the graphiccanvas and select zoom out. Zooming out will return to the last zoom view. To return thenormal view, click the default view toolbar button.
Finding Distances Menu: Canvas > Distance
To find linear distances for objects on the canvas, select the distance tool. Dragging themouse over the canvas between two points, after left clicking, will give the linear distance.The distance is displayed in the lower right corner of the main window.
34
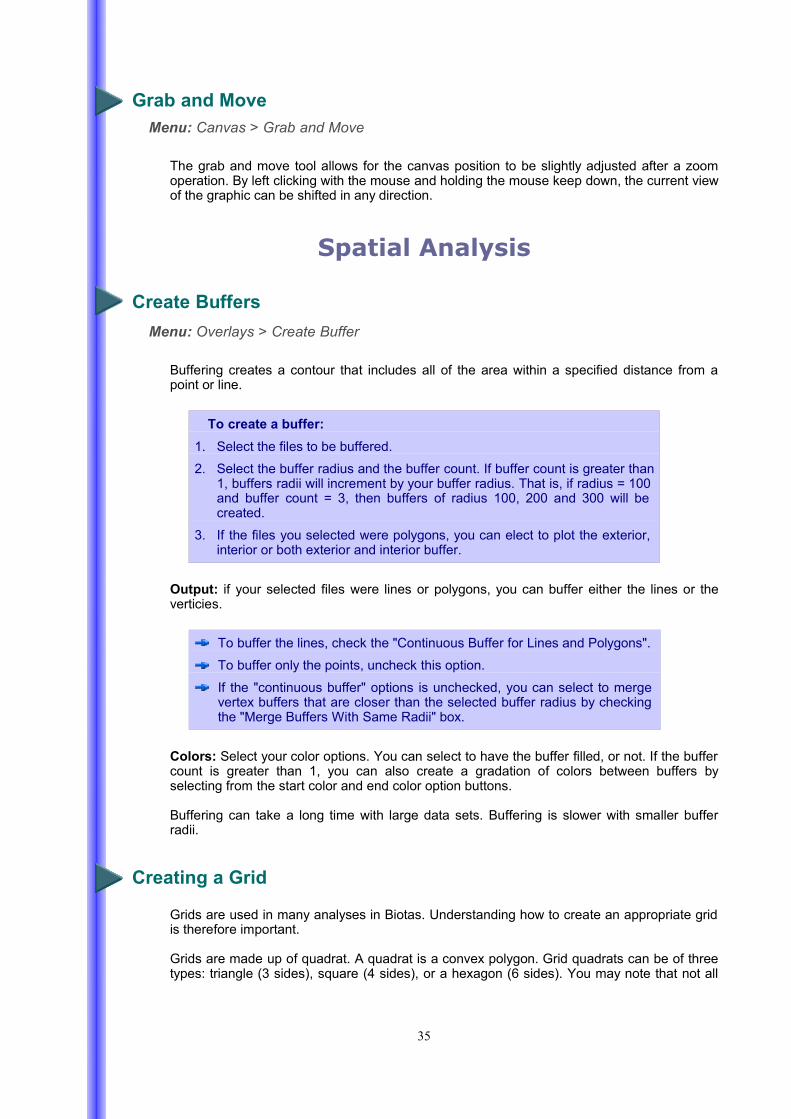
Grab and Move Menu: Canvas > Grab and Move
The grab and move tool allows for the canvas position to be slightly adjusted after a zoomoperation. By left clicking with the mouse and holding the mouse keep down, the current viewof the graphic can be shifted in any direction.
Spatial Analysis
Create Buffers Menu: Overlays > Create Buffer
Buffering creates a contour that includes all of the area within a specified distance from apoint or line.
To create a buffer:1. Select the files to be buffered. 2. Select the buffer radius and the buffer count. If buffer count is greater than
1, buffers radii will increment by your buffer radius. That is, if radius = 100 and buffer count = 3, then buffers of radius 100, 200 and 300 will be created.
3. If the files you selected were polygons, you can elect to plot the exterior, interior or both exterior and interior buffer.
Output: if your selected files were lines or polygons, you can buffer either the lines or theverticies.
To buffer the lines, check the "Continuous Buffer for Lines and Polygons". To buffer only the points, uncheck this option. If the "continuous buffer" options is unchecked, you can select to merge
vertex buffers that are closer than the selected buffer radius by checking the "Merge Buffers With Same Radii" box.
Colors: Select your color options. You can select to have the buffer filled, or not. If the buffercount is greater than 1, you can also create a gradation of colors between buffers byselecting from the start color and end color option buttons.
Buffering can take a long time with large data sets. Buffering is slower with smaller bufferradii.
Creating a Grid
Grids are used in many analyses in Biotas. Understanding how to create an appropriate gridis therefore important.
Grids are made up of quadrat. A quadrat is a convex polygon. Grid quadrats can be of threetypes: triangle (3 sides), square (4 sides), or a hexagon (6 sides). You may note that not all
35

analyses allow all three grid type options to be selected. Each quadrat type has limitationsand benefits:
Grid Types: Triangle: The triangle grid is a degenerate form of the hexagon
(constructed by splitting up hexagons into 6 equal parts). Its utility lies in the fact that it represents an exhaustive interconnecting lattice over an area which can easily be extended to represent a third dimensional value at each vertex.
Square: The square is perhaps the easiest field shape to construct as asampling unit. Its dimensions can range from sub-meter plots to hectares. It is also the grid shape used by software to plot home range isopleth contours.
Hexagon: The hexagon's unique property over the triangle and the square in that the center of each hexagon is equidistant to all its neighboring hexagon center points. This means that analysis with hexagons do not have to weight diagonal center distance as with the square.
Grids are constructed as polygon shapes, not as line vectors. Therefore, they inherit allfeatures of polygons including being able to have unique or , can be , or and can have theirvertices edited or the entire polygon can be moved on the canvas with . The only drawback tothis design is that it can take some time to construct a grid if the quadrat size is very smallrelative to the total area of the grid.
Create Buffers Menu: Overlays > Create Buffer
Buffering creates a contour that includes all of the area within a specified distance from apoint or line.
To create a buffer: 1. Select the files to be buffered. 2. Select the buffer radius and the buffer count. If buffer count is greater than
1, buffers radii will increment by your buffer radius. That is, if your radius = 100 and buffer count = 3, then buffers of radius 100, 200 and 300 will be created.
3. If the files you selected were polygons, you can elect to plot the exterior, interior or both exterior and interior buffer.
Output: if your selected files were lines or polygons, you can buffer either the lines or theverticies.
To buffer the lines, check the "Continuous Buffer for Lines and Polygons". To buffer only the points, uncheck this option.
If the "continuous buffer" options is unchecked, you can select to merge vertex buffers that are closer than the selected buffer radius by checking the "Merge Buffers With Same Radii" box.
Colors: Select your color options. You can select to have the buffer filled, or not. If the buffercount is greater than 1, you can also create a gradation of colors between buffers byselecting from the start color and end color option buttons.
36

Buffering can take a long time with large data sets. Buffering is slower with smaller bufferradii.
Merge Overlays Menu: Overlays > Merge Overlays
Merging overlays is a method of combining any number of overlays into a single file. The filesare only combined, they are not checked for intersections, overlapping shapes, or any otherinteraction between the files. Merging files is most useful for data sets and point shape files,but can be performed on lines and polygons shape lists. Only files of the same type (point,line, or polygon) can be merged into a single file.
To merge files, select the files to be merged by highlighting them in the "available" file boxand double clicking with the mouse or use the ">" button to move them to the list of files tomerge. The name of the merged file will be, by default, the first file selected. To change thistype in a new "Merge Title" name .
Merging will remove any reference in the legend to the individual files that were merged andreplaced with the new merged file title.
Merging is a local method. No changes to the files on disk will occur without specificallysaving the merged file.
Shape Overlap Menu: Overlays > Shape Overlap
Shape overlap takes a base shape list and determines where theoverlapping shape list shapes interact with the base shape. The result willbe a new shape file.
Shapes are selected as either a base or overlapping file by double clickingon the row in the displayed list of available shape lists. Shape attributes of generated shapelists may be changed and adjusted like any other file.
There are five methods for overlapping shapes: Intersection Parts of shape area common to both base shape list
(polygons only) and overlapping shape list (polygons only). The new shape list will take its basic attributes from the base file shape (such as color, fill type, etc.). This is sometimes called a "cookie-cutter" method (see above graphic).
Inclusive Base shapes (line or polygon) intersected by overlappingshapes (line or polygon).
Exclusive Base shapes (line or polygon) outside the range of the overlapping shape (line or polygon).
Contained Base shapes (line or polygon) completely contained by the overlapping shape (polygon only).
Vertices Only Base shapes (polygon only) that contain one or more vertices of the the overlapping shape (line or polygon).
Only the Intersection method will return part of a shape. All other methods return the entireshape from the base shape list that matches the overlapping method. Intersection andInclusive also do a "Contained" setting by default.
37

Point in Polygon
The point in polygon function checks all points in a data file against the selected polygonoverlay file.
One field from the polygon file will be added to the point file field list as a reference to thepolygon where a point is located. If a point is not in a polygon the value will be empty (or"null"). Select this referring field from the "Results Field Source" list box. The new field title inthe point file can be defined by typing in any desired name in the "Results In Field" text box. Ifthe point file is to be saved in dBASE format, then the field title should not exceed tencharacters in length.
38

Projections
The earth is not a true sphere, but more elliptical in shape (the earth has a larger equatorialradius than a polar radius). The Earth's surface is not perfectly smooth (mountains andvalleys abound), and an irregular geoid has been used to estimate the shape. However, formost conversions, this irregular shape is unnecessary. Instead, an approximation of theEarth's surface is creating with an imaginary spheroid that has a smooth surface.
Although the spheroid is not an exact representation of the earth's surface, it is moreaccurate than using a spherical earth model. Although a spherical model is very useful whendescribing relative positions, and in simplifying calculations, the spheroidal model is used byBiotas by convention.
To convert location data one must select both a projection and a datum for both the data tobe converted and the results. Projections are selected from the "projection conversion" grouplocated on the lower left half of the main Biotas window. This group is also used to defineprojection parameters for the "to" and "from" projections.
You may convert to and from the following projections:
Latitude and Longitude Universal Transverse Mercator (UTM) Albers (both one and two standard parallels) Lambert (both one and two standard parallels) Equatorial Mercator Stereographic
Any of the conversions may also be performed between different datums.
Each location is defined along a pair of coordinate axes. The notation used to describe eachaxis will vary depending on the type of location method employed. Latitude and Longitude willdescribe the vertical, or "Y" axis, as Latitude, or f, and the horizontal, or "X" axis, asLongitude, or l. Other methods, for example, call the "Y" axis the "Northing", or N, and the "X"axis the "Easting", or E. Biotas only uses the "X" and "Y" notation as a universal description(i.e. mathematical) of the horizontal and vertical axis, respectively.
DatumsA datum is a defining set of parameters that describe the length of this imaginary spheroid'smajor and minor axis. Different datums represent different levels of know accuracy indefining the spheroid, or are intended for local accuracy. Older datums such as Clark 1866are still used to define many maps of North America, such as US Geological Survey 7.5minute topographical quadrangles.
You may select from over 100 global or local datums. The WGS 1984 spheroid is genericglobal estimate of the earth commonly used today. To change a projection from one datum to another, select the same projection in the "to" and"from" lists and select different datums in the "Old Datum" and "New Datum" lists. The "OldDatum" is the datum used to describe the current data. The results will be converted intovalues descriptive of the "New Datum" parameters.
To change both projections and datums at once, select the appropriate projections anddatums.
39

Shifts between datums are caused for many reasons. For example, the datum shift betweenthe NAD27 and the NAD83 (~WGS84) is caused by a different location used for the datumorigin and mass center of the earth.
Datum shifts are not automatically corrected. You must manually enter a fixed datum shift fora local area. The default coordinate datum shift, as both positive values, will move theprojection to the north east by the number of meters you entered. If your shift is in anotherdirection, use the below table to determine your correction. (X = Easting, Y=Northing)
East West
North +X, +Y +X, -Y
South -X, +Y -X, -Y
Equatorial MercatorThe Equatorial Mercator, like the Lambert and Polar Stereographic projections, is aconformal projection. These three projections, when used together, can map the entire earth,from the equator to the poles.
There are many variations of the Mercator projection. Only the Equatorial Mercator and theUniversal Transverse Mercator projections are provided with this program. Distortion fromthe Equatorial Mercator projection is a function of latitude, not longitude and is most usefulfor areas with a wide East and West expanse at the equator. The Equatorial Mercatorprojection can also be calculated as a special case of the Lambert projection.
The central meridian, in longitude, is usually centered in the area of conversion, but may alsocome from a published value on the map for which you wish to match your conversions.
Lambert ConformalThe Lambert, like the Equatorial Mercator and Polar Stereographic projections, is a . Thesethree projections, when used together, can map the entire earth, from the equator to thepoles.
The Lambert projection is most useful at the mid latitudes. Distortion from the Lambertprojection is a function of latitude, not longitude and is most useful for areas with a wide Eastand West expanse. The Lambert projection will fail, computationally, at the poles and theequator, but a standard parallel set as little as 1 second from these extremes will producesimilar results to either the Polar Stereographic and Equatorial Mercator projections.
40

The Lambert projection may be calculated as either a one or two case. Two standardparallels will produce less North and South distortion, but is quite satisfactory for local areas.Standard parallel 1 should be a Latitude that is less in magnitude (i.e. -33 is less than -20)than standard parallel 2. Negative standard parallels are allowed for the SouthernHemisphere. If you wish to use a single standard parallel, uncheck the "Use two parallels"check box. Standard parallel 1 will become the single standard parallel used.
The central meridian, in longitude, is usually centered in the area of conversion, but is up tothe discretion of the user.
Use the False X and False Y origins to shift your values to a user defined origin, differentfrom the equator (False Y = 0) or Greenwich Mean Longitude (False X = 0).
Latitude and longitudeLatitude and longitude represents the basic description of geographical location. Each of thedifferent projections are mathematically derived from a latitude and longitude coordinatesystem. Although direct conversion algorithms exist for between projections conversions,most convert to and from the latitude and longitude system. The difficulty with the latitude andlongitude system concerns the very nature of it being an angular measure. For instance, thedistance between 20 and 30 degrees longitude is different depending on the latitude.
41

There is also no standard method of storing latitude and longitude location values, andstorage is often dependent on user preference. Two common methods of latitude andlongitude notation are the Decimal Degrees and Decimal Minutes storage types. Biotas alsoaccepts latitude and longitude data as degrees, minutes and seconds notation; referred tohere as Decimal Seconds. However, whatever notation used, latitude and longitude must becontained within one data field each. Separate fields for degrees, minutes and seconds arenot supported. See Latitude and Longitude Data Storage for instructions on how to transformyour data into the formats supported by Biotas.
Be sure your method of latitude and longitude storage matches the type selected in thelatitude and longitude parameters window (accessed by clicking on the parameters button inthe Projection Conversion group).
Biotas only accepts Latitude and Longitude values stored as either degrees or "decimalrepresentation" of degrees. "Decimal representation" means data may be encoded to containthe actual minutes and seconds in the value or the minutes and seconds may be recorded asfractional representation of higher order values.
A Longitude of 120°40'45" (120 degrees, 40 minutes, 45 seconds) may be encodedin any of the following formats: Decimal Degrees: 120° 40' 45" becomes 120.6792°, and written as 120.6792.
Decimal Minutes: 120° 40' 45" becomes 120° 40.75', and written as 120.4075.
Decimal Seconds: 120° 40' 45" remains as it is, and written as 120.4045.
Decimal Seconds retains the most intuitive information for reading by the user, but it is only a"representation", not a true decimal value. In all cases, Biotas will internally convert all valuesto decimal degrees during calculations, but will not alter your data storage type. Having theoriginal data in Decimal Degrees format will decrease the total number of calculationsnecessary for each conversion. With today's high speed computers this is really of limitedimportance.
However your data is stored you must make sure Biotas correctly interprets the data byselecting the appropriate storage type accessed by clicking on the "Parameters" button whenyou select Latitude and Longitude as a conversion type.
If your method of storing Latitude and Longitude data differs from above then you mustconvert it before using Biotas. The easiest method of converting the values is in aspreadsheet program. If you do not already have your data in a spreadsheet file, oneconvenient method is to paste the contents of your file into a spreadsheet. Open your filecontaining your location data in a word processor, select the entire file's text, copy theselected text, and paste it into a spreadsheet. Be sure your file has either tab or commaseparated values. This process does not work for all spreadsheet programs. If this pastingmethod does not create separate columns of data in the spreadsheet corresponding to
42

separate fields in your data file you must import this file into the spreadsheet. See yourspreadsheet program's documentation on how to import text files with comma or tabseparated values.
Once in a spreadsheet program, first name two new columns to hold the new decimalrepresentation of your Latitude and Longitude.
If you store 120° 40.75' (Decimal Minutes) as 12040.75, for instance, then merely createspreadsheet formulas that divide your values by 100.
If you have stored degrees, minutes and seconds in separate columns then do the following:
For data stored in degrees (e.g. column A = 120) and decimal minutes (e.g. column B =40.75) the following formula will convert to Decimal Minutes for the first values inspreadsheet cells A1 and B1. A1+ B1/100. To convert to Decimal Degrees use A1+ B1/60.
For data stored in degrees (e.g. column A = 120) and minutes (e.g. column B = 40) andseconds (e.g. column C = 45) the following formula will convert to Decimal Seconds: A1+B1/100 + C1/1000. To convert to Decimal Minutes use: A1+ B1/100 + C1/6000. To convert toDecimal Degrees use: A1+ B1/60 + C1/6000.
Stereographic projectionThe Stereographic projection, like the Mercator and Lambert projections, is a conformalprojection. These three projections, when used together, can map the entire earth, from theequator to the poles.
Only the Polar Stereographic projection is provided with this program for locations near thepoles. The Equatorial Mercator may be used for locations near the equator. Alternately, theLambert projection may be used for mid latitude values as well as near equatorial and nearpolar locations. The Stereographic projection can also be calculated as a special case of theLambert projection.
Universal Transverse Mercator (UTM)
The UTM projection was developed by the U.S. Army as a means of improving mapping andartillery calculations. The bases for this projection is a 1000 meter square grid system laid outalong zones that are, usually, defined to be six degrees apart at the equator (but see below).The geographical locations of the earth are projected onto this grid. Distortion is least at themid point of a zone and increases as location coordinates near the zone edge. The UTMsystem has quickly become a common low to mid latitude projection, but while it can beextended to the poles, its accuracy tends to diminish significantly above 80 north or southlatitude.
43

When using the UTM projection, make sure that the data is in the correct zone2. For data thattransverses more than one zone, you must use a field that notes the zone for a location'scoordinates. Biotas will automatically record the proper zone if the conversion is to UTM in afield at the end of the spreadsheet. By default this field is called "UTMZone", and the fieldname can not be changed. Access the UTM parameters by clicking on the parameters button in the ProjectionConversion group once UTM is selected from the projection list.
2Not all countries use a six degree zone width. Most notably are some African countries and somemaps of Australia. Smaller zone widths are, in theory, intended to decrease distortion at zoneedges. If you change the zone width from six degrees, the UTM zone will have to be adjustedaccordingly. Unless you are trying to map to a specific map, or are not sure of the zone width youshould use, it is best to use the standard zone width of six degrees.
44

Grids
Creating a GridGrids are used in many analyses in Biotas. Understanding how to create an appropriate gridis therefore important.
Grids are made up of quadrat. A quadrat is a convex polygon. Grid quadrats can be of threetypes: triangle (3 sides), square (4 sides), or a hexagon (6 sides). You may note that not allanalyses allow all three grid type options to be selected.
Grid Types: Triangle: The triangle grid is a degenerate form of the hexagon
(constructed by splitting up hexagons into 6 equal parts). Its utility lies in the fact that it represents an exhaustive interconnecting lattice over an area which can easily be extended to represent a third dimensional value at each vertex.
Square: The square is perhaps the easiest field shape to construct as asampling unit. Its dimensions can range from sub-meter plots to hectares. It is also the grid shape used by software to plot home range isopleth contours.
Hexagon: The hexagon's unique property over the triangle and the square in that the center of each hexagon is equidistant to all its neighboring hexagon center points. This means that analysis with hexagons do not have to weight diagonal center distance as with the square.
Grids are constructed as polygon shapes, not as line vectors. Therefore, they inherit allfeatures of polygons including being able to have unique colors or labels, can be filtered,stratified or subseted and can have their vertices edited or the entire polygon can be movedon the canvas with CAD polygon functions. The only drawback to this design is that it cantake some time to construct a grid if the quadrat size is very small relative to the total area ofthe grid.
Grid Size
Grids are constructed based on area or distances between grid quadrat centers. Only withthe square quadrat is the center distance equal to the quadrat edge length. Center distancesare relevant only in the horizontal direction for triangle quadrats, only in the horizontal andvertical direction for square quadrats, and for horizontal, vertical and diagonal directions forhexagon quadrats.
Grid size can sometimes be an arbritrary discision. One solution, provided if the OptimalEdge Length button is clicked, is to use the following formula for grid edge length:
and then to adjust for center distance depending on the quadrat type selected. "N" is thenumber of points being used in a grid based analysis. If a grid is being constructed withoutreference to a point pattern, then this option will not be available.
s is one methodology that allows you to examine the effect of quadrat size on the statisticaland pratical conclusions of quadrat analysis.
In some analyses, there is not always a need to display a grid. If not, you can uncheck the"Plot Grid on Canvas" box.
45

Grid Colors
Grids quadrats (i.e. the cells) are polygon shapes with a record field of "Value". One uses of theValue record is to color grids quadrats along a color gradient. The color gradient is defined byselecting the start and end colors. An optional color boundary can also be selected.
Grid Confinement
Grids quadrats can be confined to any polygon overlay shape. Depending on the type ofanalysis, the Confinement tab in the Grid Definitions window may not be visible. If it is, youmay confine grid quadrats to a polygon file by selecting an available polygon file in the list andchoseing one of the confinement options.
Grid confinement options:
None Polygons in the file will not be used to confine the grid quadrats.
Inclusive Grid quadrats will only be created if they are completely within any of the polygons in the file.
Contained Grid quadrats will only be created if at least one vertex is withinany of the polygons in the file.
Exclusive Grid quadrats will only be created if they are completely outsideall of the polygons in the file.
To refine what polygons are used as confinement, the polygon file can be stratified orsubseted prior to creating the grid.
Grid LimitationsGrids quadrats, or cells, are not natural sampling units. Therefore, they suffer from a degreeof bias that is affected by the size of the quadrat. This fact has unfortunately been used bysome to assume that grid based analysis are not reliable. While grid analysis is not withoutcertain limitations, and is in some circumstances an inappropriate technique, it still maintainsitself as an important form of data interpretation if used within its limitations.
A general rule when constructing quadrats, try to make them small relative to patch size. Anoptimal size may not be possible. Doing repeated quadrat analysis on a range of quadratsizes can provide much ecological information. On can not usually apply statistical hypothesistesting to repeated measures due to lack of independence, but permuation comparisons canprovide one measure of expected probability. In addition, because quadrat tests using acomputer is a simple matter, one can select a single most appropriate quadrat size based onvarying quadrat size on a separate sample data set before applying to the actual data set ofinterest.
Quadrat size is not the only limitation. Another is the choice of quadrat shape. A squarequadrat is the most intuitive quadrat shape, but it suffers from the limitation that its adjoiningquadrats on the diagonal do not have the same center distances than the adjoining quadratsin the horizontal and vertical direction. If quadrat distance matters (such as with Moran's Itext) then this bias must be accounted for.
46

Simulated Data
Simulated Point Patterns Menu: Analysis > Modeling and Simulations > Simulated Data
Point patterns simulations are a means to create random, or not so random, data to testprocedures, assumptions or models.
Random point patterns methods fall into four main categories: 1. Simple distributions 2. Random walk and correlated movements 3. User defined, distributions 4. 1, 2 or 3 above within defined spatial limits
For any simulation assign a sample size and repeat count (how many unique data sets) forthe simulation. The attempts factor is how many times beyond the given sample size shouldthe program try to find data that satisfied the user defined or other complex random datasets. This value prevents the program from entering an endless loop that may beencountered with some simulations. A new point pattern is created and stored from therandom parameters you select.
Each data set that is created may be treated as any other real data file, and any availableBiotas function can be applied to it.
Simulated Data - Simple Distributions Menu: Analysis > Modeling and Simulations > Simulated Data
Simple distributions may be used to create simple random data patterns. There is not need tocreate or write a formula in the formula window. If there is no formula written, Biotas willassume you just want to use the selected default distributions. All the simple distributions arerandom, but predicatable to the extend that they have well definded statistical characteristicsthat are used to generate the points process.
Simple distributions include :1. Normal (Gausian) 2. Uniform 3. Triangle 4. Exponential 5. Epanechnikov
Simulated Data - Complex Distributions Menu: Analysis > Modeling and Simulations > Simulated Data
Complex distributions are those that include addition processing beyond simply calculating avalue from a standard random number generator.
47
Biotas includes three built in complex function. These are:
Clusters This creates a aggregated point process where cluster centers are assigned a randomlocation, and then a random number of items (within user defined limits) is assigned toeach cluster. Therefore, there is spatial randomness at two levels, between clusters andwithin clusters.
The cluster function is: RandomClusters(sd, x, ss, min, max)
sd = cluster standard deviation, x = cluster mean size, ss = cluster sample size, min = range minimum, max = range maximum
Random Walk A Random walk is the most basic process to create spatially unpredictable data set.Points are added to the point process by adding a random value from a normaldistribution with a default mean = 0 and a standard deviation value passed to the function.This process can "walk" in any direction and can quickly leave an intended boundary area.To contain this process to a more realistic boundary, should be applied.
Autoregessive Time Series The time series point process is based on the correlation of prior data at any time "t" in thepast, plus a random value (termed the "white noise"). These correlation parameters arepassed to the function by means of an array of correlation values. The autoregressiveseries resembles a random walk but has a self containing feature that better limits isspatial movement.
You may also create with or without including using any combination of the available built infunctions.
Simulated Data - User Defined Random Data Menu: Analysis > Modeling and Simulations > Simulated Data
The simulated data unit is based on a Pascal script interpreter that allows the user to create awide variety of user defined point pattern functions. If you do not wish to write your ownfunctions, you can alternately use one of the Biotas supplied functions.
Writing a function in Biotas requires you to have a basic understanding of the Pascallanguage in general and of the small set of unique functions supplied by Biotas. Please seethe Pascal script section for more information.
Simulated Data - Random Data Limits Menu: Analysis > Modeling and Simulations > Simulated Data While random point patterns derived from frequency distributions are a convenient and usefulresearch tool, real data is rarely derived from mathematical formulas alone. Use of spatialareas is more likely to be related to some features of the landscape.
Biotas provides for such spatial use. The "Spatial Occurrence" tab is used to allow simulateddata to be restricted to polygons in a landscape in a deterministic manner as defined by theuser. That is, any percentage of points can be limited to any polygon type in the landscape.For instance, if a landscape polygon type has zero percent (0%) occurrence associated to it,no points in the simulated data will be placed in any polygon of this type. Total occurrenceassignment can not exceed 100% for all selected polygon overlays. Any distribution,including user defined functions, can use this feature.
48

Permutations
Permutations are a method of comparing observed test results to other possible results usingthe same data. These comparisons are repeated many times (100 or more times) and theresults of these comparisons can be used to construct a probability that the originallyobserved results were observed by chance. The end result is therefore similar to standardhypothesis testing. The benefit of permutations is that they often require no assumptionsabout the distribution of the data, making them very useful for ecological data sets where theassumption of normally distributed sample data is not valid.
It is is often assumed you must perform thousands or permutations to have a validconclusion. However, this is not necessarily true. You can prove this to yourself by trial. Forinstance, using 100 permutations, if there are 4 calculated values greater than the originaldata value, there will almost always be about 40 values greater with 1000 permutations.Therefore, it is often not necessary to perform an excessive number of permutations exceptto attain greater level of confidence in the probability: 100 permutations will give a probabilitylevel no greater than at 0.01, 1000 permutations will give a probability level greater than 0.01but no greater than 0.001, and so on.
One problem with permutations is that specific formulas, based on the permutationcomparison variable, must often be developed to provide accurate confidence intervals. AStudents-t distribution standard error range is often used as a convenient substitute, but youshould be aware that this does not always represent an exact confidence interval.
Data Permutation ExampleLets say you have two samples shown in the table at the bottom of this page. You want todetermine if their means differ. We start then by stating the null hypothesis (Ho): the meansof the two samples do not differ. From the data we can calculate: Mean A = 2.099, Mean B = 2.475.
The classical approach would be to do a one tailed Students-t test. Doing so provides thefollowing results for the probability that the two means do not differ: P = 0.033.
Conclusion: We would reject the null hypothesis. The means appear to be different.
To perform a permutation test of this data we need to decide on a comparison value betweendata permutations. One possible comparison, and the one we will use here, is the differencebetween the means of group A and B: 2.475 - 2.099 = 0.376. We will call this difference ouroriginal test value.
We then do the following procedure:
1. We randomize the values in each group. You can think of this as if we put all 20 values into a bag and randomly selecting values from the bag and placed them into either group A or group B.
2. We recalculate the mean of group A and B and find their difference in the same way did for the original test value. We will call this new difference ourrandomized test value.
3. We compare the difference of the randomized test value to the original test value according to the following principle:
a. If the randomized test value is greater than the original test value we increment a greater than counter by 1.
b. If the randomized test value is less than the original test value we
49

increment a less than counter by 1. c. If the randomized test value is equal to the original test value we
increment an equal to counter by 1.
When we have repeated the above procedure 99 times we have a total of 100 permutationsof the data (99 random permutations plus the original data order which is just consideredanother possible ordering of the data). We sum the "greater than counter" and the "equal tocounter" and/or the "less than counter" and the "equal to counter", and divide by the numberof total permutations that we have, which is 100 in this case.
This was done and the results were:
"greater than counter" = 2"less than counter" = 97"equal to counter" = 1 (our original test value)
Our one tailed test then becomes: ("greater than counter" + "equal to counter") / 100 By substituting in our above values, we get:
(2 + 1) / 100 = 0.03
Conclusion: We would reject the null hypothesis. The means appear to be different.
As can be seen, the permutation results closely match those from the Students-t test above,just as they should. The benefit of the permutation over the traditional test is that thepermutation procedure required no assumptions about the distribution of the underlyingsample data. The Students-t test assumes the sample data is normally distributed.
Table 1. Data for above tests. Group A is from a normal distribution mean = 2, SD=0.5. Group B is from a normaldistribution mean 2.5, SD 0.5.
Group A Group B2.19922 1.901271.75694 1.545781.57965 2.349592.34781 3.057962.23934 3.049721.52800 2.391112.40485 2.469162.33623 2.490302.00036 2.507992.59975 2.98979
50

Pascal Scripts
Biotas includes the Interfuse Pascal script interpreter that allows you to create a wide varietyof user defined functions using this powerful scripting language.
Although Pascal is not as widely a scripting language as others, this fact is based more oncorporate structure and decisions than on the weakness or merits of any particular language.Any language has both positive and negative aspects and there are many positive aspects ofPascal, including its easy to understand syntax, that makes it an ideal scripting language. Writing Pascal scripts in Biotas is relatively easy once you have mastered the basics ofPascal in general, and Biotas specific enhanced features. Both of which are themselves easyto learn.
Pascal Scripts - Basics
This tutorial is not intended to be an exhaustive coverage of all aspects available in thePascal script used with Biotas. If you want to learn more about Pascal not covered here, youare encouraged to see your local book store, library or visit one of the many web sites on theworld wide web for further information.
To begin to write scripts in Pascal, the first step is to learn some basic syntax. The mostnoteable feature of Pascal syntax is the difference between an assignment operator, and acomparison operator. An assignment operator is the syntax used to set the value of avariable, while a comparison operator is testing if two variables are equal.
The Pascal assignment operator syntax is a colon followed by an equal sign. Such as:
MyVariable := 15;
The Pascal comparison operator is just an equal sign. Such as:
IF MyVariable = 15 THEN...
Also note that except in certain specific cases to be pointed out later, most script lines inPascal end in a semicolon ";". With this basic knowledge, you can begin to write scripts inBiotas.
Pascal Scripts - Variables
The first topic to consider when working with Pascal scripts is to know that Pascal is astrongly typed language. A strongly typed language means all variables used in the programmust be defined and assigned a type. The variables maintain this type throughout the scriptan can not be changed. This feature is ideal for a scripting language because it makeswriting and debugging the script easier.
For instance, consider the following:
a := MyFunction;
In a language that is not strongly typed, if "a" was left untyped by the author of the script, thenthe value of "a" can be of any, unknown type (integer, text, date, etc.) depending only on whatvalue "MyFunction" returns. So you would not know if you can then perform the operation "c =a * b" since that will not work if the value of "a" is text. To know what "a" can be means youhave to know in advance what value the function "MyFunction" returns. This is fine if the
51
script is short, or you wrote it and you know what "MyFunction" returns, but it might be aninterpretation nightmare if there are dozens or hundreds of functions to remember.
In Pascal the above example would be:
assign the type using the colon operator a : integer; call the function using the assignment operator a := MyFunction;
Now it is clear that MyFunction will return an integer since "a" can only take an integer value.
You must assign a type to each variable or type before you use it. Constants areautomatically typed depending on the value they are assigned.
The following data types are allowed
Boolean : true or false value Integer : counting numbers, their negatives and zero Double : floating point or "decimal" numbers String : text value TDateTime : a value that holds both a date and time of day.
There are three basic types of Pascal assignments:
Constants, key word "const" Example: const Pi = 3.14159;
Variables, key word "var" Example: var Month : Integer; DayName : String; Types (such as Records), key word "type"
Example: type Score = Record High : Integer; Low : Integer; end;
Pascal Scripts – StructureLets say we want to build a script that adds two numbers. To do this we write a script that canprocess the numbers we want to add as variables and then adds these two numberstogether.
To start our script, we first have to know the basic format of a script. A Pascal script startswith the directive keyword program, followed by the name of the program, followed by asemicolon. Example:
program AddNumbers;
The part of the script where script commands are written occurs in one of two areas. One iscalled the "main program" the other is in functions or procedures. We will first deal only withthe "main program". The "main program" logic always starts with the key word begin andalways ends with the key word end followed by a period ".". The period is a very specialcharacter here, since it tells the compiler that it has reached the end of the script. Example:
program AddNumbers; begin end. {period goes here, end of program}
52

We now just need to add the program logic to our script. We first need to create somevariables. The logical first variable we need is a "result" variable that holds the sum of the twovalues. This is done using the already covered “var” key word.. The “var” key word must beplaced before the begin key word. In its most simple state our script then becomes:
program AddNumbers; var Sum : Integer; begin Sum := 11 + 12; end. {period goes here, end of program}
We can now also assign our two numbers we are adding to variables themselves. This is forexample purposes only since we assign the values to the variables in the logic of the scriptso variables are not expressly needed, but you can appreciate the purpose of assignmentvariables if you consider the assignment of values may represents possible values input froma user interface. Our script program now becomes:
program AddNumbers; var Sum, Number1, Number2 : Integer; begin Number1 := 11; Number2 := 12; Sum := Number1 + Number2; end. {period goes here, end of program}
This is a complete script program. We can further enhance this program by including afunction to centralize the processing logic.
Pascal Scripts - Procedures and FunctionsWe continue our script development by adding a function to the script we began in the basicssection.
In addition to the main program, there may be many functions and procedures that processlocal information. Like the main program, all functions and procedures are started andstopped using the key words begin and end. However, unlike the main program, the end ofall procedures and functions are followed by a semicolon ";" rather than by a period. Thestructure to declare a procedure or function is as follows:
procedure procedure_name(passed_variables) ; function function_name(passed_variables) : returned_value ;
The procedure type does not return a value, while the function type does."(passed_variables)" is optional and can be left out. Passed variables are by convention thename of the variable, followed by a colon, followed by the variable type. If there is more thanone passed variable, they are separated by a semicolon.
Example:
function XPlusY(x: Integer; y: Integer): Integer; begin Result := x + y; end; {semicolon goes here, end of function}
Continuing our script example from the basics section, we now combine the main programand the function "XPlusY" by calling the "XPlusY" function from the main program.
53

program AddNumbers; function XPlusY(x: Integer; y: Integer): Integer; begin Result := x + y; end; {semicolon goes here, end of function} var Sum, Number1, Number2 : Integer; begin Number1 := 11; Number2 := 12; Sum := XPlusY(Number1, Number2); end. {period goes here, end of program}
You may have noticed that many lines in a Pascal script also end in a semicolon. While theplacement of the semicolon is not done in some places such as control statements, for nowyou may assume you allways place a semicolon after each line except after the key wordbegin and after the end of the program, where a period is placed.
Pascal Scripts - Control StatementsControl statements exercize control on the flow of the script. This means you can use controlstatements to repeat sections of code, move out of code blocks test variable values, etc.
The FOR..DO statement. This is a loop statement that lets you repeat a block of code anynumber of times.
Example:
var i, Total : Integer; begin Total := 0; FOR i := 0 TO 10 DO Total := Total + i; end;
The control of the FOR statement is held by the count variable "i". The loop is repeatedstarting with i = 0 and ending at i = 10 for a total of 11 loops. Our result for Total = 45. Noticethat Total was assigned a starting value of zero. You should allways assign a starting value tovalues as the value assigned by the compiler when the script is run need not necessarily bezero.
The WHILE..DO statement. This is a loop statement that lets you repeat a block of code anynumber of times without a count increment. The control of the WHILE statement is held by acomparion function you assign. When the comparison function returns true, the WHILEstatement stops.
Example:
var Total : Integer; begin Total := 0; WHILE Total < 45 DO Total := Total + 1; end;
The loop is repeated starting Total = 0 and ending at Total = 45 for a total of 45 loops.
54

The REPEAT..UNTIL statement. This is a loop statement similar to the WHILE statement,except that the REPEAT statement's control statement is at the end, do the REPEATstatements internal logic will be activated at least once.
Example:
var Total : Integer; begin Total := 46; REPEAT Total := Total + 1; UNTIL Total > 45; end;
The loop is repeated starting Total = 46 and ending at Total = 47 for a total of 1 loop.The IF..THEN..ELSE Statement. This it to compare variables for logical true or falsestatements.
Example:
var IsTrue : Boolean; Total : Integer; begin Total := 46; IF Total = 45 THEN IsTrue := False ELSE IF Total >= 46 THEN IsTrue := True ELSE IsTrue := False end;
The IF statement above will set IsTrue = True since the second ELSE IF statement is true. Itis also possible to use the operators AND and OR to put the same logic on a single line.
Example:
var IsTrue : Boolean; Total : Integer; begin Total := 46; IF (Total < 46) OR (Total > 46) THEN IsTrue := True ELSE IsTrue := False end;
The IF statement above will set IsTrue = False since the combined IF statement is false andthe default ELSE then sets the value.
The IF, FOR and WHILE control statements above process all script code until theyencounter the next semicolon, which indicates the end of the line they have contorl over. It ispossible for a control statement to maintain control over many lines of code by useing thebegin and end keywods as a control block.
55

Example:
var i, Total : Integer; begin Total := 0; FOR i := 0 TO 10 DO BEGIN Total := Total + i; Total := Total - i; END; end;
In the above example, at the end of the FOR processing loop, Total = 0; The REPEATcontrol statement does not need a begin/end control block since it allready has its owncontrol block using UNTIL.
Pascal Scripts – ArraysAn array is a sequential collection of items of the same type. Arrays can contain eithervariables or types, but all items in the array must be of the same type. All arrays are assigneda size dynamically in the script.
Arrays are created by assignment as either a variable or a type.
Example:
type TIntegerArray : Array of Integer;var IntegerArray : Array of Integer; IntegerArray2 : TIntegerArray;Notice that IntegerArray and IntegerArray2 are both of type "Array Of Integer" since"TIntegerArray" is just a type reference to an "Array of Integer".
Because arrays can be of any type, they can also store a record type.
Example:
type APoint = Record X : Integer; Y : Integer; end; TPointArray : Array of APoint;
var Points : TPointArray;
Before we can use the array, we must set its size using the SetArrayLength function beforewe assign any values to the array members. To set an array to a size of 5 items, we wouldwrite:
SetArrayLength(Points, 5);
To assign values to the array, we just use the array index notation "[index]". Array index startsat zero ("0"), not at one ("1"). If the array is a record array, we use dot notation to assignvalues to each record item for each index "[index].record_item". For the point array this wouldbe:
56

Points[0].X := 4; // reference count starts at zero Points[0].Y := 5; Points[1].X := 8; Points[1].Y := 12; .... etc.
Array access is not checked for the correct range. To find the size of an array and to be sureyou are within the array's range, such as when an array of unknown size is passed to afunction, use the GetArrayLength function.
Arrays can only be passed to a function as a type. Therefore, use "TPointArray" in thefunction parameter list, not "Array of APoint".
In summary, the point array setup program would then be:Example:program BuildPointArray;type APoint = Record X : Integer; Y : Integer; end; TPointArray : Array of APoint;procedure SetArrayValues(Points: TPointArray);var i, ArrayLength : Integer;begin ArrayLength := GetArrayLength(Points); FOR i := 0 TO ArrayLength DO BEGIN Points[i].X := i; Points[i].Y := i+2; END; end;
var Points : TPointArray;begin SetArrayLength(Points, 5); SetArrayValues(Points);end.
Pascal Scripts – ConventionsThis topic is to provide authorship standards and guidelines for writing scripts in Biotas. Scriptstandards help to maintain human readability between authors of the scripts.
Give all variables, constants, types or functions discriptive names that everyone can read.Capitalize the first letter of all multiword names, or separate words with an underscore. Avoidusing "Hungarian Notation", which is an archaic method used to conserve typing andcomputer memory space when computers had little available memory. At times Hungariannotation can be quite clear, but usually it is not. Not using Hungarian notation means moretyping of long names, but it also makes the script readable by more people and easier todebug even for the script's author.
For example, write variable and function names like : MeanVarianceProcedure
But not like this : meanvarianceprocedure
Also, avoid Hungarian Notation like this: mnvrpro
Allways give your script a program name that is both discriptive and a name that you believewill be unique. Adding your initials to the beginning of the program name followed by an
57

underscore can help to keep names unique. Unique names will help keep scripts fromcolliding with one another. Capitalize the first letter of all multiword names, or separate wordswith an underscore.
For example, John Doe would name a script like: Program jd_SpeciesIndex;
But not like this: Pogram index;
Add comments (using the //comment or {comment} methods ) to your scripts that say whatthe script is doing. You may understand your script logic, but others may not. In six months,you may not either.
Add spaces before and after all math notations and assignment ":=" notation. This just makesit easier to read.
For example, do this : Value := AxisX + AxisY + Cos(Angle1) / (Sin(Angle2) * Log(3));
Avoid this : Value:=AxisX+AxisY+Cos(Angle1)/(Sin(Angle2)*Log(3));
Use temporary variables unless there is an imperative need for brevity (which is rare).Temporary variables makes program logic more clear. Local assigned variable types areeasier to identify and follow than memorizing the intended result of function calls. Think ofeach function as its own world that should be totally understandable within its immediatereference.
For example, do this : Size := GetArrayLength(Array); Total := Sum(Array); Average := Total / Size;
Avoid this : Average := Sum(Array) / GetArrayLength(Array);
Avoid long procedures or functions. If you can not see the whole procedure or function onyour screen at once, it is too long. Break it up into logical sub functions or procedures forspecific task processing.
Use common sence when writing a script. Avoid being lazy with documentation. It will costtime later if extensive debugging is required.
Available Functions
Array Functions
function GetArrayLength(var v: array): Integer; Returns the length of a dynamic array.This is often used to iterate through the array items. Array index starts at zero.
procedure SetArrayLength(var v: array; i: Integer); Set the length of a dynamic arrayvariable "v". This inititalizes the array variable and sets its length to "i". You must call thisprocedure before using a dynamic array.
Pascal Scripts - Math Functions function Pi : Extended; Contant Pi Value
function Abs(e : Extended) : Extended; Absolute value of e
function Ln(X: Real): Extended; Natural log of X
function Log10(X: Extended): Extended; Log base 10 of X
58

function LnxP1(X: Extended): Extended; Natural log of X + 1. Use for values close to zero.
function Log2(X: Extended): Extended; Log base 2 of X
function LogN(N, X: Extended): Extended; Log base N of X
function Exp(X: Real): Real; Base "e" raised to X
function Sqr(X: Extended): Extended; Square root of X
Function Sqrt(e : Extended) : Extended; Square root of ePascal Scripts - StatisticalFunctions
function Sum(const AnArray: TArrayOfDouble): Extended; Returns the sum of elementsin AnArray.
function SumInt(const AnArray : TArrayOfInteger): Integer; Returns the sum ofelements in the integer array AnArray.
function MinValue(const AnArray : TArrayOfDouble): Double; Returns the minum valueof elements in AnArray.
function MaxValue(const AnArray : TArrayOfDouble): Double; Returns the maximumvalue of elements in AnArray.
function StdDev(const AnArray : TArrayOfDouble): Extended; Returns the samplestandard deviation of elements in AnArray with a sample size divisor of N - 1.
function PopnStdDev(const AnArray : TArrayOfDouble): Extended; Returns thepopulation standard deviation of elements in AnArray with a sample size divisor of N.
function Variance(const AnArray : TArrayOfDouble): Extended; Returns the samplevariance of elements in AnArray with a sample size divisor or N - 1.
function StdError(const AnArray : TArrayOfDouble): Extended; Returns the samplestandard error of elements in AnArray.
function PopnVariance(const AnArray : TArrayOfDouble): Extended; Returns thepopulation variance of elements in AnArray with a sample size divisor or N.
String Functions
function FloatToStr(e: extended): string; Converts a floating point value into a string.
function IntToStr(i: Longint): string; Converts an integer value into a string.
function StrToInt(s: string): Longint; Converts a string into an integer.
function StrToIntDef(s: string; def: Longint): Longint; Converts a string into an integer.If the string can not be converted into an integer, the value "def" is returned instead.
function Copy(s: string; ifrom, icount: Longint): string; Copies part of a string from thesource string "s", starting at position "ifrom" and of length "icount" and returns the resultingstring. "i" is short for "index". Example: NewString := Copy('buffalo bill", 5, 3); NewString ='alo';
function Pos(substr, s: string): Longint; Locates the index position of the substring"substr" in the source string "s" and returns the value >= 1 if true. If "substr" is not fond in "s",then this function returns 0 as the result. Note that this Pos is a CASE sensitive function.Example: StringPosition := Pos(''Buf', 'buffalo bill'); StringPosition = 0; Example:
59

StringPosition := Pos(''buf', 'buffalo bill'); StringPosition = 1;
procedure Delete(var s: string; ifrom, icount: Longint): string; Deletes part of thesource string "s", starting at position "ifrom" and of length "icount". "i" is short for "index".Example: NewString := Delete('buffalo bill', 5, 3); NewString = 'buff bill';
procedure Insert(s: string; var s2: string; ipos: Longint): string; Inserts the string "s"into the source string "s2", starting at position "ipos" Example: NewString := Insert('alo', 'buffbill', 5); NewString = 'buffalo bill';
function StrGet(var S : String; I : Integer) : Char; C
procedure StrSet(c : Char; I : Integer; var s : String); C
function Uppercase(s : string) : string; Sets the string to all UPPER CASE letters. Usefulwith the Pos function, which is case sensitive. Example: StringPosition := Pos(''BUF',UpperCase('buffalo bill')); StringPosition = 1;
function Lowercase(s : string) : string; Sets the string to all lower case letters. Usefulwith the Pos function, which is case sensitive.
function Trim(s : string) : string; Removes spaces infront of and after a string. Example:NewString := Trim(' buffalo bill '); StringPosition = 'buffalo bill';
function Length(s : String) : Longint; Returns the length of the string in characters.Example: StringLength := Length('buffalo bill'); StringPosition = 12;
procedure SetLength(var S: String; L: Longint); C
function StrToFloat(s: string): Extended; C
function FloatToStr(e : Extended) : String; C function Padl(s : string;I : longInt) :string;
function Padr(s : string;I : longInt) : string;
function Padz(s : string;I : longInt) : string;
function Replicate(c : char;I : longInt) : string;
function StringOfChar(c : char;I : longInt) : string;
Trigonometry Functions
function Sin(X : Extended) : Extended; Trigonometric Sine of e. The value of X must bein radians.
function Cos(X : Extended) : Extended; Trigonometric Cosine of e. The value of X mustbe in radians.
function Tan(X: Extended): Extended; Trigonometric Tangent of X. The value of X mustbe in radians.
function ArcCos(X : Extended) : Extended; Inverse of Cosine. X must be in the range -1to 1. The return value will be in the range [0..Pi], in radians.
function ArcSin(X : Extended) : Extended; Inverse of Sine. X must be between -1 and 1.The return value will be in the range [-Pi/2..Pi/2], in radians.
60

function ArcTan2(Y, X: Extended): Extended; Inverse of Tangent where Y and X arepoint on the unit circle. ArcTan2 returns the correct quadrat the point defined by Y, X islocated within unit circle in the range from -Pi to Pi
function Cotan(X: Extended): Extended; Cotangent of X. X can not be = 0.
function Cosh(X: Extended): Extended; The hyperbolic cosine of X.
function Sinh(X: Extended): Extended; The hyperbolic Sine of X. The value X must be inradians.
function Tanh(X: Extended): Extended; The hyperbolic Tangent of X.
function ArcCosh(X: Extended): Extended; The inverse of the hyperbolic cosine of X.
function ArcSinh(X: Extended): Extended; The inverse of the hyperbolic sine of X.
function ArcTanh(X: Extended): Extended; The inverse of the hyperbolic tangent of X.
function DegToRad(Degrees: Extended): Extended; Converts Degrees to radians. Useinconjuction with many trigonometric functions that require radians as their input value.
function RadToDeg(Radians: Extended): Extended; Converts Radians to Degrees. Usein conjuction with many trigonometric functions that output their result in radians.
function GradToRad(Grads: Extended): Extended; Converts Gradients to Degrees. Useinconjuction with many trigonometric functions that require radians as their input value.
function RadToGrad(Radians: Extended): Extended; Converts Radians to Gradients.Use in conjuction with many trigonometric functions that output their result in radians. PascalScripts - Distribution and
Random Functions
function Normal(Mean, StdDev: Extended): Extended; Calculates a normal distributedrandom data value with usging the assigned values of mean and standard deviation(StdDev).
function Uniform(Mean, Range: Extended): Extended; Calculates a uniformly distributedrandom data value with using the assigned values of mean and range.
function RandomTriangle(Mean, Range: Extended): Extended; Calculates a triangulardistributed random data value with using the assigned values of mean and range.
function RandomExponental(Mean, Range: Extended): Extended; Calculates aexponential distributed random data value with using the assigned values of mean andrange.
function RandomBinomial(Midpoint: Extended): Extended; Calculates a randombinomial value (i.e. 0 or 1) based on the value of Midpoint.
function RandomEpanechnikov(Mean, ShapeFactor: Extended): Extended; Calculatesa epanechnikov distributed random data value with using the assigned values of Mean andShapeFactor. function AddRandomDataPoint(X, Y: Double): Boolean; A special function using inBiotas random data scripts to add a random data point to a shape list. This function returnsTrue if the point was successfully added to the shape list, False if not. Example: var i :Integer; X, Y : Double; begin FOR i := 1 TO 100 DO BEGIN X := Normal(0, 2); Y :=Normal(0, 2); AddRandomDataPoint(X, Y); END; end;
61

procedure RandomUniformPoints(XCenter, XRange, YCenter, YRange: Extended;SampleSize: Integer); Creates a uniformly distributed bivariate (i.e. X and Y) point patternwith a SampleSize number of points and adds this as a shape list to the current canvas. Todefine the spatial limits of the point pattern, pass to the function the center of the desiredpoint pattern as the XCenter and YCenter, and the horizontal point range and vertical pointrange as XRange and YRange.
procedure RandomNormalPoints(XMean, XStdDev, YMean, XStdDev: Extended;SampleSize: Integer); Creates a normaly distributed bivariate (i.e. X and Y) point patternwith a SampleSize number of points and adds this as a shape list to the current canvas.
procedure RandomTrianglePoints(XCenter, XRange, YCenter, YRange: Extended;SampleSize: Integer); Creates a triangle distributed bivariate (i.e. X and Y) point patternwith a SampleSize number of points and adds this as a shape list to the current canvas. Todefine the spatial limits of the point pattern, pass to the function the center of the desiredpoint pattern as the XCenter and YCenter, and the horizontal point range and vertical pointrange as XRange and YRange.
procedure RandomExponentalPoints(XCenter, XRange, YCenter, YRange: Extended;SampleSize: Integer); Creates a exponential distributed bivariate (i.e. X and Y) pointpattern with a SampleSize number of points and adds this as a shape list to the currentcanvas. To define the spatial limits of the point pattern, pass to the function the center of thedesired point pattern as the XCenter and YCenter, and the horizontal point range and verticalpoint range as XRange and YRange.
procedure RandomEpanechnikovPoints(XMean, XShapeFactor, YMean,YShapeFactor: Extended; SampleSize: Integer); Creates a Epanechnikov distributedbivariate (i.e. X and Y) point pattern with a SampleSize number of points and adds this as ashape list to the current canvas. To define the spatial limits of the point pattern, pass to thefunction the center of the desired point pattern as the XMean and YMean, and the horizontalpoint range and vertical point range as XShapeFactor and YShapeFactor.
procedure RandomClusterPoints(XCenter, XRange, YCenter, YRange, ClusterSD,ClusterSize: Extended; SampleSize: Integer); Creates a clustered bivariate (i.e. X and Y)point pattern with a SampleSize number of points and adds this as a shape list to the currentcanvas. The clusters contain a random number of items N. N is calculated from a normaldistribution which is defined by the assigned values of ClusterSize (i.e. mean cluster size)and ClusterSD (i.e. cluster size standard deviation). To define the spatial limits of the pointpattern, pass to the function the center of the desired point pattern as the XCenter andYCenter, and the horizontal point range and vertical point range as XRange and YRange.
procedure RandomWalkPoints(XCenter, XRange, YCenter, YRange, StdDev: Extended;SampleSize: Integer); Creates a point pattern with a SampleSize number of points thatrandomly "walks" without any specific direction. The processes's white noice has a mean ofzero and a standard deviation determined by StdDev. To define the spatial limits of the pointpattern, pass to the function the center of the desired point pattern as the XCenter andYCenter, and the horizontal point range and vertical point range as XRange and YRange.
procedure RandomAutoregressivePoints(XCenter, XRange, YCenter, YRange, StdDev:Extended; SampleSize: Integer; const FixedConst: TArrayOfDouble); Creates a pointpattern with a SampleSize number of points, based on an autoregressive random variable oforder "p". The process's white noise has a mean of zero, and a standard deviationdetermined by SD. The order "p" of the data is determined by the size of the FixedConstarray. A FixedArray size of 1 is a first order equation, a FixedArray size of 2 is a second orderequation, etc. To define the spatial limits of the point pattern, pass to the function the centerof the desired point pattern as the XCenter and YCenter, and the horizontal point range andvertical point range as XRange and YRange.
62

References
This is an incomplete list.
Boots, B. N. 1988. Point Pattern Analysis. Sage Publications.
Diggle, P. J. 1983. Statistical analysis of spatial point patterns. New York: Academic Press.
Janson, S. and J. Vegelius. 1981. Measures of ecological association. Oecologia 49:371-376.
Jennrich R. I. and Turner F. B. 1969. Measurement of nor-circular home range. Journal of TheoreticalBiology 22:227-237.
Ludwig, J. A. and J. F. Reynolds. 1988. Statistical ecology. John Wiley and Sons.
Pielou, E. C. 1969. An introduction to mathematical ecology. John Wiley and Sons.
Rice, J. A. 1995. Mathematical statistics and data analysis. 2nd Ed. Duxbury Press.
Scheaffer R. L., W. Mendenhall, and L. Ott. 1990. Elementry survey sampling. Duxbury Press.
Schluter, D. 1984. A variance test for detecting species associations, with some example applications.Ecology 65:998-1005.
Wray, S. Cresswell, W. J., Rogers, D. 1992 Dirichlet tesselations: a new, non-parametric approach tohome range analysis. In: Wildlife Telemetry: remote monitoring and tracking of animals. ImantsGeorge Priede and Susan M. Swift, ed. Ellis Horwood Publisher.
63