i of - unt digital library
TRANSCRIPT

/
\
- \
i \
of work sponsored by an agency of the overnment nor any agency eivempltyees, makes any
liability or responsibj4ity for ' mation, apparatus, product,
infringe priyatd y owned Oct, process, or service by
trade name, trademark, mqnufacturer, or otherwise does not necessarily constitute or imply its endorsement, recommend$on, or favoring by the United States Government or any a opinions of authors e Unityd States Gover
/
\
' 1
\ '
~
,
\ -
I Information Service; ~
I J
- i d
,, T 3 : . -+ - . / . . i
\
\ i
inted on recycled paw:
/
I I
'.

DISCLAIMER
Portions of this document may be illegible in electronic image products. Images are produced from the best available original document.
I

RBMK Thennohydraulic Safety Assessments Using RELAPWMOD3 Codes
G. V. Tsiklauri B. E. Schmitt
June 1995
Prepared for the U.S. Department of Energy under Contract DE-AC06-76RLO 1830
Pacific Northwest Laboratory Richland, Washington 99352
f3STRlBUTlON OF THIS DOCUMENT IS UNLIMITED

summary
In 1994 and 1995, the Pacific Northwest Laboratory (PNL) performed three thennohydraulic safety analyses of the Sovietdesigned, graphite-moderated reactors (RBMKs) using the RELAPWMOD3 computer code. The analyses were completed at the request of the U.S. Department of Energy (DOE) for its International Nuclear Safety Program (INSP), which is intended to achieve improvements at Soviet- designed nuclear power plants in the areas of safety culture, power plant operation and physical condition, and safety infrastructures.
This report presents three papers that record the results of the following analyses performed using the code:
1) a loss-of-coolant accident at the core pressure tube inlet, the blockage of a pressure tube, and the pressure response of the core cavity to in-core pressure tube ruptures
2) a partial rupture in a group distribution header that results in stagnated (low) flow to up to 40 pressure tubes
3) thermally induced, two-phase instabilities in nonuniformly heated boiling channels in RBMK-lo00 reactors.
Scientists and engineers can use this information to further study and support other safety-related work on Sovietdesigned RBMK reactors. The results of future analyses will be published in subsequent reports.
The findings of the three thermohydraulic safety assessment analyses using the RELAPS/MOD3 computer code are summarized below:
1) The RBMK models of the RELAPYMOD3 code used to validate various thermohydraulic transients in RBMK-reactor postulated accidents were able to successfully predict major phenomena during accidents in the RBMK systems.
2) For the three accident scenarios (inlet tube ruptures, tube blockages, and overpressures in the reactor core cavity), the calculations were compared and verified with existing transient data and experimental calculations.
3) For inlet pressure tubes ruptures, the fuel and cladding heatup did not occur. Steam drum inventory and primary coolant flow control could be a concern for long-term core cooling (t- lo00 s).
4) For the tube blockage scenario, which simulated the Leningrad Nuclear Power Plant (NPP) 1992 accident, the minimum time to pressure tube rupture was calculated to be 42 seconds after blockage. This estimate compared well to the real accident time of 40 to 45 seconds.
5 ) The calculated pressure in the core cavity also compared well to the Leningrad NPP accident measurements, However, the local pressure in the graphite tube annular gap and graphite stack could exceed 20 bar. This pressure could potentially cause the graphite stack to move and rupture. The possibility of a single fuel channel rupture in the core cavity will require further analysis.
... 111

9)
Thermally induced, two-phase instabilities in nonuniformly heated channels in RBMK-1000 reactor were analyzed for low flow in a distribution group header (DGH) supplying 44 fuel pressure tubes. The model DGH for RBMK was evaluated against experimental data.
Modeling sensitivity studies indicated that instability analysis results are sensitive to the nodalization scheme and time step used.
The calculations provided the density wave-*e oscillation for the high power channels with period 3.1-2.6 s. The amplitude of the flow oscillation varied from 100% to -150% of the tube average flow, which means a reverse flow occurs in high-powered tubes. A reverse flow did not occur in the lower-power tubes. An instability of the flow is more severe in the subcooled region at the inlet to the fuel channels, although the flow oscillations are dissipated in the upper fuel region and outlet connectors.
The flow instability threshold for an RBMK reactor was established and compared to Japanese data. The threshold appeared to be in good agreement with the Japanese data.
Additional details are provided in the attachments. Specifically, Attachment A is titled RELAPs/MOD3 Code Assessment for Pressure Tube, Graphite-moderated Boiling Water Reactors, Attachment B is called the RBMK Pressure Tube Rupture Assessment, and Attachment C is titled Z%eml-hydraulic Imtabilities in Pressure Tube Graphite-moderated Boiling Water Reactors.
iv

Attachment A
"RELAP5MOD3 Code Assessment for Pressure Tube, Graphite-moderated Boiling Water Reactors"

RELAPS/MOD3 CODE ASSESSMENT FOR
PRESSURE TUBE GRAPHITE-MODERATED
BOILING WATER REACTORS
G. Tsiklauri, B. Schmitt Battefle Pacific Northwest Laboratory, USA
ABSTRACT
The capability of the REL P5/MOD3 code to validate various transients encountered in RBMK reactor postulated accidents has been assessed. The assessment results include a loss of coolant accident at the inlet of the core pressure tube, the blockage of a pressure tube, and the pressure response of the core cavity to in core pressure tube ruptures. These assessments show that the RELAPS/MOD3 code can predict major phenomena during postulated accidents in the RBMK reactors.
I. INTRODUCTION
The RELAPS computer code is a one-dimensional non-equilibrium (with respect to the interface momentum and energy exchange) two-phase thermal-hydraulic systems code, developed at the Idaho National Engineering Laboratory, and has been successfdy applied to PWR and BWR types of reactors. The US. Nuclear Regulatory Commission has accepted the use of RELAP5 for licensing audit calculations, evaluation of operator guidelines and Emergency Operational Procedure (EOP) for PWR. However, RELAPS/MOD3 has limited use for the pressure tube graphite-moderated boiling water reactor such as the FSU RBMK reactors. Considering the uniqueness of the thermal-hydraulic systems of RBMK type reactors, assessment studies are required to adapt the RELAPS/MOD3 code and assure its applicability to RBMK reactors.
The purpose of this paper is to verify that RELAPS/MOD3 can be adapted to accident analysis of RBMK reactors. The Leningrad accident 121 and cavity pressure [3] were chosen as benchmark cases. In
addition, comparisons were made with some experimental data. The results obtained also provide insights into other potential concerns.
reactor are as follows: The general characteristics of the RBMK type
Thermal core power 3200 MW. 1661 fuel tubes, 7 m active core, average linear heat flux 153 w/cm. Operating pressure 7 MPa. 37,600 tonne/hr total loop flow, an average of 6.288 kg/s per tube.
The reactor has four steam drum separators, two hydraulic loops common at the steam header and 8 main circulation pumps (PCP), (6 operating, and 2 reserved).
Our study considers three LOCA events:
1. Inlet pressure tube rupture (one or several).
2. Blockage of coolant at the inlet of a pressure tube (similar to the Leningrad NPP accident in 1992).
3. Pressure response of the core cavity for pressure tube ruptures in the core.
In case (3) two-phase flow at the stagnation pressure -7 MPa is discharged from the ruptured tubes into the graphite stack with the subsequent overpressure in the core cavity. The Chernobyl acadent in 1986 revealed that due to overpressure the steel plate at the top of the reactor was lifted and the core was exposed. In the acadent at Leningrad NPP in 1992, an increase in cavity pressure was observed as well.

In case (1) the rupture of a single pressure tube was investigated. This was the design basis accident for the first generation of RBMK. For the Smolensk and Ignalina NPPs, the pressure in the graphite cavity reaches P,-1.4 bar for this accident [3]. That corresponds to a considerable margin of safety (for the RBMK design the core cavity limiting pressure is determined by the top plate uplifting pressure, Ptop =3.1 bar)
tubes could rupture simultaneously. The probability of independent rupture of tubes is too low to be of practical consequence. The propagation of rnultichannef ruptures is potentially a greater risk. Previous calculations of the RBMK core canty pressure were presented at the RBIPE-PNL Workshop on N-Reactor Lessons [3]. With the conservative assumptions of simdtaneous multichannel ruptures, these dcdat ions showed that the RBMK-1000 and RBMK-1500 unmodiiied core cavity pressure protection system assures protection from only 3 pressure tube ruptures. Four pressure tube ruptures would result in an overpressure above the margin value PtOp=3.1 bar and possible loss of the core integrity. For the modified upgrade piping system of RBMK-1000 (Smolensk NPP), the core integrity is assured for 9 pressure tube ruptures and for RBMK-1500 (Ignalina NPP), for 11 pressure tube ruptures.
It is important to note that the results obtained in [3j include the assumption that the nearby stack does not contain the graphite rings, or other graphite fragments, around the broken pressure tube. This means that two- phase flow through the graphite stack and rings is not considered. This assumption is conservative for the cavity pressure because it maximizes the overpressure at the top plate. However it is not conservative with respect to the local pressure near the rupture which would determine the possibility of propagation of multichannel ruptures.
However, there is a possibility that several pressure
11. MODEL DESCRIPTION
The RELAPS/'MOD3 thermal hydraulic model is based on a onedimensional, two-velocity, two-temperature model of two-phase flow. For engineering applications, two-phase flows are represented by mathematical models consisting of quasi-linear sets of partial equations. The equations are space-averaged and time-averaged (statistically averaged) and may be written in the following form:
Where t and z are the independent time and space variables; X is the vector of the n dependent variables
used to describe the flow; 4 and 4 being square (nxn) matrixes; and B is a column-vector of n elements. + 4, and B are functions of X, t, z In the RELAPS/MOD3 code six dependent variables are used
Mass, momentum and energy balances are written for each phase. Empirical constitutive correlations are required to dose the set of equations. In transient processes, models for non-equilibrium interphase mass- transfer and slip between liquid and gas velocities are essential. In RELAP5/MOb3 improved non-equilibrium transient experimental correlations are used, as compared to previous code versions.
.
Model Nodalintion
Two base RELAPS models were developed that represent a 1/4 core and 1/2 core of an RBMK reactor. With these two models, minor modifications are made specific to the transient being simulated. For both models, the nodalization is setup to perform a detailed caiculation of an affected core region (for a single or multiple tube rupture or blockage). The balance of the core is lumped into a single tube to allow the RELAPS model to predict needed fluid conditions in the steam drum and inlet distribution headers. It was felt that a simple single tube model, with boundary conditions for these regions, would not allow sufficient degrees of freedom in the calculation to provide accurate results. The nodalization schemes for both models are shown in Figure 1.
The 1/4 core model assumes a 1/4 core symmetry for the RBMK, and contains two parallel fuel regions for the reactor core. A 1/4 core model is the minimum size needed to include a steam drum model, and is readily adaptable for assuming conservative core power distributions (Le. assuming high/low power regions). The two fuel region model allows for one or more 'affected' tubes (fuel channels) to be modeled separate from the intact core for events such as tube rupture or blockage. The 1/2 core model contains three parallel fuel regions for the core. The 1/2 core representation allows a more accurate calculation of the core average conditions as the RBMK core is split in-two hydraulically. The three fuel channel model can model the same transients as the two channel model, but dso includes the ability to model the core cavity pressure response for a tube rupture, including heat transfer between the discharged coolant and the core graphite and internal structures. The third core region is used to simulate the adjacent tubes that are in the 'sphere
-

4 7 0
Core Tubes - 2 Region Model) l u b e s . 3 negion Modo))
Cote Cavity 7 Tube-Gtaphiie
0---1 * TDV OC - Time Dependenl Volume Boundary Condiiion
Figure 1. RELAP5 RBMK Nodalizalion
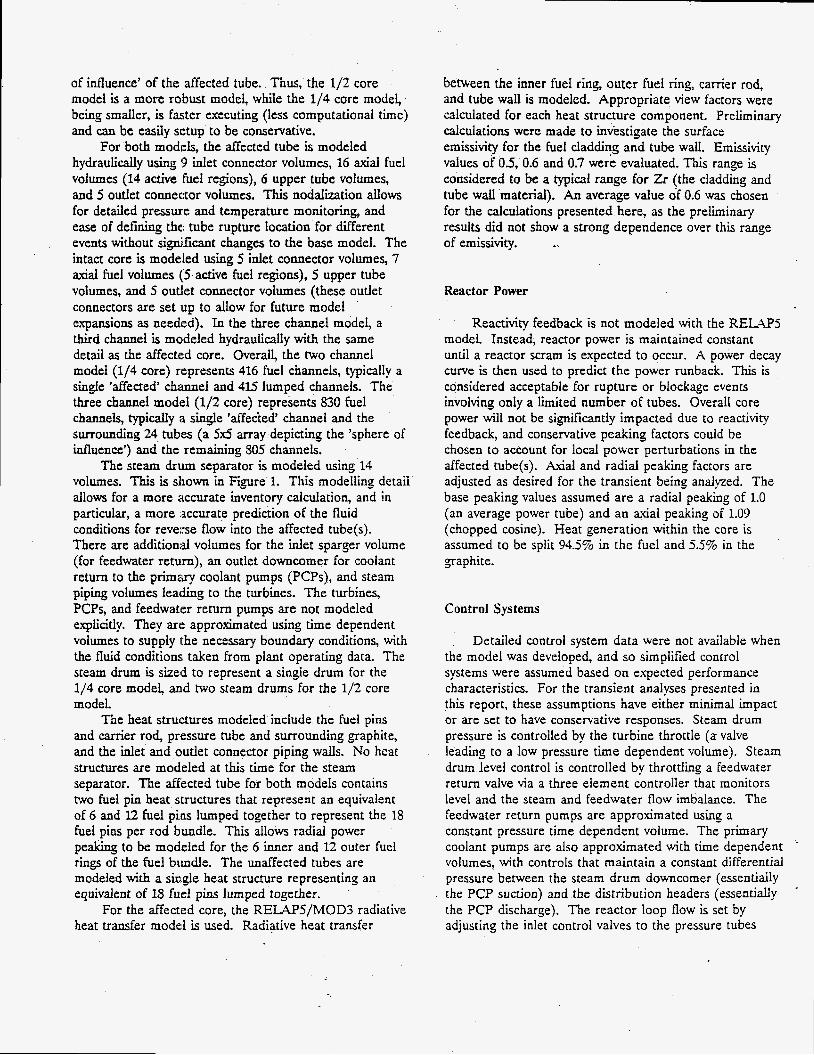
of influence' of the affected tube. Thus, the 1/2 core model is a more robust model, while the 1/4 core model, being smaller, is faster executing (less computational time) and can be easily sctup to be conservative.
For both models, the affected tube is modeled hydraulically using 9 inlet connector volumes, 16 axial fuel volumes (14 active fuel regions), 6 upper tube volumes, and 5 outlet connector volumes. This nodalization allows for detailed pressure and temperature monitoring and ease of defining the tube rupture location for different events without si&icant changes to the base model. The intact core is modeled using 5 inlet connector volumes, 7 axial fuel volumes (5 active fuel regions), 5 upper tube volumes, and 5 outjet connector volumes (these outlet connectors are set up to allow for future model expansions as needed). In the three channel model, a third channel is modeled hydraulically with the same detail as the affected core. Overail, the hvo channel model (1/4 core) represents 416 fuel channels, typically a single 'affected' c b e i and 415 lumped channels. The three channel model (1/2 core) represents 830 fuel channels, typically a single 'affec'ted' channel and the surrounding 24 tubes (a 5x5 array depicting the 'sphere of influence') and the remaining 805 channels.
The steam drum separator is modeled using 14 volumes. This is shown in Figure 1. This modelling detail allows for a more accurate inventory calcdation, and in particular, a more accurate prediction of the fluid conditions for reverse flow into the affected tube(s). There are additional volumes for the inlet sparger volume (for feedwater return), an outlet downcomer for coolant return to the primary coolant pumps (PCPs), and steam piping volumes Ieading to the turbines. The turbines, PCPs, and feedwater return pumps are not modeled explicitly. They are approximated using time dependent volumes to supply the necessary boundary conditions, with the fluid conditions taken from plant operating data. The steam drum is sized to represent a single drum for the 1/4 core model, m d two steam drums for the 1/2 core model.
The heat structures modeled include the fuel pins and canier rod, pressure tube and surrounding graphite, and the inlet and outlet connector piping walls. No heat structures are modeled at this time for the steam separator. The affected tube for both models contains two fuel pin heat structures that represent an equivalent of 6 and 12 fuel pins lumped together to represent the IS fuel pins per rod bundle. This allows radial power peaking to be modeled for the 6 inner and 12 outer fuel rings of the fuel bundle. The unaffected tubes are modeled with a single heat structure representing an equivalent of 18 fuel pins lumped together.
heat transfer model is used. Radiative heat transfer For the affected core, the RELAPS/MOD3 radiative
beween the inner fuel ring, outer fuel ring, carrier rod, and tube wall is modeled. Appropriate view factors were calculated for each heat structure component. Preliminary calculations were made to investigate the surface emissivity for the fuel cladding and tube wall. Emissivity values of 0.5, 0.6 and 0.7 were evaluated. This range is considered to be a typical range for Zr (the cladding and tube wall material). An average value of 0.6 was chosen for the calculations presented here, as the preliminary results did not show a strong dependence over this range of emissivity,
Reactor Power
Reactivity feedback is not modeled with the R E M 5 model. Instead, reactor power is maintained constant until a reactor scram is expected to occur. A power decay curve is then used to predict the power runback. This is considered acceptable for rupture or blockage events involving only a limited number of tubes. Overall core power will not be significantly impacted due to reactivity feedback, and conservative peaking factors could be chosen to account for local power perturbations in the affected tube(s). Axial and radial peaking factors are adjusted as desired for the transient being analyzed. The base peaking values assumed are a radial peaking of 1.0 (an average power tube) and an axial peaking of 1.09 (chopped cosine). Heat generation within the core is assumed to be split 94.5% in the fuel and 5.5% in the graphite.
Control Systems
Detailed control system data were not available when the model was developed, and so simplified control systems were assumed based on expected performance characteristics. For the transient analyses presented in this report, these assumptions have either minimal impact or are set to have conservative responses. Steam drum pressure is controlled by the turbine throttle (a valve leading to a low pressure time dependent volume). Steam drum level control is controlled by throttling a feedwater return valve via a three element controller that monitors level and the steam and feedwater flow imbalance. The feedwater return pumps are approximated using a constant pressure time dependent volume. The primary coolant pumps are also approximated with time dependent volumes, with controls that maintain a constant differential pressure between the steam drum downcomer (essentially the PCP suction) and the distribution headers (essentially the PCP discharge). The reactor loop flow is set by adjusting the inlet control valves to the pressure tubes
until the desired flow is established in the affected and unaffected pressure tubes.
Pressure in the Graphite Stack
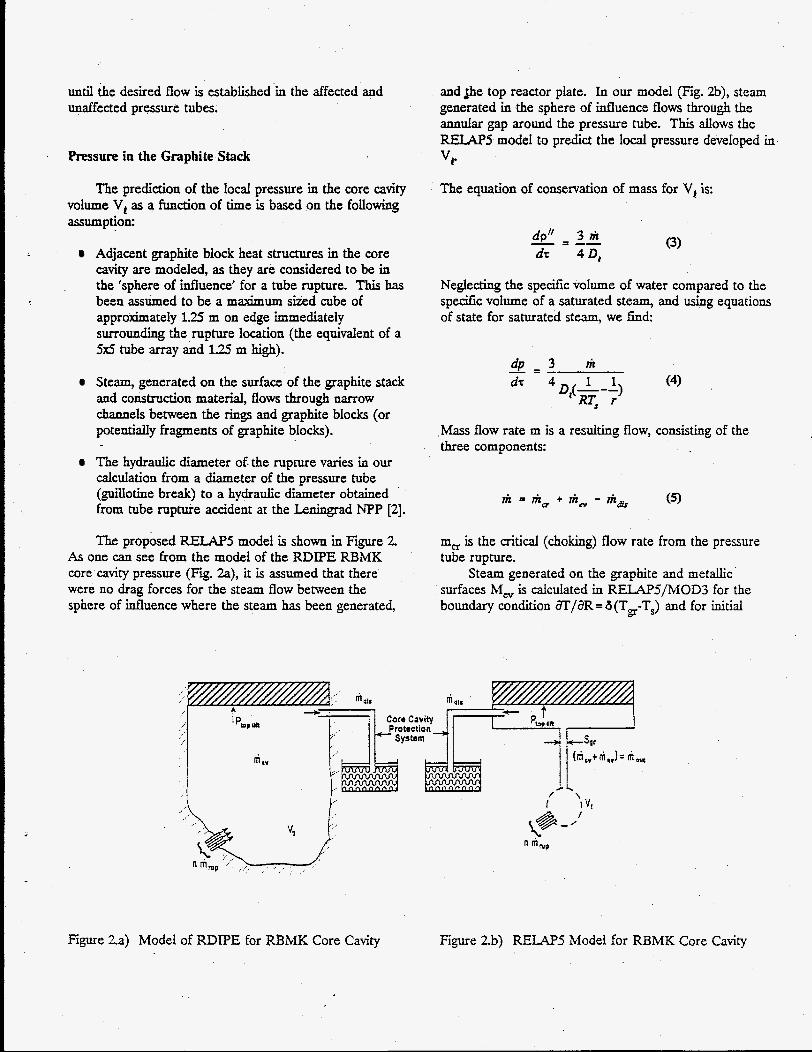
The prediction of the local pressure in the core cavity volume V, as a function of time is based on the following aSSUmpti0n:
Adjacent graphite block heat structures in the core cavity are modeled, as they are considered to be in the 'sphere of influence' for a tube rupture. This has been assumed to be a maximum sized cube of approximately 1.25 m on edge immediately surrounding the rupture location (the equivalent of a 5x5 tube array and 1.25 m high).
Steam, generated on the surface of the graphite stack and construction material, flows through narrow channels between the Mgs and graphite blocks (or potentially fragments of graphite blocks).
The hydraulic diameter of. the rupture varies in our calculation from a diameter of the pressure tube ( d o t i n e break) to a hydraulic d i e t e r obtained from tube rupture accident at the Leningrad NPP [2].
The proposed RELAPS model is shown in Figure 2. As one can see Gom the model of the RDIPE RBMK core cavity pressure (Fig. a), it is assumed that there were no drag forces for the steam flow between the sphere of influence where the steam has been generated,
andlhe top reactor plate. In our model (Fig. 2b), steam generated in the sphere of influence flows through the annular gap around the pressure tube. This allows the RELAPS model to predict the local pressure developed in, v,. The equation of conservation of mass for V, is:
Neglecting the specific volume of water compared to the specific volume of a saturated steam, and using equations of state for saturated steam, we find:
d p = , 3 m d r 4 1 1 D,(R1;-;' (4)
Mass flow rate m is a resulting flow, consisting of the three components:
ni = m, + m, - m,
m, is the critical (choking) flow rate from the pressure tube rupture.
Steam generated on the graphite and metallic surfaces M, is calculated in RELAP5/MOD3 for the boundary condition dT/dR=d(T*-TJ and for initial
I' 'I v,
Figure 2.a) Model of RDPE for RBMK Core Cavity Figure 2.b) R E W 5 Model for RBMK Core Cavity

condition T, = const. The coefficient of heat transfer, a, is representative of the value for film or transitionboiiing. The maximum radius of influence R, is calculated for a square cell with 5 tubes on a side. For a given Biot number, the heat flux from the graphite to wet steam is found as a function of time. The mass of steam generated in the graphite stack is M,=Q/r, and mass flow rate of steam generated in the time interval AT is:
S is the cross section of the channel at the graphite (see F$g. 2b). mdk in eq (4) is given for a spec%c NPP by characteristics of the piping system discharging steam from the reactor clore cavity to the pressure-suppression pool.
III. CODE VERIFICATION AND ANALYSIS OF RESULTS
The frst stage of the verification involved calculations of steady-state parameiers in the RBMK. The general operating parameters calculated by RELAP5 for the RBMK are given below. Prior to initiating each transient case, a null transient is run to ensure that steady- state conditions have been reached. This solution provides the starting (T=O) conditions for the transient calculations. The steady-state calculations compare well with the design parameters of RBMK
3197 MW thermal core power (equivalent full core). 1.93 MW affected tube power (determined for Leningrad tube rupture). 1.48 axid P/A (maximum value, used for inlet tube rupture). 1.09 axial P/A (average value, used for Leningrad tube rupture simulation). 6.97 MPa steam drum pressure. 8.27 ma inle:t header pressure. 37,600 tonne/’hr total loop flow, an average of 6.288kg/s per tube. 5220 tonne/hr steam flow (equivalent full core). 13.8% average exit quality. 287°C coolant outlet temperature (saturated). 27OoC coolant inlet temperature. 100 mm drum level.
The second verification involves comparison against known experimental data (or correlations) and RBMK
transient data. For the evaluations presented in this report, this wiil indude comparison against known correlations for two-phase choked flow, comparison of the estimated time to tube rupture for the Leningrad tube rupture, and comparison of the core cavity pressure for the Leningrad tube rupture. In addition, a review was performed for the physical reasonableness and consistency of the RELAP5 resuits. This was important for the fuel temperature and steam drum responses as little or no data were available for the transients evaluated.
Inlet Tube Rupture
An inlet tube rupture was analyzed for an inlet rupture immediately upstream of the fuel region. One and two tube ruptures were considered, however, only the results of the two tube rupture case are presented. It was assumed that reactor power would remain constant, and that no control system feedback or inventory makeup would occur.
case. First, the RELAPS choke flow model was compared against accepted correlations for two-phase choke flow. This is shown in Fig. 3a. The comparison of the RELAPS/MOD3 calculations for the critical flow from the ruptured tubes with accepted correlations [4,5,6] has shown that the calculations correlate well with expected values. Second, the capability of the system model, and in particular the steam drum model, to provide physically meaningful and consistent results for RBMK small break LOCAs was evaluated. The results presented here are for the case of two simultaneous tube ruptures. Break flow, system and drum mass, drum level and void fraction in the drum for first 1800s of the transient are shown in Figs. 3 (b,cd). The third part of this evaluation is for the transient response itself, as an inlet tube rupture represents a potential challenge to both inventory control and fue1 integrity.
has fallen abruptly to the critical flow pressure. Figure 3a shows the variation of mass flow rate. The flow after -20s is equal to the critical flow for two-phase media. During the inlet tube rupture simulation, the affected tubes were cooled by reverse flow from the steam drum with a heat transfer rate similar to the normal operating condition. Therefore, initial fuel and cladding heatup were not significant. Potential core cooling problems could exist due to long term steam drum inventory and primary coolant flow control. In Figs. 3b, c, and d are shown system and drum mass, steam drum level and void fraction in the steam drum separator. After lOOOs, the level in the steam drum has fallen and drum void fraction
Three important evaluations were made with this
Within the first seconds pressure of the affected tube

4. I
- Oreok
Figure 3.a
RBMK Oual Inlet Tube Ruplure
lrnO 1
- aleom drum lave1
-4m.o
lime (sec)
Egure 3.c
(Fig. 3d) ha reached -1.0 even at corn artment number 450 of the drum (Fig.1). This means that at the inlet of the affected tubes the density of the coolant and heat transfer rate have decreased and the heatup of the channel could result. The general response of the RELAPS for the steam drum and system inventory appear to be reasonable (for the assumptions made).
Tube Blockage
A series of tube blockage cases were evaluated with the REW5 two region core model. Briefly, the Leningrad tube rupture was initiated by a failure of the inlet flow control valve to one core pressure tube. It was estimated from post-accident reviews that this failure
RBMK Dual Inld Tube Rupture - 1
0.OE.mo f , , . , , , , . , . , . , 0 / . . . . . . I I . l . . . I . . . . . l . . , . . , , . , ,
I lW 1- xm 4w ma time (sec)
Figure 3.b
1.0
a.
C 0 0.1 U 0
.- - 2 0 0.4 0 > .-
0.2
RBMK Ouol Inlet Tube Rupture
- 433-01 Scparalor - 440-01 Lquid Return -*- 430-01 Middle Drum - 450-01 Lower Drum - 415-01 U. Comporlmcnl
412-01 L Compartment
0 0 . . . . . . . . . . . . . . . . . . . . , 0 rl izm t a w xm 4m am
time (sec)
Figure 3.d
resulted in a flow reduction of the inl t flow to less than 10% of the initial tube flow. The flow reduction initiated a fuel temperature excursion and also elevated the pressure tube wall temperature due to radiative and convective heat transfer between the fuel and the pressure tube wall. Approxhately 40-45 seconds after the inlet valve failure, the pressure tube ruptured in the upper core. A reactor shutdown was initiated 3.7 seconds after the tube rupture due to high core cavity pressure.
performed over the potential range of inlet flow blockage. Each calculation made assumed an instantaneous reduction in the inlet valve flow area to simulate the valve failure of the Leningrad event. A total of five calculations were made, varying the inlet flow blockage to obtain a
To evaluate this event, a parametric study was

c70.0
v i 3 v -
3 0 4.0 : i;
2.0 1
E 50.8 F
e ,.?
Inlet Flow Blockage - Tube Ruplura Time 'lime to Tube Fallure Aller Blockoge
- - Leningrad Estimated Time
Inlet Flow Blockage Fuel Cladding Temperature
1400.0
n Y 1200.0 Y
0 L
; 1000.0 k 0 P
E, 800.0 I-
600.0
0.). Nods - Node - - Node - Node 1 - - Node - Node * ++ - Node - Node
210-5 210-7 210-9 210-11 210-12 210-15 210-14 210-15
4
range of flow reduction between 2%-10% of the initial tube flow. Initial tube flow was 6.288 kg/s. Fuel dadding and pressure tube wall temperatures were evaluated every 0.5m with the two core region RELAPS model. It was assumed that pressure tube failure (rupture) would occur at an average tube wall temperature of 650OC (9239. This is the temperature at which tube softening is estimated to occur chat then results in tube rupture. With 0.5~1 volume nodalizations for the 7m active fuel region, the tube failure location was calculated to be either at 6.25m or 6.75m core elevation, depending upon the individual case. A plot of the time to pressure tube failure was made of the five calculations, and is shown in Figure 4.a. A minimum time to tube rupture of approximately 42 seconds was calculated (compared to the estimated time of 40-45 seconds).
An evaluation was also made o€ the general transient response, with reactor shutdown, for one of the
Inlet Flow Blockage Tube Wall Temperature
1200.0
**-.Node 210-5 1000.0 **-a Node 210-7
=--+lode 210-9 Y v .--Node 210-12 0 - tlodc 210-13 3
0 - u Hode 210-14 CIW Node 210-15
h 0-- tlade 210-11
L
..a 800.0 2 a
$ I-
600.0
400.0 0
Time (5)
-Figure 4.d
calculations. Figures 4.b through 4.d show results from an approximate 6% flow blockage calculation. Initial tube flow €or this calculation was reduced from 6.288 kg/s to 0377 kg/s. In each of these figures, a null transient is run to ensure steady state conditions have been reached prior to initiation of the blockage (e.g., the blockage occurs at 30 seconds). Figure 4.b is the pressure tube inlet flow. Figure 4.c is the fuel cladding temperature response for selected nodes, and figure 4.d is the pressure tube inner WalI temperature for the same nodes. Refer to Figure 1 for the nodalization numbers. For this calculation, the tube was estimated to rupture 42 seconds after initiation of the blockage. A reactor shutdown was initiated 3.7 seconds after the rupture, resulting in the eventual quenching of the fuel dadding and pressure tube wall. Peak dadding temperature was calculated to be 1217% (1490 K) for this case. The general responses for this transient appear to be physically consistent.
-

., Core Cavity Pressure
An evaluation of the reactor core cavity pressure response was made for the Leningrad tube rupture event. In addition, a parametric study was performed to evaluate different modeling assumptions and their impact on the core cavity pressure response. These calculations were made using the three core region RELAP5 model. This model is very similar to the two core region model, but allows more expliat modeling of the graphite block heat structures in the core cavity. The 6% blockage caldation from above was used as the basis of this study. For the cavity pressure response, the cavity pressure relief was based on an unmodified steam discharge piping for the Srnolensk power plant I/n, RBMK loo0 [3]. This is shown in Figure 5.a. The pressure relief is modeled using
this flow versus cavity pressure relationship, and assuming only vapor is discharged.
reactor coolant would discharge into the gap region between the pressure tube and graphite blocks and destroy or relocate the graphite rings so that only the annular gap provided any signifcant flow restriction before discharging into the main cavity area. For this base case it was assumed that only the immediate graphite block was available for heat transfer to the discharging reactor coolant (over only a 1.25 m, height adjacent of the break location). For all graphite heat structures, it was conservatively assumed that heat transfer was to the hot, outer surface of the 25 cm square blocks. The cavity pressure response for the base dculation is shown in Figure 5.b. Also shown are the Leningrad cavity pressure and two additional parametric calculations. The
The base 6% blockage calculation assumed that the
- 0 a Y
Unmadiiied Cavity Oischarge
- Cavity Discharge flaw
200
150-
h
$loo{
g ; G
” “ ” ” , ” ” ” ” . ) ’ . , , , , * , , , ~ . , , , , , , , ~ , , ~ . . , , , ~ 0.0 2.0 4.0 6.0 8.0 10.0
Pressure (bar)
Figure 5.a
Tube-Graphite Cap Local Pressure 9% Tube Blackaqe
(0.00073m2 ruplure)
e--- NO Cra hite 0 0 mZ surface) ---a 1 Gr. &ck [I125 m2 surlace) - 25 Gr. Blocks (31.25 m2 surlace)
F w e 5.c
Cavity Pressure Response 9% Tube Blockage
(0.00073mZ rupture)
I . o E + a m ~ . . . , . , , , , , . . . . . . . . . . . . . . . . . . . . . . . . . . . . . . . . . . . . . . . . . 0 0 400 mo 120.0 imo rmo
Time (sec)
Figure 5.b
Cavity Pressure - Tube Rupture (no blackage)
---* Slit Tube Rupture *--- Slit Tube Rupture [0:00123m21 - 1/2 Tube Ruolure 000229m2) - Cudlatine Ruplure (6.00458m2)
0 00073m2
X l l O Is€.WW , . . . , , , l . , , . . . . . . ( . . . , , . . . , , . . . . . . , . . , . . I . . . . I . I . 0.0 ‘an mn 1m0 :a0
Time (sec)
Figure 5.d

parametric calculations assumed no graphite blocks for heat transfer, and 25 blocks (the maximum 'sphere of influence', a 5x5 array surrounding the ruptured tube.) In terms of surface area available for heat transfer, these equate to Om2, 1.25m2 (the base calculation), and 31.25m2. It is noted that pressure in the tube-graphite gap region exceeded 20 bar for the base calculation with the assumption of no graphite rings for flow restriction. If the rings were to remain intact, pressure in thii gap region could be expected to reach 50-60 bar (effectively the reactor system presswe). The gap pressure response is shown in Figure 5.c for the 0, 1 and 25 graphite block cases.
A parametric study was also made for the potential rupture area of the tube. However, these calculations differ from the base 6% calculation in that no initiating tube blockage is assumed. The tube is assumed to rupture due to a random failure. The 6% base calculation used a rupture area of 0.00073m2, based on results of the tube inspection after the Leningrad event, and assuming that the fuel bundle becomes lodged in the slit opening. For this study, additional rupture areas of 0.00123m2, 0.0022908m2, and 0.W5816m2 were assumed. These four areas correspond to; the fuel bundle lodged to minimize rupture area; the fuet bundle lodged to maximize rupture area; the tube cross-sectional area with fuel intact; and a double-ended guillotine rupture with he1 intact. The cavity pressure response for these calculations is shown in Figure 5.d. The single tube guillotine rupture compares well with the results ,indicated in [3], which caldated a peak cavity pressure of 1.4 bar.
SUMMARY AND CONCLUSION
In general the WELAPS/MOD3 code calculations for graphite-moderated light water reactors (RBMK) for the above three test series compared well with the existing transient data and experimental correlations. The results of calculations show that for the inlet pressure tube rupture simulation, initial fuel and cladding heat up did nor occur, however, long term steam drum inventory and primary coolant flow control could be a concern for long term core cooling. For the tube blockage case, simulating the Leningrad accident, minimum time to pressure tube rupture was calculated to be 42 seconds after blockage, comparing well to the estimated time of 40-45 seconds. The calculated pressure in the core cavity also compared well with the Leningrad accident measurements. However, the l o d pressure in the tube graphite gap region exceeded 20 bar. This could potentidy cause the graphite stack to move and rupture neighboring pressure tubes. Determination of multiple tube ruptures would require further assessment.
ACKNOWLEDGMENTS
This work was sponsored by the United States Department of Energy under Contract DE-ACM-76RLO. The authors are indebted to Dr. Darreil Newman and Mr. Scott Heaberfin for their assistance and support. The manuscript was prepared by Ms. Diana L. Tde t t and Ms. Pamela Sheeran.
NOMENCLATURE
p -Pressure d - void fraction W, - veloaty of steam W, - veloaty of liquid phase h, - liquid enthalpy h - steam enthalpy pi - saturated steam density t -time M -mass m -mass velocity D, - diameter of sphere of influence V, - volume of sphere of influence T - temperature R - gas constant for steam r - latent heat H - level
REFERENCES
1. SCDAP/RELAF'S/MOD3 Code, Vol. 2 and 3, EG&G Idaho, Inc, 1989
2. Cherkashov, Yuri M. - "RBMK NPP Safety" Workshop of Safety of Soviet-Design Nuclear Power Plants, Chicago Illinois, November 20-21, 1992.
3. Gabaraev, B., Yu, Nikitin, 0. Novosekky, "An Assessment of the RBMK Core Cavity Overpressure Protection Piping System for Simultaneous Rupture of Several Pressure Tubes", RDIPE-PNL Workshop on N-Reactor Lessons, Richland, WA, July 20-22, 1993.
4. Zaloudek, F. R., "The Critical Flow of Hot Water Through Short Tubes", G.E. Hanford Laboratory, H W - 68934REV, Richland, WA, 1963.
5. Fauske, M., "Two-phase Critical Row at Low Qualities", Nuclear Science and Engineering, 41, 79/91, 1970.
6. Tsiklauri, G. V., "Problems of Heat Transfer and Hydrodynamics Related to Nuclear Reactor Safety", Vol. 11 - 'Two-Phase Momentum, Heat and Mass Transfer in Chemical Process and Energy Engineering Systems", Hemisphere Publishing Corp., 1979.

Attachment B
"RBMK Pressure Tube Rupture Assessment"
ASSTRACT
The Russian RBMK reactor core design consists of multiple parallel pressure tube channels that contain Zr clad, UO, fuel pin bundles. These parallel channels are contained within graphite moderator blocks which are, i n t u r n , contained within a sealed core cavity. Current safety evaluation effor ts o f the RBMK reactors have been concentrating in the area of tube ruptures w i t h i n the core cavity and, in particular, multiple tube ruptures t h a t could threaten the reactor core integrity. a pressurization of the reactor core cavity. for the cavity region was based on a single tube rupture, result ing i n considerable margin t o the top plate l i f t pressure. pressure i s 3.1 bar, and a single tube rupture would resul t in approximately 1 .4 bar. between three and nine simultaneous tube ruptures before exceeding the t o p plate l i f t pressure. Thus , current safety evaluations have begun t o examine the potential for multiple tube ruptures that could exceed the current cavity pressure re1 ief designs.
Tube rupture events resul t in The original design overpressure
The t o p plate l i f t
RBMK p l a n t specific cavity pressure r e l i e f designs provide for
One such scenario being examined i s a par t ia l rupture in a g r o u p dis t r ibut ion header that resul ts in stagnated (low) flow t o up t o 40 pressure tubes. The subsequent fuel heatup in these reduced flow tubes could resul t i n multiple tube ruptures beyond the design re l ie f capacity o f the core cavity. This paper examines several key issues i n evaluating th i s t ransient , including: 1) the effects of low flow, 2 ) the effects of axial peaking, and 3) the e f fec ts of radial peaking, a l l relative t o the time t o tube rupture. These issues each play a significant role i n attempting t o evaluate the likelihood and severity of multiple tube ruptures for a partial group dis t r ibut ion header break. This work was sponsored by the United States Department of Energy under Contract DE-AC06-76RLO 1830.
i

INTRODUCTION
The Russian RBMK reactor core design consists of multiple parallel pressure t u b e channels tha t contain Zr clad, UO, fuel pin bundles. parallel channels are contained within graphite moderator blocks which are, in t u r n , contained within a sealed core cavity. Current safety evaluation e f for t s of the RBMK reactors have been concentrating in the area of tube ruptures within the core cavity and, in par t icular , multiple t u b e ruptures that could threaten the reactor core integri ty . Tube rupture events resu l t in a pressurization o f the reactor core cavity. The original design overpressure for the cavity region was based on a single t u b e rupture, result ing in considerable margin t o the t o p plate l i f t pressure. The t o p p h t e l i f t pressure i s 3.1 bar, and a single tube rupture would result in approximately 1 .4 bar, [1 ,2 ] . and nine simultaneous tube ruptures before exceeding the t o p plate l i f t pressure, depending upon on the plant specific designs. With t h i s f i n i t e margin t o s a fe ty , current safety evaluations have begun t o examine the potential for multiple tube ruptures t h a t could exceed the current cavity pressure r e l i e f designs.
In January of 1994, a topical meeting was convened by the International Atomic Energy Agency in MOSCOW, Russia [3 ] . from t h i s meeting, i t i s has been concluded t h a t propagation o f t u b e ruptures i s unlikely for the RBMK reactor, b u t t h a t "the potential for multlple tube ruptures following partial breaks needs t o be fur ther investigated . I 1
Following a par t ia l rupture of a group distribution header ( G D H ) fo r a c r i t i c a l l y sized break, flow stagnation in the affected fuel channels resul ts in a fuel temperature excursion, leading ultimately t o tube rupture. RBMK spec ia l i s t s argue t h a t the rupture of a single tube will a l lev ia te the flow stagnation i n the header a s t h i s effectively creates a larger break s ize . I t i s argued t h a t t h i s allows suff ic ient reverse flow t o be established, from t h e steam drum, t o cool the fuel in the remaining unbroken tubes. Limited resul ts for calculations of g roup distribution header par t ia l fa i lures were reported. The analysis ut i l ized multiple tube regions on a single group header i n order t o model an assumed power distribution for the header. The power distribution used i s given i n Table 1 (and assumed 42 tubes on a G D H ) .
These
RBMK cavity pressure re l ie f designs provide for between three
As reported in a d ra f t report
I n essence, however, t h e analysis investigated only the f a i lu re of the peak power tube. Depending upon the actual power dis t r ibut ion for tubes along a given header, i t i s possible for multiple tubes t o be operating a t , o r near, the same peak powers. T h u s , i t would be possible for several tubes t o f a i l before suf f ic ien t cooling i s re-established following any i n i t i a l tube rupture. pressure tubes on a GDH opera t ing a t t h e same power. break i n the group header t h a t resul ts i n stagnant flow, a l l 40 tubes would experience similar heatup ra tes , and could t h u s be theorized t o f a i l simultaneously. r e a l i s t i c , however, the purpose of t h i s comparison i s simply t o i l l u s t r a t e t h a t i t i s necessary t o evaluate a limiting condition of operat on for the
This can be best visualized by assuming the limiting case of 40 For a c r i t i c a l l y sized
I t i s known that such a ' f l a t ' power d i s t r ibu t on i s n o t
International Atomic Energy Agency, DRAFT REPORT of a Consultants Meeting on "Mu7 t i p l e Pressure Tube Rupture in Channel Type Reactors", RBMK-SC- 014, dated February 16, 1994.

power dis t r ibut ion a long a group header. assess the likelihood and the number of additional tubes that may f a i l af ter an i n i t i a l tube has ruptured.
With t h i s , i t i s then possible t o
Table 1. GDH Power Distribution
. . . .
. . . . .. . . . . . . . . . . . . . . . . . . ..
In order t o adequately assess th i s issue, i t i s necessary t o perform cal cul a t i ons for different s i zed header breaks, and with d i f fe ren t power dis t r ibut ions. dis t r ibut ions within a group header, th i s could theoretically require an unlimited number of calculations t o be made (one for each power d is t r ibu t ions) . Clearly, i t i s n o t practical t o a t tack t h i s issue with an unlimited number of calculations. Instead, i t i s proposed t o characterize tube f a i l u r e times for different power (and flow) dis t r ibut ions and then cross-reference t h i s information with additional analyses of par t ia l header breaks. The header break analyses would define the minimum number of tubes that would be required t o f a i l in order t o establish adequate reverse flow. A t t h i s time, i t is assumed t h a t one tube rupture may n o t be suf f ic ien t t o a l lev ia te the stagnant flow condition prior t o additional tube ruptures. Cross-referencing the resu l t s of these two evaluations, a reference data base could be established t h a t can identify the number o f tubes tha t could be expected t o f a i l for a given power distribution and partial header break.
Because there are vir tual ly an unlimited number of tube power
This paper examines the minimum time t o tube fa i lure for a variety of power d is t r ibu t ions and stagnant flow conditions t h a t could be expected for a g roup header fa i lure in order t o address the potential for multiple tube ruptures. The resu l t s of t h i s analysis will form only the i n i t i a l phase o f the g roup header fa i lure analysis. The second phase, which i s proposed t o be completed a t a l a t e r date, will characterize the break i t s e l f . T h i s would provide the necessary estimate o f the stagnant f l o w conditions and the time required for reverse flow t o be established in the unbroken tubes a f t e r an i n i t i a l tube has ruptured. Once th i s i s accomplished, a comparison of actual power d is t r ibu t ions within operating RBMKs can be made against t h i s d a t a base t h a t can estimate the maximum number of tube ruptures t h a t could occur, without having t o perform new calculations for each unique power dis t r ibut ion.
RBMK REACTOR DESIGN
The RBMK reactor i s a graphite-moderated, vertical pressure tube,
There are 1661 pressure tubes
boiling water reactor. The reactor type characterized in t h i s report i s f o r an RBMK-1000 reactor. The reactor core and re f lec tor form a cylindrical stack with diameter of 13.6111 and height of 8m. penetrating the s tack , centered in 25cm square graphite blocks t h a t form the
2

graphite moderator. The fuel contained within each pressure tube i s 2% enriched uranium oxide with a Zr-1% Nb cladding. Nb. There are two 18-pin fuel bundles in each pressure tube, approximately 3.5m each. The bundles hang from a carrier rod, and the fuel forms two concentric rings of 6 and 12 fuel pins. Hydraulically, the reactor consists of two primary coolant loops , each swvicing half the core. steam drum separators, t h a t are common with the other loop a t the steam header, and four main circulation pumps, three operating and one for reserve ( for a t o t a l o f eight coolant pumps,.six opera t ing) . The main coolant pumps discharge into two main headers tha t supply 22 d i s t r i b u t i o n headers each, for a total o f 44 headers. These distribution headers supply coolant t o the 1661 pressure tubes, w i t h approximately 40 pressure tubes each. The coolant i s directed up through the fuel channels a t 37,60Ot/hr. The average core out le t quality i s 14.5%. Individual tube flow i s adjusted manually via an i n l e t t h ro t t l e valve. Outlet connector piping then routes the two-phase coolant up t o the steam drum separators, located above the core, for vapor separation. The drum separators essent ia l ly use screen 'dryers t o produce steam a t 0.1% humidity (moisture). Nominal operating pressure a t the drum i s 6.97MPa. Steam i s then supplied t o one or both of two 500MWe turbines. the turbine condensers i s reheated t o 27OoC, and returned t o the primary loop a t the steam drums.
The pressure tubes are Zr-2%
Each l o o p has two
Condensate from
RELAPS MODEL.DESCRIPTION
A base RELAP5 model was developed t h a t represents one-quarter of an RBMK reactor core, approximately 416 fuel channel tubes. The nodalization i s setup t o perform a detailed calculation o f an affected core region (such as for a single o r multiple tube rupture o r blockage). The balance of the 1/4 core i s lumped into a single tube t o allow the RELAPS model t o predict f lu id conditions in the steam drum and i n l e t distribution headers. I t was f e l t t h a t a simple s ingle tube model, w i t h boundary conditions for these regions, would n o t allow suf f ic ien t degrees o f freedom i n the calculation t o provide accurate resul ts . The nodalization scheme in shown in Figure 1. A 1/4 core model i s used as t h i s i s the minimum size needed t o include a steam drum model. .The two fuel region model allows for one or more affected tubes (fuel channels) t o be modeled separate from the i n t a c t core with only minpr modifications required specif ic t o the transient being simulated.
The affected tube i s modeled hydraulically u s i n g 9 in le t connector volumes, 16 axial fuel volumes (14 active fuel regions), 6 upper tube volumes, and 5 out le t connector volumes. This nodalization allows for detailed pressure and temperature monitoring, and ease of defining the tube r u p t u r e location for different events w i t h o u t s ignificant changes t o the base model. The in tac t core i s modeled using.5 inlet connector volumes, 7 axial fuel volumes (5 active fuel regions), 5 upper tube volumes, and 5 ou t le t connector volumes. Overall , the 1/4 core model represents 416 fuel channels, typically a single affected channel and 415 lumped channels.
The steam drum separator i s modeled using 14 volumes. This i s also shown in Figure 1. This modelling detail allows for a more accurate inventory calculation, and in par t icular , a more accurate prediction of the f lu id conditions for reverse f low into the affected tube ( s ) . There are additional
3

volumes fo r the in l e t sparger volume ( f o r feedwater return), an ou t le t downcomer f o r coolant return t o the primary coolant pumps (PCPs), and steam piping volumes leading t o the turbines. The turbines, PCPs, and feedwater return pumps are not modeled expl ic i t ly . They are approximated using time dependent volumes t o supply the necessary boundary condi t ions , with the fluid conditions taken from plant operating da ta . The steam drum i s sized t o represent a s ingle drum for the 1/4 core model.
The heat structures modeled include the fuel pins and ca r r i e r rod, pressure tube and surrounding graphite, and the i n l e t and out le t connector piping walls.. No heat structures are modeled a t t h i s time for the steam separator. The affected tube for b o t h models contains two fuel pin heat structures t h a t represent an equivalent of 6 and 12 fuel p i n s lumped together t o represent the 18 fuel pins per rod bundle. T h i s al lows radial power peaking t o be modeled for the 6 inner and 12 outer fuel rings of the fuel bundle. representing an equivalent o f 18 fuel pins lumped together.
The unaffected tubes are modeled with a single heat s t ructure
For the affected core, the RELAPS/MOD3 radiat ive heat' t ransfer model i s used. Radiative heat t ransfer between the inner fuel ring, outer fuel ring, carr ier rod , and tube wall i s modeled. Appropriate view factors were calculated f o r each heat s t ructure component. Preliminary calculations were made t o investigate the surface emissivity for the fuel cladding and tube wall. Emissivity values of 0.5, 0.6 and 0.7 were evaluated. This range i s considered t o be a typical range for Zr (the cladding and tube wall mater ia l ) . An average value of 0.6 was chosen for the calculations presented here, as the preliminary r e su l t s d i d n o t show a s t rong dependence over t h i s range o f emissivity.
Instead, reactor power i s maintained constant until a reactor scram i s expected t o occur. A power decay curve i s then used t o predict the power runback. i s considered acceptable for rupture or blockage events involving only a limited number of tubes. T o t a l core power will n o t be signif icant ly impacted due t o r eac t iv i ty feedback, and conservative peaking factors can be chosen t o 'account f o r local power perturbations in the affected tube(s ) . radial peaking factors are ad jus t ed as desired for the t ransient being analyzed. The base peaking values assumed are a radial peaking of 1 .0 ( a n average power tube) and an axial peaking of 1.09 (chopped cosine). Heat generation w i t h i n the core i s assumed t o be s p l i t 94.5% in the fuel and 5.5% i n the graphite.
Reactivity feedback i s n o t modeled with the RELAP5 model.
This
Axial and
Detailed control system data were not available when the model was developed, and so simplified cont ro l systems were assumed based on expected performance character is t ics . For the transient analyses presented in th i s paper, these assumptions have negligible impact . Steam drum pressure and level are assumed t o remain relat ively constant over the time interval of the flow reductions investigated, 20 t o 60 seconds, and so simple controls are modeled t o maintain constant pressure and level. are also approximated w i t h time dependent volumes, with controls tha t maintain a constant d i f fe ren t ia l pressure between the steam drum downcomer (essent ia l ly the PCP suction) and the distribution headers (essent ia l ly the PCP discharge).
The primary coolant pumps
4

I
The reactor l o o p flow i s s e t by adjusting the in l e t control valves t o the pressure tubes until the desired flow i s established in the affected and unaffected pressure tubes.
Trip logic i s added t o provide additional control of the t ransient . This includes logic t o i n i t i a t e the desired event, such as a fa i led i n l e t c o n t r ~ ? valve t o the pressure tube, and logic t o i n i t i a t e a tube rupture upon detecting h i g h tube wall temperature ( a t a predetermined f a i lu re temperature).
ANALYSIS DISCUSSION AND RESULTS
A par t ia l group d i s t r i b u t i o n header f a i lu re resul ts in stagnant (low) flow t o multiple process channels. Simulation o f a t u b e f a i lu re due t o t h i s s t agnan t flow condition was performed for a single tube in order t o evaluate time t o f a i lu re for various power and flow dis t r ibut ions. These analyses assumed no reactor shutdown would occur until a f t e r tube rupture has occurred. The simulation was accomplished by reducing i n l e t flow t o a single channel t o a predetermined flow, effectively simulating a par t ia l header f a i lu re for t h a t tube. Based on resul ts presented in [ 4 , 5 ] , and flow dis t r ibut ion calculations presented in t h i s paper, the flow reduction was se t t o 6% of the i n i t i a l tube flow for the power dis t r ibut ion cases. tube f a i lu re . fa i lure , as do higher flows. tube wall temperature o f 650°C, [1,2].
stagnant ( low) flow condition i s investigated. Analyses of the Leningrad tube rupture indicate that the minimum time t o tube fa i lure occurs a t a flow reduction between 4% and 6% of the in i t i a l tube flow, [4,5]. fu l ly s t a g n a n t and higher flows yield longer times t o tube fa i lure . be expected for a header break. Second, axial power dis t r ibut ion i s investigated for b o t h the axial peak-to-average ( P / A ) , and the location of the peak. High axial peaking coupled with t o p skewed profiles would be expected t o yield f a s t e r t u b e f a i lu re times as the upper fuel region would receive only steam cooling for a longer period of time. d i s t r bution i s investigated for tube powers between the core average and peak power tube. The Leningrad tube rupture i s estimated t o have occurred w i t h i n 40-45 seconds a f t e r the flow reduction. However, th i s was for an average power tube, 2.OMW, and the maximum RBMK t u b e power allowed i s 3.OMW. Higher power tubes would be expected t o f a i l sooner. Each of these analyses i s discussed separately below.
This results in the minimum time t o Zero flow ( fu l ly stagnant) yields s l igh t ly longer times t o
Tube fa i lure i s assumed t o occur a t an average
Results are presented for each of three areas investigated. f i r s t , the
Similar phenomena would
Third, the radial-power
Flow Distribution Results
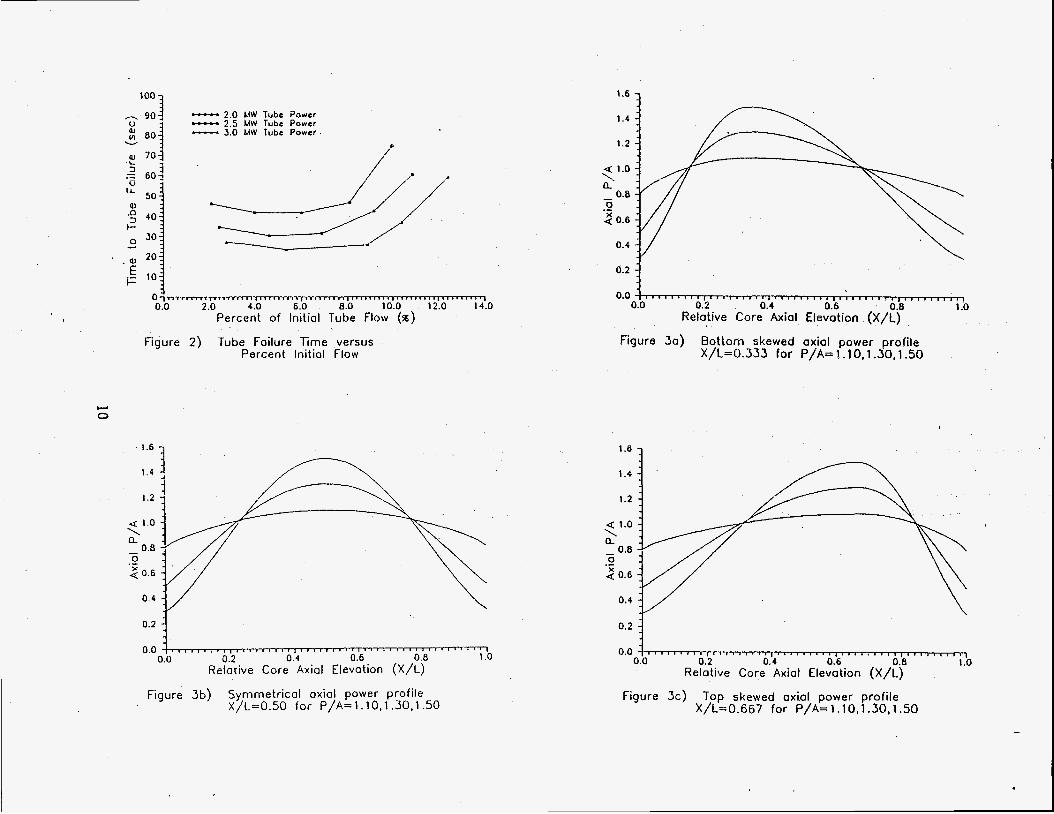
The flow distribution calculations were performed for flow reductions varying between 2% and 12% of the in i t i a l tube flow, for tube powers of 2.OMW, 2.5MW and 3.OMW. In i t i a l tube flows for these t u b e powers were assumed t o be 6.30, 7.86, and 8.43kg/sec, respectively. These were performed for an a x i a l peaking of 1-10, a t a re la t ive core axial elevation of 0.667. figure 2 i l l u s t r a t e s the calculated times t o tube fa i lure versus the reduced flow. The minimum tube fa i lure time i s seen between the reduced flows of 4% t o 8% for each tube power. This minimum i s attr ibuted t o optimization o f t he heat
5

transfer t o the t u b e wall between radiative and convective heat t ransfer . For extremely low flows, heat t ransfer t o the wall i s dominated by radiat ive heating from the h o t fuel . A t s l igh t ly higher flows, the fuel heat i s more e f f i c i en t ly transported t o the tube wall with radiat ive and convective heat t ransfer , b u t the flow ra t e i s insuff ic ient t o transport the energy o u t of the fuel region. A t even higher flows, the fuel heat i s transported o u t o f the core region, maintaining lower fuel and tube wall temperatures.
Power Distribution Results
The power distribution. calculations were performed i n two steps. F i r s t , axial power peaking was investigated for peak-to-average (P/A) r a t i o s of 1.10, 1.30, and 1.50. reactors. The prof i les are i l l u s t r a t ed in Figures 3a,b,c. These axial peaking values were analyzed a t re la t ive axial core elevations o f 0.333, 0.50 and 0.667 fo r a.tube power of 2.OMW (an average power t u b e ) . From above, a reduced flow of 6% of the i n i t i a l f low was assumed for each calculation t o o b t a i n the minimum time t o tube fa i lure . Figure 4 i l l u s t r a t e s the calculated times t o tube fa i lure . The minimum tube f a i lu re times for the 0.50 and 0.667 axial peak are dominated by the higher l inear heating rates a t the axial peaks. However, for the 0.333 axial peak, the f l a t t e r axial p rof i le yielded fas te r times t o fa i lure . T h i s i s attr ibuted t o the higher heating ra tes a t the core end region. Tube f a i lu re was predicted t o occur i n the l a s t meter of the core, between s ix and seven meters, for a l l three axial P/A curves for the 0.5 and 0.667 x/l profiles. For the 0.333 x/l prof i les , the 1.30 and 1.50 axial P/A curves resulted i n tube fa i lure occurring between f ive and s i x meters, one t o two meters below the top of the core. The f l a t t e r 1.10 ax ia l profile, t h o u g h , s t i l l predicted tube fa i lure i n the l a s t meter due t o the higher core end region power. As would be expected t h o u g h , f a s t e r tube fa i lure times are seen for similar l inear heating ra tes a t higher axial elevations i n the core.
ranging from 2.0 t o 3.OMW, a t 0.25MW intervals. These were performed a t axial peakings o f 1.10 and 1.30, and a t re la t ive axial core elevations of 0.50 and 0.667. Again, a reduced flow of 6% of the i n i t i a l flow was assumed t o o b t a i n the min imum time t o tube fa i lure . Figure 5 i l l u s t r a t e s the calculated times t o tube f a i lu re . The tube fa i lure times are f a i r l y l inear w i t h the to ta l tube power for a given axial P/A. Minimum time t o tube f a i lu re i s approximately 23 seconds for a 3.OMW tube power, as compared t o the 44 seconds tha t was calculated fo r a 1-10 axial P/A a t 2.OMW (approximately the Leningrad tube conditions).
These values are expected t o be representative fo r RBMK
Second, radial peaking (tube power) was investigated for tube powers
CONCLUSIONS
The RBMK process tube channels were investigated for time t o f a i lu re over a range df power dis t r ibut ions and stagnant (low) flow. As reported i n [4,5] for an average power tube, over a range o f low flow t o a channel the m i n i m u m time t o tube f a i lu re will occur between 4% and 6% of i n i t i a l flow. This i s consistent w i t h the resu l t s o f this report . This i s impor tan t re la t ive t o the partial header break i n t h a t fu l ly stagnant (zero) f low i t is n o t necessarily the worst condition for e v a l u a t i n g the c r i t i ca l break s ize . A
6

break size resulting in 6% of the initial channel flow results in a minimum tube failure time and, creates the added penalty of requiring the initial tube rupture(s) to overcome (reverse) this positive flow before sufficient reverse flow is established in order to preclude additional tube failures in the remaining affected tubes. That is, additional tube failures may be necessary before suff i ci ent reverse flow i s establ i shed.
Axial peaking is important to the initial heatup. For a given peak linear heating rate, the higher the relative location o f that peak the sooner the tube will fail. This is true except for a relatively flat profile as seen for the 1.10 P/A results. For this profile, the core end region power becomes more significant than just the peak linear heating rate. trade off against flattening core axial peaking in that flatter profiles can become more limiting if core end region powers become too high. extremely flat profiles and top skewed profiles with a high P/A will result in the fastest tube failure times.
This presents a
In short,
Clearly, tube power plays a strong role in determining minimum time to
This is extremely important when evaluating the 1 i kel ihood of
failure following a flow reduction. Failure times varied fairly linearly for tube powers between 2.25 and 3.OMW, from approximately 34 to 22 seconds, respectively. additional tube failures when one considers the possible ranges of tube power distributions along a group header. the difference in time to failure for 2.38 versus 3.OMW calculated in this report is approximately 10.0 seconds. This has the potential for allowing sufficient time to establish reverse flow (assuming one tube failure is sufficient) that would cool the remaining tubes. However, if the two peak tube powers are 2.38 and 2.5MW (for example a group header supplying the core fringe), then the difference in time is only approximately 2.0 seconds. Without additional analysis, it is not clear that this is sufficient time to quench the next hottest tube.
For the distribution shown in Table 1,
By themselves, these results are inconclusive about the likelihood of multiple tube ruptures for a group distribution header partial failure. However, they are intended to form an initial data base that would be cross- referenced with additional calculations of partial group header breaks. Once calculations have been made that adequately characterize the establishment of reverse flow following the initial tube rupture, cross-referencing the minimum times to failure for any power distribution can produce an estimate of the number of tubes that could be expected t o fail for a partial header break. The characterization of the header break is the next step for this proposed approach.
7

REFERENCES
1. Cherkashov, Yuri M . , "RBMK NPP Safe ty" Workshop o f S a f e t y o f Sov ie t - Design Nuclear Power P l a n t s , Chicago I l l i n o i s , November 20-21, 1992.
2 . Gabaraev, B., Yu. N i k i t i n , 0. Novoselsky, "An Assessment o f t h e RBMK Core Cav i ty Overpressure P ro tec t ion P ip ing System f o r Simultaneous Rupture o f Several Pressure Tubes", RDIPE-PNL Workshop on N-Reactor Lessons, Rich1 and, WA, July 20-22, 1993.
3 . I n t e r n a t i o n a l Atomic Energy Agency, "Mu1 t i p l e Pressure Tube Rupture i n Channel Type Reactors" Topical Meeting, Moscow Russia , 31 January - 4 February, 1994.
4. Russian Academy o f Sc iences , I n s t i t u t e o f Nuclear S a f e t y , "Development
5.
o f SCDAP/RELAP5 Model f o r the RBMK Graphi te Reac tor , " 1993.
Tsi kl auri , G . , 6. Schmit t , "RELAPS/MOD3 Code Assessment f o r P res su re Tube Graphite-Moderated Boi l ing Water Reac tors , " Proceedings o f I n t e r n a t i o n a l Conference on "New Trends i n Nuclear System Thermohydraul i c s " , V1, pg. 573
8

(u h
y; f
A I I
c El) .- d el
Lu a 0 E F
I I
0 N 0
0 2 l
9
1.4
1.2
0.2 -
0.0
704
.= 602 U
L L
P)
t-
3 3
50 n 3 4 0
o 3o
. .a 20 - .E 10 I-
0.0 2.0 4.0 6.0 8.0 10.0 12.0 14.0 Percent of Initial Tube Flow (w)
Percent Initio1 Flow Figure 2) Tube Failure Time versus
I I I ~ ~ . . . ~ , " " ' ~ ' ~ ' l ~ " " ' " ' " ' ' ' ~ I ' ~ ' I " - ~ ' ' -
c'. 0
1.6 3
1.4
1.2
- 2.0 M W Tube Power - 2.5 MW Tube Power - 3.0 MW lube Power
,/O
4 1.0 \ a
0.8 0
3 0.6 - .-
0.4
0.2 4 0.0 ...................................................
0.0 0.2 0.4 0.6 0.8 1 .o Relative Core Axial Elevation (X/L)
Figure 30) Bottom skewed axial power profile X/L=0.333 for P/A= 1.10,1.30,1 S O
1.6 2
1.4
1.2
0.4
, ~ , , , . , , , , , , , , , ~ , , , , , , * , , , , , , , , , , , , , . , , l , . , , , , , ~ ~ 0.0 0.2 0.4 0.6 0.8 1 .o
Relative Core Axial Elevotion (X/L)
Figure 3c) Top skewed axial power profile X/L=0.667 for P/A= 1 . lo, 1.30,1.50

V/d V/d OC'I OS'1 YII - \ V/d 01'1 -
c 0
C [T m W C
- O ' O t 4
2 - 0'0s 5 m n VI m 0 v
- 0.09
Attachment C
"Thermal-hydraulic Instabilities in Pressure Tube Graphite-moderated Boiling Water Reaqtors It
IN PRESSURE TUBE GW€€ITE - MODERATED
BOILING WATER REACTORS
G. Tsiklauri, B. Schmitt Battelle Pacific Northwest Laboratory, USA
.
ABSTRAa
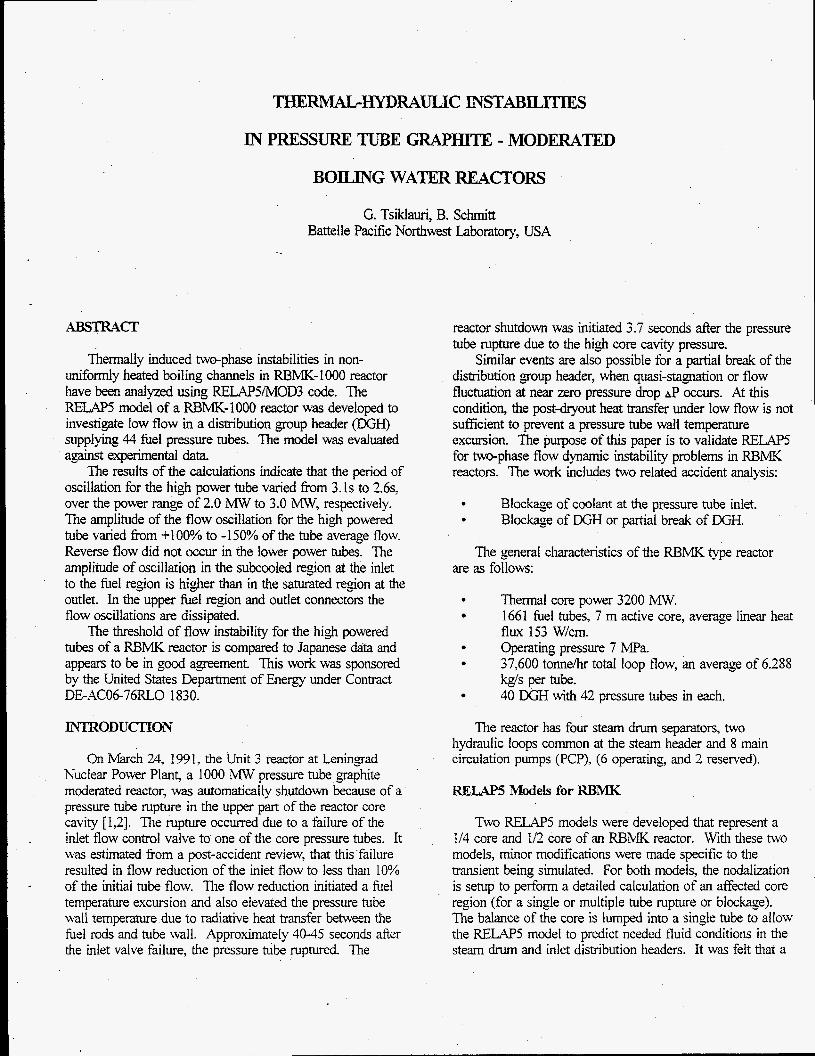
Thermally induced two-phase instabilities in non- uniformly heated boiling channels in RBMK-1000 reactor have been analyzed using RELAPSMOD3 code. The RELAPS model of a RBMK-1000 reactor was developed to investigate low flow in a distribution group header (DGH) supplying 44 fuel pressure tubes. The model was evaluated against experimental data.
The results of the calculations indicate that the period of oscillation for the high power tube varied fiom 3.1s to 2.6s, over the power range of 2.0 MW to 3.0 PAW, respectively. The amplitude of the flow oscillation for the high powered tube varied fiom +loo% to -150% of the tube average flow. Reverse flow did not occur in the lower power tubes. The amplitude of oscillation in the subcooled region at the inlet to the fuel region is higher than in the saturated region at the outlet. In the upper fuel region and outlet connectors the flow oscillations are dissipated.
The threshold of flow instability for the high powered tubes of a RBMK reactor is compared to Japanese data and appears to be in good agreement. This work was sponsored by the United States Department of Energy under Contract DEAC06-76RLO 1830.
INTRODUCJXON
On March 24, 199 1, the Unit 3 reactor at Leningrad Nuclear Power Plans a 1000 MW pressure tube graphite moderated reactor, was automatically shutdown because of a pressure tube rupture in the upper part of the reactor core cavity [1,2]. The rupture occurred due to a failure of the inlet flow control valve to one of the core pressure tubes. It was estimated from a post-accident review, that this failure resulted in flow reduction of the inlet flow to less than 10% of the initial tube flow. The flow reduction initiated a fuel temperature excursion and also elevated the pressure tube wall temperature due to radiative heat transfer between the he1 rods and tube wall. Approximately 40-45 seconds after the inlet valve failure, the pressure Gbe ruptured. The
reactor shutdown was initiated 3.7 seconds after the pressure tube rupture due to the high core cavity pressure.
Similar events are also possible for a partial break of the distribution group header, when quasi-stagnation or flow fluctuation at near zero pressure drop aP occurs. At this condition, the post-dxyout heat transfer under low flow is not sufficient to prevent a pressure tube wall temperature excursion. The purpose of this paper is to validate R E M 5 for two-phase flow dynamic instability problems in RBMK reactors. The work includes two related accident analysis:
Blockage of coolant at the pressure tube inlet. Blockage of DGH or partial break of DGH.
The general characteristics of the RBMK type reactor are as follows:
Operating pressure 7 m a .
Thermal core power 3200 MW. 166 1 fuel tubes, 7 m active core, average linear heat flux 153 W/cm.
37,600 tonne/hr total loop flow, an average of 6.288 kg/s per tube. 40 DGH with 42 pressure tubes in each.
The reactor has four steam drum separators, two hydraulic Imps common at the steam header and 8 main circulation pumps CpCP), (6 operating, and 2 reserved).
RELAP5 Modeb for RJ3MK
Two RELAPS models were deveioped that represent a 114 core and 1/2 core of an RBMK reactor. With these two models, minor modifications were made specific to the transient being simulated. For both models, the nodalkition is setup to perform a detailed calculation of an affected core region (for a single or multiple tube rupture or blockage). The balance of the core is lumped into a single tube to allow the RELAPS model to predict needed fluid conditions in the steam drum and inlet distribution headers. It was felt that a
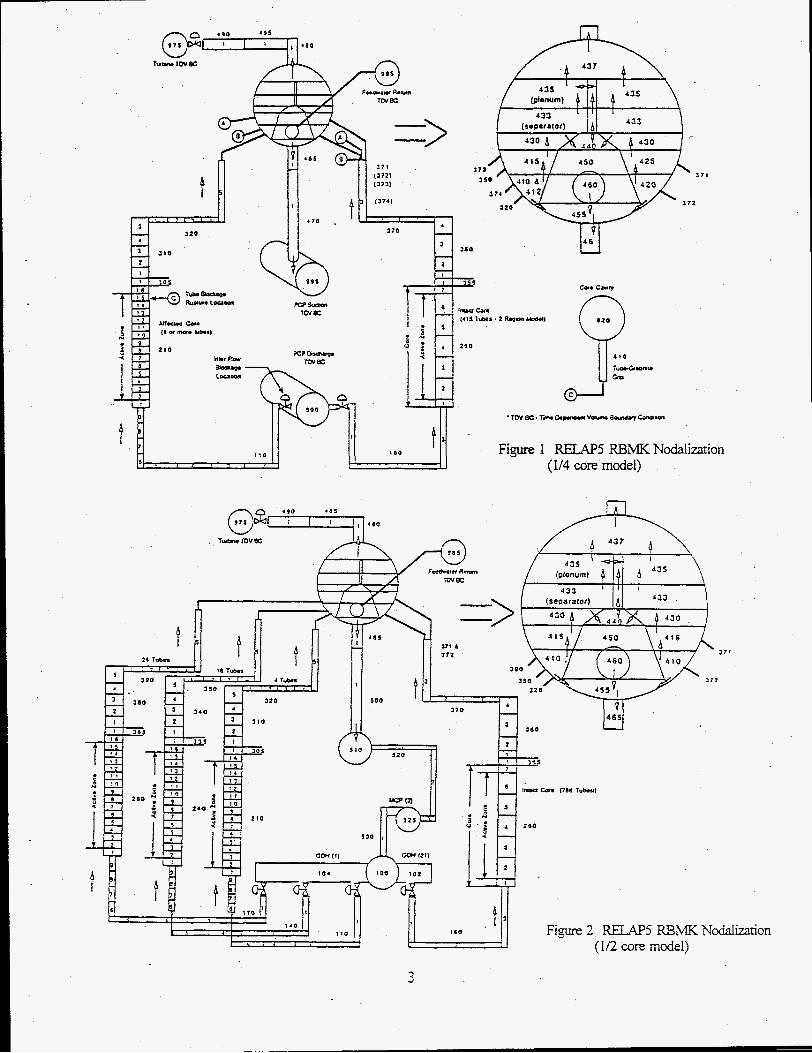
simple single tube model, with boundary conditions for these regions, wouid not allow sufficient degrees of freedom in the calculation to provide accurate results. The nodalimtion schemes for both models are shown in Figures 1 and 2. RBMK design data were provided by [1,2,3].
The 114 core model assumes a 114 core symmetry for the RBMK, contains two parallel fuel regions for the reactor core, and uses boundary conditions for the main coolant pump (Fiewe 1). A 1/4 core model is the minimum size needed to include a ste_am drum model, and is readily adaptable for assuming conservative core power distributions (i.e. assuming high/low power regions). The two fuel region model allows for one or more 'afhted' tubes (fuel channels) to be modeled separate from the intact core for events such as tube rupture or blockage. The 1/2 core model contains four parallel fuel regions for the core, and a pump model to provide a complete loop simulation. The 1/2 core representation allows a more accurate calculation of the core average conditions as the RBMK core is split in-two hydraulically.
For both models, the affected tube is modeled hydraulically using 9 inlet connector volumes, 16 axial he1 volumes (14 active fuel regions), 6 upper tube volumes, and 5 outlet connector volutnes. This nodalization allows for detailed pressure and temperature monitoring, and ease of d e f ~ n g the tube rupture location- for different events without significant changes to the base model. The intact core is modeled using 5 iniet connector volumes, 7 axial he1 volumes (5 active fuel regions), 5 upper tube volumes, and 5 outlet connector volumes (these outlet C O M ~ ~ ~ O ~ S are set up to allow for future model expansions as needed). In the three channel model, a third channel is modeled hydraulically with the same detail as the affected core. Overall, the two channel model (1/4 core) represents 416 fuel channek, typically a single 'affected' channel and 415 lumped channels. The four channel model (1/2 core) represents 830 fuel channels, typically one or more 'affected' channels, two sets of parallel channels for the balance of the 4 4 tubes on one DGH, and the remaining 786 lumped channels.
This is shown in Figures 1 and 2. This modelling detail allows for a more accurate inventory calculation, and in particular, a more accurate prediction of the fluid conditions for reverse flow into the affected tube(s). There are additional volumes for the inlet sparger volume (for feedwater return), an outlet downcomer for coolant r e m to the main coolant pumps (MCPs), and steam piping volumes leading to the turbines. The turbines and feedwater return pumps are not modeled explicitly. They are approximated using time dependent volumes to supply the necessary
The steam drum separator is modeled using 14 volumes.
boundary conditions, with the fluid conditions taken fiom plant operating data. The steam drum is sized to represent a single drum for the 1/4 core model, and two steam drums for the In core model.
The heat structures modeled include the fuel pins and Carrier rod, pressure tube and surrounding graphite, and the inlet and outlet connector piping walls. No heat structures are modeled at this time for the steam separator. The affected tube for both modeIs contains two fuel pin heat structures that represent an equivalent of 6 and 12 fuel pins lumped together to represent the 18 fuel pins per rod bundle. This allows radial power peaking to be modeled for the 6 inner and 12 outer fuel rings of the fuel bundle. The unaffected tubes are modeled with a single heat structure representing an equivalent of 18 fuel pins lumped together.
transfer model is used. Radiative heat transfer between the inner fuel ring, outer fuel ring, carrier rod, and tube wall is modeled. Appropriate view factors were calculated for each heat struchuz component. Preliminary calculations for the tube blockage event were made to investigate the surface emissivity for the fuel cladding and tube wall. Emissivity values of 0.5, 0.6 and 0.7 were evaluated. This range was considered to be typical for Zr (the cladding and tube wall material). An average value of 0.6 was chosen for the calculations presented here, as the preliminary results did not show a strong dependence over this range of emissivity.
The 112 core model was developed to investigate low flow induced oscillation (Figure 2). The model contains 4 core regions, three within the affected DGH representing 44 tubes, and one for the balance of the core. The three affected tube regions were defined as 4 high power tubes (ranging from 2.2 h,Iw to 3 .O MW per tube), 18 medium power tubes (set at 2.2 MW per tube), and 22 low power tubes (set at 1.6 MW per tube). This distribution was based on previous work done at PNL for post-Chemobyl neutronics analysis [4].
The low flow condition for the affected DGH was simulated by defining a time dependent junction at the inlet to the DGH to provide the desired flow conditions. Total power for the 4 tube core region was set at a predetermined power for each case analyzed (2.2 MW, 2.4 MW. 2.6 MW, and 3.0 MW). The model was run to achieve a steady state solution for full power/full flow, and then flow reduced to the affected DGH slowly until the point of flow instability was seen. The point of flow ;nStability w . ~ defined as an oscillation amplitude of +/-30%. Flow to the DGH was then held constant at the point of instability to observe the "stabilization" of the flow instability.
For the affected core, the RELAPSMOD3 radiative heat
2
PIS
I i M
I t 3
- I 6 0 6 .
I t o
Co. c n w
li
3
CODE VERIFICATION
The fust stage of verification includes calculation for steady-state parameters in the RBMK and some transient calculation against known experimental data Limited results for code Verification were presented at [5]. Results from the investigation of a tube blockce are presented.
The seconds stage of verification is for low flow instability. The RBMK calculations are compared against Japanese experimental data [6] for Type II threshold of flow instability. A sensitivity study of the RELAPS model is included with the comparison.
RESULTS AND ANALYSIS
Tube Blockage
A series of tube blockage cases were evaluated with the . 1/4 core model. Briefly, the Leningrad tube rupture was
initiated by a failure ofthe inlet flow control valve to one of the core pressure tubes. It was estimated from a post- accident review, that this failure resulted in a flow reduction of the inlet flow to less than 10% of the initial tube flow. The flow reduction initiated a fuel temperature excursion and also elevated the pressure tube wall temperature due to radiative and convective heat transfer between the fuel and the pressure tube wall. Approximately 40-45 seconds after the inlet valve failure, the pressure tube ruptured in the upper core. A reactor shutdown was initiated 3.7 seconds after the pressure tube rupture due to the high core cavity pressure.
performed over the potential range of inlet flow blockage. Each calculation assumed an instantaneous reduction in the inlet valve flow area to simulate the valve failure of the Leningrad event. A total of five calculations were made, varying the inlet flow blockage to obtain a range of flow reduction between 2%10% of the initial tube flow. Initial tube flow was 6.3 kg/s. Fuel cladding and pressure tube wall temperatures were evaluated every 0.5m with the 1/4 core model. It was assumed that pressure tube failure (rupture) would occur at an average tube wall temperature of 923K (65OOC). This is the temperature at which tube softening is estimated to occur that then results in tube rupture. With 0.5m volume nodalizations for the 7m active fuel region, the tube failure location was calculated to be either at the 6.25m or 6.75m core elevation, depending upon the individuai case. A plot of the time to pressure tube failure was made for the five calculations, and is shown in Fiapre 3 a A minimum time to tube rupture of approximately 42 seconds was calculated (compared to the estimated time of 40-45 seconds).
To evaluate this event, a parametric study was
An evaluation was also made of the general transient response, with reactor shutdown, for one of the calculations. Figures 3b through 3d show the results from an approximate 6% flow blockage calculation. Initial tube flow for this calculation was reduced from 6.3 kg/s to 0.38 kg/s. In each of these figures, a null transient is run to ensure steady state conditions have been reached prior to initiation of the blockage (e.g., the blockage occurs at 30 seconds). F@re 3b is the pressure tube inlet flow response. Figure 3c is the fuel cladding temperature response, and Figure 3d the pressure tube inner wall temperature response, for selected nodes. Refer to Figure 1 for the nodalization numbers. For this calculation, the tube was estimated to rupture 42 seconds after initiation of the blockage. A reactor shutdown was initiated 3.7 seconds after the rupture, resulting in the eventual quenching of the fuel cladding and pressure tube wall. Peak cladding temperature was calculated to be 1490K (1217°C) for this case. The general responses for this transient appear to be physically consistent.
Blockage of DGH
Low flow, high power instabilities were investigated using the 112 core model shown in Figure 2. ?he instabiiity is initiated by reducing flow to the affected DGH, using a time dependent junction (simulating a partial blockage), while maintain'n~ constant power. A nodalization and time step size sensitivlty study was also performed. The results of the sensitivity study are presented first.
Sensitivity Study
Three areas af modeling sensitivity were investigated. These were core ndization, outlet (steam) pipe nodalization, and time step size. The core nodalization study investigated three fuel region nodalizations; 7 , 14 and 28 axial fuel nodes. The steam pipe nodalization study investigated three steam outlet pipe nodalizations; 2. 5 and 10 steam pipe nodes. The time step study was performed for three different time steps- sizes; 2ms, 1 O m s and 12.5ms, for two different core nodalizations, 7 and 14 fuel region nodes. For the two nodalintion studies, the time step size used was 12.5ms. ?his time step size is the inherent R E M 5 Courant limit for the model.
model with a 60 second null (steady state) transient then reducing flow to the affected DGH from 276.5kgs to 5Ok~Jsec between 60 and 560 seconds. The 50kgk flow is then maintained constant from 560 to 660 seconds to observe the flow instability. The time step study was performed by initializing the model with a 60 second null transient, then reducing flow to the affected DGH fkom
The nodalization study was performed by initializing the
4

lnlel flow Blockoge
*---* Tube Ruplure Time Tim4 lo Tube Failure Aller Blockage
- - Leningrad Eslimoted Time
/ /
20.0 . 0.00 0.10 0.20 0.30 0.40 0.50 0.60 0.70 Flow (kg/sec)
1 1600.0
1400.0
h
v 1200.0
u L 3' - 1000.0 2 p ij 800.0 +
6CO.O i Figure 3a Time to Faiiure
Inlet f low Blockage Fuel Cladding Tcmpcroture
I .
210-5 210-7 210-9 210-11 210-12 210-13 210-14 210-15
400.0 1 . . . , . . . . . , . , , . . . . . . 1
1 0 0 150 200 250 0 50 Time ( 5 )
Fi,m 3c Cladding Temperature
I0.O~ 8.0
lnlul f l o w Blockoge Tube lrtlal f l o w Response
. - * - Tube lnlel f l o w
1000.0 h
v Y
? - 800.0 2 n E
l- 600.0
Fiawe 3b Inlet Flow
lnlcl flow Blockage lube Wall Tcmpcralurc
4M.O - L--- '0 0
100 Time I I . . ( 5 ) , 150 , , , , I , * , 200 , I , , , . , , , , 250 ,'1
Fi,oure 3d Tube Wall Temperature
5

276.5kgs to 6Okgsec between 60 and 120 seconds. The 60k& flow is then maintained constant from 120 to 180 seconds to observe the flow instability (a flow of 60kgls was chosen as this was closer to the point of instability for the DGH than 50kgls).
The core region nodalization study was perfomed for three noding schemes; 7, 14 and 28 fuel region nodes. The results are shown in Figures 4a and 4b. The 14 and 28 fuel node results behave very similarly. They exhibit initiation of flow instability at very nearly the same flow, and although they differ slightly during the first 10 seconds of instability (Figure 4% fiom 450 to 460 seconds), once the instability has reached a stable period they maintain similar frequencies of oscillation (although off-set slightly). The 7 node results, however, show a significantly lower point of instability initiation (Figure 4a) and frequency of flow oscillation (Figure 4b). The 7 and 14 node results do show similar amplitudes of oscillation, with the 28 node results showing a larger amplitude.
The steam pipe nodalization study was performed for three noding schemes; 2 , s and 10 steam pipe nodes. The results are shown in Figure 5b. The results for the 5 and 10 steam pipe nodes behave very similarly. They exhibit similar initiation of flow instability and period of oscillation, differing in amplitude of oscillation only slightly during the first 10 seconds of instability (Figure 5, fiom 450 to 460 seconds). Once the instability has reached a stable period, they maintain similar flow oscillation amplitude and frequency. The 7 node results, however, show a significantly lower point of instability initiation, and frequency of flow oscillation. All three cases show similar amplitudes of oscillation.
The time step sensitivity study was pedormed using the 7 and 14 node fuel region models (with 5 steam pipe nodes), and three different time step sizes for each; 12.5ms, lOms, and 2ms. Fi,pres 6a and 6b compare the time step study for the 7 and 14 node fuel regions, respectively. The 7 node model shows minor deviations between the 12.5ms and IOms, with more significant deviations in the period of oscillation for 2ms. The 14 node model shows excellent similarity for all three time step sizes.
Blockage Calculation
The base nodalization for the DGH partial blockage was for a 14 node fuel region, a 5 node steam pipe region, and a 12.5ms time step size. The instability study was performed by initializing the model with a 60 second null transient, then reducing flow to the affected DGH from 276.5kgh to just above the point of flow instability in 20 seconds. This point was determined with preliminary calculations for each case evaluated. The DGH flow was then slowly reduced
over 40 seconds to point of instability, and then maintained constant. Four different high tube powers were evaluated; 2.2MW, 2.4MW, 2.6MW, and 3.0MW.
oscillation for the high power tube varied from 3. Is to 2.6s, over the power range of 2 . m to 3.0MW. This is shown in Figure 7a The amplitude of the flow oscillation for the high powered tube varied from +loo% to -150% of the tube average flow (based on the "steady state" flow just prior to initiation of the flow instability). Figures 7b, 7c and 7d present the results for one of the cases evaluated, a tube power of 2.4MW. The lower power core regions of the affected DGH experienced the same period of oscillation, but with lower amplitude. They also did not experience reverse flow. In addition, the Iowest powered core region experienced flow oscillations of smaller amplitude than the medium powered core region.
?he amplitude of oscillation was referenced to the inlet flow of the fuel region, F i p 7b. In the upper fuel regions and outlet connector, the amplitude of the flow oscillation was dissipated in the upper regions of the core.
The fuel ciaddmg and tube wall temperatures were monitored for three core elevations; the lower core, mid- core, and upper core (Figures 7c and 7d). The magnitude amplitude of the cladding temperature oscillation varied &om +/-4O to +/-70K over the range of tube powers fi-om 2.2 MW to 3.0MW, respectively. In the lower core region (node 3), tempera- oscillations show alternation of wet and post- dry-out zones. Tn the upper core regions, where post-dryout has already occurred, temperature oscillations are due to flow and heat transfer coefficient changes. The amplitude of the tube wall temperature oscillation varied from +/-lo to +/- 20K over the same range of power. Although the calculations were run long enough to produce a "stable" flow oscillation, the cladding and tube wall temperatures oscillations had not yet reached an "equilibrium" condition. For the highest power analyzed, 3.OMW, the tube wail temperature had nearly reached an "equilibrium," avenging approximately SOSK, with an oscillation amplitude of +/- 20K The critical temperature for the RBMK pressure tube for tube rupture has been determined to be approximately 923K (65OOC). Additional calculations are needed to evaluate the potential for tube rupture. Cladding temperature is far below the critical temperature for oxidation (1473K).
in the upper regions of the core will occur prior to oscillation of the cladding temperature. Cladding temperature rises slowly in the upper core after initiation of &e flow instability, then temperature rises sharply at the dryout point (Figure 7c ) and reaches a new "equilibrium" temperature (the critical heat flux of the second mode) that continues to slowly rise. The cladding temperature
The results of the calculations indicate that the period of
The results of the calculation clearly indicate that dryout
6

DGH Flow Reduction 5 Outlet Nodes
Core Nodaliration
. . 440 4.5 450 455 460 465 470 475 480
lime (see)
Figure 4a Core Nodalization
I DGH Flow Reduction
5 Outlet Nodes Core Nodakation
-a A i 5 490 495 500 505 510 5i5 Si0 I Time (sec) I
1
Figure 4b Core Nodalization
OGH Flow Redudion 14 Axial Fuel Nodes Outlet Nodalization 16
14 12 10
3 8 2 6 - 5 4 - 2 3 0 = -2
U
-4 6 -a 440 442 444 446 448 450 452 454 456 458 460 462 464 466 466 470 472 474 476 478 480
Time (sec)
Figure 5 Outlet Nodalization
DGH Flow Reduction 7 Axial Fuel Nodes Time Step Study 14
12
10
s a 3 6 r u 4 - VI
2 2 0
-2 4 80 82 84 86 88 90 92 94 96 98 100 102 104 106 108 110
Time (sec)
DGH Flow Reduction 14 Axial Fuel Nodes
80 82 84 86 88 90 92 94 96 98 100 102 104 106 108 110
Time (sec)
Figure 6a Time Step - 7 Fuel Nodes
7
Figure 6b Time Step - 14 Fuel Nodes

DGH Flow Reduction 2.MWTuba
- 3.1 a
3.0.8
2.9.m a. 2.8. I
2.7 . I 2.6
2.0 2.2 2.4 2.6 2.8 3.0 3.2 Channel Power (MW)
Figure 7a Period of Oscillation
DGH, Flow Reduction 2.4MW Tuba
5wt 400 I...
0 20 40 60 60 100 120 140 160 180 200 220 240
Time (sec)
Figure 7c Cladding Temperature
I DGH flow Redudion
2.4MW Tube
o 20 40 60 80 i w 120 140 160 iao 200 z o 240 Time (sac)
Figure 76 Tube inlet Flow
DGH Flow Reduction 2.4MW Tuba
400 0 20 40 60 80 100 120 140 160 180 200 220 240
Time (sec)
Figure 7d Tube Wail Temperature
8

oscillation is induced by the continued flow oscillation and moving of the boundary between the dry region and liquid.
The threshold of flow insability was caiculated for each of the different powers for the high powered tube. These were compared to the data presented in Fi3me 8, Mochizuki [ 6J . n e calculated threshold for the RBMK-1000 model appears to be in good agreement with this data The data presented in Fi,w 8 suggest that for a DGH wiii high powered tubes, Type II instability is reached if flow is reduced below 1 to 2 kgs, over the power ranse of 2.2 to 3.0 MW, respectively. These calculations were made for a limited power-flow range, and it is necessary to continue the analysis for flows less than 1 kgs and powers less than 2.2
+ RBbiK - n P a , Cosine
0 7MPa,U,S. 1 0 7MiP%U,L lg MP?,LP,S. s 7 M P q L P , L S.: short riser a 3MPJ,U,S. L.: long riser A lhlPa,U,S. %rod bundIe
M P a , S E L
U.: uniform -IS.: inlet peak
- - - - - Natural circulation
1 , - .
0 1 1 3 Channel flow r z e (kgis)
results do indicate that fewer than these number of nodes in these two regions can significantly effect the results.
1. C h e h h o v , Yuri IvL, "RBMK NPP Safety" Workshop of Safety of Soviet-Design Nuciear Power Plants, Chicago Illinois, November 20-21, 1992.
2. Gabaraev, B., Yu. Nikitin, 0. NovoseIsLy, "An Assessment of the RBMK Core Cavity Overpressure Protection Piping System for Simultaneous Rupture of Several Pressure Tubes", RDIPE-PNL Workshop on N- Reactor Lessons, Richland, WA, July 20-22, 1993.
3. Russian Academy of Sciences, Institute of Nuclear Safety, "Deveiopment of SCDAP/RELAPS Model for the RBMK Graphite Reactor," 1993.
4. PNL-878 1 , "Flux Stability and Pokier Control in the Soviet RBMK-1000 Reactors," G.H. Menwether and J.P McNeese, August 1993.
5 . Tsiklauri, G., B. Schmitt "RELAPSMOD3 Code ,4ssessment for Pressure Tube Gnphite-Moderared Boiling Water Reactors," Proceedings of International Conference on 'Wew Trends in Nuciear System Thermohydnulics", V1, pg. il? J . l J .
6. Mochizuki, EL, "Flow Instabilities in Boiling Channels of Pressure Tube T y ~ e Reactor," Proceedings of Si'xth International Topical Meeting on Nuclear Thermal Hydraulics, Vol. 1, pg. 269, October 1993.
Fi,m 8 Type II Instability.Threshold
Results of a single tube blockage show good agreement with the available data for the Leningrad tube rupture event. The modei was able to reasonably predict the time of tube wail failure for the e.upecred flow blockze. Comparison of the threshold of T y ~ e r[ flow instabiliy shows reasonable ageement over the ranse of RBMK tube power investigated, and can potentiaily be used for safety analyses of the DGH blockage events. Modeling sensitivity studies indicate the instability analysis results were not sensitive to the nodalization scheme and time step sizes used. This was for a 14 node fuel region, 5 node outlet (steam) pipe region, and a time step size of 12.5m.s. For this nodalization, there was Iirtle sensitivity to t h e step behxen 2ms and 12.5ms. The
9

PNL-106 13 UC-520
Distribution
No. of CoDles
12 DOE Office of Scientific and Technical Information
Daniel Giessing 19901 Germantown Rd. Germantown, Maryland 20874-1290
Walt Pasedag 19901 Germantown Rd. Germantown, Maryland 20874-1290
26 c N o r t h w e s t o r a t o r y
L. R. Dodd K7-74 D. F. Newman K7-74 G. V. Tsiklauri K8-34 (15)
N. J. Stratton K8-14 M. D. Zentner K8-37 Publishing Coordination Technical Report Files (5)
B. E. Schmitt K8-34