i; · our findings are discussed under the ... summary of findings page 111-3 ... yean from 1961 to...
TRANSCRIPT

I; I
RESOURCES COMMISSION Background Papers - Volume 7
Report on the Current Status of Forest Resource Inventories of British Columbia
A Summary of Technical Rarims of Forest Inventories and Allowable Annual Cut Determinations in British Colum5in - H S T Consorhum
The wews expressed in mdependenr reports preparedfor the Forest Resources Cornmrssron are
enttren/i,r fhp use und inrpresr o.ffhe public as bach-,qround studies I ~ I the Aprd 1991 Repnrr ofthe those ofrhe uuthors und nor neressarilv those ofthe Commission. They are puhlished in their
C,>mmisssv,n to the Minister 01 Fnrests.

. .
!
“no”.. B.C MIW 3E7 .” ~
REPORT ON THE CURRENT STATUS OF
FOREST RESOURCE INVENTORIES ‘OF BRITISH COLUMBIA
Prepared for: *
M E BRITISH COLUMBIA FOREST RESOURCES COMMISSION
February 1990
i

~ .
....
TABLE OF CONTENTS Page ii
TABLE OF CONTENTS
Page
TITLE PAGE . . . . . . . . . . . . . . . . . . . . . . . . . . . . . . . . . . . . i
TABLE OF CONTENTS . . . . . : . . . . . . . . . . . . . . . . . . . . . . ii
INTRODUCTION . . . . . . . . . . . . . . . . . . . . . . . . . . . . . . . . . 1-1
TERMS OF REFERENCE . . . . . . . . . . . . . . . . . . . . . . . . . . 11-1
SUMMARY . . . . . . . . . . . . . . . . . . . . . . . . . . . . . . . . . . . . . . 111-1
INVENTORY REPORTS . . . . . . . . . . . . . . . . . . . . . . . . . . . IV-1 TIMBER RESOURCE INVENTORY . . . . . . . . . . . . . . . . . . . . . . . IV-1
Summary . . . . . . . . . . . . . . . . . . . . . . . . . . . . . . . . . . . . IV-1
Timber Supply Area Inventory IV-3 Introduction IV-2
Tree Farm Licence Inventory . . . . . . . . . . . . . . . . . . . . . . . IV-7 Limitations . . . . . . . . . . . . . . . . . . . . . . . . . . . . . . . . . . . IV-10 Commentary . . . . . . . . . . . . . . . . . . . . . . . . . . . . . . . . . . IV-11 Appendix A . . . . . . . . . . . . . . . . . . . . . . . . . . . . . . . . . . . . IV-12 Appendix B . . . . . . . . . . . . . . . . . . . . . . . . . . . . . . . . . . . IV-14 Appendix C . . . . . . . . . . . . . . . . . . . . . . . . . . . . . . . . . . . IV-16 Appendix D IV-21
Summary . . . . . . . . . . . . . . . . . . . . . . . . . . . . . . . . . . . . IV-25
Wildlife Population Inventory IV-27 Introduction IV-26
Wildlife Habitat Inventory . . . . . . . . . . . . . . . . . . . . . . . . . . IV-34 commentary . . . . . . . . . . . . . . . . . . . . . . . . . . . . . . . . . . IV-38 Reference Material . . . . . . . . . . . . . . . . . . . . . . . . . . . . . . IV-40
Summary . . . . . . . . . . . . . . . . . . . . . . . . . . . . . . . . . . . . IV-42 Introduction . . . . . . . . . . . . . . . . . . . . . . . . . . . . . . . . . . . IV-43 Fisheries Inventory (DFO) . . . . . . . . . . . . . . . . . . . . . . . . . IV-44 Fresh Water Fishery Inventory (MOE) . . . . . . . . . 1 . . . . . . . IV-48 Commentary . . . . . . . . . . . . . . . . . . . . . . . . . . . . . . . . . . IV-52 Reference Material . . . . . . . . . . . . . . . . . . . . . . . . . . . . . . IV-53
. . . . . . . . . . . . . . . . . . . . . . . . . . . . . . . . . . . . . . . . . . . . . . . . . . . . . . . . .
. . . . . . . . . . . . . . . . . . . . . . . . . . . . . . . . . . . WILDLIFE RESOURCE INVENTORY IV-25 . . . . . . . . . . . . . . . . . . . . . .
. . . . . . . . . . . . . . . . . . . . . . . . . . . . . . . . . . . . . . . . . . . . . . . . . . . . . . . . . . .
FISHERIES RESOURCE INVENTORY . . . . . . . . . . . . . . . . . . . . . IV-42
TABLE OF CONTENTS Page iii
Page
RANGE RESOURCE INVENTORY . . . . . . . . . . . . . . . . . . . . . . . iv-54 Summary . . . . . . . . . . . . . . . . . . . . . . . . . . . . . . . . . . . . iv-54
Methodology . . . . . . . . . . . . . . . . . . . . . . . . . . . . . . . . . . iv-58 Limitations/Use . . . . . . . . . . . . . . . . . . . . . . . . . . . . . . . . iv-60 Commentary . . . . . . . . . . . . . . . . . . . . . . . . . . . . . . . . . . iv-61 Appendix A . . . . . . . . . . . . . . . . . . . . . . . . . . . . . . . . . . . iv-63 Appendix B . . . . . . . . . . . . . . . . . . . . . . . . . . . . . . . . . . . iv-67
Introduction . . . . . . . . . . . . . . . . . . . . . . . . . . . . . . . . . . . 1v-70
LimitationsRlse . . . . . . . . . . . . . . . . . . . . . . . . . . . . . . . . iv-73 Comments . . . . . . . . . . . . . . . . . . . . . . . . . . . . . . . . . . . iv-74 Appendix A . . . . . . . . . . . . . . . . . . . . . . . . . . . . . . . . . . . 1v-75
Introduction . . . . . . . . . . . . . . . . . . . . . . . . . . : . . . . . . . . iv-55 Status . . . . . . . . . . . . . . . . . . . . . . . . . . . . . . . . . . . . . . iv-56
RECREATION RESOURCE INVENTORY iv-69 iv-69
1v-71 1v-71
. . . . . . . . . . . . . . . . . . . Summary
Status Methodology
. . . . . . . . . . . . . . . . . . . . . . . . . . . . . . . . . . . . . . . . . . . . . . . . . . . . . . . . . . . . . . . . . . . . . . . . . . . . . . . . . . . . . . . . . . . . . . . . . . . . . . . . . . . .
Appendix B
Summary Introduction Status Methodology LimitationsNse Comments 1v-83
1v-77 1v-79 1v-79 iv-80 iv-80 1v-81 1v-82
. . . . . . . . . . . . . . . . . . . . . . . . . . . . . . . . . . . WILDERNESS RESOURCE INVENTORY . . . . . . . . . . . . . . . . . . .
. . . . . . . . . . . . . . . . . . . . . . . . . . . . . . . . . . . . . . . . . . . . . . . . . . . . . . . . . . . . . . . . . . . . . . .
. . . . . . . . . . . . . . . . . . . . . . . . . . . . . . . . . . . . . . . . . . . . . . . . . . . . . . . . . . . . . . . . . . . . . . . . . . . . . . . . . . . . . . . . . . . . . . . . . . . . . . . . . . . . . . . . . . . . . . . . . . . . . . . . . . . . . . . . . . .
Appendix A . . . . . . . . . . . . . . . . . . . . . . . . . . . . . . . . . . . 1v-84 Appendix B . . . . . . . . . . . . . . . . . . . . . . . . . . . . . . . . . . . 1v-95
TOURISM RESOURCE INVENTORY . . . . . . . . . . . . . . . . . . . . . . 1v-99 Summary . . . . . . . . . . . . . . . . . . . . . . . . . . . . . . . . . . . . 1v-99 Introduction 1v-99 Status . . . . . . . . . . . . . . . . . . . . . . . . . . . . . . . . . . . . . . IV- 100
. . . . . . . . . . . . . . . . . . . . . . . . . . . . . . . . . . . Methodology . . . . . . . . . . . . . . . . . . . . . . . . . . . . . . . . . . 1v-1 01 LimitationsNse . . . . . . . . . . . . . . . . . . . . . . . . . . . . . . . . IV-102 Commentary . . . . . . . . . . . . . . . . . . . . . . . . . . . . . . . . . . IV-103 Appendix A . . . . . . . . . . . . . . . . . . . . . . . . . . . . . . . . . . .
WATER RESOURCE INVENTORY . . . . . . . . . . . . . . . . . . . . . . . IV-108 Summary . . . . . . . . . . . . . . . . . . . . . . . . . . . . . . . . . . . . IV-108
Methodology . . . . . . . . . . . . . . . . . . . . . . . . . . . . . . . . . . IV-113
IV-104
. . . . . . . . . . . . . . . . . . . . . . . . . . . . . . . . . . . . . . . . . . . . . . . . . . . . . . . . . . . . . . . . . . . . . . . . . . Introduction IV-109
Status IV-113
Limitations IV-117 Commentary . . . . . . . . . . . . . . . . . . . . . . . . . . . . . . . . . . IV-118
. . . . . . . . . . . . . . . . . . . . . . . . . . . . . . . . . . .
. . . . . . . . . . . . . . . . . . . . . . . . . . . . . . . . Reference Material IV-119

I
1. INTRODUCTION Pam 1-1 1. INTRODUCTION Page 1-2
INTRODUCTION
The status of forest resource inventories in British Columbia has far-reaching effects on integrated resource management The Minisay of Forests (MOR is mandated to ensum that all rcso~ucc values are taken into account when managing the province’s forcst and range lands. Forest managen and thc public cannot propctly assess land usc conflicu without an adequate inventory of each resource.
An oveMew of the status of the present resource inventory for each of the following uscrs of forest and range land has ken complete&
T i k , Wddlife; Fisheries; Range: Recreation; wildancss; Tourism; water.
An insight into issues concerning each fatst resource inventory and the implications f a the development of an economically sunainablc fortst induJpy in the province were to be determinted as pan of the review.
The main approach used in the review was personal and telephone interviews with a wide range of individuals who ~ T C involved with the acquisition, tnaintcnancc and use of forest r e sou~~c inventoxics. A questionnak was circulated as well. MinisaY, Branch and Regional staff responsible for preparing the mpective inventhes wen the main contacts. Information was received horn:
- B.C Minismes of Forests. Environmen& Tourism, Recreation and Culnue. Crown Lands. Parks, Native Affain;
Federal Departments of Fisheries and Oceans, Environment;
B.C. Wildlife Association;
TFL and Fonst Licence licensees;
Interviews with selected individuals with expertise and knowledge of the inventories of intenst.
A folio of map overlays was prepared. The folio illusaates at a pmvincid level the forest land base by Region and tenure, the forest site capability and the boundaries of Indian land claims.

II. ’ TERMS OF REFERENCE Page 11-1
TERMS OF REFERENCE
The Commission was interested in an evaluation of the status of British Columbia’s forest resource inventories.
The intent of the study was to provide specit?c idommion on the following:
PRODUCTIVE LAND BASE
Total land ana Fomtcd land ama Productive forts area
This information was to be presented by a base map of the p v i n c e showing Forts Regions. Timber Supply Arcas (TSA) and Tne Farm Licence boundaries.
FOREST SITE CAPABILITY
The biological capabiliq of different forest to grow forest crops is to illusaate at provincial level by geographic location in the province. This is to be provided as an ovcrlay map to the provincial scale map.
INDIAN LAND CLAIMS
A provincial scale map is to be produced to show the extent of the current Indian land claims on boundaries of the “working foxest” This map is to be provided as an overlay to the provincial scale map.
11. TERMS OF REFERENCE Page 11-2
The study emphasis for each rcsou~ce is:
Goals and objectives: Completeness; Accuracy; Intended uscs; Adtquacy of maintenance. processes and proceduns.
Appropriateness for use in developing land use policy and suategies for sustainable dcvelopmenr

111. SUMMARY OF FINDINGS Page 111-1
SUMMARY OF FINDINGS
In this section we outline in general terms our overall findings of the status of the forest resource inventories within a provincial context. A s u m m a r y of the status of each pareicular resource inventory heads each individual repon, and can be rcfemd to for additiond &a
It is not possible to summarizt our iindings in quantimive t e r n because the information could not be obtained in a standard consistent format, nor was that type of infomation available for each inventory. Our findings are discussed under the following headings:
GOALS AND OBJECTIVES
Most of the ministry resource managers inltMewed were able to state what their inventory requirements are and have pnpared written goals and objtcrives. However, they are not consistently well stated or defined for each resource, and are quite variable. To set clurrer direcdon. dear and monger goals and objectives need to be defined
COVERAGE
Provincial coverage by each inventory is highly variable and quite incomplete. At a broad management level. the coverage ranges h m good to poor. At an operational level (needed to practise integrated resource management), the coverage is adequate. Only the limber Inventory covers the entire province.
COMPLETENESS
In terms of the data g a t h e d not one resource inventory can claim to have a completed database that is updated and maintained that f u U s its inventory objecrives or management goals. The data gaps arc substandal. Even the Timber Inventory. which has the most complete information, has a large amount of outdated data. All ministries are planning to have their data and maps on
111. SUMMARY OF FINDINGS Page 111-2
interactive computer-based Geographic Information Systems (GIS) which will at l a s t make their present data more usable.
RELIABILITY
It is difficult to makc comparisons on the relative reliability of each inventory. Of the resources that can be inventoried with a statistical reliability, only Timber was able to provide a standard error estimate. Wildlife and Ftshcries inventories. although they involve population esrimatcs, due to difficulties of sampling accurately. werc either based on old data or hest estimates. Wildcmess. Reamion and Tourism are new inventories, using subjective classifcations and are regarded as fim approximations. Each resource inventory has its oyn specific limitations.
FUNDING
A consistent reason given by nearly all the Minisuy resource managers intuviewcd for the inadequate or incomplete inventory was insufficient funding. With the exceptions of Watn and Range inventorits. all M y felt that bcncr inventories wuz needed. Many alluded to budget requests that were consistently refused. This would indicate a lack of support or commitment by the government to improving the resource inventories. We were unable to obtain current annual budget requirements for all inventories. but estimatts of annual budgets were obtained for the following: T i k - $13.5 million, Wtldlife Population - $2.5 million; Wiwife Habitat - $2.4 million ($12 million to complete); Fisheries - $3.0 million additional. It would indicate to us that the annual funding commitment to bring the forest resource inventories to a reasonable level is conservatively in the range of $25-30 millionlyear.
It is clear that there is not a level base of consistent resource inventory information covering the province. The Timber Inventory is the most complete; Fisheries and Wildlife arc inadequate. Recreation, Wildcmess and Tourism arc k t approximations and their inventory methodology is s t i l l being dcvelopcd. Rangi and Water are inventoried by monitoring the use.

111. SUMMARY OF FINDINGS Page 111-3
Timber resources not only have the best inventory information but also represent the dominant use. It is difficult for the other resources to participate in integrated nsource development. given their poor information base compared to Timber.
There arc sow obvious linkages between the different resources which suggest there is the need- for more cooperative development of inventories sharing common resource intmsu. For example. inventory of Tourism, Recreation and Wildcmess needs compatibility and coordination. The open range habitat is shared by both domestic cattle and wildlife.
The iinkages in rrsource uses are particularly relevant for the working f a s t . This is also w h e n there is the greatest potential for resource usc conflicrs Inventories of both forest and non-forest resources need to be completed b a d on well defined gods and consistent uitcria to aid in the resolution of conflicts. As integrated resource management is a question of resource allocation and use of public land the government needs to provide direction. It will require a commitment to a program to obtain a complete inventory of all the forest resources in the province; and the development of a comprehensive land-use policy and resource allocation strategy for British Columbia.
111. SUMMARY OF FINDINGS Page 111-4
Summary of the Provincial Land Base
A major pomon of the provincial forest area will not grow a commercially-useful timber &p. The productive area or working forest. is the net a m used by the MOF to support the provincial annual allowable cut. is an estimated 40% of the provincial landbase.
TFL'S TSA's "S TOTAL
Total Forest Area (ha) 7.718.476 43a47,a90 742.225 52.308.599 100%
Productive /\rea (ha) 3,569.914 20,041,291 548,841 24.1 60.046 46%
Non-Productive Area (ha) 4,148.562 23.ao6.607 193.384 28,148.553 54%
Source: IRM Branch of MOF for own lands: BCAA for MFUs. It should ba noted that these figures are estimated and that these vary from source to soume.

IV. INVENTORY REPORTS Paae IV-1 IV. INVENTORY REPORTS Page IV-2
INVENTORY REPORTS
TlMBER RESOURCE INVENTORY
SUMMARY
The Timber Inventory Rogxam of the province is managed by the MOF s t a f f at the Branch, Region and District levels. The toal inventay is an estimate of the dmber rcsou~ct of B.C a d is aggregated from inventories of management units; i.e. 35 public TSA's Tmber Supply Areas) and 32 T n ' s (Tmc Fann Licences).
The majority of the existing forest resome data for the TSA's was collecttd in 20 . yean from 1961 to 1980 under the unit s u ~ t y program. This inventory is largely based on photo intqmration of thc forest types (50-809). stand e s h a t e s h m helicopter (15-354b) and ground measurements (5-1546).
The Inventory Branch has developed an inmaftivc geographically retrievable multi- rtsourcc database and computaized mapping system Benvan 1980-87 inventory program was funded at a maintenance level only. the inventury maps being updated for logging and wild fms using satellite image analysis and rhe database capturing reforesration. stand ueatmcnt and history changes.
In 1988 a program was initiated to rrinventory the management units over a lo-year period using a refined forest classification system. Procedures arc also to be developed to provide stand-specific volume estimates. Although budgeted at 1613.5 d o n per year, this program for TSA's is inadequately funded. In the firsr two years, the budget for TSA reinventories was approximately $0.50/htctares of productive land. This allows only limited improvement in the classification database, concentraring on the immanut component and special problem types, with v u y limited additional field sampling.
The TFL inventories, with few exceptions, conform with the MOF inventory S ~ & &
and procedures with local variations. The original inventory dates, the update stam and data management systems vary by TFL and management by individual companies.
INTRODUCTION
The Chicf Forester, by authority of the Forest Act (1978). is mponsible for the development and maintenanw of f a s t inventory in the province. Thus. the MOF has the mandate to assess (3rown lands for their potential for growing frees, providing f a s t or wilderness oriented recrcarion, producing forage for livestock and wildlife. conservation of wilderness, and accommodating other fortst uses.
The forest invcntqry program is managed and coordinattd by staff at the Inventory Branch, F o m Region and Forest Disuict levels. While the Inventmy Branch is responsible for the forest inventory of all Crown lands it only perf- inventory of pvincial f m unda Forest Service adrmnrsnano ' n. The responsibility for inventory of Tree Farm Licena lands lies with each licence holk.
Inventory of the forest resoume has ken an ongoing process since the establishment of the Forest Service in 1912 Broad provincial level inventory rcpons have been published periodically (e.g.. 1917 and 1937).
The purpose of the existing forest inventory that has been carried out during the last 30 years was to provide average management unit level statistics. The intended primary usc was for the calculation of annual allowable curs. It was also to be used to monitor depletion of the forest h m harvesting and wild6res, as well as updates for reforestation.
In the following review the provincial inventory program and Trcc Farm Licence inventory are descrikd in two sections. Although Tree Farm Licence inventory can be considered a "subprogram". there are enough diffmnces for it to be reviewed
. .
An increase of 40% of the budget for the TSA's re-inventory phase would be required (average cost for T n ' s is $2.00/ha) to improve the database for the dynamic computerized inventory system to provide current forest inventory statistics for ICS~UTCC
planning.
separately.

IV. INVENTORY REPORTS Page IV-3
TIMBER SUPPLY AREA INVENTORY
IV. INVENTORY REPORTS
TIMBER SUPPLY AREA INVENTORY
Page IV-3
Introduction
Until 1978 the provincial inventory program consisted mainly of management unit surveys. designed to provide average stadstics for aggregate forest types. Since then, the emphasis of inventory work has shi f ted to obtain mcae detailed infomation on pordons of management units (subunits). and simultaneously more descriptive statistics such as trtc volumes that would be reliable not only for aggregate types. but also for individual forest stands. In addition, the program was enlarged to include monitoring of depletions with the use of satellite imagery and digitizing of f a s t cover maps.
In 1973 the inventory program was expanded to include the identification of environmcnraUy sensitive arcas which should be protected from Westing, as welI as arc~s which need special consideration when preparing integatcd forest development plans.
In 1988, a new program was initiated by the MOF to reinventory the provincial forest inventory on a 10 year cycle and to complete the digital conversion of the remaining fomt cover maps by 1991. Thir program also provides for the updating of all inventory maps on a 2 year cycle, using satellite imagery. Thesc updarts will idcnnfy changes since the last inventory due to harvesting. lire and damage by insects and disease.
Status
Prior to 1988. the forest inventory available was based on unit surveys completed during the period 1961-75. The inventory' provided a completed coverage of rhe province with maps available at a scale of 1:20 chains. The volume esdmates had a standard error of &lo% at a 95% confidence levd
In the late 1970's a refinement was added to the database by idennfylng and classifying environmentally sensitive arcas for all units.
In Appendix A we list the forest units and the years of completion of each unit survey. The inventory was compiled and'summarized by the 100 forest unit surveys. whch cover the province. In 1979 the forest management units were changed from
IV. INVENTORY REPORTS Page IV-4
Public Sustained Yield Units to Xmber Supply Areas. This meant that the inventory database had to be re-organized to coincide with TSA boundaries as broad level forest planning would be at a TSA level. This process was started in 1982 by conversion and updating of the existing database. The source of the TSA inventory database is listed in Appendix B.
The acceptance of the m u i c system in Canada and the development of computerized mapping and database manage,mnt systems has resulted in additional progressive changes t~ the existing inventory. Beginning in the late 1970's the inventory volume database and unit survey stadstics WCIC convmd to menic units.
The proass of convening the approximately 6,600 f a s t cover maps to a computerized digital format was atso srartcd. It is now about 80% complete, and is scheduled for completion by 1991. This was made possible by the additional funding from the re-inventory program.
The design of the unit s w c y pro- has its limitations. which have become inmasingly apparent in the last 10 years. Deciduous forest types and even lodgcpoie
be non-comnmcial. Hence the forest classification of these dmbcr types was very broad, and vcry minimpl ground sampling of these stands WCTC canied out. Simildy the younger fomts. age classes less than 80 yoars, had minimal sampling. as it was intended to sample them more intensely at the next reinventory. The lack of funding for reinventory until 1988 meant that this did not take place.
This lack of funding during the period 1980-87 meant the Forest Service could not carry out the planned cyclic reinventory, and could only manage inventory maintenance.
pinetypcsinsomelocationsmnconsidcrrdatthetimeoftheoriginalunitsurveyst0
The situation changed in 1988 when funding was provided by the government to implement a reinventory program on a IO-year cycle. The program applies to both TSA's and TFL's. The program is intended to include periodic rrinventory, GIS data maintenance and development, forest nsourcc analysis, growth projections and inventory statistics.
The five-year (1988-92) budget for this new program is $13.5 million per year. Unfonunately the p m p m has been under funded by about $1.5 million for the first fwo years. so the amount of field sampling planned has been reduced Priority is

IV. INVENTORY REPORTS Page IV-5
being placed on refining the classification of young forests, deciduous s t a n d s and special interest types by obtaining ground and photo plots in populadons not previously sampled and in recompiling the upgraded sample database.
Methodology
Forest inventory procedures arc complex and technic& We have outlined below 'the basic approach followed in British Columbia
In the existing inventory, developed from thc Unit Slavey Program, land classification is based on airphoto interpretation. Two main classes arc recognized: non-forest and forest land, and each one is funher s&ed based on it specisc characteristics. For example. untii 1978. f a s t land wiu classified as either matlac. 'immature. not satisfac- torily restockd, mature k d u a l or non-coarmercial cover.
Mame and i m m a n ~ ~ fomt types w c ~ t idenrifitd by spccits composinon, age, height, stocking and site. The species composition listed rhc major species containing more than 20% of the gross volume and minor spccits containing 10.19% of the stand volume. Age was idcndfied by 20 year classcs. and heights by 30 feet increments,
imman~~ s a & fonned one class. mature stands with lest than 25% disturbance were put in tonvoc lassesbas# ionthtnumkrofs~peracre . Maaaenandswithupto
disturbance or den& by logging, fire, etc., and not meeting the minimum stofking requirements were classai as not dsfactorily restocked (NSR) ardor d i s t u r b e d sucking doubtful (DSD).
The non-comercial cover designation idendfkd mainly pruducave forest areas occupied by brush. Site class designations of good. medium, poor or low were used based on stand age and height relationships.
A s t r a t i l i e d random .sampling system was used for the management 'unit sweys. The m a w forest 'ypes were aggngated into 42 inventory types, while the immaturc stands were grouped into 17 growth types.
even for those stands with molc accllmc daa Ihe stockiog classes Wac broad; all
75% disturbance wen? classed as matluc residual. stands with patn than 75%
IV. INVENTORY REPORTS Page IV-6
Independent from the unit surveys, loss factors and volume table data was also collected and permanent growth sample plots wen established in selected units to validate the loss factors.
A brief report describing the unit. the data sources, s u m m a r y of area and volume statistics and the standard error of volume estimate was published for each unir
This unit survey inventory program was based on a system of periodic re-inventories rather than on continuous inventory updanng. The logging, firc and other disturbance history and land owneahip status was cumnt only as to the year of the field work.
In 1973 the inventory classification system was refined to identify areas requiring environmental protection. A classiiicarion system was developed to identify: areas with soil stability problems, regeneration wmuaints. avalanche and snow chute hazards, high recreational values and essential habitat for wildlife and iish.
The initial dosign of the sampling s y s t e m was efficient and delivered the req& i n f ~ t i o n for managcmwlt dCcisiws. However, as management units W c n
completed, the sampling dcsign was not adjusted to include applicable samples from adjacent or similar management units. As a result, in somt populations up to LOO0 samples wcn colltcttd while otha aggregated types wm not sampled adequately. Another major weakness of the sampiing system was that tht classification paramctm did not explain the high degree of variation in volume within the aggregated typcs. Thcnforc. the increased number of samples had a beneficial effect only on the sampling error. but did not improve the capability of estimating the volume of individual stands. This was largely due to the broad class intervals on the parameters of the classification system. especially the stocking classes.
The sub-unit inventory system, startcd in 1977, introduced some major changes in clasassification. sampling and data analysis. In pardcular, the class intervals were abolished and the classification parameters were measured in continuous units. Species composition was recorded to the nearest 10%. age in years. height in metres and the stocking classes were changed to stems pa hectare or to crown closure to the nearest 10%. Also, the sample design was changed to a multi-phase sampling combining large-scale photo samples and conventional ground samples. Site index of each stand was calculated from age and height, and volume was estimatai through a regression equation with age, site index and crown closure or stems per hectare as independent variables.

T IV. INVENTORY REPORTS Page IV-7
The sampling systcm selected for the IO-year reinventory program is a multi-phase s t r a t i f k d random sampling, using large-scale aerial photo plots and p u n d samples with an allowable sampling e m of +lo% at a 95% confidence intcrvaL Since most of the province has been sampled previously. the sampling system is designed to take advantage of the existing inventory. In particular, the existing data was used to idennfy the s t r a t a which had not k e n sampled previously. such s second growth and deciduous s t a n d s or those that required additional sampling.
TREE FARM LICENCE INVENTORY
Introduction
F a s t inventory of Tree Farm Licences is pan of the management responsibility of the licence holder.
V a y little information is available on the folut inventories of the first TFL3 which were awarded in the late 40's and early 50's. For thc mOst pan, they werc reconnaissance typcs of inventoly, based on low intensity strip auises, with volumes commonly estimated at the rough udlization I d
The TFL's awarded from the mid 50% and latn inhaited inventories completed by the Forest Service to the standards of the day.
The s u m m a r y of Tne Farm License inventories is based on the 31 responses received to the questionnaire circulated to the 32 TFL's.
The questionnaire requested information to assess the swdards and procrdurcs used in the original or fmt inventory. The date of these fmt inventories varied, depending on the date of awarding the TFL The TFL holder subsequently revised the inventory following Forcst Service methodology and standards. but the field data collection was morc intensive than was the practice for Crown lands.
IV INVFNTORY REPORTS Paae IV-8
These inventories provided the basic data for management of the Tree Farm Licences including:
Calculating the allowable annual cuc Setting TFL management gods; Determining when to cut.
Even though the MOF provided funding assistance for TFL inventories, the inventory database was rn given to the MOF. Currently plans arc underway to ensun that all TFL inventory data will be acquired and maintained in the provincial database by 1992 Digirizing and database aansfer in Forest Service format will be funded by the Forest Service, while the reinventory and field sampling will be at the TFL holder's expense.
Status
Based W the qUCSUOM&E and ineMCWS. We have determintd that T F L ' S CUmIldy have forest inventories that qual or exceed the cumnt Forest Service standards. The detailed summary of the questionnaires results arc listed in Appendix C.
The latest available TFL inventories also generally follow Forest Service methodology and standards of the Unit Survey progmn. Volume sampling and validation of stand labels concenaated on the mam component of the inventory, immature arcas usually have not ban resaatifed in detail. For 10 TFL's that wen reinventoried in the 1980's. the cumnt Inventory Branch procedures for inventory have been used.
Only 18 of the 32 TFL's werr able to provide information on the accuracy of their inventories, but all of these exceeded the MOF standards.
The majority of TFL's have annual or periodic updating proccdu~s which appear to be up to date to 1988/89. based on depletion - i.e.. recording changes due to logging, fires. regeneration, etc. In six TFL's. the immann~ component of the inventory was also s u a t i f e d in greater detail during the update process. Out of 32 mk. 13 have GIs. 4 partially complettd 14 have no GIs, and 2 did not provide the perrinent information.

IV. INVENTORY REPORTS Page IV-9
Identification and classification of environmentally sensitive arcas. which wen not covcrcd in the on@ inventory, has also been done, to Forest Service standards. Seven TFL's completed ESA classification during the ninvtnmry or inventory update process. and two more TFL's plan to carry out ESA classification in the next five Yeafs.
Remarion inventories are being comp&A on 24 TFL's, fish and wildlife on U, soils and ecosystems on 15. and range inventories on 10 TFL's. Other inventories that arc bcing conducted on less than five T I X ' S are m a site specific. such as mining, napping. geotcchnical, forest diseases and archaeological sites. V i a l l y no licensees have complete inventolies for the whole TFL. Instead, the non-timber rcsourcc inventories are ongoing studies and arc being conducted progmsively. as necessary, usually for a complete drainage. According to the licencc holdm that have bdui their own studies, the standards arc in keeping with the appropriate agency standards. Seven of the license holders have stated hat they have. no p h over the next five yean for non-timber inventories. Thc other licensees plan to update and upgrade existing inventories as necessary.
Methodology
The Tree Famr Licensees arc required to carry out inventories to standards set and approved by the Forest SeMce. Most TFL inventories have followed the Forest Service procedures, although usually with a higher intensity of ground sampling. Some licensees (e.g.. MacMillan Bloedcl Ltd.) use approaches different than the Forest Service. excceding in detail the F a s t Service standards which provide more accurate stand level infomation.
The reponed standard e m of estimate for the TFL's on average is equal or lower than it is for the Forest Service Unit Surveys. It ranges from f2.196 to i10% at the 95% confidence level.
Inventory sharification and field data collection usually is conaacvd out to consultants; only a few licenses have the manpower and expertise to carry out this task. Database management data analysis and preparation of inventmy reports is carried out by consultants or their assistance to perform specific tasks. is used on a contract basis. Only the larger TFL holden handle this aspect of the inventory on their own.
7 ~ ~ ~ ~ ~ " ~ " 2 - : . . ~~ ~ ~~~~ ~ ~ ~ ~ ~- ~~~~
IV. INVENTORY REPORTS Page IV-10
LIMITATIONS
As the TSA and TFL inventories are essentially based on the same methodology, both have the same inherent limitations.
The forest inventory data relics on information collected by field sampling and estimates made from acrid observations and photo interprewion. However, the reliability of the fmst classification depends fmmost on the skill and experience of the claassif~er and his judgement. Although technical standards for classifiiation and photo interpntation have teen established., no formal cenificaion of forest classifiers is requid. This can result in variable quality of classification.
Thc existing forest rcsource inventory was devclopcd during thc past 25 ycar~. The objective was primariiy to produce inventory statistics by management units for the determination of allowable annual cuts. Consequently. the sampling system was optimiztd to provide avuage volumes that arc reliable for a management unit but not for individual stands. . This explains why sampling was collctntratcd on mature coniferous stands, and was very low for decid~ous and second-gmwth s t a n d s .
In other words, the inventory was not designed to provide morc detailed data for use at an operational levei; e.g., harvest scheduling or stand-specific data.
Only when the classifcation system is refmed to include the use of site index quations and adjustments arc madc for species compositions and realistic stand density or stocking esdmadons can stand specific volume estimates be derived.
COMMENTARY
The provincial timber resource has bcen the focus of the oldest continuous resource inventory throughout the province.
Undl the mid-1970's. the latest available version of the provincial inventory was considered to be at an acceptable level. In the 1980's. the changing demands in the type of timber supply and the increased need for more emphasis on integrated resource management has shown up some limitations of the inventory. For example, there has b e n a rapidly developing demand from the forest indusq to use deciduous amber as well as an interest in the commercial thinning of second-growth stands. Improved

IV. INVENTORY REPORTS Page IV-11
integrated rcsource management planning requires more detailed dara than the inventory has been designed to produce. . Satisfying these n& requires finer fonst cover stratification. morc l o c a l i z e d growth and yield functions to provide nliable stand level volume estimates, and new volume loss factors for second-growth stands. The provincial forcst reinventory would likely have to double the present $13.5 million annual budget to achieve these rtquircmcnts.
The inventory database is also used in eimba supply analysis for thc determination of allowable annual CUD. One of the reasons for the shortfall in timber supply is that not all the timber stands are accessible or available due to a variety of conmainu. This problem is not a result of the inventory cs&tc but one of how the available inventory volume is netted for cut determination purposes. A mane detailed planning procus is required to provide a better estimate of the long-tam supply available for harvesting in cach TSA and TFL Unless a process is devtloped to define the
environmental and prrservarionisc demands on the fonst land base will continue to exacerbate the predicted shortfall in timber supply.
producrive a r ~ a q u i r c d for timber production. the CUIUUQ eVCr-increaSing
IV. INVENTORY REPORTS Page IV-12
APPENDIX A
YEAR OF FOREST INVENTORY OF UNIT SURVEY AND ESA CLASSIFICATION

IV. INVENTORY REPORTS Page IV-13
Year of Forest Inventory of Unit Survey and ESA Classlflcation
IV. INVENTORY REPORTS Page IV-14
I UNIT W A d a m Alaza Lake A1 sek Arrowhead
Sabin* 8 a r r l r r e Barton H11 1 B e I l - I r v l n g Big Bar B i g Valley
81ue Htn Forast 81 ueberry
Botanla Boundary Bmron 8 m (unrqu1at.d: Burns Lakr Canoa
Chl 1 ko
Cranbrook Cottomood
Creston C r w k d R l v e r Dawson C r . SSA Oman Oease Omdney E6N B e l t Eagl e Edgewood Fern i r F ln lay Fontas
Ft . S t . James SSI
Ashnola
carp
F o r t Nelson
i=;:xyCr. SSA
Hecate Kamloops Ketchika K e t t l r ~ l n b a s k e t Kingcome K 1 appan KlUskUs Kotcho Lac La Hache Lardeau
INITIAL Y E A R
SURVM
1968 71 75 62 69 74 67 70 73 62 69 64 62 70
73.75 67 67 64 74 ,- 73 68 69 M 73
69.n 73
62.63.68 75
62.63 70 71 67 63 72
69.70 60 70 70
64.65 67
68
63 73
68
65 72
70 72 69
..
1.66.69.71
E-INVENTORY YW OF
1977
76
76
74
77 73
77
77
74
75
- SA'
78 - - -
77 77 74 70
76 70
78 78
77
78
76 74 73 78 78 70 73 73 70 78
74
78 77 79 77 78 78
77 77
77 70 77
77 77 77
75 70 77 77
n
- - -
- -
-
-
-
UNIT W
L l a r d L o n w r t n m e r 1 y mnkman m r t c a Nakusp NarcosI 1 Haver W h a k o Nahal 1 1 ston NlCola Nlskonl l th Wootka North -son Qanagan Ootsa Parrnlp Peaca
purd.n Pr . George. S U
auadrr Q I ~ Charlot ta w r s n e l Lake Rar t RIvrn I n l e t Robson S a l m Salmon A n ShuSWap Slkannl 41111 kameen S k m a Slocan 5.1 thers
Spallumchwn sa, St1 k1 ne Stuar t Lake stum Sustat (TFL 40)
Taku Takla
Upper Kootenay
Wapltl Vancouvar
Westlake WIlllamr Lake Wllla River Wlndennerr YalakM
- YEAR
SURYM INITIAL
972.73 n 70 66 72 67
61.65 69 62 65 61 68 69 67 64
65 65
72 63
2.M-68 67
67 71 67 68
62 74
62 63 71
1.62.66 69
51.66 67
64 72
m 63,66 75
70.71 75 65 70 69 61 73 69
61.68 65
m
E-INVENTOR1 YEAR OF
1977 74
75 73 70
75 76
74 75 75
76 77
75 76
75
74 77
- SA* - 7a 77 78 77 77 77 74
75 73 77 78 78
75 76
78
78 77 77 78 78 78 74 74 78 75 78 77 76 77 76 75 77
77
75 77
77 77 78 75
78 16 78
7a
7a
7a
7a
- ?a
73
-
APPENDIX B
STATUS OF TIMBER SUPPLY AREA FOREST INVENTORY
€SA: Envlronmentally Sensitlvs Areas

- - t -
1 1 1 1 1 1 1 1 1 1 2 2 2 2 2 2 2 2 2 3 3 3
3 3
3 3
3 4 4 -
IV. INVENTORY REPORTS Page IV-15
Status of Tlmber Supply Area Forest Inventory
TSA
NmO
1
Merrltt 8 W r l d e 7 MackenZla 6 Lll looet 5 Laker 4 Kmtney Lake 3 Kisplox 2 Kamloops 1 Kalum 0 Invermere 9 Fort Nelson 8 Golden 7 Peace (old) 6 Cranbrook 5 Cassiar 4 Bulkley 3 Boundary 2 Arrow
'0 Horice 9 Mld-Coast
1 North Coast 2 Okanagan 3 100 Mile HOUSO
4 Prince George 5 Ween Charlot te 6 Quesnel 7 Revel stoke 9 williams Lake 0 Fraser
2 Quadra (old) 1 500
3 Kingcome
8 Arrowsmlth 7 Strathcona
9 Sunshine Coast
1 Oawson Creek
4 NOOtka (old)
0 Fort S t . John
YEAR(S) BY SWRCE
OLE
1984
85 a3
-
83-86
86
86
84 86
84
83-85 84
1 . 85-81 83-86 82-84 84.85 86
82
-
- RI -
1982
88-89 79
79-82 85
82 ea 87 89
88.89 - TSA Inventory source:
OLE - Direct label entry (coded map label entry)
RI - Reinventory ( r e s t r a t l f i c a t i o n on nen photos) I U - inventory update (detailed attr ibute entry)
RB44RKS
eo 140 and 141
;eo 137, t 3 8 and 139
'ee 137 and 138
1
IV. INVENTORY REPORTS Page IV-16
APPENDIX C
SUMMARY OF TREE FARM LICENCE TIMBER INVENTORY STANDARDS AND STATUS

IV. INVENTORY REPORTS Page Iv-17 - .
: ,
I
I :
I
1 1
i !
1 I
i ! !
s z s z
VI W m 0 z -r c n
IV. INVENTORY REPORTS Page IV-18
? 2
0 N
- $ C
E
LL 0 a :
.- I!?
W N o 0


IV. INVENTORY REPORTS IV. INVENTORY REPORTS Page IV-22
APPENDIX D
SUMMARY OF TREE FARM LICENCE NON-TIMBER RESOURCE INVENTORY
TFLI
1
3
5
6
7
8
9
10
14
15
16 17
18
APPENDIX D
SUMMARY OF TREE FARM LICENCE NON-TIMBER RESOURCE INVENTORY
I Other (than Tlmber) Resource Inventory
Soil study Kileen Bbdc: Recreation and Landscape. Fish and Wildlife habitat
Recreation Inventory biogeoclirnate map by MOF slaff. Fish and Wildliie habitat to provincial guidelines
Range. Soils. Wildlite. Recreation. M i n i , Trapping studies only Recreation. Ecosystem and Resoutw Folios to MOF standards. Fish stream classarcatin and eagle nest survey.
Fmrn m a x to detailed inventories con&Ued for: Fisheries, Wtldliie, Recreation and Geotechnic. Dec 31, 1981
CIL - Recreation. Soil. Wildlife Capabinties. MOF - Range,
used Recreation, Water quam procedures
see m MI
Gdzzly bear population and habttat inventory 1988/89
Si. Terrain and Biogecclimatic inventory completed 1980-81.
Fs Stan. Recreation inventory was mrrpieted by
including Fish and Wtldlide (CIL) Full ESA classification to FS standards
data to MOF standards. standards. Range and Biieocllrnatic
See TFL #49
Recreation survey to MOF standards In 1986. Terrain and slope maps 1982.
Nexl Flve Yean Plan for Non-Tlmber Inventorlea
Soil and terrain mapping and wildlife habitat - lshkeenich drainage. B k g e o d a J s i i n .
More detailed meation inventory
No plans to expand these actwtles
Recreation and landscape sensitivity survey underway. Others will be updated as nttcessaly.
Additbnal Recreatbnal Inventories planned for 199041
Not specified
see m ~9
Recreation inventory underway. €SA daJstkatiin will be conducted
None planned
CUmnt information will be improved and disease suweys and hazard ratings
See TFL #49
Unknown

IV. INVENTORY REPORTS Page IV-23
m e
19
20
21
23
24
25
26
30
31 32
33
35
37
38
Other (than Tlmber) Resource Inventory
Recreation. Fisheries and Wildlife range data to pmvincial standards (198849). Soils partially completed.
Wlldlire, Soils. Recreatbn. etc. to PMlal by drainages of Fades,
agendea
Wlkllife, Soils. Recreatbn, etc to Partlal by drainages of Fsheries,
standatds acceptable to reswICB agenaea
Full €SA dassiRaWn and detailed
and watenhed inventodes to me Recreation, Landscape. Wildlie habitat
appropiate r ~ s o u n x agency standards
Ecosystems completed for enllre TFL, Including soils. vegetauon. stability. Landslide invenbty maintained. Recreation identffled.
Reueatbn ecosystem fish streams. eagle nests, archaeological sites
Recreatbn 1966
standards acceptable to IOBWICB
Recreation and Landscape inventory presently underway. Fish and wildlife habiial capability maps provided by MOE
see TFL #49
CU data used for soils and wildlife.
agencies. Recreation inventory compiled by other
Recreatbn inventory to MOF standard In 1988
Recreation, Soils. Wildlife. Fsheries inventories as well as Forest Disease (Root rot. insects, etc.) inventories
Recreation inventory in 1986.
study in Elako Watershed. Resoune folio and moose habitat
Next Five Y e a n P h for. Non-nrnber Inventories
Soii as required. Wildlife lo GIS format. Upgrade Fisheries data.
None
None
Refining WcUife inventory and updatino Recreation inventoly
None
Update exlstlng inventories as mssary
data Update and extension of Recreatbn
Annual updates only
None planned
Integrated Forestry-Fsh and Wildlife w Update Wildrife and Habitat inventories, as well as Recreational and Fsheries inventories
None planned
IV. INVENTORY REPORTS Page IV-24
TFL #
39
41
43
44
45
46
48
49
51
53
54
Other (than Tlmber) Resource Inventory
1974-83 Fisheries. Geotechnical. Soils and Wildlae inventories to various intensities. Recreation inventory also (less B k k s 5 and 7).
statandard to subzone level (1989) (ESA Biieoclirnatic dassificatbn. MOF
dasskatbn - 3C)
Fish and Wildlife -' 1989
Recreation and Tenain and Stability survey as w e l l as Carmanah Repolt
Range, Slope Stabimy, F-ries. Recreation, Stream
Ecosystem. Streams, Biophysical. Deer Range. Recreation. Fsheries. Tenam
Recreation and Range inventory completed by MOF
Bbgeoclimatic classification and partial €SA on Block 8. Recreatbn. Soils. Fish and Wildlife. Grazing and Watar Inventories assembled.
Recreation, Landscape, ESA Classification and Streams funded by Westar
utilized existing government branch information lor recreation, wildlife and range, as well as obtained additional information
1985 - Wildlife population and habitat inventory. 1978 - Soils survey.
Next flve Yean Plan for Non-Tlrnber Inventorles
Recreation Inventories for Blocks 5 and7
Wildlife studies planned for selected drainages or parls of drainages I
Recreation
Landscape inventoly and Recreation update
Wildlire and Fsheries updating Recreation and Landscape,
R&atbn inventories of Rosemider and WaoXan. Aquatic inventory for booming. Slope inventories.
No specitic plans, siluatbn monilored
Complete €SA dassifwtkm
Wildlife
Recreation and Wildlife data update and other tasks will be perlormed as specified in Me F L dOQlment
Landscape inventory to be completed in 1990

i i I I
IV. INVENTORY REPORTS Page IV-25
WILDLIFE RESOURCE INVENTORY
SUMMARY
The Minisay of Environment, Wildlife Branch is responsible for conducring and maintaining an inventory of the wildlife species in the pmvincc Hands-on wildlife management n q u j r r s reliable data on animal population levels and mds. as well as
Branch is carrying out the inventory of wildlife populations and habitat capability separately, recognizing that each is a resource in iW, requiring specialist knowledge. Wiwife managcn need good information on how &y animals, the quality, quantity and distribution of various habitat, and knowledge on how the animals use those habitan.
knowledge of the kinds of habitats requilul to mppa the populations. Wildlife
There are 630 species of wildlife in the province. These include 143 mammala, 448 birds. 19 reptiles and 20 amphibians. Population inventory efforts have concentrated on the big game species; a& ClL; mule dea, whitetail deer, moose, sheep. caribou and mountain goats. Limited efforts have been made far black bear. grizzly btar and wolves. and no inventories have betn carried out for the fur-btirras ami small animals. From our discussion with MOF staff. there is an obvious w i d q r e d dissatisfaction with the level of wildlife invenmy informarion. Even with the ungulate species, for which the most data is available, adeqw levels of opcxatiod inventory have not been achieved
Habitat inventory is being canid out to classify and map habitat capability and to pvide information to support ~CSOUICC managcmcnt decisions to improve animal habitats. Small-scale habitat mapping of the province is c o m p ~ t e d Larger-scale habitat unit mapping for regional planning is qui= incomplete; e.g.. of 1,100 maps needed to cover the province, 134 are p d y finished
Ovaall. the inadequate level of the provincial wildlife inventory is due to the ongoing lack of govemmnt funding for this program. The generally poor level of infomation available to wildlife managers mans they are unable to adopt informed objective decisions when involved in integrated resource planning issues which will affect
IV. INVENTORY REPORTS Page IV-26
The MOE staff estimates an additional annual funding of at least $2.5 million per year is r e q u i r e d . for critical population inventory studies. Completion of the habitat capability mapping will require in excess of $12 million.
INTRODUCTlON
The Minisay of Envimnment (MOW has the mandate to protect the wildlife resource of British Columbia According to the =st recent available MOE Annual Report (1987/88), the goal of the Wildlife Management Program is "to manage the wildlife resources of the province for the benefit and enjoyment of the public, by maintaining an optimal balance between ecological, culanal, economic and rwcational needs.".
The objectives of the program as sta ted by the MOE are to:
Maintain and enhance wildlife and wildlife habitats. and th-by ensure an abundant, diverse and self-sustaining wildlife mource throughout British Columbia;
Mainrain, enhance and pmmote recreational oppormni t ics to hunt game species in their habitats;
Protect pcoplc and their propury from intolerable levels of danger, damage or harassment by wildlife.
Wildlife management requires both a knowledge of population trends and the habitat that suppons the population. Each is a remurcc in itself and requires separate specialist knowledge and inventory. ?be inventories of wildlife Population 'and habitat are dealt with as two sections in this review.
wildlife management Wildlife are often forced to adopt a protective position, rather than approach an issue from a management pmpectivc.

. . . .
IV. INVENTORY REPORTS Paae IV-27
WILDLIFE POPULATION INVENTORY
Introduction
According to MOE paso~el , no formal criteria have been established for a population inventory and most inventory effaa have focussed on providing information to deal with managcmtnt ism at a regional .level. has been an ongoing shortage of manpwa and funding to complete a comprehensive inventmy. British Columbia has 6 3 0 s p c c i t s o f ~ ~ 1 4 3 ~ 4 4 8 b ~ l g r e p e i l e s a n d u ) a m p h i b i a n s . The development of wildlife inventory pmcedum has conccntTatcd on species of management concern. This includes big g a m species which are being managed to M e t public dunand for hunting and viewing, and monitoring of tbrcatcned and mdanged SpCcieS.
Provide a paorized listing of species for inventmy evaluarion and development that recognizes both c W f c f f c c r i v e n c s and the sensitivity of each speaes to management actions;
Develop standatdized inventory mthcdology and rcporring formMs to ensure consistency and compatibility in inventory data regarding population size, mnd and srmcture;
Develop and implement standards for precision and acclnacy in conducting inventories;
Denlop a computaizsd smag&aieval systcm for population inventory;
- Develop monitoring program~ for prioity species within the various ecologicd zones of the province.
IV. INVENTORY REPORTS Pam IV-28
The MOE population inventory is being used to:
Determine population sratus and establish realistic objectives for sustainable popularion levels;
Detcrmint sustainable population levels:
Assist in cosrdinatcd land use planning (Le. forest land-use decisions illc held back until wildlife recommendations arc made);
hvide cost-benefit assessments of rcmurcc developments;
hvide data input to assist the habitat inventory.
Status of the Inventory
The MOE achievemeno to dare arc:
Standads have b a n set for the accuracy and precision of the ungulate inventories. such as deer, moose. elk, caribou. sheep and goats. (Inventory pmaxlm guidelines and reporting formats for these ungulate inventories were not available at the time of the interview - Reference #I);
A computerized ungulate inventory database is available for Storing. retrieving and analyzing dam
A computerized coastal water bird inventory database is also available;
A list of wildlife species. tagged by colours rcd, blue and yellow, has b a n coaqded for management 'purposes to indicate which arc endangexcd sensitive, and not at risk. This list is continually updated (Reference #2);

IV. INVENTORY REPORTS Page IV-29
A. list of population estimates and stam as of 1987 for selcctcd wildlife Spccie~ (Refa to Table W-I);
A list of vmebratcs of B.C.. with scientific and common names has been compiled in conjunction with the Royal British Columbia Museum and the Minisq of Tourism, Recreation and C u l m (Reference #3);
Thc MOE wildlife population inventory is s t i l l incomplete. These gaps include:
Presently, 40 species arc considered to k at risk bccause of low population levels or vnlnerabie becarue of dedining populations. ?he stilllw of these species needs to be demmined;
Inventories arc needed for camivms such as wolves. grizzly bears and black bears.
IV. INVENTORY REPORTS Page IV-30
TABLE IV-1
WILDLIFE POPULATION ESTIMATES AND STATUS, 1987 (Selected Wildlife Species)
SPECIES SEASON NUMBER STATUS ESTIMATED
Endangered
American White Pelican Bunowing Owl Sea Otter Vancouver Island Marmot
Large Mammals
caribou Black Bear
cougar DWG
Black-tailed Mule white-tailed
Rocky Mountain Roosevelt
Elk:
Grinly Bear Moose Mountain Goal Mountain Sheet
Rocky Mountain California Stone
* Dall wolf
Blrds
Bald Eagle
Trumpeter Swan
Canada Goose
Spotted owl Peale's Peregrine Falcon
Banow's Goldeneye Ruffed Grouse
Breeding Breeding
Spring Spring
Fall Fall Fall
Fall Fall Fall
Fall Fall Fall Fall Fall
Fall Fall Fall Fall Spring
Spring
Winter Breeding
Breeding Breeding Spring Spring Summer
200-250
350-500 1 known pair
200-300
120.000
3.000 13.000
200.000
42.000 140.000
35.000 2500 12000 170.000 55,000
3,000 2.500
500 12,000
6.000
15,000 adults 5,000 immatures 4 0 0
30,000 5.000
200 c25 90,000-130,000 3-4 million
Stable Fluctuating Increasing Increasing
Stable Stable Increasing
Decreasing Increasing Increasing
Increasing Stable to increasing Stable Stable to increasing Stable to increasing
Stable Increasing
Stable Stable Increasing
Stable to increasing
Increasing
Increasing Stable Decreasing Stable Fluctuating

IV. INVENTORY REPORTS Pam IV.31
SPECIES SEASON
Small Mammals
!
Badger Spotted Skunk Mountaln Beaver
Western Harvest Mouse Deer Mouse
Beaver Marten Muskrat Wolverine
Mountain Cottontail Spotted Bat Pallid Bat Fringed Bat Keen's Bat Townsends Big-eared Bat
Whit&ailed Jadc Rabbit
Summer Summer Summer Summer Summer Fall Fall Fall Fall Summer Summer Summer Summer Summer Summer Summer
Amphlbiana
Tiger Salamander Pacific Giant Salamander Summer
Summer
Reptlles
Painted Turtle Summer Short Homed Lizard Sharptailed Snake
Summer
Western Rattlesnake Summer
Gopher Snake Summer Summer
ESTIMATED NUMBER
500-1 .OOo 2.500-5.000 1.500-3.000
Several billion 2.000-3.000 400.0oO-600,000
3.000,OOO 160.000
5,000 0-?
30.60. 1.000-2.oM)
40 1,000-2000 1.000-2000 2.000
2.000-5.000 750-1.000
15.000-20,000 0-? 2.000-3.000 10.000-20.000 10.000-20.000
STATUS
Increasing
Stable Increasing
Stable Decreasing
Stabk, Increasing
Stat& fluctuating
Decreasing Decreasing Decreasing Decreasing flUChJating D-ng Decreasing
Decreasing Decreasing
Decreasing Decreasing Decreasing Decreasing Decreasing
IV. INVENTORY REPORTS Page IV-32
Methodology
Most field inventories arc conducted by Wildlift Branch biologists, but consultants are also used Inventoxy methodologies vary by species and area, depending on what is thc most effw5ent method of obtaining information on distribution, numbcfilands and population composition. As many wildlife species do not lend themselves to direct census (LC., counting the number of animals on a given area). indirtct techniques arc used, such as biophysical capability mapping and population indices (e.g., number of deer o b d per kilomttre of road, number of wolves observed per day hunting, number of mmse observed per hour for hunting). General population status is also determined from trapping and hunta harvest infomation.
The most reliable inventory is obtained for ungulates because population survey sampling methods arc much mort reliable even though many surveys lack estimates of
surveys, have limitations related to the fqucncy of sampling. and resolution of the data. For ungulates. population estimates t y p i d y have a standard Q~OT that m g e s from f1596 to SO% of the estimate a! a 909b coniidmcc leveL Since most of these surveys do not allow for sightability bias. the actual precision ia lcss than indicatai.
precision and a~clrra~y. E m statistically-baad urimates. dcr iv td from samplc-bascd
~cl iminary guidelines for tht of mgulatc in~mtolies a listed in Table rv-2.
Population inventory has always been acknowledged as being weak or absent for many species and arcas of the province. Radio-telcraepy studies of ungulates have recently indicated that unbiased population estimates are even m difficult than previously r e d i d , due to annual changes in distribution and behaviour, which confounds census l-CSultS.
Carnivore (e.g.. wolves) populations are counted by helicopter surveys because vast open uacts of land can be covered. This is only feasible in the northern part of the province w h e n the large expanses of open land facilitate reliable tallying due to good visibility. A similar inventory technique is impractical in coastal arcas because of the more densely forested terrain; thus the carnivore management program is hampered by a limited inventory.
Source: Wildlie Management Operations, Wildlife Brand. MOE

IV. INVENTORY REPORTS Page 1\11-33
TABLE IV-2
PRELIMINARY GUIDELINES FOR UNGULATE INVENTORIES LEVELS OF PRECISION AND ACCURACY
LEVEL
1 2 90% 3525%
909'0 f l Q % Inventory Development Population Research
3 90% S O % Intensive Management (Key Ungulate Areas) Less intensive management
1
Ungulates to be inventoried include
Deer; Elk; Moose: caribou; Mountain Sheep; Mountain Goat.
Inventory of furbeams (e.g.. matens. lynx) present logistid problems because the animals am vay ScQctiYc and difficdt to sumy. Even the firrbcartn which an easier to count (e.g., beaven. muskraa) cannot be inventoried because of lack of funding.
Shortage of manpower and funding for conducting and evaluating inventories is also a problem Geographical consuaints such as diEmdt access and harsh terrain only compound thc problem
Limitations
All species surveys, without exception, could be improved with increased funding and staff support even though the inherent difficulacs of clusivc sec~~t ive habits, dif5cult main and forested habitats hinder the data colleftion. The cxtrccnuly limited budget only worsens the situation. The increasing public environmental awareness means much more data and knowledge of the non-gam species is required. This funher increases the need for additional inventory funding.
IV. INVENTORY REPORTS Page IV-34
Population estimates for many ungulates, carnivores. furbearers and birds arc infomed guesses. based on harvest levels and opinions of MOE regional wildlife staff. The estimated abundance of non-hunted species could be very inaccurate.
Improvements in acrial unguiate surveys will come from development of correction facton for methodological biases and optimizing sampling procedures. Additional research is required to makc these improvements.
Thm is an inability at this point in time to m e w the full impact of various resource development projects because of a shortage of manpower and funding. For similar reasons, the MOE is unable to react expeditiously to population declines, and introduce management improvement measurts.
Population inventory is an ongoing rnanagcmcnt aaivity. The MOE is concerned that inventory information is still lacking for many species, particularly camivms, furbcartn, uplaad birds, reptiles and amphibians. The lack of inventory also continues to be a major problem in the management of threatened and endangered species. raptorial birds (e.g., eagles. hawks), watafowl and ungulates.
WILDLIFE HABITAT INVENTORY
Introduction
Ecological classification and mapping &ne by thc Wildlife B m c h of the British Columbia h4inisuy of Environment is oriented toward identifying habitat for selected animal species. such as ungulates and bears. The emphasis on other animals is developing as requests for this infomation inmase. ' lXs is being achieved through a program of biophysical mapping. The two main goals of biophysical mapping an (a) to provide a hamework to assess the suitability and capability of the land surface for supporting wild animals; and (a) to provide a framework for improving animal habitats. The biophysical classification describes and maps arcas that have relatively homogeneous climatic, physical (including soil) and vegetative characteristics of imporma to animals.

IV. INVENTORY REPORTS Page IV-35
The management objectives of the MOE Habitat Inventory section arc:
Sem'ng Srandards: Set standards for habitat evaluation through committee representation by publishing methodologies and guidelines and through workshops and psentations;
Mapping and Imerprewionr: ' To map important habitat and provide ecologically based intupntations for the managcment of such habitats;
Inventory Research To conduct red to improve the identification of ' characteristics of important habitat, and as appropxiatc for method development for inventory and habitat management techniques;
Providing Expert Advice: To provide tcchnid and specialist advice related to wildlife and habitat inventory and land managemen: for wildlife and environmental issues.
The inventory is designed to provide management infonnaton at the following levels:
scab VP of Msp uses
1:soo 000 Ecoregiorveicgeoclimatic urns - Regional planning - Inventory stratMcatbn
1:ZO 000 Ecomgbn/eiieodimaic Habitat UllitSandCapabiMy
- Emad scale planning - Census stmtikatiin
150 000 Habitat unit capabilii ratings for - sukegiinal plans ungulates and grizzlies - Habitat protection - Selecting enhancement areas
- Co-ordinated resource plans
1:20 OOO Habiial Unil classifiibn - Operational planning - Habitat protection - Co-ordinated re!source planning
. . .. ~~ ~~~ .~
IV. INVENTORY REPORTS Page IV-36
Status
Habitat mapping that has bccn completed to cover the whole province includes:
1:2 OOO OOO Eco-regions (Regional Ecosystems). 1 map;
1 5 0 0 OOO Regional Wildlift Habitat Maps (Ecoregions and Biogeoclimatic units, 15 maps.
Habitat mapping that is in progress includes:
1250 OOO Northan Biophysical Mapping (areas with limited access). Of 37 map sheets, only 10 ale paltially finished. These cost $1oo.OoO pa map sheet and will require $2.7 million to complete;
150 OOO Standard Biophysical Mapping (mas with intense land use competirion cc management needs). Of 1.100 mapsheets the goal is to complete 600, of which 134 arc parriauy finished. These cost $2O,ooO pa map sheet and will require $5.3 million to complete;
1:20 OOO Detailed Biophysical Mapping (areas quid by policy or with intense management needs). F i i spccial areas completed, which represents less than 1% of the arcas to be compictcd The cost of completing this plan has not been detcxmined;
1 5 OOO Estuary Mapping, about 15 maps are completed which represents less than 10% of the estuaries The cost of completing this has not been detnmined

IV. INVENTORY REPORTS Pam IV-38 IV. INVENTORY REPORTS Paae IV-37
Limitations Methodology
The Habitat Inventory infomation is collected from 3 main SOUTCW:
Li tcran~~ and file searches;
Intcmiews and consultations with staff biologists and other inventory specialists from other minis&,
Field sampling.
Fild crews usually consist of a pedologist, who interprets bcdrock geology. s u r f i c i a l materials and soils; a vegetation ecologist who intqmm climatic parameters, succession and stand characteristics; and a biologist who intcxprets current aaimal use and potential occurrence. All art nxponsiblc for developing habita! management interpretarions. The -test successes began when scientists h m al l thne disciplines were present during field trips, agmd to rhe location of each plot and then simultanwusly sampled the site. hmpremions and unit dclkrtation WQC also best served when the s a m e air photos wue used.
Accuracy and Reliability
Accuracy is related to scale of mapping and intensity of survey. Most of this information is based on nconnaissan~~ level field inventory and air photo intUpkltiOn.
Idonnation is based' on limited field work. that is usually collccted over only one or two years: longer term data collection is much morc desirable. Climate information is commonly insufiicient as it is usually only represented by valley-bottom climate stations - no regional climate networks exist for most of the province.
The habitat inventory mapping is used to express habitat capability values; i s . the ability of the land to produce wildlife unda its optimal successional sw. MOE staff feels then is a necd to describe what the habitat is currently able to produce (habitat justification). Given that so much of the habitat mapping is incomplete, therc is a concern that integrated resouxce management is pr;cctding without an adequate habitat inventory base.
COMMENTARY
Historically, there has been little n d for a wildlife inventory. Gamc populations w e n not being markedly affected by human activities, and the supply of animals for hunting greatly excecdcd the demand. Today, however. hunting pressure in many arcas of the province exctcds the supply and thuc is a dirc n d to ensum that populations are not overexploited either through harvesting or development.
Popul&on inventory was originally dircacd almost exclusively to the ungulate group. According to the MOE, this was primarily to Q I S ~ that papulations WCIC h a ~ ~ ~ s t c d at sustainable levels and btcausc hunting was primarily the main public interest. Now, however, then is an incnased concern and awareness by the public to protect threatened and endangered species. and there is mort pressure to manage the rtsourcc accordingly. Land managas a h n d mre information on furbearers and small tnammals, including rodent species. to improve forest management practices and land use allocations.
F m s q land use decisions art often delayed because of a lack of available data to make informed decisions. The MOE takes a protective stance due to the unavailable dat& whereas a rapid decision could be made either way, if complete inventory information was available. Due to a shortage of staff. most studies are done on an ad- hoc basis.
The wildlife management goals are not necessarily achievable or measurable at present. They arc used instead to provide general direction for individual activities. The need for reliable population inventory still remains as one of the Wildlife Program's greatest management requirements and a major funding initiative is nceded to increase inventory activities. The wildbie manager needs to know how many animals, the

IV. INVENTORY REPORTS Page IV-39
quantity and quality of various habitats and the dismbution of those habits. A 4nowledge of how animals usc these habitats is also required.
On the basis of comments from interviews ihth MOE personnel. an increase in staff employas to conduct the required inventories is necessary. These same individuals would compile the inventory data and pxcparc the final s u m m a r i e s and qorts. It would provide the continuity in collecring the field data where consistent intcrprctarive assessment is required to provide reliability.
It has been smngly suggested by MOE staff and also from ofher organizations that an integrated team of professionals from various biological science disciplines is necessary in orda to conduct the necessary Habitat Invcntoxics. The purpose of such a group would be to integrate experts hrn various fields. to encoraagc aa -tanding of the larger picture in orda to help &vclop mourn managcmcnt
Not all the 630 wiwife specits will have population objectins. Species that ire
I& The g e n d ordcr of priority wiU be the red list (cndangcxui and thruuened) followed by the blue list (dve requiring attention) followai by the yellow list (not ColWidQcd at risk). At pnsens without a confirmed budget, it is not possible to priork species within each list.
It is clear that a major inacase in funding is Equind; but it is also imperative that if this is provided, then there should be a commitmtnt by govanmnt m follow through with new wildlife management policies as a dt.
endangued or are bdng managed to mctt public dCmand will have populatiw target
.- .
IV. INVENTORY REPORTS Page IV-40
REFERENCE MATERIAL
ne sources of the above informarion came from penonal. phone and questiomairt interviews with:
PERSONAL INTERVIEWS
MOE W W f e Branch Bruce Pencrgast, Manager Habitat Inventory Dmnis Dcmarchi, Habitat Classification Specialist Dan Blower. Ungulate Specialist Ian Hatter, Inventory Biologist Andrew Harcombe, Habitat Rcscaxch Specialist
B.C. Wildlfe Federation Charlie cornfield
PHONE INTERVIEWS AND/OR Q U E s T I O N h ”
B.C. WildIfe Fehmfion Don Robinson, Board of Directors
Westland Mike Hahan, Journalist
UBC Forese Fred Bunnell. Wildlife Biologist
LlTERATURE REFERENCES
#1 MOE Wildlife Branch. Ungulate Inventory Database, Inventory Guidelints #2 MOE 1989 R d , Blue, Yellow Lists (Species Status) #3 The Venebrates of British Columbia, Unpublished Wildlife Rep?, 1989.

IV. INVENTORY REPORTS Paae IV-42 IV. INVENTORY REPORTS Page IV-41
Some profound quotes made by various interviews includd
"How can land use decisions be madc without an adeqw inventory?"
"Farm thc work out to consultant%"
"Without the necessary informadon. everyone is dissatisfied with cvaything."
'The main difficulty is defining how the rrso~cs are going to be managed."
'The problem is timc and shurtage of money. Then is no problem in finding people if they had the money."
"Compromise is needed amongst the scientific typts."
Like DFO. the MOE bas assembled large amounts of fishery inventory data since field surveys wae started in 1949. However. thae has been inadequate funding to maintain an ongoing updatcd inventory program. Achicvemnts include a rtconnaissancc level inventory of 20% of lakes and 10% of - s u c a a ~ ~ in the province. detailed inventory of less than 1% of s u c a a ~ ~ , and fish species distribution, for most of the proviuce have been delineated. Most of the existing data is not readily accessible, and has not been entered into a computer databasc or has not been updated.
At the present funding level the inventory informaaon is unlikcly to be completed at a regional or provincial level. Cumnt effom art focussing on entering the existing information onto a computerized database so that it is mort readily retrievable.
FISHERIES RESOURCE INVENTORY
SUMMARY
The 'Federal Department of fisheries and Oceans @FO) is responsible f o r the management of the fisheries rcsource in the province. In practice, they have limited themselves to managing the saltwater fishuy (e.g.. salmon, steelhead) and have delegated to the B.C of Environment ' WOE) the responsibility for the freshwater fishcry (e.g., lake mut and bottom fish).
As there is a large degree of overlap by both Miuisuics in managing the fish habitat, a strong spirit of coopaation and communication has developed which prevents duplication in collecting inventory information.
Ova the yeas. the DFO has collected massive amounts of data on fish populations and habitat data bur have not developed a dcfincd systematic approach to maintaining an updatcd inventory dambase for use by fisheries managers. A Sa*un Information Summary System has been dcvclopcd and is in the process of king entered into a compumiEcd databue. Stream information from 3500 me am^ supporring salmon popuiations in 42 subdisnias have bcen entered onto compum. To complete provincial coveragt, infamation from 5 0 stnam~ in 6 DFO subdistricts remain. Thae is considerable variarion in thc level of inventory information for each stream, which is dependent 011 the funding available for field surveys. Dm's main priority at present is to develop a fully computrrizcd accessible invenmry databasc. We wen unable to obtain an estimate of the funding level required.

IV. INVENTORY REPORTS .Page IV-43
MOE, Ruxational Fsheries Branch staff recently estimated it would require an annual budget innease of about $3 million and 20-30 new staff to bring the inventory to an acceptable level.
INTRODUCTION
The Ftderal Department of Fsheria and Oceans (Dm) is responsible for the management of the fisheries resources in the provincr* La practice, DFO has limited itsclf to managing the s a l t w a t e r fishcry. hgraphically, this means DFO ' has an interest in maintaining the fish habitat of all the coastal drainages and the major
Skeena River and Babine Lake. Fish popukiona rn being managed ftx both the commercial fishing indusay and spommcn. 'Ihe responsibility for h h water fishcry has been delegated to the B.C Ministry of EnviroMlent, Rcatadonal Fisheries Branch WOE).
Both minismies have collecocd considuable amounts of data a d informmion on the fishery I~OUTCC; however, an WQall encompassing inventory covering the province has not been established
The minisuies. however, arc co-operating in a Fsh Habitat Inventory and Informanon Program. Ihe overall goal of the pro- is to compile a compnhensivt inventory of the quality, quantity and produaivc capability of fish habitats in fresh water, estuarine and marine environments of British Columbia.
For the purpose of rhis rcview. we have distinguished between the inventory activities of both ministries by pparing separate sections.
In view of the shared management xeesponsibility, thae is a large overlap when: both minismes have an interest in fish and thdr habitat and therefore there is an inherent necessity for cn-operarioa and commuaicadon to prevent duplication of inventory collection. The DFO decidu on how many commercial fish can be harvested and sets sports fishing regulations. whercas the MOE ultimately decides how many h s h water fish can be harvested.
interior rivers and lakes systems that produce s a l m o n and 0cean-going mus e.g.
. ~. .. . ~~~ ~~~ ~~
IV. INVENTORY REPORTS Page IV-44
FISHERIES INVENTORY (DFO)
Introduction
DFO is compiling i n f o d o n for anadromous fish (e.g. fish that return to fresh water to spawn). The criterion used in developing the inventory is not well defmcd. The intent, however is to gather as much i n f d o n as possible on all streams in the province with regards to fish and fish habitat
The goals of the inventory are to:
Provide a user-friendly computerized database containing fish population and fish habitat data at a s u m m a r y level for all streams in B.C. and Yukon for use by resource managers in heir planning;
Provide a s y s t e m for which information can be easily added or updated;
Prepare thmratic.maps of selected fishairs information (bast m a p s with certain themes) at 150 OOO scale, and to eventually makc the maps available on a Geographic Information System (CIS).
The purpose of the DFO inventory is to assist in:
Initial screening of logging plans and other rcsource dcvelopmenu affecting fish habitat related;
Providing an overview of prcduction planning potential for fish stock management purposes by the DFO;
Selecting s u c a m s for enhancement, restoration or management activities;
Identifying s t r e a m s for research studies;
Providing fish habitat information to agencies, companies and the public:
* Preparing Stream Summary Catalogues for use by DFO and MOE for management purposes.

IV. INVENTORY REPORTS IV. INVENTORY REPORTS
Page IV-45 Page IV-46
The main achievements to date as related to us by the D M arc:
TIIC computerized smam ~nfaamation summary system CSISS) has been completed. The SISS is designed to document al l the cxisdag fish habitat information available s a e a m by stream The system can k viewed inter- actively via a computer terminal. or as hard copy S t m m Summary Repom for individual streams. watcrshals and DFO suWcts of MOE;
Sneams from 42 out of 48 D M subdise haw becn enrend onto the SISS. repmeming 3500 signikant streams
All known sactams which s u p p o r t salmon populations. and have documented information. have bcen entered on the systcm;
~ T h e ~ s t e m ~ b e ~ ~ b y ~ t ~ t o a ~ ~ u t e r ~ b y using a personal computer aad modtm;
Mapping of seltcted themaric infolmadon has been complcad for those locations whcn informarion on the computerized database exists. .
The gaps that are left to be completed arc to:
Enter the 500 s u e a m s from the remaining 6 DFO subdistricts onto SISS;
Enter MOE informasion for sueams under thdr juidcrion CLC. hshwatcr fish and resident species);
Evenrually install a GIs for mapping of fisheries thematic information.
The DFO has plans in the future to:
Develop watcnhcd production plans: i s . establish target escapement numbers for each s a e a m to help determine basehe populations for planning purposes. (Escapement is the number of adult salmon =turning to their home smam to spawn.);
Priorize production planning (LC. concentrate efforts first on the most productive and potentially productive streams and then to a lesser degree as the productivity dccxascs);
Determine what fish and fish habitat information is insufficient f a production planning purposes and collect the additional informanon h u g h field surveys;
Identify priority arcas where development is occurring and is likely to occur so that the information will be available when rcquina
The DFO ~ U S O M C ~ we interviewed werc reluctant to provide estimates of the costs to complete the above tasks as they apc psent ly in discussions with MOE to finalize budget estimates. At present, thcy art arranging meetings to supply ttie pcrrincnt dollar figures.
Methodology
An initial fask of the Inventory Pro- was to compile cxisting fish habitat infomation on a stnam-by-sueam basis.
A Smam Survey Manual has been pxeparcd which contains a detailed description of inventory approach, pn-inventory activities, field methods. data analysis and mapping.
The DFO has used three ways to collect fish inventory information, including:
Field nips and s t r e a m surveys by federal and provincial fisheries s&. Information is recorded according to a detailed smam survey field g u i d e (Reference #l);
Literature sources such as consultants' ~~ports. personal memos and DFO and MOE repons and Nes.
1

IV. INVENTORY REPORTS Page IV-47
The information that has been enturd into the SISS and validated is considered by DFO to be reasonably accuxatc. However. while every effort has bccn madc to v e infomation they do concede some inaccuracies may be present The statistical reliability has not yet been determined.
It was foreseen at the early planning stages that thm would be varying levels of inventory information collected depending on the location, acccsdbility and available funding. Not all s u e a m s have documcntcd infomation even though they may support fish populations. DFO expects this situation will be red& as the data collection process continues. Other smeams have only minimal documented idormation due to limitcd field sweys which have been conducted on them
Specific strcam inforumion is u p d a d when new infonnalion for a ParrinJar system is obtained Only cenain individuals have update privileges within the region: some of these i n d i v i d h also act as scientific authorities to validate any informafion added
Limitations
In g e n d the fish inventory that is in progress is accomplishing the goah for which it was originally designed. However, it will become more usefal at the subdismct level once the information is accessible through a computuizd database. More funding is required to train DFO staff in using the computer network.
The use of handdrafted maps presents s o m e difficullics when it comcs to updaring. but with the implementation of a GIS system, this problem will be eliminated The DFO is in the process of reviewing thc various GIS systcms available and hopes to have a system installed by 1991. The DFO is cooperating with the MOE to ensure a compatible system is chosen.
The information gathering process is considend to be adequate. however, additional funding would allow a m a thorough search of the information in ctrtain areas.
. .~ . .
IV. INVENTORY REPORTS Page IV-48
FRESH WATER FISHERY INVENTORY (MOE)
Introduction
The MOE needs an inventory of the fresh water fishcry to improve their knowledge of species distribution, biophysical capability for management, and value for protection purposes. However, due to a shortage of manpower and funding,. MOE has been able to put in placc an organized systematic inventory program. At present, information is collected on an ad hoc basis, for example, when rcquircd to comment on logging plans for a specific sueam.
The MOE management goals for the inventory are to:
D&e the naturt and extent of the fish rcsourcc. the habitat’s capability and the physical susceptibility of the upiand and riparian zone to damage that would &en. s t r e a m quality;
Evaluate the fish and fish habitat rcsourccs in a regional context for management priority.
The inventory information is used f m
* Protection of fisheries resources from other developments around the habitat including adverse logging practices. mining activities and abandoned mine tailings;
- Managemcnt (e.& assisting MOE Parks Branch to detumine if mphy fish exist in a specific river, logging plan inspection);
Planning (e.& how many fish can be caught in a particular lake, size of leave strips in logging plans, etc.);
Assessmnt/evaluation (e.g. economic returns from fishing in the province).

IV. INVENTORY REPORTS Page IV49 P
Status
The goals that have been achieved by the MOE are:
0 Approximately 2 M of lakes and 10% of sf~cams have received a r e ~ o ~ a i s ~ a n ~ e level of i n v e n w ,
A detailed inventory of less than 1% of srreams that contain resident species of M has been carried out;
Inventory information for the major spawning s t r e a m s for stcclhtad in the southcm IR of the province has k e n obtain&
Fuh species disnibution in over 25% of the province has been delineated. This has bem &ne largely by extrapolation and rtasonablc assumptiow
A s m has been made on priorizing umagcmcnt activiaes.
The major gaps that the MOE is attempting to wqkte are:
Continued inventory collection of the above goals in a priorized m m .
Ridtation of wam bodies regionally for management. protccrion and enhancement programs (e.g. priori= by road accessibility. angling US^ and impending development):
Reparation of manuals to expedite and s t a n d a x d i z c the training pmces~es Of
MOE staff for dam collection;
Transferring hard copy inventory data onto the computer krfwmation retrieval system;
Access to a GB. At present the MOE is planning to install a GIS for use hy a l l branches.
IV. INVENTORY REPORTS Page IV-50
A rccent MOE study has shown that the Recreational Fisheries Branch would quire an annual budget increase of $3 million and 20-30 full timc employees to complete the inventory to their best ability.
The cost of a GIS and necessary software has not yet been detcnnincd.
Methodology
When conducting the habitat inventory the MOE follows the procedures outlined in the S t n a m Survey Maaual and Stream Survey Field Guide.
The collection of fisheries inventory data varies grtatly by thc type of sllr~ey rcsuir#l and the budget l e d Surveys are commonly canid out at a dsancc level and the detail varies, depending on whether it is for lakes or st~~ams.
Basically, a rtconnaissance level swey for a lakc involves: using a boat for bathomeay (meamring the contours underwater): using a nct for fish sampling to mcasurc species disuibution, length and weight; and d g water chdny for the MOE Water Management, Branch.
A r t c o ~ a i s ~ a ~ ~ c t level survey for a speam involves e l m s h & g (stunning the fish by means of an eltctric current) a defined s m a l l section of the speam to count how many fish are pxescnr This count is then exuapolatcd to give an estimate of how many iish are in the whole reach (a spcdic s t r e t c h of stream with similar characteristics).
More detailed levels of inventory collection are only canicd out when specific information is needed (cg. if a major steelhead river is liable to be disturbed by a major developmenL then a detail4 survey will be initiated).
Literam searches are &ne to minimize duplication of effort (ie. consultants reports and suiveys by other agencies). The MOE. working closely with the DFO in Vancouver, accesses its iaformation fim.
The accuracy of the information varia greatly by design (quick R C O M ~ ~ S S ~ ~ C C level for standard inventory VS. detailed reach inventory for specific developments), by virmc

I
.. .. .
IV. INVENTORY REPORTS Page IV-51
of technical change and by budget restraints. The sta t is t ica l reliability. thenfore varies g r d y due to the purpose for which it was coUcctd
Limitations
The limitations for MOE managenmt ‘applicaaons arc:
Lack of easy access to the inventory informaaon. Most data is in hard copy (in field note form as opposed to being entered in the computer) and h e m it is v a y difficult to acccw information, comparc it, and analyze i t The collection of enormous quatitics of data was not envisioned when the inventory program was inithad back in 1949. As a result thae is a huge backlog on hard copy data which makes quick retrieval of information very difticult;
Thac is not enough data of the right kind at thc right time (Le. the data collected 25 years ago may not be adequate for tcday’s needs and the very question of the reliability of extrapolation is in question);
Thcxe arc different wpcctations of inventory by different groups. ‘Ihus rhue is oftm a shortage of the “appmprh” inf- ic. there are very few common inventory solutions;
Only about 15% of the laku that w u e originally sampled have k n reinventoried to provide data for a restocking plan (the reliability of the information collentd 30 pars ago is questionable);
Thcxe is no procedure for direct inventory updating. it is &ne only as the need dictatcs (e.g. if t h a e is planned development in a drainage the MOE often has a low level of information from which. to assess habigt impacts;
The inventory i n f o d o n is unlikely ever to be complete in a regional or provincial context It can only provide an answer to a specific question at a particular time. Rcsent budget levels makc it unlikely that an overall inventory will bc completed for the province.
IV. INVENTORY REPORTS Page IV-52
COMMENTARY
Thcxe appears to be excellent co-operation between the DFO & MOE in the sharing of information and joint projects such as estgblishiog the S o w n S w e y Manual). The DFO and MOE an at prescnt jointly reviewing a suitable CIS. They arc carefully analyzing the various possibilities and are confming closely so that software applications wil l be compatible.
The MOE suggests that a systematic prioriztd approach should be used to obtain the information mort cost efftctively. At present, inventory tends to be coUected in response to operational demands and often there is a duplication of effm Bern long- temr planning is naded to avoid duplication of smam surveys. For example, considuable technical and cost cffidencies would be gained if fishery inventory could be schedultd with the long-term development plans of the forest industry.
Thc MOE also felt that intadisciplinary teams of specialisu would produce him value results. FIX example, a biologist, a mrain Jpecialist and a fluvial prcccsses specialist should schedule joint field studies to ensure complete data collection to reduct costs . Better coamunication amongst the Jptcialisa is essential.
A reasonable expectation of what the resouras caa produce must prevail to do the requid inventory (Le. how much of the resome caa we use now and how much needs to be left in perpetuity for a gene pool, aesthetics, supply, etc.).
Data should be clccmnically recorded and appropriate hardware and software should bc provided to manipulate the data sets.
The MOE perso~el interviewed feel that as they lack the budget to complete the Fisheries Inventory. the budgeting sources should bc examined This might include cost-sharing with 0th~ ~CSOUICC USCIS.
An issue paper is being prcparcd by the MOE emphasizing the high priority that the Ministry places on finding a way to improve the integmtd resource management process in the province.
It is clear that an adequately funded inventory program is a key point of this process. and unless budgetary allowances arc greatly incrcased, the whole issue of sustainable economic development is in question.

. IV. INVENTORY REPORTS Page IV-54 IV. INVENTORY REPORTS Page IV-53
RANGE RESOURCE INVENTORY REFERENCE, MATERIAL
SUMMARY The sources of the above information came from pcnonal, phone and qUCSuOMairc interviews with:
PERSONAL MTERYIEWS
MOE Fisheries B t w u h Stu Hawthorne, Senior Habitat Assessment Biologist Ray Travers. Forestry Spuaalist Gary N d . Senior Habitat Tcchm~an .
. .
F G M F ~ s ~ c ~ s - Bruce Reid, Habitat Inventory Coadhmr
PHONE DISCUSSIONS
B.C. Wildlfe Fehrmion Don Robinson, B o d of Directors
MOE Fisheries B m h Geoff Chislea. Head of Habitat Roteca'on Branch
* Peter Lewis. Head of Phymcal Processes Unit
LITERATURE REFERENCE
#I Stream S l a ~ e y Keld Guide. June 1989. Dep-nt of Fisheries & Oceans and Minisay of Environment
The Ministry of Forests. Integrated Resources Branch is responsible f o r the management and adminisuation of canle grazing on Crown rangeland within the province.
In 1987. then wen approximately 2,150 grazing pumits and licences authorizing 987,704 Animal Unit Months of grazing in the provinces. Thae is also an estimated 82 million hectares of potential forest rangeland within rhc province. The highest range use prcsently occurs in the Caribou, Kamloops and Prince George forest regions.
The administmion of the range program has been handled mainly at the Forcst Dismct levels and the inventory data to assist the range manager has been weak. As there has been a growing number of emaging management issues within the range prom the Ministex of Forr~o in 1988 ordcnd a Range Rogram Review. According to their qxnt published September 1989, thm is no compnhcnsive range inventory. With respect to range inmtory, rile xcport rerommcnded'
Complete basic inventory mapping of boundaries and improvement Develop a s u m m a r y of range forage production capability; Conduct field mapping of ecological paramctcrs. habitat and vegetation whcn required for spccilic managemnt problems.
TO date. 1.800 out of 3200 1:2O.O00 scale maps have been entered into a computeriztd GIs database with range adminisuarivc and improvement information. The Ministry of Forests is co-oprating with the hbisuy of Environment. Wildlife Branch to develop s t a n d a r d proccdms for field inventory to be used by both range and wildlife managcrs.
A Range Inventoly similar to a Tibcr Inventory may not be feasible due to difficulties in delineating vegetation community boundaries (range types). Intensive sampling and statistical analysis is needed to determine whether or not forest cover typcs can be used as a guide to determine range typa and what their respective forage capabilities may be.

IV. INVENTORY REPORTS Page IV-55 _II_
Due to the uncertainty of defining range types and their capability, the Branch has opted for the monitoring of range use and effects of management tools, such as prescribed firc. on the range production. The Rangc Review Task Force ncommended an incrw+se in professional and technical s t a f f to manage rht range program
INTRODUCTION
The Ministry of F0n.m. Integrated Resources Branch is responsible for the management, protection and conservation of foragc, habitat and vegetative resources for use by livestock. wildlife and other uses of range rcsouxccs. The range management mandate includcs: maintaining range ccwysttnrr to benefit commcniai and non-
'II intucsts. promoting induspies dependent upon range, allocating land between competing uses. d a i h g revenues for the provina bnn cotmmcial range WIS, administering a range tenwe system and integrating range management with other forest Tcsourc+s.
The Range Inventory includes mapping range unit boundaries and S r m C N T a l
improvements and interpretation of range pmductivity from forest cover, the collection of range biophysical data and vegetation surveys.
The objectives of the Range Inventcny arc to provide forest cover m a p s which depict up-to-date range adminisuative. improvement and vegetation information. as well as the collection and summarkation of range vegetation data. These tools ~ T C necessary to assist the managen to be effective in range management and the planning of range allocation. The Range Inventory should be similar to that of the T i k Inventory which states how much. what typcs. when and what condition.
Three basic inventories arc quired to provide useful data to the rangeland manager. These are:
Listing of adminisaative boundaries and the geographic descriptions of the range, such as a list of Iwu and pastures:
Listing of range improvements which includes a s u m m a r y and mapping of s m c m s such as fences. cattle guards and wata troughs:
IV. INVENTORY REPORTS Page IV-56
Listing of. range ecosystems summarizing vegetation types and forage production capability.
Range adminisuative areas and types of range ecosystems arc defined in Appendix A.
A Range Review Task Force was formcd by the Minister of Fonsts in 1988. The initial reason for the Review was concun from ranchers over a proposal to increase grazing fees. he ultimate goal was to &ve~op a mtegic p h to guide range management priorities in the fume. Its findings and recommendations wen published in September 1989. Their report describes the state of the cumnt Range Inventory. Resource users and managers from the public and private sectors pardcipated in the review. Comments from this review have been incorporattd into this report.
STATUS
The status of the Range Inventory can be described by the issues listed by the Range Program Task Fonc Review. The main issues identified arc quoted below:
"Thm is a lack of clarification of the mles and responsibilities of Integrated Rcsouras Branch and Inventory Branch staff with respect to range inventory activities."
"There is no effcctivc and comprehensive provincial range inventory."
"There is no consensus on range resoura inventory methodology."
"Thm is a need to compicte range adminisnative boundary and improvement mapping, particularly in the Kamlwps, Rincc George, and Smithcn Regions."
"There is a lack of s t a n d a r d s and proadwes nceded for source map preparation and map updates."
"Databases of the F a s t Service Inventory and Research Branches and the Minisay of Environment are not compatible."

IV. INVENTORY REPORTS IV. INVENTORY REPORTS
Page IV-58 Page IV-57 -
Monitoring Program will improve the Range staff's ability to malie prcdictions on From OUT intenicws it is apparent that the Forest Service Executive has not provided forage availability and select efficient methods to nach vegetation management goals. the Range Program with its full backing. Tbere is a lack of dirccrion and limited funds which has hampcrrd the propss towards a complete Range Inventmy. We To date. some 1.800 out of 3.200 forest cover mans on which ranee occurs in the wen told that there is a large amount of forest range information stored in files within the Inventory Branch of the MOF. This data is not easily accessible by the Range program managas. At present. a draft Range Inventory Manual which outlincs the minimum standards and procedures for the collection and mapping of inventory data has been produced It is not rcady for distribution to the Forest Districts.
Broad forest typcs have been assigned to classify range types bccausc seasonal and annual variability assodatcd with forage productian and SpeCicJ composition maLC an operational inventory of detailed range vegetation data difficult and extremely expmsive. Information on thcsc fortst types is available in the fortsf inventory database.
Inventory and classification of these bmad typu has not been completed duc to lack of manpower, other pioridts or lack of funding to provide manpww.
Range production classes ~ o g m m s of forage per hectare) have not been designed. An esdmated acctnacy or cocftidcnt of variation has not been designed to measure the variabilily of fmge productioa
A Range Habit Monitoring System has been joinrly developcd by the Range staff and the h4inisny of Environment, Wildlife Branch to provide a cost-effective method to
monitor the effects of management techniques and livestock usc of rang ecosystems. Becaw the collection of derailed range ecosystem data is difticult and expensive. the Range Section has opted to work with other agencies to monitor habitat response to specific management practices, such as prescribed burning. Within a range unit or pasr~re thue an many diverse species of herbs, grasses and shrubs that an suitable animal forage. Comptcring an inventory, similar to that of thc T i Inventory, for the many f m g e spaies which occlp on the estimated 8 million hectares of rangeland in the province would be extremely expensive. Htnce. the Minimy of Forests range staff interviewed felt that an inventory of range forcst types is not practical or necessary to achieve their mandate to manage range resources. Detailed forage inventories can only be done on very s m a l l mas. Valuable infonnadoo on how range ecosystems react to management treatments as obtained by the Range Habitat
province have been digitized with range improvement and administrative information. Out of the 1.800 maps. approximately 600 maps wil l have to be updated as new information is gathered Regional Range staff i s responsible to update maps in co- ordination with Minispy of Fonsts. Inventory Branch Computer Assisted Mapping (CAM) update schedules. The editing and updating of range maps will be an ongoing prcctss in accordance with the Inventory Branch CAM updatc program. CAM updates, according to Inventory Branch, should occur every two years.
Thuc is no vegetation-based inventory and the Range staff in the Forest Regions have no plans to carry out a field inventory until such timc that they acquire inventory procedures. An interim non-field-based inventory is being developed. It involves producing colour-coded underlays which will highlight the broad forcst range types on
managers the presence of range rcsourccs during thc integrated planning process.
Funne plans indude working with thc Habitat Invcnany pup of the Wildlifi: Branch to develop procedures for field inventory or range ecosynems to be used by both range and wildlife managen. The compum softarare to provide summaries of range vegetation is being &vdopaL The Rh4 Branch anticipates that within a year summaries will be available on both the mainframe and the Geographic Infomation System (GIS) micro-computer systems used throughout the Ministry of Forests.
-
the f m s t cover maps. These underlays will assist in pointing out to rcsom
MEMODOLOGY
Adminisnative information and range improvement data is drafted onto Forest District forest cover maps by the Forest District Range Officer. This information is located in Forest District and Region files, or in the pcrsonal knowledge of the Range Officer. Many Dismcts have old field maps which show lease and fence locations and which have notations describing range characteristics. The forest cover maps with range data arc being entered into the provincial GIS system.
Broad m g e types based on existing forest cover types w e n included on the maps. Given the seasonal and annual variability associated with forage production and species

IV. INVENTORY REPORTS Pam IV-59
composition, an inventory detailing range vegetation communities i$ difficult and exucmely expensive to acquire. For these reasons. the Range staf f tkcidtd to develop descriptions of broad range types based upon groupings of existing fortst cover types whicb were available from the forest inventory database. nese broad range typcs art summarired on a number of adminisuative levels ranging from prorincia summaries (see Appendix B) down to range units and pastures.
Funher collection. summarkation and mapping of the Range Inventory will be done in accordance with the draft Range Inventory Manual and the Habitat Mo-g Manual to be developed by the Inregrated Resources Branch s t a f f and the Ministry of Environment wildlife staff. These manuals art not completed at present and mort
guidance and funding is requitui to finalize them
Administrative boundaries art accurate because they arc related to lease descriptions and Forest District boundaries. These arc tied to legal &scriptioar or physical features. These boundaries arc plotted on forest cover m a p s as per the MOF mapping S t a n d a r d s .
Range improvements have not always bttn accurattfy plotted on the forest cover maps. lmprovemtno were usually skttchcd onto field maps and illc often I00 to 600 m from the position as shown on forest cover maps. In the past. thert was no n t t d or concern to locate these improvements acmratdy. Today, intaactions with barvestkg require knowledge of where improvements art. Range impe ,mnt information storage is now being improved through w of the Range Improvement Fde System (RIS) which was developed and maintained by the Integrated Resources Branch. This system contains data on various types of fences and otha srmctural ran& improve- ments.
One detailed Range Inventory project was pardally completed in the &brook Forest District This project was cancelled due to lack of funding. the htut expense to complete it. and confusion between the range nsponsibilities of the Range hgram and the Forest Inventory Branch. Other smaller inventory projects an available only in the Dismct in which they wue &ne. This informaton will be incorporated into a provincial r~source data file.
I IV. INVENTORY REPORTS Page IV-60
1
LlMlTATlONSlUSE
Presently, a comprehensive Range Inventory (similar to the Timber Inventory) docs not Mist The projecrtd use of the Range Inventory data is to provide assistance in planning the use of the range resource and to provide background range data to assist in integrated ~csourcc planning. Summaries of range improvements will provide background data on the use, maintenance and cost of established range improvement
allocation of range resources to different usas.
A lack of detailed information on the broad range types which OCM throughout the province is a major limitation of the Range Inventory. More data and pnxtdurcs for analysis of data needcd to pndict the amount of f m g c that can be supplied in these types and confirm the suitability of these types for livestock and wildlife use. The summary, as shown in Appendix B, of the broad mge types indicate the presence of more range available than urilized which is m i s l d h g because not all these types an used as livestock range throughout the province. For example, lodgepole pine forests in the Cape Scott area 011 Nonhan Vancouver Island is not used for canle granhg but is included in the invenuxy. The Inventory needs clarificadon on which broad range types arc potential livestock range and which arc nof
sauctures for budget purposes. Summaries of admuusnative . . a m data will assist in the
The boundaries of the vegetative community or mge type cannot be rcadily delineated. Vegetation that constitutes a range type cannot be identitied from eimbcr types or aerial photos. Some photo intapretation can be &ne on open range types. Relating known vegetation sampling to timber typing is a complex mathematical and biological problem which current range rcscaxch has not solved yet Study may show that a m g e type inventory may not be technically feasible.
Because data on range ecosystems is not available, forage production est ima~s arc not available for @cud land use by livestock. Prediction on forage available is conservative duc to a lack of back-up ecological information on forage species and their response to weather and management practices such as prescribed burning. Range officers tend to be conservative in their estimau~ of available forage.

IV. INVENTORY REPORTS Page lV-61
COMMENTARY
It should be acknowledged that a Range Inventory similar to a Timber Inventory may not be possible due to a lack of ability to delineate regeladon bouddaries which would define range &. Intensive field sampling and statistical analysis may be required to establish a relationship between foltst cover and m g e types. Thc end nsult may be rhat an inventory of range type may not be cfollomically achievable.
with respect to the Range Inventory. thc rrconnnmdations in the Range program Review art:
"Qarify rola and responsibilities of Inventmy and Ran@ Program staff for range inventory."
"Reaffirm rrsponsibility for range invmtary to the Integrated Resourcts Branch as the Forest Service range inventory wrperrise nsides there."
"Provide basic inventory for all disaicn. with funding from Branch level for delineating:
Adminisnation boundaries of stock range, range unil, pasnnt; Topographical and natlpal b&m,
Structural and non-spucrural improvements. but not burning or seeding. * Local gcoglaphid namtu.
Known sample l dops . "
"Provide detailed vegeration inventory on spcdic sim at the discretion of the ~ocd manager (funded at the local level)."
"Provide p d u n s and use them."
"Develop and share betwcen Ministry of Forrsts and Minisny of Environment a common data storage and ntrieval systcm for inventory and for monitoring."
"Develop a contractor's list for detailed inventory projects."
IV. INVENTORY REPORTS Page IV-62
These recommendations have resulted 'from consensus of opinion of the members of the Working Group Committee on Range Inventory and questionnaires considering range inventory for the 1988 Range Program Review Task F o m . Representatives from the Forest Snvice Headquarters, Regions and Districts, Ministry of Environment. Minisay of Agriculture and Fihcries. Agriculture Canada. B.C. Widlife Federation and the B.C. Cattleman's Association made up th is committee.
To achieve the above recommendations, the Forest Scrvice execlltive must set the types and levels of inventory required and then provide enough funding w ewun proper implementation. The present staff of Disaict Range Officers cannot provide the proper level of range monitoring or inventory w manage and protect the resource. Staff reductions, through layoffs, aansfen or by reduced acccss to staff under the pooled technician concept, have reduced the program's ability to concentrate on the resome. The d a y - e y responsibilities for ten= administration (paper shuffling) have become the first priority. In sol^ Disuim. the Range offuw have dual responsibilim for example, range and proteaion or range and reaeatiolL
Range Inventory as discussed in the Range Review should be the sole responsibility of the Range Stxtion, Integrated Resource Mauagcnmt Branch. Past confusion between the MOF Inventory Branch and the Integrated Resource Management Branch has
manager. Sldlleed professional range staff is required to assist the program.
During OUT interviews of range inventories we contacted the Range Section at headquaners, three Regions and tcn Districts. Their comments ranged from "a fair inventory", to "Oh. I'm new here. The inventory data left in the head of the previous officer.". Comments such as these reveal the need for a s t a n d a d , uniform, provincial inventory system. T i and money must k allocated to train staff in its ust.
The Integrated Resources Branch staff in Victoria is conccmed that too much emphasis will be placed on analysis of data rather than focussing on resolving resource allocation problems. Inventory is a tool w assist managers to makc decisions. The level of data rtspircd must be set and then attained. This level must be adcquatc to provide infommion to the manager but not so high that all budgets are consumed to achieve that which may be unreachable.
wasted funds and maO-hOW BS well as maLing coIle*Cd data mvai labk: to the range

!
I / i
f IV. INVENTORY REPORTS Paae IV-64
IV. INVENTORY REPORTS Page IV-63
DEFINITIONS
APPENDIX A
DEFINITIONS
Stock range: An ana administered by a cattleman’s association; c.g.. Riske Creek Cattlemen’s Association.
Range unit: An area within a stock unit that is defined by physical boundaries.
Pasture: A fenced ana within a range unit.
Broad range types: As defined in the 1984 F a s t and Range Repon
Alpine: The Alpine range type is typically associated with the Alpine Tundra biogeoclimadc zone and is dominated by low shrubs. &lass and sedge spccies. V a y s t u n t e d and shrubby forms of subalpine fir. Engelmann spruce, and western and lodgtpolc pine occasionally OCM. W a m is not as aitical an element on these sites as it is . i n open range arcas. Typically. annual rainfall is about 6oommandsnowfallabout4OOcm. T h c s o i l w t b e J c ~ i s v a y s e n s i t i v e t o erosion because it is thin and the topography is usually rugged. The short growingseasoaisalimitingf~intbeabilityoftheranketoproduccforage. The grass-sedge u)mrrrrmiries at lowa elevation wine range provide an important source of late summer forage for castle. Thesc areas arc fairly productive but must be well managed bccausc ow-grazing will quickly lead to accclaattd soil erosion.
Ponderosa Pine Forest The Po- Pine Forest type is g e d y found within the
pine with Douglas-fir. Grasses dominate a poorly developed shrub layer. As is Ponderosa Pine-Bunchgxass biogwclimatic =ne and is donhaad by ponderosa
the case with the Open Range Type, water is scanx and limits forage productivity. Rainfall is approximately 300 mm per year and snowfall about
occurs during the winter, early spring and late fall. Typically thesc sites LUC potential producen of high quplity forage. However, because they are so susceptible to dcgmMon. grazing must be carefully managed.
l o o an annually. This type is impartanr for the ranching indusny. Primary use
Dry Forest: The Dry Forcst typc is genually associated with dry subzones of the Interior Douglas-fir biogwclimatic zone and comprises a mixm of Douglas-fir and l o d g e p o l e pine, aad to a luscr extent western larch and ponderosa pine. Pinegrass and associated forbs comprise rht herb layer. Water supply is not a critical element in the areas. Rtcipitation is normally near 600 mm per year and snowfall about 300 cm. This type is primarily used as summer range. Productivity is good (averaging about 273 kg air+ p a hectare) but declines rapidly as the summer progresses. Adjacent dense fmsa provide good bedding cover. Because this type is modaately sensitive to disturbance, it should be care full^ watched to prevent over-grazing.

IV. INVENTORY REPORTS Page IV65 - Lodgepole Pine: This type occurs extensively huughout British Columbia in d
number of d i f fant biogeoclimatic zones including Inmior Western Hemlock. Interior Dough-fir and Engelmann Spruce-Subalpine Fir. Warn supply, pmicularly in arcas located within the Engelmann Spruce-Subalpine FK zone, is not as great a limiting factor as it is in the Dry F m t type. Summer gazing is
stand density m- about 550 kg air+ per hccran at Iowa s t a d density. In s o m e axeas. burning and thinning art used to increase producriviry. Thuc is a grtat potential for Wildlife/canlt confiicts in the todgepole Pine rype as it is used extensively as Wildlife habitar
of particular im- w these situ. Roducrivity nulges from ZQO at high
Wet Forest: ?hc Wet Forest type is usually asscc&A with the Montane Spnuz and I n ~ o r C e d a r ~ ~ k b i o g e o d i m a t i c z r m c s a n d i s f ~ ~ a v a r i e d m i x t u r e of conifcrow specits. The predominant species an normally Engelmann spruce. l o d g e p o l e pine, subalpine fir, cedar and wcm hemlock. Water supply is not a critical element on thtsc sites since rainfall genaally avcrages about 700 mm annually and snowfall appm-ly 5 0 0 c m pcr year. Clearcuts arc used extensivdy. for summtr grazing and dense lodgepole pinc stands prwide good browse. Because of rhe couptidon for tmnvse, thcxc is a substantial potential for contlicts between cattle and wildlife on these sites.
Deciduous Forest: This type, locarcd primady in the Peace River area. is the forest type which prwides rhe best grazing because it har a rich undcrsmry. Both the herb and shrub layers arc rich in nutritno and water is not a limidng fimor. F o r a g c ~ v i ~ m g c s t o I ~ k g a i r ~ p ~ r ~ Muchof thesumma grazing in these 1mtions.is ded om MI cninvatcd communj. pasnrrts.
Transitional: These locations rn classified as eitha non-productin, disturbed or not satisfactorily mtocked to a fm aup under the fatst inventory system The sites vary widely as to vegetative species and soil maistun?, and thdr value as
these sites ~ 1 c heady used by livestock but the t r ans i t i d areas in the Mid livestock grazing range varies accordingly. For example, in the Peace River area
Coast portion of thc pmvince are n o a ~ o m u m 5 a l or non-productive types that do not provide any oppormnity for graziag.
Clearings: These areas arc typically associated with the Wet Forest type. The description of that type applies equally well to the Clearings type.
Non-Vegetated: This type supports only a wry small livestock population.
Brush: The Brush type occurs ubiquitously throughout the province and varies widely in iu potential for grazing but does not provide good grazing ran@ in any area.
Alienated: Alienated land @rivatt) provides much of the most productive gazing in the province, but because they are not under Ministry of Forests management they an not included in this report in the estimates of utilized range.
IV. INVENTORY REPORTS Paae IV-66
Urban: The urban c l a s s i f i i n i n c l u d e s a wide variety of sites such as indusrrial arcas, pipelines and power lines. Some of these may be secdcd and can provide sigmficant .grazing opportunities. Othen, w h c n then is more intensive industrial activity, provide only limited use.

I IV. INVENTORY REPORTS Paae IV-67 IV. INVENTORY REPORTS Page IV-68
i ~
APPENDIX B
RANGE ADMINISTRATIVE AREAS AND TYPES OF RANGE ECOSYSTEMS "
I j i
i
!
I I ! I
r ; I I I
!
[ i :
I
! !
i 1
i ! ! !
i
i i
a
v)
9 5
f 0
x c 0
c" i Y)
0 2 - P 8

IV. INVENTORY REPORTS Page IV-69
RECREATlON RES0UR.CE INVENTORY
SUMMARY
The Ministry of Fasts , Integrattd R e s o l m r s Branch has undertaken to maintain an updated inventory of the rrcrrational resolllcc of Cmwn Ian& in the province.
he rccnation inventory is designed to class if^ the bwn ' W into a m e n t categories and types of potential rccmuion use. It also i n c l u d e s the mapping of defined m a t i o n f e r n s and a landscape inventory of a m s with high scenic quality. AU these features blended togetha provide -rional experience for a wide variety of USm.
The MOF initiated this kind of remation inventory in 1981 and by 1984 had completed a preliminary inventory of all Timber Supply Arurs in the province. Trcc Fam Licence holden were also requested to carry out reaearional inventories to MOF standards when preparing updated ManagemaK plans. Of the 32 TFL's, 17 have completed recnation inwnm and 8 arc parriauy completed.
Although the provincial don invcntcuy is comidud complcth ongoing updating and recfassitication of the fim 7 is ncccmry. Ruxatiian classification is a subjective assessment. based on dehned criteria, and as such has no statistical accuracy. A draft inventory manual was compled in 1988. and although the aitcria for the initial inventory have not changed, the infdon and knowledge uscd for some of the initial classification has incrulsed m y .
At present. about one-half of the recreation inventory m a p s have been entmd into a computer-based geographic informaton system Once this is completed, reacatiod information can be displayed at any map scale. It will be moxe readily accessible and much more useful in land-use planning projects.
. .
IV. INVENTORY REPORTS Page IV-70
INTRODUCTION
The Minisay of Forests, Intcpted Resources Branch has the responsibility under the F a s t Act to manage the recreational resource on Crown lands. These lands include provincial forests, limber Supply Areas, Tnc Farm Licenses ( T F L ' s ) and all unalienated Crown lands. Both forested and non-forested lands are included. Because they take. place on Crown land, recreational activitiff such as picnicking. hiking, ski touring, and kayaidng arc generally managed by the %say of Forests. Activities such as downhill skiing or organired camping arc usually managed by private or municipal agencies. .
The Forest Service R d o n Program xecognizcs the many diverse outdoor recreation activities which need to be provided for in provincial fas t s . These activities range fmm aesthetic enjoymtnt of scenery to the physically demanding challenges of mouataineering and kayaking to motorkd activities such as snowmobiling and mil bike ridhg. The Ministry of Forests identifies and manages a full spectrum of d o n activities to provide an opponunity for B.C midents and tourists.
The Tne Farm Licensees have the responsibility to complete and maintain recreation resource inventories for their licensee arcas. The TFL license may use the Ministry of Fo~esa' system or w another system that is approved by the Chief Faster of B.C The inventory must contain the W o n Opportunity Specmun, remation features inventory and visual landscape inventory.
The goal of the Recreation Inventory activity stated by rhc Minisay of Forests is "to provide land managers with background information on ncreational features and potential recreational f e a m on Crown lands." Information on the location, accessibdity, sensitivity. type of recreational activity and time of year, for each m a t i o n feature or value is recorded in the remeation inventory. The objcctives as stated in the Recreation Inventory Manual an:
- Involve the public, other agencies and indusay in the identification and evaluation of the ncrcation resource base;
Identify, ~ S S ~ S S and record recreation resources in order to manage andlor protect them;
Provide a basis for managing the use of the recreation resources.

j IV. INVENTORY REPORTS Page IV-71
I STATUS
The Recreation Rcsome Inventory of the province identifies m n t recreational uses and demands. It also idendties natural or cultural features that could generate a recreational experience. Approximately 1.8 million people each year, according to Forest Service estimates. take advantage of the Forest Service’s more than one thousand recreation sites and the thousands of kilmetres of uai ls . Another 15 million user visits. according to the Minimy of Fonsts 1987-88 Annual Repon. an dispersed over the provincial forest land. The umd of the estimatai use of forest recreation sites and nails is shown in Appendix A. This Annual Report also states that the recreation sport induspy conmbutes $1 billion to the provincial economy.
The Recreation Inventory was initiated in 1981 and by 1984 a phinary inventory was completed. n e recnation f a n & and Recreation Opportunity Specaum have been completed for all Fonst Dismcts in the province and i6 of 34 TFL’s. The original maps were compiled on 120 OOO, 1:50 OOO and in somc cases 1:IOO OOO scale maps by each Forest Disuict and TFL Licensee.
These inventory m a p s have been uansfared onto provincial maps at 1:2 O00 OOO scale, causing some generalizaron and loss of detail. The landscape inventory is s t i l l being compiled.
F u m requirements include updating of original mapping to add new information and to revise the original data. The inventory maps are to be digitized into the Geographic Information System (GIs) of the Minimy of Forests.
Those TFL’s and Forest Dimicts that have deficiencies in the prepantion and use of recreation resource inventories will be brought up to s t a n d a r d . The knowledge that the Recreation Inventory is imporrant in integrated resource management will assist in changing the anitudes of forest managers towards the sigmicance of recreation. Lack of recreation information may delay approvals of cutting plans.
METHODOLOGY
Each Forest Dismct collected the Recreation Inventory information from staff knowledge of the areas. Local recreation clubs, general public. tourism industry people, resource users and other government agencies such as Minisuies of Tourism,
7- ~
.. . ~.
IV. INVENTORY REPORTS Page IV-72
Environment. Parks. and Transportation and Highways, and municipal government were contacted for their input
The Recreation Inventory is comprised of thrrt components:
Recreation Oppormnity Specrmm (ROS); Recreation feams; Landscape Inventory.
The Recreation Opponunity Specrmm (ROS) was originally designed by the U.S. Forest Service and was adopted by the Minispy of Fmsts to class@ areas which provide similar rrcnational expuiences and arcas which show potential to provide similar ncnational experience. The ROS delineation idenrifics the different types of recreation expei?ences that are available on bwn land. Combinations of recreational activities, settings and probable experience oppormnidcs are classified into six classes. These classes range from wilderness to urban parks. A table showing these classifications can be found in Appendix B. This approach divides a disaict or region into recreation management units which indicate similar management prescriptions and will assist in the resolution of resource conflicts.
The Features Inventory is based upon subjeftive assessment of natural and man-made features that provide a recreationai experience. Exampies of n a n d features which are inventoried include biophysical features such as waterfalls. tide rips, alpine forests or old growth forests. Cultural features such as pastoral landscape, man-made features or cemeteries, and historic features such as monuments. rodc art or historic n a i l s are classified as resource feams. The features an assigned a management class which describes how sensitive the feature is to outside influence and whether or not it requires special management considerations.
The Landscape Inventory involves a list and mapping of areas of scenic quality or visual sensitivity (e.g. dominant mountain peak, scenic slopes) which arc visible from a highway corridor (Whistler Corridor). communities (Golden, Mount Seven), recreation site, nail or watenvay (Inside Passage). These views an rated as to their sensitivity to change and their ability to absorb change without disrupting the original effect of the view.
The inventory accuracy and quality ranges from very good to poor. Lack of mining and manpower in the collection of data has resulted in some data being sketchy or

IV. INVENTORY REPORTS Page IV-73
cursory. The quality of the original work is proportional to the lime and effort expended on it and the experience of the inventory classifier to properly interpret and apply the technical criteria. Roughly one-third is good , one-third is fair and the remaining one-third poor.
LIMITATIONS/USE
The Recreation Inventory provides land managas with information on what the public demands for recreation within the provincial forest land. The ROS Inventory allows a dismct, Timber Supply Area or Tn. to be divided into rCCrcatiOn management units which indicate similar reneation managemcnt prtsaiptions and help rationalize the resolution of resource use conflicts. 'Ihe Features Inventory assists in the preparation of detailed site-specific prescriptions and operational plans. It is useful in budget planning to forecan maintenance, costs and planning, and furarc recreation facilities ( m a r i o n sites, camp grounds, boat launches). The .Landscape Inventory is utiliztd in the projection of the efftct of forest harvest on scenic resources. All three components of the Recreation Inventory are uscd by industry to prepare development plans and by the Ministry of Fonst~ at the referral stage of forcst development planning.
The generalid large-scale mapping which was derived from the small-scale Dismct maps is adequate to assist in the prepamtion of provincial overviews and province-wide predictions. Potential resource conflict areas can be identified for funher indepth research.
The Recnation Inventory is nor compatible with thosc of the Ministry of Environmenr and Wtry of Tourism, Rmat ion and Culture. These inventories nced to be e n d into a common computer mapping system and plotted on similar scales to demonstrate their relationship.
The Recreation Inventory data is presently for internal use only. The maps are still in draft form in each Forcst Dismct A commercial quality printing is required before they can be published.
IV. INVENTORY REPORTS Page IV-74
COMMENTS
With the advent of the shorter work week, the availability of more leisure h e and the rising cost of long distance navel, morc people arc looking to the provincial forests for m a t i o n . To develop correct decisions. the integrated resome manager must have accurate information on aII the recreation resou~~es. It is the Recreation Section's responsibility to mitigate potential negarive impacts of resource urilization on the recreation resources. To do this, the forcst resources that provide a "recreational experience" must be identiiid.
Remation is a bona fide forest resource. It is becoming mort and more an issue for the forest planner. The Carmanah Valley, Sulfur Pass, the Inside Passage and the Walbran areas an examples of land use issucs whcre rccnational use 01 wilderness interests arc conflicting with other resource users. 'Ihrwgh the use of resource inven- tories which illustrate their relative values, the resource m a g = will be able to identity potential conflicts and prepare a land use strategy.
Visual landscape sensitivity has far naching effccts upon forest harvesting. Highly visible areas include views from highways (Whistler corridol) and communities (Mount Seven from Goldcn) or from a recxcatiOEL site, nail or wamway (Inside Passage). Harvesting may not be acceptable to the public on highly visible areas. When the landscape can absorb some change. harvesting could range from selection cutting to s m a l l clearcuts. In unseen areas. clearcuts may be m m acceptable. All of the above scenarios could have a serious effect upon the allowable cut and therefore on the sustainable development of B.C The visual Landscape Resource Inventory is very imponanr A complete and accurate assessment should be a priority for forest managers.
Resolution of local r e sou~~e development issues will rquirc integrated resource planning and public consultation to respond to public concerns. An excellent inventory is one of the tools that should be available to the land manager. In most cases, however. land use conflicts will be resolved by the politician. Hence, the minismes concerned with land use problems must have the best available information.
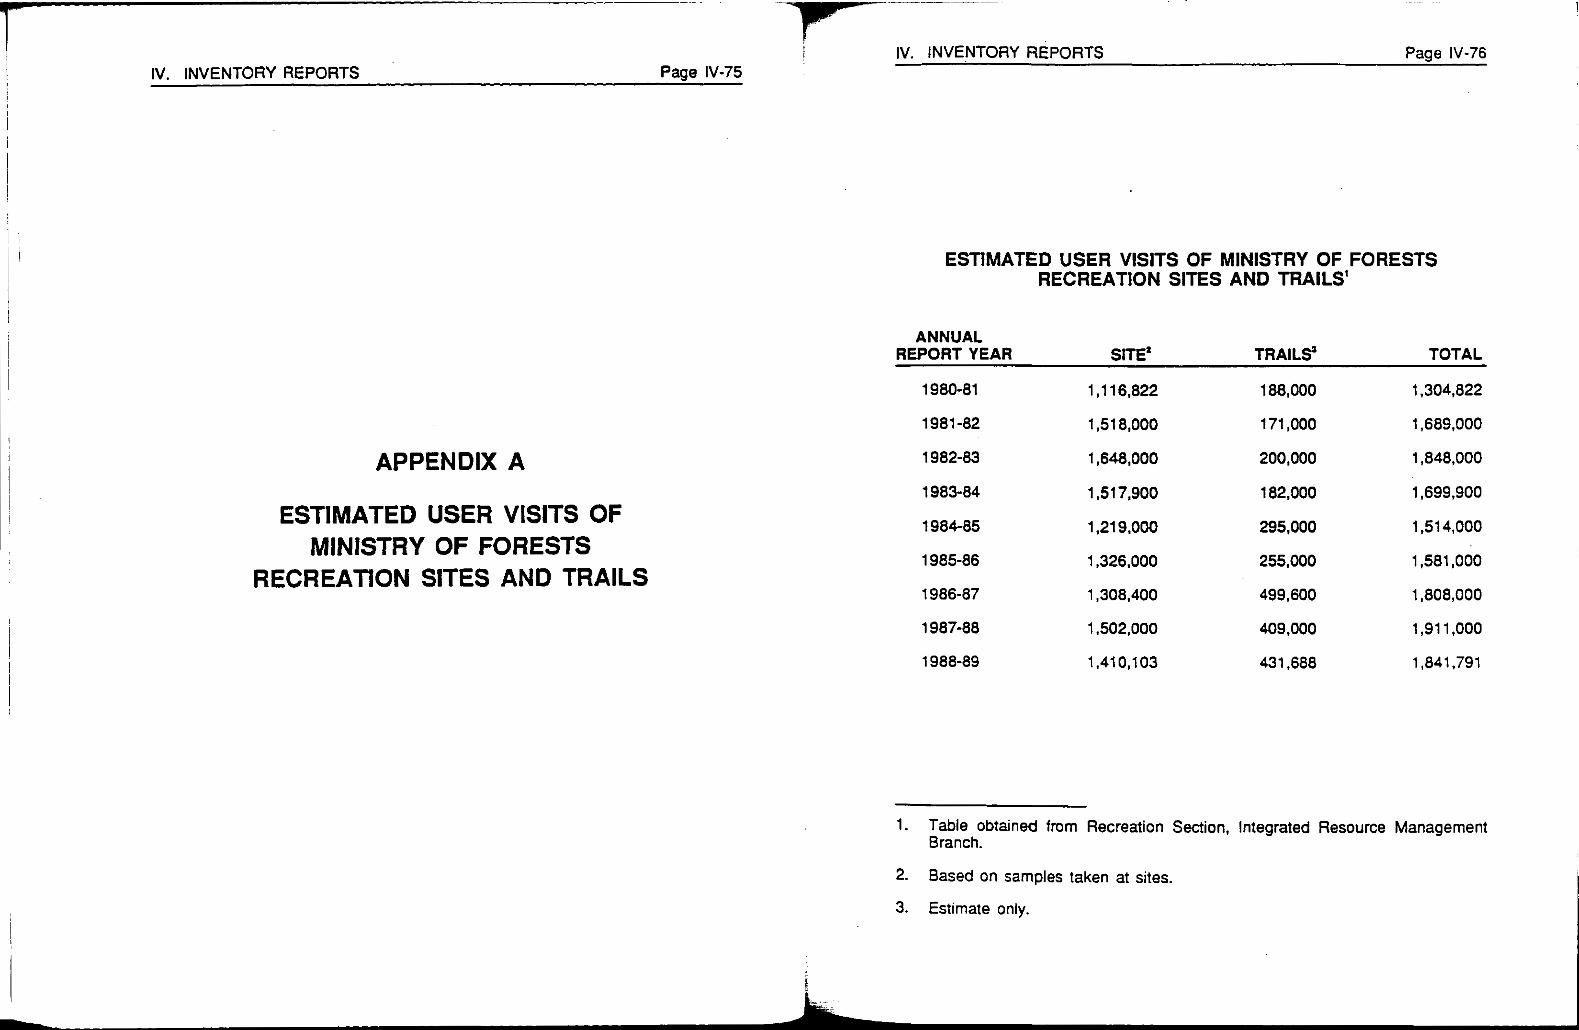
~~~~ ~ . .
~ ~~ ~~
1
i IV. INVENTORY REPORTS Page IV-76 IV. INVENTORY REPORTS Page IV-75
APPENDIX A
ESTIMATED USER VISITS OF MINISTRY OF FORESTS
RECREATION SITES AND TRAILS
ESTIMATED USER VISITS OF MINISTRY OF FORESTS RECREATION SITES AND TRAILS'
ANNUAL REPORT YEAR SITE' TRAIL$ TOTAL
1980-81 1,116.822 188,000 1,304,822
1981 -82 1,518,000 171,000 1,689,000
1982-83 1,648,000 200,000 1,848,000
1983-84 1,517,900 182,000 1,699,900
1984-85 1,219.000 295,000 1,514,000
1985-86 1,326.000 255,000 1,581,000
1986-87 1,308,400 499,600 1,808,000
1987-88 1.502.000 409,000 1,911,000
1988-89 1,410,103 431,688 1,841,791
1. Table obtained from Recreation Section, Integrated Resource Management
2. Based on samples taken at sites.
3. Estimate only.
Branch.

IV. INVENTORY REPORTS Page IV-77
I'
APPENDIX B
RECREATION OPPORTUNITY SPECTRUM DELINEATION CRITERIA
IV. INVENTORY REPORTS Page IV-78
RECREATION OPPORTUNITY SPECTRUM (ROS) DELINEATION CRITERIA
PRIMITIVE 28 km from 25000 ha Selling is essentially an unmodified environment. primitive Evidence of humans would be unnoticed by an mads observer wandering through Me area Evidence of
trails is aoceptable. but should not exceed standard to carfy expected use.
SEMI-PRIMITIVE 21 km from 2tOOO ha Natural setting may have subtle modifications that would be noticed but not draw the attention of an observer wandering through the area Area has not been logged or subject to industrial activity or it has been rehabilitated (second growth) to a point that it is no longer readily recognizable as an industriavlogged area. Sttuctures are rare and
NON-MOTORIZED pfimihe roads
SEMI-PRIMITIVE 21 km from 2tOOO ha Natural selling may have moderately dominant MOTORED better than
primitive alternations but would not draw the attention of
roads p r i m h mads within tha area (Le. industrial or motorized ObSeNOrS on trials. waterways. and
agricultural activi must not be noticeable to the motorized rsaeational user). Structures are rare and i s o l a t e d .
ROADED RESOURCE
Within 1 km No size Natural selling may have modifications which of better than
criteria dominant. R e s o u r c e u t i l i o n and modification range from bing easily noticed to strongly
primitive pr&icas may be evident. There h strong roads evidenee of designed roads, highways andlor
railroads.
RURAL No remote- No size Natural setting is arlturally modified to the point ness criteria criteria that is dominant to the obsewer on a sensitive
travel mute. May indude pastoral, agricultural.
corridors. Pedestrian or other slow moving intensively managed NSOU~CB extraction or utility
culturally changed landscapes. There is strong observers am almost constantly in view of
evidenoe of designed mads, highways andfor railroads. Structures am readily apparent and may range from scattered to small dominant clusters.
URBAN NO remote- No size Selling is strongly structure dominated. Natural or ness criteria criteria natural-appearing elements may play an important
role but be visually subordinate. Pedestrians and other slow moving observers are constantly in view
evidence of designed mads, highways, streets. of artificial.endosure spaces. There is strong
d o r railroads. Structures and structure complexes are dominant. This class is provided in city and muniapal parks.

IV. INVENTORY REPORTS Page IV-79
WILDERNESS RESOURCE INVENTORY
SUMMARY
In response to a growing public demand for the increased preservation of wilderness, the provincial F m s t Act was amended in 1987 to allow the Minis~y of Forests to designate and manage wilderness areas within provincial forests.
The Integrated Resource Branch, Ministry of Forests has defined wilderness as "an area of land generally greater than IO00 ha that predominantly retains its natural character and on which human impact is transitory, minor and in the long run substantially unnoticeable."
An inventory of wilderness areas commenced in 1988 by the Branch and the initial inventory mapping was completed by March 1989. Wilderness areas have been identified and assessed on an overview basis for the entire province, and the maps entered into a computerized Geographic Information System A provincial scale map (1:2,000.000) derailing this basic inventory has ken produced as a draft worldng copy. It is planned to add additional idormation to this fim approximation of thc wilderness resource and to produce a series of maps at a 1:50,000 s c a l e to be used for wilderness planning and designation at a Forest Dismct IeveL
Wilderness has a different meaning and interest to other government rninisaics also involved in resource management. An in=-Minisay Committee. the Wilderness Liaison Committee Working Group, was established in 1989 to describe a provincial snategy and map of protected (wilderness) areas. When completed. this first approximation will identlry and bring togetha the interests of parks. wddlife, tourism, forest wilderness and ecological reserves. as well as information on mineral and timber interests.
It is an important step in coordinating and integrating resource interests at a snategic level. It will be extremely useful in defuring potential land use conflicts and the effects of proposed resource developments in wdderness areas.
IV. INVENTORY REPORTS Page Iv-80
INTRODUCTION
An amendment to the Forest Act in 1987 recognized wilderness as a legitimate use of provincial forests. The Minisay of Forests was given the mandate and responsibility to consider wilderness in the integrated resource management of the provincial forests. The stated purpose of the wilderness program is to protect and maintain wilderness resources in relation to the other uses of provincial forests to provide maximum overall benefits to British Columbia. To do this, an inventory of lands capable of providing a wilderness experience was required.
In 1989, a discussion paper titled "Managing Wilderness in Provincial Forests,'' published by the Ministry of Forests, defined wilderness as "an area of land generally greater than l o o 0 hectarcs that predominantly retains its natural character and on which human impact is uansitory, minor and in the long-run substantially unnoticeable." Wilderness is a distinct. composite resource with inseparablc parrs which include recreation, wildlife, heritage, and other values and thcir interactions.
Cabinet may formally designate wilderness areas. The Fmst Act also provides for recognition and designation of wilderness in areas that have not been formally spcciiied by Cabinet.
Commercial timber harvesting and permanent access roads are prohibited Mining exploration, uses consistent with preservation of wilderness and any use permitted for that wilderness area by or under the regulations are allowed within a designated wilderness area
STATUS
A wilderness inventory was initiated in March of 1988 by the Minisay of Forests, Integrated Resources Branch and the initial mapping was completed in March of 1989. Wilderness areas were identified and assessed on an overview basis for the entire province. The wilderness inventory has been reviewed for drafting accuracy and has been entered into a Geographic Information System (GIs).
A provincial scale ( 1 : t OOO OOO) map has been produced in a draft working copy only. This map is intended to be finalized for public use. This map base is presently used as a foundation for the preparation of map overlays showing the projected condition of

I
IV. INVENTORY REPORTS Page IV-81
wilderness resources under various assumptions, (is. timber development and mining development).
The wilderness inventory will have to k maintained to allow for changes in access development and in land SUNS, (i.e. land alienation, park area reservation, or wildaness area formation).
The initial Wilderness Inventory covering the province is a first approximation. Information is required to determine the quality of possible rccrcarional experience and the amount of present and future use of each defined wilderness area Maps arc being prepared to show the relationship of wilderness areas to economic regions, ecological reserves, Forest Dismcts, Timber Supply Arcas, Tree Fam Licences, and areas within 160 km from major population ccntns. Summaries are also required to show what ecosystems are represented in wildcmess anas. the recrcarion values present and the amount of net forest land base presently classifed as wilderness. This is to be produced on 150 OOO maps for use in each Forest Disnicict
An overlay series of maps (12 OOO OOO scale) are now available in draft form for: wilderness areas. potential mineral developments, net f o m t land base, tourism capability, identifiai special arcas (where known), wildlife and fishaies.
METHODOLOGY
Ministry of Forests Recnation Officm in each Forest District compiled the inventory. hitially, areas of Io00 hectares or more that had no industrial development were delineated on the forest cover maps. The Forest Service Recreation Feanucs Inventory was then used to determine which wilderness areas have m a t i o n a l values and identify those which arc potentially capable of providing recreational values and experiences. The primitive and semi-primitive classes of the Recreation Opportunity Specuum (ROS) were also used to assess the amount and dismbution of the current wilderness resource. (ROS is a system designed by the U.S. Forest Service which was adopted by the B.C. Forest service to descrik combinations of recreation activities, setdngs. and possible experience oppomnities in recreation.)
The Inventory was drafted onto Forest Dismct maps at 1:50 OOO scale, then generalized to a provincial map (1:2 OOO OOO and 1:600 OOO scales). Existing
IV. INVENTORY REPORTS Page IV-82
protected m a s including national and provincial parks, recreation mas, and wilderness mas were included on the maps.
A series of overlay maps (at 1:2 OOO OOO scale) has been made to show a provincial overview of arcas that could become designated wilderness. This includes maps covering: Forest Site Capability, Wilderness. Recreation Opportunity Spcaum, Tourism Capability, Mineral Potential, Priority Wildlife and Fisheries/Wiiderness areas,
and Land Capability for Forcsu. 'These maps an available in the Minisay of Forests, Integrated Resources Branch offcc.
LIMITATIONSIUSE
The Wilderness Inventory presents an overview of wherc wilderness exists at this time. The Wilderness Inventory maps arc used to investigate the effect of wilkness preservation on the sustainable economic development of the province. The Wilderness Inventory maps were used as input to a provincial overview on ptccted arw which was drafted by the Wildcmess Liaison Committee (WLC). The WLC has had repnsentation from the Ministries of Parks, Fore~ts; Environment Tourism; Provincial S c c r e v , and Energy, Mines and Peaoleurn Resourrcs. The WLC is to develop a provincial strategy and map of protected areas (wilderness-type areas). This process is outlined in Appendix A. This plan is presently on hold, pending ministerial comment.
The Recreation Features Inventory, which forms background data for the Wilderness Inventory, has inhennt difKculties with the quality of iu data collection. Ground checking and verification is required to investigate whether a noted feature is truly unique or significant, is presently used or that it will have a future demand.
The Ministry of Forests is currently digitizing the resource inventories of other minismes that have an effect on wilderness into a GIS system. A schedule of the work required and the information to be produced is included in Appendix B . The following summaries of available wilderness are included in the conuact
Provincial; Forest RegionDistricG TS-; 100 mile radius kom 11 major centen.

IV. INVENTORY REPORTS Paae IV-a3
COMMENTS
An overall view of the location of wilderness in the province is presented on maps which are available in the Integrated Resource Branch. The prcsent inventory will assist resource managers in dismbuting factual idonmion to focus discussions on wilderness.
The related inventories of Recreation. Fuheries,. Fsh and Wildlife, Forest, Mining, and Tourism n u d to be entcred into GIS so that they can easily be reproduced on comparative scales and acctsscd though computer in the disaicts. The wilderness overlay system maps are not yet available on GIS and need to be produced into a presentable fonn so that they can be used by m i n i s a y staff to present to govunmcnt. the public, and other scctions within the Forest Service. These would be produced on scales of 1:2 OOO OOO and 1:600 OOO. The present inventory, as part of the land use overlay, is examely useful to land resourn managers as it highlights where present land use conflicts arc and w h m future conflicts may OCCUT. The inventoly provides data on what type of feature is pment and its potential significance as a recreational feature.
IV. INVENTORY REPORTS Page IV-84
APPENDIX A
PROVINCIAL OVERVIEW ON PROTECTED AREAS

IV. INVENTORY REPORTS Page IV-86
IV. INVENTORY REPORTS Page IV-85
February 14, 1989
provincial overview on protected areas has been prepared and is attached. A 1:2,000,000 scale map is intended if this approach is acceptable.
A 1:2,500,000 scale map providing an initial
This first approximation map shows:
(a) current protected areas (i.e. parks, recreation
(b) current interests by various Ministries (except
areas, wilderness areas); and
MOF) for protected area study in relation to mineral and timber resources.
This map is based on:
(a) the following current interests by various Ministries for protected area study:
park interest areas: wildlife interest areas; and tourism interest areas (from tourism capability maps) . MOF wilderness interest areas and ecological reserve interest areas to be included when available.
(b) the following resource interests:
mineral interests (from maps on mineral
timber interests (from forest capability maps). potential and coal-bearing areas); and
This first approximation map needs to be updated and
example, as HOF interests related to wilderness are revised as new information becomes available. For
developed and ParkMildlife/Tourism interests are refined. A l s o , the MOF is preparing a map showing the Net Land Base supporting the Allowable Annual Cut which would refine the timber interest areas; and mineral
updated. In addition, other interests such as hydro O r potential information is continually being revised and
range have not been considered a t this time.
interests for protected area study by expected degree of The first approximation map differentiates agency
mineral and/or timber resource interest as follows:
Green Current protected areas (i.e. national and provincial parks, recreation areas and wilderness areas)
Light B l u e
Dark Blue Agency interest for protected area study with probable high mineral
interests interests and/or high timber
Agency interest for protected area study with probable moderate mineral and/or moderate timber interests
Orange Agency interest for protected area study uith probable low mineral and low timber interests .
The information on the map can also be used to differentiate between areas with single versus multi-agency interest for protected area study.

IV. INVENTORY REPORTS Page IV-87
PROVINCIAL STRA'ITFI ON PROTECTED AR64S
February 14, 1989
PURPOSE
TO describe a provincial strategy and map on protected areas.
BACKCROUND A proactive provincial strategy on protected areas (i.e., wilderness-type areas) will guide and coordinate individual Ministries in their land use planning and management. The proposed strategy is intended to help identify multi-agency interests and resolve conflicts regarding protected area land use issues. The issue of how t o move toward a provincial strategy was introduced at the Wilderness Liaison Committee's (WLC) October 1987 public meeting with groups representing forestry, mining. environmental and outdoor recreation interests. At that public meeting meeting there was strong support €or further discussions to take place, thereby creating expectations that a strategy would be developed with public and industry consultation.
D V T N C I A L STRAT=
The term 'protected areas' is used instead of 'wilderness' to avoid confusion with individual designation categories .
existing legislation, 'protected areas' include, a and to represent the range o € such designations. With
spectrum of categories, from 'fully' protected
protected (provincial forest wilderness areas and wildlife (provincial parks and ecological reserves), to 'partially'
management areas). The proposed strategy involves the following main Steps (see Fig. 1):
STEP 1: EXISTING STATUTORY RESWNSIBILITIES
E2mLAa Class A provincial parks and recreation areas
MINE- 3ENURES ACT
provides for time-limited mineral exploration in recreation areas
FOREST A C T provincial forest wilderness areas (mineral exploration permitted)
WILDLIFE ACT wildlife management areas ECOLOGICAL ecological reserves R-
ENVIRONMENT used to establish Purcell Wilderness A N D LAND USE Conservacy . "
! IV. INVENTORY REPORTS Page IV-88
P R O P O S Z D SYiLAfZCY ON PROTECTE3 AREAS F I C J R E 1
STATUTORY RESPONSIBILITIES
I
STEP 2 : I INVENTORY OF I
IKIERESTS I I
- By ninistries
STEP 3 : I PRELIXINARY ! - BY W L C I ASSESStPENT I
&reas vith high protection Areas with high Protection Areas vith high Protection ' 1 ' interests and high I I interests and moderate 1 1 interests and lov I resource values resource values I I resource va lues
Ddrk Blue Light Blue I . .- - " .
~ ...
STEP 4: SLLECTIOTl OF ARWS - By Deputies a d DETAILED ~ A L X S I S Cabinet
criteria developed
I
STEP 5 : DETAILED M U X S I S - By lead agency I
m d planning team
STEP 6:
RECOMPIENDDATIONS - By Ministries, WLC REVIEXED ARD REVISED and Deputies
I DECISION - By Cabinet

IV. INVENTORY REPORTS Page IV-89 IV. INVENTORY REPORTS Page IV-90
STEP 2: INVENTORY OF INTERESTS
An integral part of developing a strateqy on protected areas is an inventory of in'terests. This inventory
as interests for other resources such as timber and includes both interests for protected area study as well
Ministries is summarized in Attachment Y2. minerals. The status of this inventory by various
Lands that appear to have significant values as protected
Ministry systems plans and by various public groups. This areas have been, or are being, identified in various
represents a general measure of 'demand'. A number of
designed to assess demand and value more directly. agencies are undertaking surveys and other studies
STEP 3 : PRELIMINARY ASSESSMENT
Areas identified in the inventory as 'interest areas. will
Committee for interests in protected area study in be preliminarily assessed by the Wilderness Liaison
relation to other resources such as timber and minerals.
An initial assessment is shown on the map (attached) entitled, provincial Overview on P r o t e Areas: First qpDraximatlon. This map differentiates agency interests for protected area study by expected degree of.minera1 and/or timber interest as follows:
e current protected areas (green) ;
agency interests for protected area study:
- with probable high mineral interests and/or - with probable moderate mineral interests and/or - with probable l o w mineral interests and
high timber interests (dark blue);
moderate timber interests (light blue);
low timber interests (orange).
The information on the map can also be used to differentiate between areas with single versus multi-agency interest for protected area study.
will need to be revised and reviewed as new information The preliminary assessment, based on existing information.
becomes available and would be done in the contest O f an overall land use strategy ( i f developed).
STEP 4 : SELECTION OF AREAS FOR DETAILED ANALYSIS
using the inventory and preliminary assessment, and with
be selected for detailed analysis. Detailed analysis appropriate public and industry consultation, areas will
planning. This critical decision-making step will be done includes both conducting appropriate studies and
by Deputies and possibly Cabinet.
TO guide this, it may be desirable to establish a provincial (interagency) goal statement on protected
i areas, such as: to ensure sustainable fish, wildlife and landscape resources, to protect special values, and to
i accommodate viable opportunities for recreation and tourism in balance with sustainable resource development.
Within the context of a Provincial goal statement (if adopted), the criteria for selecting areas for detailed analysis include factors such as levels of agency and public interest for protection; and interests for, and imminence of, resource development.
An appropriate lead agency and planning process will be
analysis is to be undertaken. The level and type of assigned by the Deputies for each area where detailed
critical to the success of the planning process. public involvement will be determined as this may be
!
STEP 5 : DETAILED ANALYSIS
The assigned lead agency, normally either Parks, Forests or Environment, will coordinate a detailed analysis of priority areas in their appropriate regionldistrict. This
groups and the public through existing Ministry resource analysis will involve other agencies, licensees, Native
planning and referral processes.
Detailed analysis includes the assembly and analysis of information for a particular area, the development of options and submission of.appropriate recommendations.
Ministries, and the Wilderness Liaison Committee and Recommendations will first be submitted to the appropriate
Deputies, for review and resolution of outstanding conflicts (if possible).

IV. INVENTORY REPORTS Page IV-92
IV. INVENTORY REPORTS Page IV-91 ATTACHMENT # 1
STEP 6: CABINET DECISION
The revieued and ( i f necessary) revised recommendations are then forwarded to Cabinet for decision.
SUMMARY The provincial strategy, as shown on Figure 1, is the combined process Of:
a statutory framework; a a a
inventory of interests; preliminary assessment; selection of areas for detailed analysis;
and a detailed analysis (including recommendations);
a Cabinet decision.
The strategy could be implemented in the context of an overall land use strategy and the setting of a target (see Attachment #1).
Public involvement. Should the proposed strategy itself and the issues raised below be discussed with
could report to Cabinet and seek direction on options public involvement? If SO. to what level? The WLC
such as holding public/industry meetings or developing a White Paper to discuss the proposed strategy and these issues.
&. Should the existing statutory framework, including nomenclature, be amended or not?
3 . Should an overall land use strategy be developed to provide a context for this proposed strategy? The \
wilderness Advisory Committee recommended that GoverNnent initiate an overall land use strategy for all Crown lands as a major vehicle for conflict resolution. This approach continues to be advocated by a broad spectrum of public groups, including
industry. An overall land use strategy, if developed, recreation/environmental groups and the forest
would guide and direct the proposed strategy on protected areas.
4. Should a target be set for'additional protected areas? It may be desirable to include a specific target or reasonable upper limit for designated protected areas in order to:
(a) alleviate concerns of the forest and mining
protected lands: sectors regarding the potential amount of
(b) indicate that government does intend to designate
both reflects and sets public expectations: and additional areas up to an identified limit which
(c) to provide direction to Ministries either involved in, or affected by, protected areas.
On the other hand, a target that is set would
others as too little. More importantly, a target may inevitability be criticized by some as too much and by
pre-empting the planning process. also be viewed as not only arbitrary, but as
The pros and cons of setting a target could be discussed with public/industry groups.

IV. INVENTORY REPORTS Pam IV-93
ATTACHMENT I 1 - Page 2
I € a target is chosen to be p a r t of the strategy, what is a reasonable one? Approximate1.y 6.3% of B.C. is currently designated as either national or provincial park, recreation area, or provincial forest wilderness area. BY comparison, park/wilderness designations in Alaska are 22%, Alberta 10.5%. Washington lo%, California 10%; Idaho 7.5%; Montana 5%; Oregon 4%, Manitoba and Saskatchewan 2.5%.
A target of an additional 3.7% in B.C. would increase
3.7% alienation from mineral exploration, since the areas designated to 10%. This, however, is not
mineral exploration is permitted in provincial forest: wilderness areas. This is also not 3.7% impact on timber, because the majority ot these areas could be expected to not have timber values.
IV. INVENTORY REPORTS Page IV-94
ATTACt03ENT 112
CURRENT STATUS OF INVENTORY
1. The Ministry of Parks has a systems plan indicating the areas that would meet their provincial objectives as a park. A similar approach is also being developed for ecological reserves.
2 . The Ministry of Forests is now assembling provincial scale and regional scale inventory maps of currently unroaded and undeveloped natural areas and areas considered part of the Net Forest Land Base (upon which existing Annual Allowable Cuts have been based). The Ministry o f Forests is digitizing this inventory on Geographic Information System (GIS).
3. The Ministry of Energy, Mines and Petroleum Resources has a provincial scale inventory showing areas of known high or moderate mineral.potentia1 based on preliminary and generalized information. The mineral potential of much of the Province, however, is poorly known.
4. The Ministry of Environment have developed a special areas inventory from a fish and wildlife perspective.
5. The Ministry of Tourism and Provincial Secretary is developing Tourism Resource Capability maps. These maps will serve as a basis for the Ministry to participate in provincial land-use strategies. Through various regional and sectoral interest groups, high value tourism areas will be revised and updated. First d r a f t of maps has been completed, however, it contains only preliminary inventory and is thus incomplete. Second phase is underway and is expected to be completed by March 31, 1989.

IV. INVENTORY REPORTS Page IV-95
APPENDlX 6
SCHEDULE A
IV. INVENTORY REPORTS Page IV-96
SCHEDULE A
RECREATION INVENTORY DIGITAL MAP PRODUCTION AND INFORMATION
The Minisuy of Forcsu (MOF) will provide the connactor with the digitized information and attributes noted in Attachment 1, The contractor will use Terrasoft to:
1.
2.
3.
4.
4A.
5.
6.
7.
a.
Digitize. as a separate overlay, the 1:2 OOO OOO scale mineral potenrial map with atmbutes smcd as noted on map; and, once approved by MOF, produce mylar copy map with cross-hatching;
Digitize, as a separate overlay, the six 1:600 OOO scale tourism capability maps, with amibutcs stoxed as noted on map and map anachmenc and, once approved by MOF, prcduce mylar maps as noted in #9 (below);
Digitize. as a separate overlay. the location of "cities," and "major highways" as shown on the B.C. Roadmap and major lakes and rivers;
Digitizc, as a separate overlay, 1:600 OOO or 1:250 OOO scale Net Land Base maps provided by MOF. with the digitized Net Land Base lines approved by MOF
Digitize, as a separate overlay, the 1:200 OOO OOO scale map of "Ecoregions of B.C.";
Correct, as mquested by MOF, the m a t i o n opportunity spectrum (ROS) and designated park/wildemess mapping and database;
Provide a unique amibute for each digitized "FL using appropriate "FL numbers provided by MOF
Ensure a l l information previously provided and added is s t o d to cnsm easy access for the purposes of generating maps, summary statistics, and further updating;
After a draft map is approved by MOF, generate map at a scale of 1:200 OOO OOO showing designated paddwilderness areas' and ROSMet Land Base on mylar using cross-hatching, shading, etc. as
* Ignore ROS classes within designated park or wilderness areas for the purpose of producing his map.

~ ~~~~ ~ ~
!
IV. INVENTORY REPORTS Page IV-97
appropriate to ensure legible papa copies can be made with information on #3 (above) shown (but screened) for orientation;
9. Aftcr draft maps art approved by MOF, generate six maps at a scale of 1:6W OOO and one at a scale of 1:2 OOO OOO showing tourism capability on mylar using cross-hatching, shading, on-site symbols. etc. as appropriate to ensure legible paper copies can be made with information #3 (above) shown (but screened) for orientarion;
10. Provide s u m m a r y staristics as noted in Attachment 2;
11. Design Terrasoft to allow additional map themes (overlays) and amibute fdes; and
12. Provide other s u m m a r y statistics and services as requirtd within the terms and conditions of the conuact.
All maps, data. s u m m a r y statistics belong to the province and arc considered strictly confidential.
IV. INVENTORY REPORTS Paae IV-98
ATTACHMENT 2 - SUMMARY STATISTICS
I. The summary statistic format involves four separate reports for the following kinds of "areas":
A. Provincial Summary - for province as a whole.
B. Fmst RegionDisaict Summaries - for each MOF Region and each Dismct within the Region.
c. TS- Summaries - for each individual 'TSA and TR,
D. One hundred mile radius from 11 Major Population Cenms - Vancouver,
George, Fort St. John. Williams Lake and Nelson. Victoria, Nanaimo. Kamlmps, Kelowna, Smithcrs, Prince Rupert, Prince
E. Ecoprovinces, Ecoregions, Ecosections.
IL All of the above repom will have the following two formats for each kind of "ana" (from above):
Ku12 %&a
A. Primitive* ROS Class Semiprimitive Non-Motorized' ROS Class Semiprimitive Motorized* ROS Class
Designated Park/Widdcmess* Other ROS Classes*
TOTAL
B. Total Primitive/Semiprimitive* Classes In Net Land Base and High Mineral Potential In Net Land Base and Moderate Mineral Potential In Net Land Base and Low Mineral Potential &t in Net Land Base and High Mineral Potential &t in Net land Base and Moderate Mineral Potential - Nsu in Net Land Base and Low Mineral Potential
TOTAL
100%
100%
* Ignore ROS Classes within designated park or wilderness areas for the purposes of these summary statistics.

~
IV. INVENTORY REPORTS ' Page IV-99
TOURISM RESOURCE INVENTORY
SUMMARY
In its efforts to promote British Columbia's expansive natural beauty with a wide range of recreational and tourism opportunities. the B . C Minisay of Tourism. Recreation and Culture has rccognizcd the need to develop an inventory of the tourism-based n d resources in the province. The Minisay also sees the value in participating as an q u a l parmer with other govmment ministr ies in int~grated rcsoul~e use dccisions.
A Tourism Capability Mapping system has bcen designed to provide an inventory of tourism values. The classification is based on the recognition of four tourism zones, and is similar to the Rccrcation Opportmly Spectrum approach used by the Minisv of Forests. Classification work was initiated in 1987 and a set of draft maps was completed in 1988 covering the province. The inventory is not complert, as the draft maps are currently in the process of being checked and refined When this is done. the maps wil l be entered into a computtrizcd Gtographic Wormation System. compatible with other ministries' databases.
The inventory information will be useful when assessing and planning tourism interests at an overview level; however, more detailed i n f k o n needs to be collected on the various zones be fm the inventory can be used at a regional planning level. The Ministry is unable to update or revise this inid inventory, given its present budget levels. Basic data such as actual tourism usc in days within the various regions and tourism zones of the province has not been colltned. Without this basic data, the Ministry has to respond on an ad hoc basis to tourism and mcrcation issues within the province as they ccm.
INTRODUCTION
In 1987, the Ministry of Tourism, Recreation and C u l m (MTRQ recognized the need to obtain an inventory of tourism-based natural RSOUTCCS. The MTRC states that tourism is a natural resource-based industry, as well as a service industry.
A Tourism Capabiliry Mapping system was designed to provide an inventory Of
tourism values. This system is similar to the Forest Service's Recrestion Opponunity
~ ~ ~ . .
IV. INVENTORY REPORTS Page IV-1 00
Spectrum (ROS) as it identifies areas of present and potential tourism use. It provides a foundation from which the MTRC can become morc actively and effectively involved in the provincial land use decision-making process.
A Tourism Features Inventory has also been done fo identify values that mate the "Super Natural B.C." theme u s d to market tourism in B.C. Tourism features an defmed as natural wonders such as the Tseax Lava Flow in the Nass Valley or the Hope Slide and man-made features such as the Mica Dam or ski hills.
Through use of the Tourism Capability Mapping and the definition of tourism features. the MTRC provides other ministries with tourism resource information which can be utilized in integrared resource planning.
STATUS
In 1988. the fmt draft of the Tourism Capability Maps WM completed for the entire province. These drafts, produced at a scale of 1:W OOO. are prtsently in the process of refenal and refinement A final product is not available. This draft provides a provincial overview on tourism in the province and shows its relationship with 0th- f m s t ~ S O u l C C S .
Resent inventory plans of the MTRC involve gathering site-specific data on arcas as the need arises. With the cumnt levels of budget, the MTRC has no plans to redo the basic inventory for the whole province. Planning at this time is an "issue-related'' reaction to conflica as they occur. The MTRC is attempting to N1 voids in the data nceived from 0th- ministries; for example, a visual landscape inventory of the Inside Passage (Bella Coola/Prince Rupert) which is not available &om the Minisay of Forests.
Fume plans include investigation into the use of a computerized Geographic hformation System to store and display information. The M i n i s a y is presently re- examining its information requirements. The present Tourism Capability Mapping does not include enough information for detailed planning. thenfore it will not be completed.
The m c is presently redefining its goals and methods of data collection. A user- emphasis style is being investigated, for example, what data is needed, the value of the

IV. INVENTORY REPORTS Page IV-101
Inside Passage for tour operators or what data is nceded to gauge the effect of a hotel development on an area. The MTRC has .not estimated for budgeting changes or updates in the inventory.
METHODOLOGY
To prepare the fmt draft of the Tourism Capability Mapping, the MTRC employed a consultant to map out areas of tourism intmst throughout the province. The consultant used his expertise. MTRC criteria and information obtained &om the Wilderness Liaison Committee repon. the B.C Heritage Caucus and the Tourism Industry Development Subsidiary Agreement Regional Master Plans. A series of interviews was made with representatives of the Ministry of Forests, Ministry of Parks and the Ministry of Environment
In considmation of the varied name of tourism-related opedons and their land rcquinmcnts. a set of land zones was defmed '2hese consist of groups of areas and tourism featurcs which have similar characteristics and which require similar management approaches. The land zones criteria as defined in Appendix A includt:
Back-couatry/~ikhess; Midcounuylnatural; Frontcounay/iitcnsive: urban.
The draft maps are presently in the regional tourism offices to be refined and updated The gencral public, tourist operators and other minismes are being consulted for their input into the tourism resource.
The inventory is subjective and docs not have a measurable statistical reliability. Values and reliability are dependent upon the ability of the consultant to properly apply the zonal criteria and pomay the infomation rcceived from the various somes.
IV. INVENTORY REPORTS Page IV-102
LIMITATIONS/USE
The Tourism Capability Mapping is a valuable tool used to present the provincial oveMew of tourism interests. This mapping was considered by the Wilderness Liaison C o d n e e , of which the MTRC was a full member, in the preparation of their land use smtegy.
The allocation of land rc~crves for different types of recreation is an alternative use of the tourism inventory. For example, helicopter-ski areas and ski touring areas are identifed in the inventory. Areas can then be assigned to each type of operator to ensure that each one has a supply of unuackcd wilderness.
The original mapping was done on large-scale maps. As tourism features data cannot be represented properly on larescale maps, the Tourism Capability Mapping is inadquatc for detailed local planning. Features such as s m a l l lakes or waterfalls cannot be located on large-scale maps.
The draft inventory requires updating as new informarion is acquired. For example, the first discussion papa on the Inside Passage only considend large cruise ships. New information has shown the inmasing presence of s m a l l charter boat operators and kayak c h a r s whose conccrns and interests are different than those of cruise ship operators.
Because the inventory has not been entered into a computer mapping system, there arc difficulties in comparing the tourism inventory with other Minisay inventories. For land managers to use tourism data. it must be easily accessible during the planning process.
Tourist-use data is not available at present Each interest group keeps its own records or estimates of use; for example, National Parks has records of &IC through the park B.C Femes Corporation has records of passengers. These records need to be researched and summarired by MTRC to show the significance of tourism on the provincial land base and the provincial economy.
" IV. INVENTORY REPORTS Page IV-103 IV. INVENTORY REPORTS Pane IV-104
COMMENTARY
To enable the formation of a provincial .land usc strategy. resource informadon for all ministries must be presented in a compatible form. All inventories should be entered into GB.
The h4TRC sees the value in being a full partner with other government ministries in integrated resource use decisions. The present overview on the tourism resource is an important tool in inter-Minisay decisions.
At present, the MTRC is not s u r e exactly what data it requires or how it is going to collect it. The MTRC will continue to investigate each resome conflict as it occurs.
APPENDIX A
TOURISM CAPABILITY MAPPING ZONE DEFINITIONS

IV. INVENTORY REPORTS Page IV-105
TOURISM CAPABILITY MAPPING ZONE DEFINITIONS
The definition of the zones designed by the MTRC to delineate the Tourism Capability Mapping an as follows.
BACK-COUNTRYWILDERNESS ZONE
Provision to a smaller, though high-paying clientele. of high quality ( o h n world class) wilderness experience in pristine unaltered environment characterizes this zone. Big game and fishing guide/outfitter operations, river rafting operations. photo s a f a r i s , nature treks, Wmountaineerhg trips, sail charters. sea kayaking and horseback mps an associated with this Zone. The absence of motorized vehicles and substantial lack of in f rasmcm are amibutes of wilderness. The tour is t experience emphasis is on landscapes which have not been altered by man.
Sub-zones
High Capability - Preserved
Extensive (+5OOO hectares) quality wilderness area already preserved as provincial park recreation ana forest wilderness ecological reseme or national park.
Hlgh Capability - Unpreserved
Quality wilderness areas which, though currently unprotected have been idennfed by government agencies and/or citizen organizations (MOF Recreation, Wilderness Canada Comminec).
Other Wilderness Areas
Other extensive (+so00 hectares) arcas which s t i l l remain in wilderness State but which an neither protected nor proposed for protection.
IV. INVENTORY REPORTS Page IV-106
MID-COUNTRY/NATURAL ZONE
Tourism in the Mid-Counuy Zone is characterized by the provision of recreation experiences for "intemediate" numbers of visitors in a quality, wildland environment. Motorized uanspon (car, helicopter, sightseeing aircraft, motor boats, cruise ships) and smaller-scale facilities infrasaucture (e.g. fishing lodges, resorts) arc found in this zone in a manner that is compatible with the natural quality of this zone. Road access parks, quality fishing areas and scenic secondary or back-mad 'drives arc associated with this zone. Private lands arc limited and even non-existent in areas of this zone, with commercial tourism ventures frequently operating on lease-hold Crown lands. The potential for conflict with other USCK is significant in this zone for this is where industriai foresuy and mining activity predominates.
Sub-Zones
Hlgh Capability
- Nationdprovincial significance (e.g. Inside Passage) Multiple tourism values
Accessible to urban areas and key aspects of the uansportation network Capability to handle larger number of tourism operations
Medium capability
RegionaVlocal significance More remote from main uansportation network and urban mas Individual rather than multiple tourism values and features
Low Slgnlflcance
Minor tourism values/feams
FRONT-COUNTRY/INTENSIVE ZONE
The Front-Counuy/Intensive Zone services large volumes of tourists in a naturally scenic, though heavily altered environment This zone emphasizes the valley bottom settled regions of the province. It is focussed on southern and coastal B.C. conjoined by major highway corridors. Tourism activities in the Front-Counuyflntensive Zone will often be tied to motorized and high-volume transportation: buses, planes, aains, cars, gondola lifts. Tourism in this zone often involves the development of substantial infrastrucrures: destination resons, motels, restaurants, shopping areas, entenainment services, tourist attractions, ski areas, etc.
* As obtained from the Ministry of Tourism, Recreaaon and C u l m .

IV. INVENTORY REPORTS Page IV-107
Sub-zones
High Capability
Areas around existing large-scale, large-investment tourism features; e.g. destination reson and ski hill hinterland Areas where multiple tourism f e a m s coincide, or whcrc features of ouutanding tourism si@lcance occur (international, national, provincial) would be represented by this sub-zone as well.
Medium Capability
Areas around s m a l l , moderate-invesfment tourism features. andor features of regional tourism signifcance would be repnxented by this sub-zone. Most scenic highways would be included in this sub-zone (unless they were of such s i d c a n c c as to be afforded High Capability rating. e.g. Rogers Pass).
Low Capability
Other areas of the Front-Countryflntensive Zone of lesser tourism importance.
URBAN ZONE
The Urban Tourism Zone corresponds with the l a r g e r urban cenms in B.C. (Vancouver, Victoria, h c e George, Kamlwps, Kclowna etc.) w h m a wide variety and intensity of tourism services arc provided. Cultural-based tourism is the strongest feature of this zone. Typically, urban-based tourism is more dependent upon municipal land management decisions than provincial, thus it was not m a p p i
IV. INVENTORY REPORTS Page IV-108
WATER RESOURCE INVENTORY
SUMMARY
T h e Minisay of Environment, Water Management Branch is responsible for managing the provincial water resources in B.C. Accurate monitoring of the available water in the province is necessary to facilitate forecasting of water quality and water quantity for protection, operational decision making, and integrated resource management.
Water rights are related to estimated output of smams. Licencce rcquests are checked against records. If no records exist, then smam gauging will be done before a license is granted. The total quality of al l licences must be less than the estimated low flow of the smam.
The Federal Government mainrains daily measurement of inland water levels and flow rates.
From OUT discussions with personnel kom the MOE, they appcar to be obtaining adequate information to meet their objectives. The monitoring processes arc continuing ongoing activities and therefore the concept of a complete water inventory can never be achieved.
There are 285 community watersheds containing Crown lands in B.C., covering a total of 11 287 Ian’. These watersheds supply over 500,000 people or 21% of B.C.’s population with domestic water and therefore water quality and quantity are primary concerns. Other activities such as forestry and recreation take place within these community watersheds. Therefore, the development of resources within them will rquirc both government agencies and licensed resource users to ensure a level of supervision and monitoring over and above that normally provided.
There are two privately controlled watersheds: Greater Vancouver, which is leased land and supplies 50% of B.C.’s population; and the Greater Victoria, which is mostly fee simple land and supplies 9% of B.C.’s population. Access on these watersheds is smctly enforced. Some timber harvesting is done on a controlled manner.
As pressures on the use of the water resources increase, increased monitoring of the resources is needed too. so that better planning for the future management of the water resources can be accomplished

IV. INVENTORY REPORTS Page IV-109
INTRODUCTION
The Minisay of Environment (MOE) is responsible for maintaining and protecting the water resources in Bridsh Columbia That M i n i s a y ' s Water Management Program has as its goal "to manage the provincial water resources to maximize the conaibution these resources make to the social and economic development and well-being of all British Columbians.".
The objectives of the Water Management Programs, as stated by the MOE, arc:
A Water Management Program which is managed cost effectively through planning, budgeting, fiscal conaol; program evaluation; asset conml; effective communication systems; personnel system administration; adahisuative suppon services; technical support systems; and staff safety and mining.
Reduced potential for property damage and loss of life due to flooding and erosion by run-off forecasting. snow surveys. emergency action. regulation of flood plain development. implementation of flood and erosion protection projects. and inspection and maintenance enforcement for dykes and dams. Assured protection of licensed watcr rights and insacam uses through allocation and regulation of the supply and use of surface water under the Water Act;
An assured adequate level of water seIvice to the public by privately-owned urilities by q u i r i n g works to appropriate technical standards; reguiaalng water urilities; and providing technical support, including project management, to funding minismes;
A high level of water resource quality for groundwater, fresh surface water, estuarine and coastal marine waters. It wll be achieved through the establishment of resource quality objectives, water quality monitoring, watershed planning, referral and consultative processes, and assistance in the conaol of nuisance aquatic vegetation;
IV. INVENTORY REPORTS Page IV-1 1 0
An adequate information base on the supply capability of surface water and groundwater resources through the collection, storage and analyses of data;
A high level of public health engineering support for the Minisay of Health through approvals and inspection of water supply sources, supply and ueatment works, swimming pools and waste disposal systems.
Other uses of the Water Management Program arc for:
Forecasting for flood damage reduction (e.g. out of 182 municipalities in B.C., only one is not flood prone);
Operational decision making by uscrs of the water resome such as hydroelecmc power, irrigation, domestic and municipal water supplies;
Integrated resource management (i.e. an approach to managing resources where primary, secondary and otha uses arc compatible and normally results in continued production of a);
The Federal Government, through Environment Canada, is responsible for maintaining a daily record of inland water levels. This federal agency maintains standard measurement of water levels of major lakes and flow rates and peak water levels for major rivers across Canada. Records in B.C. commenced in 1878 on the Fraser River at Mission. These rtcords are considered as legal documents and have been used in court cases. The cost of this program is shared with each provincial government The records are utilized by the Department of Fisheries and B.C. Hydro.
During the late 1960's. many public complaints were made to the government concerning a drop of water quality within community water supply watersheds due to resource use activities, particularly logging. This is perhaps inevitable since the province is committed to a policy of integrated use of the forest resources. In 1972, a Provincial Government Task Force was formed to review the following:
Investigate the practicality of obtaining wholesome water supply from streams, the watersheds of which are subject to multiple use and;

IV. INVENTORY REPORTS Page IV-111
Recommend policy and pnxcdurcs for management of land use conflicts within watersheds.
As a result of this review, the task force published “Guidelines for Watershed Management of Crown Lands used as Community Warn Supplies” in 1980. These guidelines were intended for use by personnel involved in decisions regarding resource management activities on Crown lands within community watersheds. This is important because, in law. the onus to delivcr high quality water to the consumer rests with the water purveyor (in this case the Crown is the purveyor).
There arc 285 community watersheds containing Crown lands in B.C., covering a total area of 11 287 km3. These watersheds supply an estimared 500,000 people with domestic water (Reference #Z). Enfommcnt of regulations governing the quality and quantity of water within these community watersheds is carried out in close collabom tion with the Ministry of Lands and the Minisay of Forests
The Greater Vancouver Watershed and the Greatex Victoria Watershed arc two major privately conmlled water catchment anas. As of July 1. 1986, these watersheds supplied approximately 1.4 million and 0.25 million people, respectively. Public access is limited and timber hmea is suictly controlled to artas whcx risk to water quality is minimal.
Tab&? N-3 shows the various types of water supply sources and the estimated percentage of the provincial population served by each soume.
IV. INVENTORY REPORTS Paae IV-112
TABLE IV-3
DOMESTIC WATER SOURCES - BRITISH COLUMBIA
TOTAL PROVINCIAL PERCENT
POPULATION POPULATlON WATER SUPPLY SOURCE
1,205,000 50.3 Leased land (Greater Vancouver Water District
21 6.000 9.0 Owned land (Greater Victoria Water District)
221.000 9.2 Main Stem or large lakes
245,000 10.2 Wells. springs and miscellaneous individual sources
512.000 - 21.3 Community Watersheds
2,400,000 100.0 Total, Provlnce
Source: Guidelines for Watershed Management of Crown Lands used as Community Water Supplier, Task Force 1980.

IV. INVENTORY REPORTS Page IV-113
STATUS
According to MOE Water Management Branch personnel interviewed, the Ministry is achieving its management objectives. T h i s is a continuous and ongoing process.
MOE Hydrology Section npon states that a considerable amount of hydrometric data has been collected for the province. This data can be used to generate estimated mean annual run-off province-wide and for geographic basins.
Streams within large arcas along the coast remain ungaugd Historical information on water levels and s t r e a m flows arc missing in many instances and nothing can be done about that now. This emphasizes the importance of collecting and recording as much infomation as possible for future management purposes.
One cannot expect complete information on water resources because of the vast numbers of s n c a m s and lakes involved. It would require an extensive network of sacamside gauges and monitoring systems, but basically the more monitoring installations in place, the greater the confidence in the water inventory.
The Greater Vancouver and the Greater Victoria Water Boards have excellent =cords of use and availability of water. The Vancouver B o d has maintained records for 75 years.
METHODOLOGY
Data on the water rcsourcc in the 19 geographic locations and watersheds in the province is collected by monitoring snow depth, snow melt and run-off. A network of snow survey stations and smamside gauging installations is established throughout the province.
Run-Off
The greatest propomon of British Columbia's major river saeamflow originates Erom the melting of mountain snow. Winter precipitation accumulates as snow on the mountainous watersheds, forming a reservoir, from which water is released to swell sueams during the spring and summer run-off periods. Measunment of the water
IV. INVENTORY REPORTS Page IV-114
contained in the snowpack prior to the commencement of melt is a good indicator of subsequent sueamflow. This information is essential data for the agencies concerned with hydroelecttic power. flwd conaol, irrigation, and domestic and municipal water supply. In order to make run-off projections and sound recommendations. snow measurements begin as early as January 1 each year.
Snow survey stations are established at selected locations and elevations on major and mbutary basins. The majority of these staaons consists of a snow course only. Each snow course has 5 or 10 sampling points where a sampling tube is used to cut through the full snow depth, the depth is noted and the core is weighed. The average core weight indicates the water equivalent of the snowpack.
A few of these stations are quipped with snow pillows used to obtain a continuous record of snow water equivalent Pillows in use in British Columbia are methanoYwatcr tilled 3 m diameter, nylon-reinfmed.rubbcr containers. A sensing and recording device is attached to the pillow to monitor the pressure change mated by the accumulation or depletion of the snowpack. Most of these pillows are now quipped to transmit data every thrce hours via satellite. In addition all but one of these, snow pillow stations arc insuumentcd to monitor precipitation and temperature.
After waterzquivalent measurements have been taken at the same sampling date for a number of years, a correlation is derived for a watershed by relating water equivalents and other applicable data to the subsequent saeamflow. This relationship is used to forecast seasonal volume sueamflow. These sacamtlow forecasts arc published in the April 1 and May 1 bulletins, and are made with the assumption that precipitation and temperature patterns will be normal during rhe forecast period.
The daily temperam panern during the snow melt period is the critical factor in determining maximum stages on major rivers. Only the very unusual combination of delayed snow mels followed by a sustained period of high temperahms, causes flood- producing stages on major rivers.
Smam gauging stations are set up at 627 sites through the province for measuring the actual flow of water after leaving the snowpacks.
The accuracy of h e computed basin results is highly dependent on the portion of the basin area that is gauged. Considering the long-term records of Water Survey of Canada published data, the accuracy of the results for the Fraser, Skagit, Columbia,

~- .~~~~ ~c.~;_~”~_ ~~ ~ ~ ~
! IV. INVENTORY REPORTS Page IV-115
Peace. Liaxd, Taku. Stikine, Unuk, Nass and Skecna should be within 10% as most of the basin area is gauged Accuracy for the remaining basins is variable and it is not possible to indicate how accurate the results are. As far as the provincial total is concerned, 84% of the total area is gauged and, as such, the accuracy of the total run- off should be within 10% (MOE Hydrology Section Repon 1986).
The following Table N-4 illusnates the estimated run-off for the 19 watershed basins in B.C.
The Greater Victoria Water Board m a i n t a i n s daily records of precipitation and water levels in each of the natural lakes and reservoirs that make up its water catchment area Snowpack measurements arc not taken because snow does not sigruficantly contribute to Victoria’s water supply. Each rcseryoir has a measured volume and is quipped with a gauge to record water levels. A depth volume curve provides an estimate of the amount of available water.
The Grrater Vancouver Water Board uses snowpack measurements in each of its three watersheds to predict the potential volume of wafer to be available each summer. Vancouver usually has a surplus of water until July when precipitation decrtases and snow run-off provides the majority of their water. Vancouver has 75 years of historical water records. The capacity of each reservoir is known and measurements of the water height on each dam allow the B o d to record the volume of water available. Water used by the city through the wafer mains and water escapement for minimum creek flow is measured
IV. INVENTORY REPORTS Paae IV-116
TABLE IV-4 BRITISH COLUMBIA ANNUAL RUN-OFF
MEAN ANNUAL UNIT ANNUAL RUN-OFF
BASIN 1 O’dam’ Mean High Low
(thousands) (millions) mm mm mm
AREA RUN-OFF 1 o3kmz
Fraser Skagit Columbia Peace-Wapiti
Hay-Chinchaga
Liard Yukon
Alsek-Skagway Taku-Whiting Stikine
Unuk Nass-Bear
Skeena
North Coast Mid-Coast (N) MidCoast (S) Lower Coast Queen Charlotte Is. Van. Is. & Gulf Is.
234.2 1 .o
105.2
125.8
8.6
144.0
24.7
11.1
18.8
49.8
1.8
26.9
56.5
36.5
16.2 27.0
15.6
10.1
34.8
120.8 1 .o
66.9
50.2
0.6
37.3
13.0
10.2 19.5
46.2 4.1
47.1
61.2
74.5
36.0 58.4
37.7
27.5
95.2
51 6 984 636
399
67
259
528
922 1 038
928 2 229
1 753
1 083
2 041
2 227
2 166
2 409
2 731
2 732
607 1 598
745
501
106
329
61 0
1 100 1 284
1 091 2 680
1 957
1 267
2 589 2 872
2 604
2 845
3 163
3 461
425 599 499
297
31
21 1
41 9
76 1 878 n 4
1 796
1 549
941
1 657
1 785 1 877
1 844
2 226 2 006
PROVINCE 948.6 807.4 851 1 029 690
km2 = square kilometres
dam’ = cubic decametres (10 cubic metres)

IV. INVENTORY REPORTS Page IV-117
Groundwater I
Out of approximately 60,OOO ground wells in the province, 145 are observed on a daily basis to monitor the levels regarding extraction and rate of ability to recharge. Potability tests arc also canied out at these locations to monitor m a n ’ s activity in agriculrurr.
Quality
Sixty thousand samples are taken per year at 100 sites to measure against 40 pollutants (e.g. pulpmills). This is canied out by joint provincial and federal agencies.
The Water Management Branch is responsible for water rights licencing in B.C. The application date for each application is the priority rating for the licence. If the volume under application is lower than the estimated minimum s u e a m run-off, the Wata Branch may not quire smam measurement before granting the licence. If there arc other c m n t licencax on the strcam. then past records will be used to determine if there is enough water left over for the new licence. Mon measurement may be required. Estimation of low smam low flow is a judgemnt call based upon history, licencee knowledge and smam flow gauging. If records or measurements show that not enough flow is available, then the new licence will not be granted
It should be pointed out that the methods of measurement are considered to be accurate and will improve as technology improves. However, the information is ody accurate at the time it was measured because rainfall and snowfall. by their very nature, are constantly changing phenomena
LIMITATIONS
IV. INVENTORY REPORTS Page IV-118
heavily populated rural areas arc measured. Other Minisny opinions, however, did not see a great need for this.
It is apparent from our interviews that more groundwater gauges are necessary to incnase the confidence in that data collection. Not only is there a need for more gauges, there is also a need for the maintenance of these gauges over long periods. Shon-term records of 10-20 years seldom satisfy the need.
COMMENTARY
In the opinion of the MOE Water Management Branch personnel, the management of the provincial wafer resources is adequate. As pressures on the use of the water resources are increasing, however, increased monitoring of the wafer resource is needed to provide more knowledge for the effective management of these resources.
The federal government has accepted responsibility for the major effort in s u e a m gauging and therefore there is a need for more funding not only by the province, but also by the federal government There is also a need to inmasc our knowledge of the impacts of logging in specific drainages by continuing the funding of the well- published experiment on the Carnation Creek Watershed Study.
Water quality and quantity arc the primary concerns in community watersheds. On the other hand. the timber and recreation resources in these same watersheds should be safely incorporated into an Integrated Watershed Management Plan. Therefore, it is generally in the public interest that community watersheds be managed for the production of both water and timber as well as for other natural resou~ces. However, such management must be guided by comprehensive planning that will not only identify integrated use potentials and oppormnities, but also define the management conditions required to ens= compatibility.
One Minisrry opinion felt that instead of 627 suem sites for measuling waterflow 1.800 are really needed to get complete provincial coverage. At present, only !he

IV. INVENTORY REPORTS P a w IV-119
REFERENCE MATERIAL
The sources of the above information came from personal, phone and questionnaire interviews with:
PERSONAL INTERVIEWS
MOE Wafer Management Branch Don Kasianchuk, Director of Wattr Management - Don Reksten, Head of Watershed Studies Jim Manison, Manager of Licensing Section Sandra Smith. Head of Planning Section
PHONE DISCUSSIONS
B.C. WiIdlifc Federation . Don Robinson, Board of Dircctm Charlie COmfiild Dirtctor
UBC Forestry Doug Golding, Hydrologist
LlTERATURE REFERENCE
#I Guidelines for Watershed Management of Crown Lands used as Community water supplies.
A SUMMARY OF TECHNICAL REVIEWS OF
FOREST INVENTORIES AND ALLOWABLE ANNUAL CUT DETERMINATION
IN BRITISH COLUMBIA
Prepared for:
THE BRITISH COLUMBIA FOREST RESOURCES COMMISSION Victoria, B.C.
Prepared by:
HST CONSORTIUM Richmond, B.C.
September 1990 SM:jl R9004-WlWP5