i” stockthe u market jiii gametm tuscola...
TRANSCRIPT
THE
I” STocKU MARKETJiii GAMETM
Tuscola Technology Center Chapter
Tuscola Technology Center
1401 Cleaver Rd
Caro, Michigan, 48723
Mitchell Rayl, Amber Schmidt, and Allie Corradi
April, 2011

STOCK MARKET GAME
TABLE OF CONTENTS
I. EXECUTIVE SUMMARY 1
II. ANALYSIS OF PORTFOUO PERFORMANCE 2-3
Ill. RATIONALE
A. Explanation of research conducted prior to selection of stocks and/or funds 4
B. Strategy used to diversify investment portfolio 4
C. Description of how selected stocks and/or funds fit strategy 5
IV. CONCLUSIONS AND FINDINGS
A. Explanation of strategy effectiveness 6
B. Proposed changes in strategy for future investments 7
V. CHARTS/DIAGRAMS OF PORTFOLIO PERFORMANCE 8
VI. BIBLIOGRAPHY 9

1
Executive SummaryOverview of Portfolio:
4 Third place in the state of Michigan.4 Twentieth in the Central Region.4 Earned over $26,000 in equity during the duration of the competition.
We had a diversified portfolio with stocks in several industries including: technology,transportation, entertainment, and manufacturing. We invested in Google, Apple,Disney, Federal Express, John Deere, and Dow Chemical. Our justification for buyingthese stocks was that we viewed diversification as a “safety net” in the continuouslychanging stock market.
Research Methods: The biggest contributor in our pre-investment research wasYahoo Finance. We focused on companies that were well known to us. We believethis gave us a competitive advantage because we were able to view stock historywith a clear understanding. While viewing stock history, we decided on how much ofour money we wanted to invest in each individual company, which contributed toour winning portfolio.
Strategy and Diversification: Our strategy consisted of a “buy and hold” method.We had an aggressive attitude and began investing in our stocks the first day of thecompetition. Although we faced the temptation to sell stocks as the marketfluctuated, we understood that the business cycle was in a trough and wouldeventually gain equity. We diversified our stocks into several industries making itmore secure in case of severe market correction.
Overall Performance/Learning Experience: Our portfolio was very successful. Wegained over $26,000 in equity over the three-month period of the stock marketgame. It was also a great learning experience for all of us. As we progressed throughthe game, we began to understand the complexity of the financial world, and wefeel that this has helped us in preparing for future investment opportunities.
4 “Through this experience, I learned more about the stock market than I everthought I could.” - Allie Corradi
4 “Going into the stock market game, I really didn’t know anything aboutstocks — purchasing or selling; but through the duration of the game, I gainedconfidence in myself and in my ability to be a future investor.” — AmberSchmidt
4 “I feel this experience with the stock market game prepared me to makemore professional decisions in my future financial planning.” — Mitch Rayl

2
II. Analysis of Portfolio Performance
Our portfolio consisted of six stocks: Apple, John Deere, Disney, Dow Chemical,
Federal Express, and Google. We were successful and earned over $26,000 in equity
by using a “buy and hold” strategy. We were also very aggressive in purchasing
stocks. We made the majority of our purchases in the beginning of our competition.
The following is an overview of our entire portfolio.
Ticker Position Shares Last Net Cost Net Cost Current Current Gains/Losses
Trade per Price per Value
Date Share Share
AAPL Long 100 9/14 2734212 2734212 3206100 3206100 471888
DE Long 300 9/08 69.4518 20835.54 81.5500 24465.00 3629.46
IDIS Long 500 9/08 345168 17258 40 37 0500 18525 00 1266 60
DOW Long 500 9/08 26.2752 13137.60 33.9500 16975.00 3837.40
FDX Long 200 9/08 85 4862 17097 24 93 0700 18614 00 1516 76
GOOG Long 100 9/08 479.9916 47999.16 590.8000 59080.00 11080.84
TotaI: :
We are very proud of our winning portfolio where we used research, diversification,
and strategy to produce substantial gains during a relatively short period of time.
Moreover, the companies we picked are all industry leaders with innovative
business models. In fact, almost all of the stocks from our portfolio have continued
to gain equity since the end of the competition.

3
Apple Provides personal Revolutionary iPods, $350.07computers and iPads, iPhones, andother mobile Macbooks.electronic devices.
Deere & Provides products Tractors, combines, $95.96Company and services and lawnmowers
primarily for with outstandingagriculture and brand recognition.forestry worldwide. Licensed clothing and
toys.
Disney Global leader in the Disney World, Disney $42.26entertainment Land, Walt Disneyindustry. Pictures, various
licensedmerchandise.
Dow Chemical Manufactures and Household goods and $39.67supplies products products, as well asused as raw medical andmaterials in the industrial items.production of Innovative processescustomer products and procedures.and servicesworldwide.
Federal Express Offers Transportation, e- $94.39transportation of commerce andgoods business services ininternationally, the United States and
globally.Google Maintains an index Google.com, $537.11
of Web sites and common and reliableother online search engine.content for users, Google Docs. Reliableadvertisers, and email. OperatingGoogle network system for the Droid.members and othercontent providers.
The following table shares information about the companies that made up our
portfolio:

4
Ill. Rationale
A. Explanation of Research Conducted Prior to Selection of Stocks and/or
Funds
Extensive research was used prior to purchasing shares. The main source that we
utilized to make smart portfolio decisions was Yahoo Finance. Fundamentals
such as P/E and the 52 week range were taken into consideration before building
our portfolio. P/E, or price to earnings, indicates how much an investor must pay
per share, while the 52 week price range is what many investors acknowledge as
the starting point.
B. Strategy used to Diversify Investment Portfolio
According to Investopedia, diversification is defined as “A risk management
technique that mixes a wide variety of investments within a portfolio. The
rationale behind this technique contends that a portfolio of different kinds of
investments will, on average, yield higher returns and pose a lower risk than
any individual investment found within the portfolio.”
Source: (http://www.investopedia.com/terms/d/diversification.asp)
We embraced this strategy within our portfolio by investing in diverse stocks. For
example, we invested in two technology stocks, two service stocks, an industrial
goods stock, and a basic materials stock. Each of the stocks contributed to our
earnings and supported our strategy to be diversified.
5
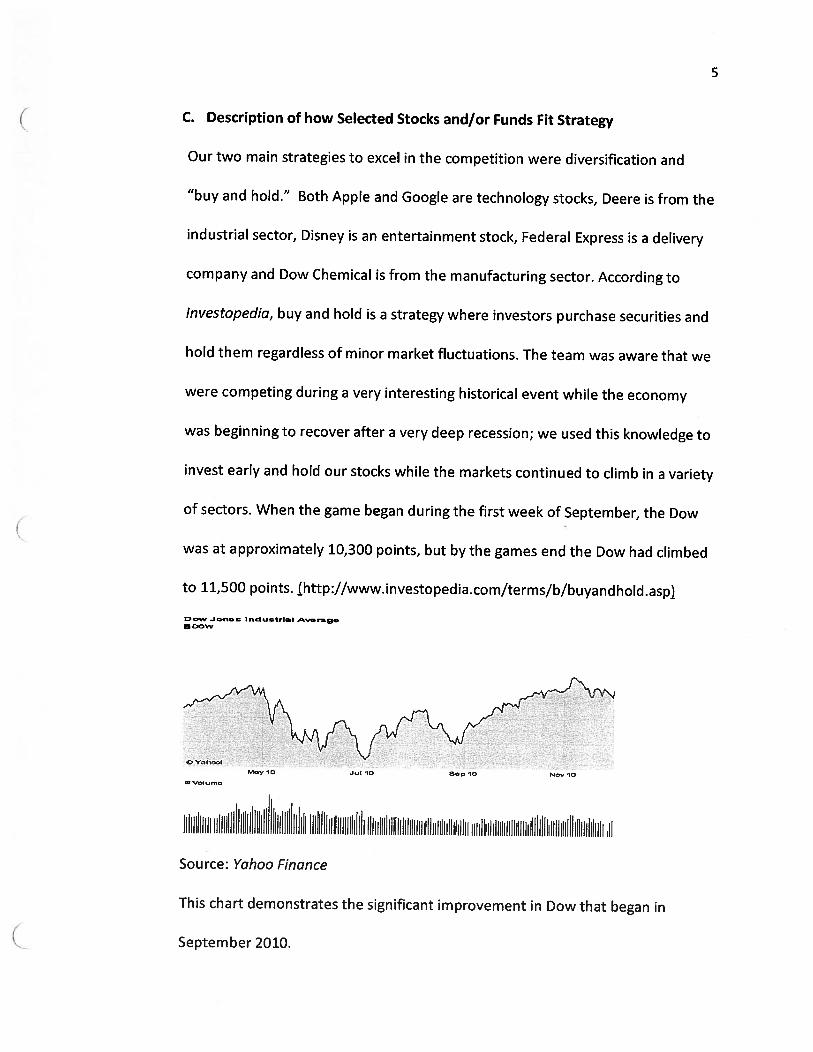
C. Description of how Selected Stocks and/or Funds Fit Strategy
Our two main strategies to excel in the competition were diversification and
“buy and hold.” Both Apple and Google are technology stocks, Deere is from the
industrial sector, Disney is an entertainment stock, Federal Express is a delivery
company and Dow Chemical is from the manufacturing sector. According to
Investopedia, buy and hold is a strategy where investors purchase securities and
hold them regardless of minor market fluctuations. The team was aware that we
were competing during a very interesting historical event while the economy
was beginning to recover after a very deep recession; we used this knowledge to
invest early and hold our stocks while the markets continued to climb in a variety
of sectors. When the game began during the first week of September, the Dow
was at approximately 10,300 points, but by the games end the Dow had climbed
to 11,500 points. çhttp://www.investopedia.com/terms/b/buyandhold.asp
Dow J ono C Industrial Rva rage— Dow
iIiIiJi 1 liiiiItU ii iiiIiiiiiii II Iii II Ii Ii
Source: Yahoo Finance
This chart demonstrates the significant improvement in Dow that began in
September 2010.
6
IV. Conclusions and Findings
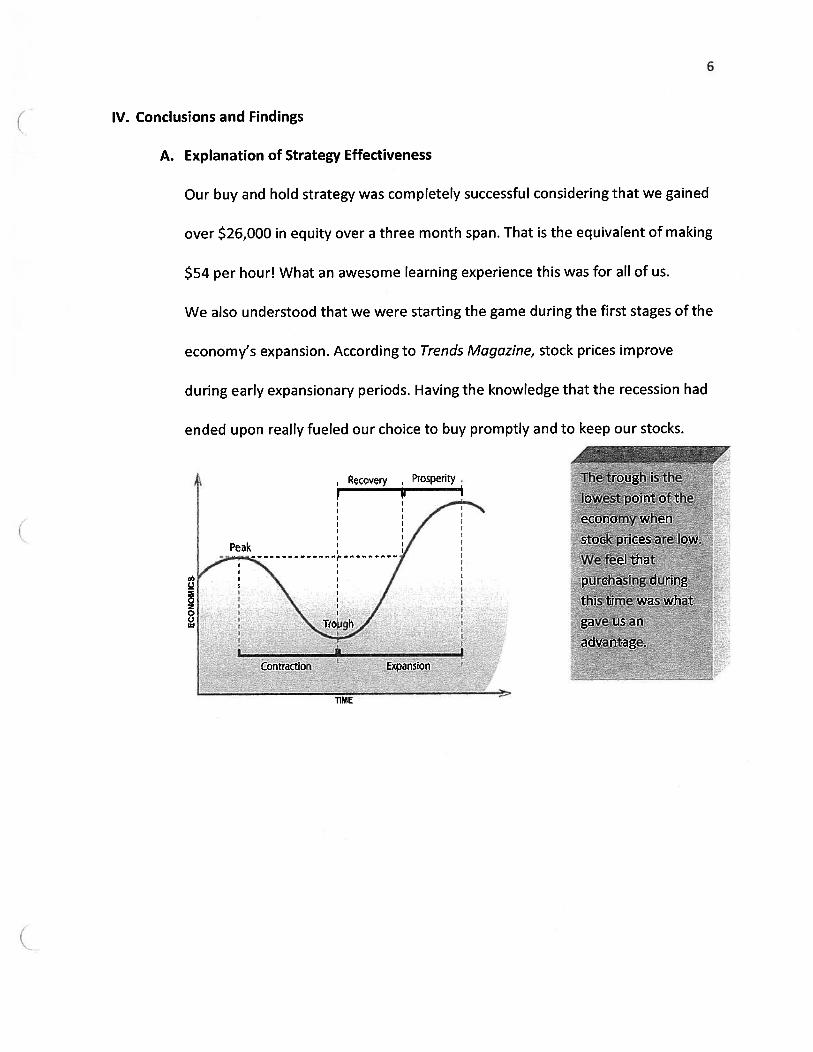
A. Explanation of Strategy Effectiveness
Our buy and hold strategy was completely successful considering that we gained
over $26,000 in equity over a three month span. That is the equivalent of making
$54 per howl What an awesome learning experience this was for all of us.
We also understood that we were starting the game during the first stages of the
economy’s expansion. According to Trends Magazine, stock prices improve
during early expansionary periods. Having the knowledge that the recession had
ended upon really fueled our choice to buy promptly and to keep our stocks.
Recovery Prosperity
020z00Ui
Peak
Contraction Expansion
The trough is the
lowest.point of the
economy when
stock prices are low.
We feel thatpurchasing during
this time was what
gave us an
advantage.
TIME
7
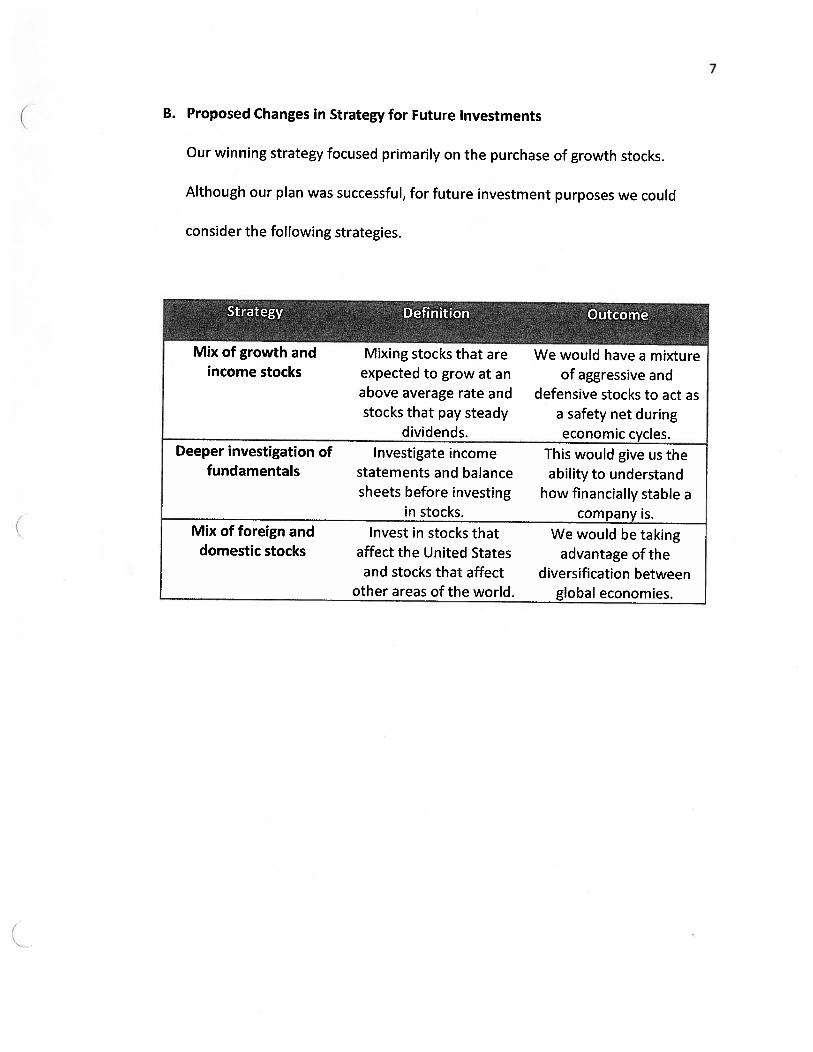
B. Proposed Changes in Strategy for Future Investments
Our winning strategy focused primarily on the purchase of growth stocks.
Although our plan was successful, for future investment purposes we could
consider the following strategies.
expected to grow at anabove average rate andstocks that pay steady
dividends.Deeper investigation of Investigate income This would give us the
fundamentals statements and balance ability to understandsheets before investing how financially stable a
in stocks. company is.Mix of foreign and Invest in stocks that We would be takingdomestic stocks affect the United States advantage of the
and stocks that affect diversification betweenother areas of the world. global economies.
Mix of growth andincome stocks
Mixing stocks that are We would have a mixtureof aggressive and
defensive stocks to act asa safety net duringeconomic cycles.
8
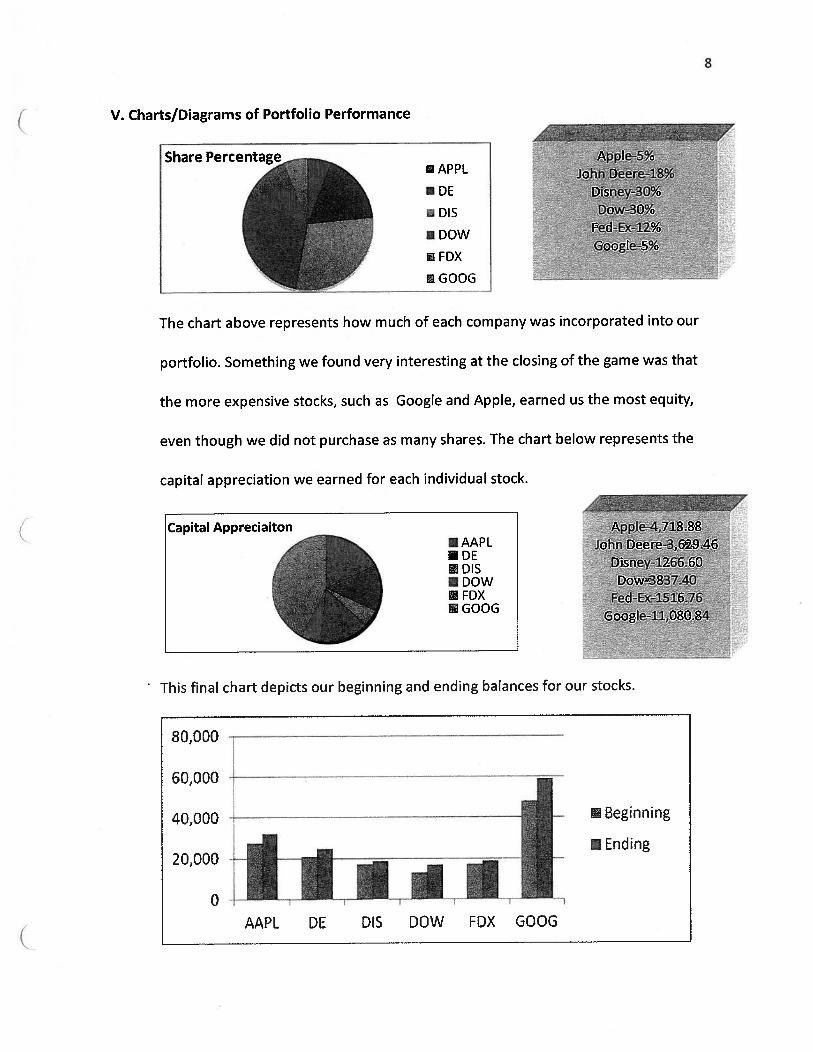
Appl5%JohñUieeie-18%-
Disney-30%- D0W-3Q%
- FèdEx-12% -
Goqgle-5%
The chart above represents how much of each company was incorporated into our
portfolio. Something we found very interesting at the closing of the game was that
the more expensive stocks, such as Google and Apple, earned us the most equity,
even though we did not purchase as many shares. The chart below represents the
capital appreciation we earned for each individual stock.
-Apple-4,718.88AAPL ióhñDêere362946KDE -;.
DIS Disney-1266.60..
K DOW - - Dow-3837AOFDX - FedEx-1516.76GOOG Googie-11,080.84
V. Charts/Diagrams of Portfolio Performance
Share Perce1,APPL
4 DE
4 DS
I DOW
I FDX
GOOG
Capital Appreciaiton
This final chart depicts our beginning and ending balances for our stocks.
80,000
60,000
40,000
20,000
0
Beginning
Ending
AAPL DE DIS DOW FOX GOOG
9
VI. Bibliography
Investopedia Investopedia.com 20 March 2011. http://www.investopedia.com/.
Mehagian, Doug. “Where Are We in the Economy Cycle?” Trends Magazine Spring 2011: 5.
Yahoo! Finance - Business Finance, Stock Market, Quotes, News. Web. 26 Apr. 2011.
http://finance.yahoo.com/.


STOCK MARKET GAME
Northern Highlands Regional High School
298 Hillside Avenue
Allendale, New Jersey, 07401
Hayley Bishop and Olivia Pascarella
May 1, 2011
Table of Contents
I. Executive Summary
II. Analysis of Portfolio Performance
III. Rationale
a. Explanation of Research Conducted Prior to Selection of Stocks or Funds
b. Strategy Used to Diversify Investment Portfolio
c. Description of How Stocks and!or Funds Fit Strategy
IV. Conclusions and Findings
a. Explanation of Strategy Effectiveness
b. Proposed Strategies for Future Investments
V. Charts/Diagrams of Portfolio Performance
VI. Bibliography
VII. Appendix
I. Executive Summary
Overall Analysis of Portfolio PerformanceOur portfolio generated a total return of 26% ($125,5,06) during the 10-week game. This
represents an annualized return of 135% and beat the S&P. 500 gain of 12.5% during this 10-week period. These results are after $20,600 in brokerage commissions.
Research ConductedOur research consisted of a wide range of topics and information. We reviewed industry
research data and trends. We considered traditional company-related fundamental analyses suchas revenues, profitability, growth, markets, available and expected products/services, currentevents, and competition. We also analyzed the company Earnings Per Share, Price EarningsRatios as well as some technical analyses such as stock price trends.
StrategyOur strategy was based on several important factors. Specifically, we wanted a
diversified portfolio and we invested in 19 different stocks that covered 11 different types of themarket segments, ranging from retail and technology, to healthcare and communications. Withinthese industry categories, we generally did not choose “Best in Breed” companies, but insteadtried to identify companies which were less visible or widely known.
Another strategy we used to maximize our potential returns was to invest in stocks with ahigh EPS and a low PE. We also tried to find investments that were less impacted in a weakeconomy.
Finally, we tried to use a modified Dollar Cost Averaging Approach as we oftenpurchased additional shares of stocks already in our portfolio. We consistently did this for thebetter performers in our portfolio, rather than all stocks in our portfolio.
How Investments Fit StrategyWithin the 9 industry sectors, we selected 19 companies that we thought best met our
strategy. In the retail sector, we choose Decker’s Outdoor Corporation, Lululemon, and UrbanOutfitters. In technology, we selected Oracle, RTMM, Verizon, and Cisco. In financial services,we invested in Bank of America and Lazard. In the metal area, we selected Nova Gold andiShares Silver. The strategy fit most of these and our investments are detailed in section III.c.
Strategy EffectivenessAs outlined by the overall performance described above, our strategy was very effective.
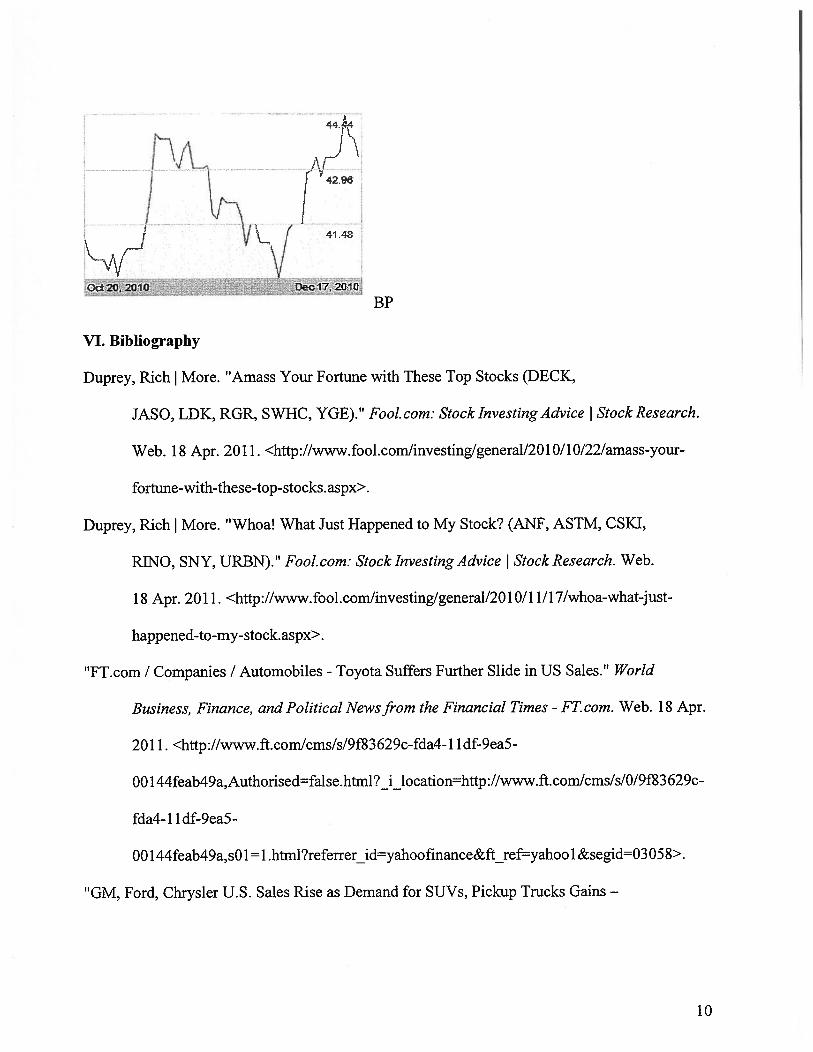
The top three stocks that helped our team gain the most profit were Decker’s OutdoorCorporation, Nova Gold, and Lululemon. Decker experienced a gain of $14,098; Nova Goldgained $7,902; and Lululemon gained $5,447. The three lowest performing stocks that hurt ourportfolio the most were BP Oil, Ford Motor Company, and Urban Outfitters. BP Oil lost $1,961;Ford lost $1,578; and Urban Outfitters lost $962.
Proposed Changes in Strategy in the FutureWhile the losses on our underperforming stocks were fairly small, there is much we
learned for the future. We learned about the need to be more patient and the importance oftiming. We learned not to overreact to news and that some events such as the adverse impact ofthe BP oil spill could take years for a recovery.
1

II. Analysis of Portfolio Performance
Our portfolio generated a total return of 26% and increased to $125,506 by the end of the
game. This is a 135% annualized return, and a 102% better than the 12.5% return of the S & P
500 during that same period. These results are net of $20,600 in brokerage commissions.
To ensure diversification, we invested in 19 different companies. We were able to
achieve significant gains from our top performers while experiencing very modest losses from
our worst performers.
The top three performing stocks were Decker’s Outdoor Corporation, Nova Gold, and
Lululemon. Decker experienced a gain of $14,098; Nova Gold gained $7,902; and Lululemon
gained $5,447.
Our three lowest performing stocks were BP Oil, Ford Motor Company, and Urban
Outfitters. BP Oil lost $1,961; Ford lost $1,578; and Urban Outfitters lost $962.
Because we were bullish on the market during this period, our 19 investments were all
long positions, and we did not short any investments. We did purchase some stocks on margin to
increase our potential returns.
III. Rationale
a. Explanation of Research Conducted Prior to Selection of Stocks or Funds
Through our research, we believed that larger companies would be a better investment
choice than smaller companies. Larger companies tend to outperform smaller companies in
uncertain markets. Also, larger companies tend to be more stable and resilient. These
companies have vast experience dealing with problems, and this has taught them how to
overcome challenges. A company’s long history as a publicly-owned company also indicates its
ability to satisfy investors.
2
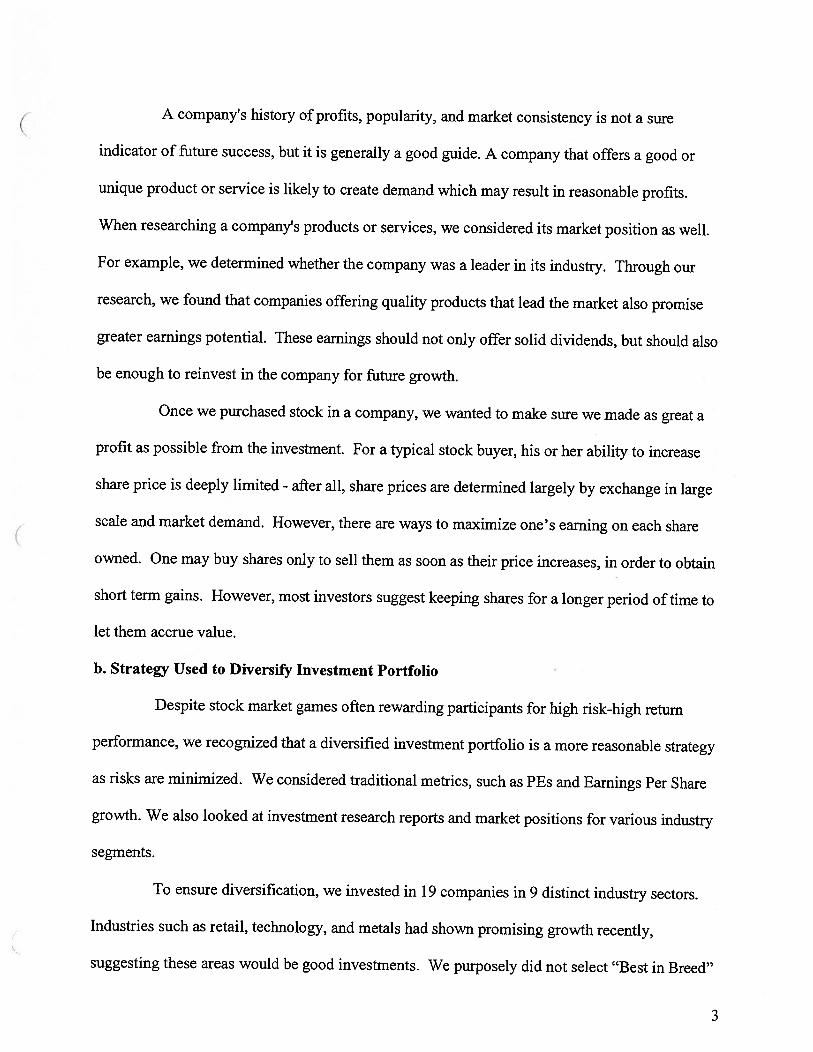
A company’s history of profits, popularity, and market consistency is not a sure
indicator of future success, but it is generally a good guide. A company that offers a good or
unique product or service is likely to create demand which may result in reasonable profits.
When researching a company’s products or services, we considered its market position as well.
For example, we determined whether the company was a leader in its industry. Through our
research, we found that companies offering quality products that lead the market also promise
greater earnings potential. These earnings should not only offer solid dividends, but should also
be enough to reinvest in the company for future growth.
Once we purchased stock in a company, we wanted to make sure we made as great a
profit as possible from the investment. For a typical stock buyer, his or her ability to increase
share price is deeply limited - after all, share prices are determined largely by exchange in large
scale and market demand. However, there are ways to maximize one’s earning on each share
owned. One may buy shares only to sell them as soon as their price increases, in order to obtain
short term gains. However, most investors suggest keeping shares for a longer period of time to
let them accrue value.
b. Strategy Used to Diversify Investment Portfolio
Despite stock market games often rewarding participants for high risk-high return
performance, we recognized that a diversified investment portfolio is a more reasonable strategy
as risks are minimized. We considered traditional metrics, such as PEs and Earnings Per Share
growth. We also looked at investment research reports and market positions for various industry
segments.
To ensure diversification, we invested in 19 companies in 9 distinct industry sectors.
Industries such as retail, technology, and metals had shown promising growth recently,
suggesting these areas would be good investments. We purposely did not select “Best in Breed”

companies because we wanted stocks with less visibility in the market place. We did not
purchase any mutual funds or exchange traded funds, as we could achieve sufficient
diversification from the 19 companies in 9 industries.
Finally, we sometimes followed a modified Dollar Cost Averaging Approach as we
purchased additional shares of stocks already in our portfolio. We say modified because we
largely did it for the better performers in our portfolio, rather than all stocks in our portfolio.
c. Description of How Stocks and/or Funds Fit Strategy
Technology Oracle Research in Motion Cisco Verizon
Retail Deckers Lululemon Urban Outfitters
Financial Services Bank of America Lazard
Metals Novagold ishares Silver
Healthcare Skilled Healthcare Group Delcath Stems
Entertainment MGM Resorts International
Communications ArItron
International Borun Corporation
Automotive Ford
Oil British Petroleum
Transportation Drhip Incorporated
We expected that the retail category would show the most promise. Our top choices were
Decker’s, Lululemon and Urban Outfitters. Generally, the October to January time period is the
busiest times for retailers, which inspired us to look for popular retailers which were doing very
well. We considered their fundamentals such as the company products, markets, etc as well as
did a technical analysis.
By looking at Decker’s Outdoor Corporation’s (DECK) traditional metrics, such as PEs
and Earnings Per Share growth, Decker fit our strategy because it has more than 30% annual
EPS growth since 2000 and annual book value per share growth of 21% for the same period. In
2008 and 2009, their EPS increased 58% in each year. Moreover, the stock traded at a modest
P/E of 20.6. All of this information led us to choose Decker’s because it is beneficial to have a
high EPS and a low PE.
4
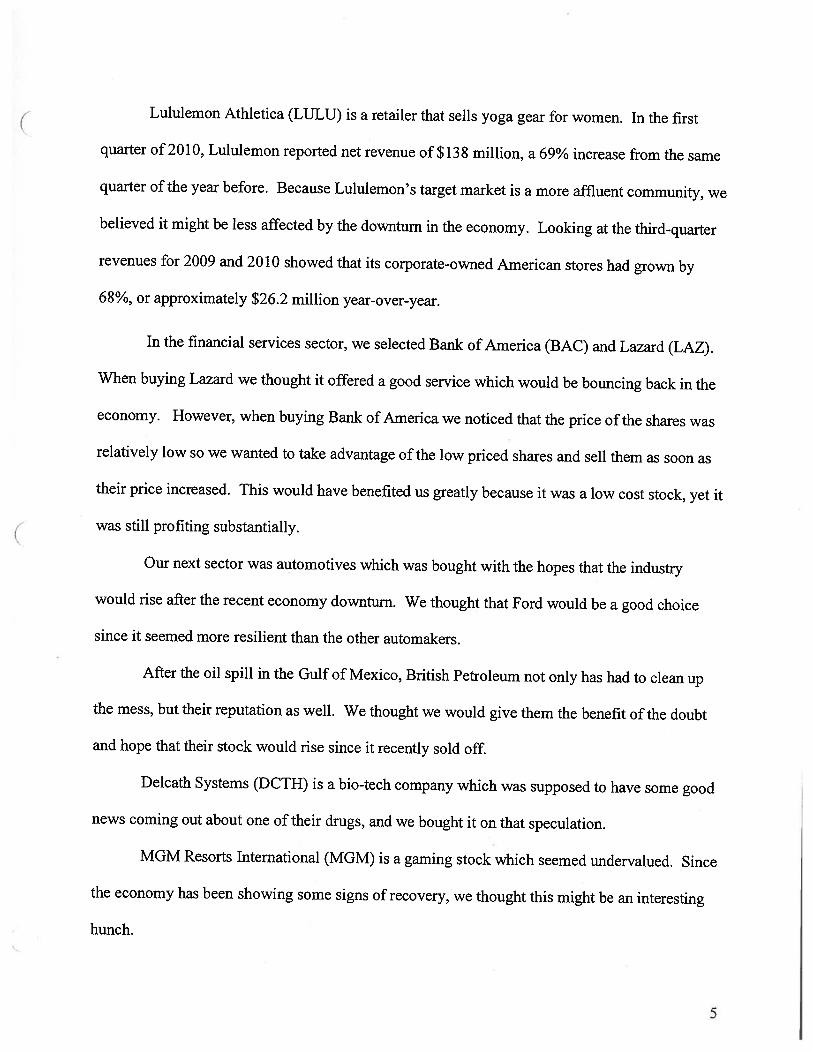
Lululemon Athietica (LULU) is a retailer that sells yoga gear for women. In the first
quarter of 2010, Lululemon reported net revenue of $138 million, a 69% increase from the same
quarter of the year before. Because Lululemon’s target market is a more affluent community, we
believed it might be less affected by the downturn in the economy. Looking at the third-quarter
revenues for 2009 and 2010 showed that its corporate-owned American stores had grown by
68%, or approximately $26.2 million year-over-year.
In the financial services sector, we selected Bank of America (BAC) and Lazard (LAZ).
When buying Lazard we thought it offered a good service which would be bouncing back in the
economy. However, when buying Bank of America we noticed that the price of the shares was
relatively low so we wanted to take advantage of the low priced shares and sell them as soon as
their price increased. This would have benefited us greatly because it was a low cost stock, yet it
was still profiting substantially.
Our next sector was automotives which was bought with the hopes that the industry
would rise after the recent economy downturn. We thought that Ford would be a good choice
since it seemed more resilient than the other automakers.
After the oil spill in the Gulf of Mexico, British Petroleum not only has had to clean up
the mess, but their reputation as well. We thought we would give them the benefit of the doubt
and hope that their stock would rise since it recently sold off.
Delcath Systems (DCTH) is a bio-tech company which was supposed to have some good
news coming out about one of their drugs, and we bought it on that speculation.
MGM Resorts International (MGM) is a gaming stock which seemed undervalued. Since
the economy has been showing some signs of recovery, we thought this might be an interesting
hunch.
5

NovaGold (Ng) is a pure play on gold. Gold was breaking new highs and records
everyday during the end of October to the beginning of November. The pricing went from $9.21
to over $15.00 in two weeks.
Verizon (VZ) is a telecommunication company which had very big news about its deal
with Apple to release the first iPhone with Verizon network. This new product was definitely
going to create a high demand for not only the product but the service as well.
IV. Conclusions and Findings
a. Explanation of Strategy Effectiveness
Although the market went up 12.5% during the game, our portfolio increased by 26%.
This is a 135% annualized rate of return. Our strategy was extremely effective and was driven
by outstanding performance by three of our 19 stock picks (i.e. Decker’s Outdoor Corporation,
Lululemon, and Nova Gold).
During the course of the game, Decker’s Outdoor Corporation had a net gain of $14,098,
making this our most successful stock pick. We first purchased Deck on November 10, 2010 and
then completely sold by December l6. Rich Duprey, a writer for the online articles in The
Motley Fool, noted that for the holiday season Decker’s was a perfect stock to buy. Though the
Decker’s company creates most of its profits from solely its one famous product, the Ugg boot,
playing a retail comeback during the holiday season was also a promising opportunity.
Furthermore, during the past it has shown great performance and growth.
Lululemon was able to outperform other competitors in the market for various reasons.
One major reason is Oprah’s influential endorsement on her show when she discussed the
company’s $98 relaxed fit pants on her annual “Favorite Things” episode. This show aired on
November 26th, shortly after our stock was purchased on November 19t1, 22nd and 231(1.
Furthermore, the Lululemon stock was profitable because even though the product is more
6
expensive than competitors and the economy is sputtering, consumers still high brand loyalty to
the company. Finally, more than 9 million shares of Lululemon were sold short before Nov. 15,
which is a big amount of short interest being bet against a very low amount of total shares
available for trading. This type of situation can produce very big returns if a massive short
squeeze does develop, since the supply and demand is so tight.
Our third most successful stock, Nova Gold, was able to do well in the market due to
political influences. The prices of Gold started to boom in November, which is around the time
that we first purchased the stock on October 2O’. Andrea Tse, from The Street Online website
on finances, explained:
“this was caused as a reflection of the extensive monetary policy coming from the FederalReserve. Until the U.S. starts taking austerity steps to bolster the value of the dollar, this trend ofthe rising gold prices on because of the weakening dollar will continue.”
Therefore, when the Republicans won back the house in this past November, they proved
to be immense supporters of the gold. This contributed to a devaluation of the dollar, which lead
to a bullish market for gold.
b. Proposed Changes in Strategy for Future Investments
Although our performance was extremely successful, our underperforming stocks
provided some useful insights and lessons learned about potential adjustments to our strategy in
the future. Interestingly, much of what we learned was about the importance of marketing
timing and patience. Let’s examine three specific examples: BP Oil, Ford, and Urban Outfitters.
BP Oil was our largest underperformer with a loss of $1,960. When we invested in BP
we thought the stock was ready for a comeback as the situation had stabilized. However, we
learned that it would take much more time for the stock to bounce back.
When investing in Ford Motor Company, we learned that we should have been more
patient with the stock. With Ford, as soon as we started to lose money we sold the stock. Our
7
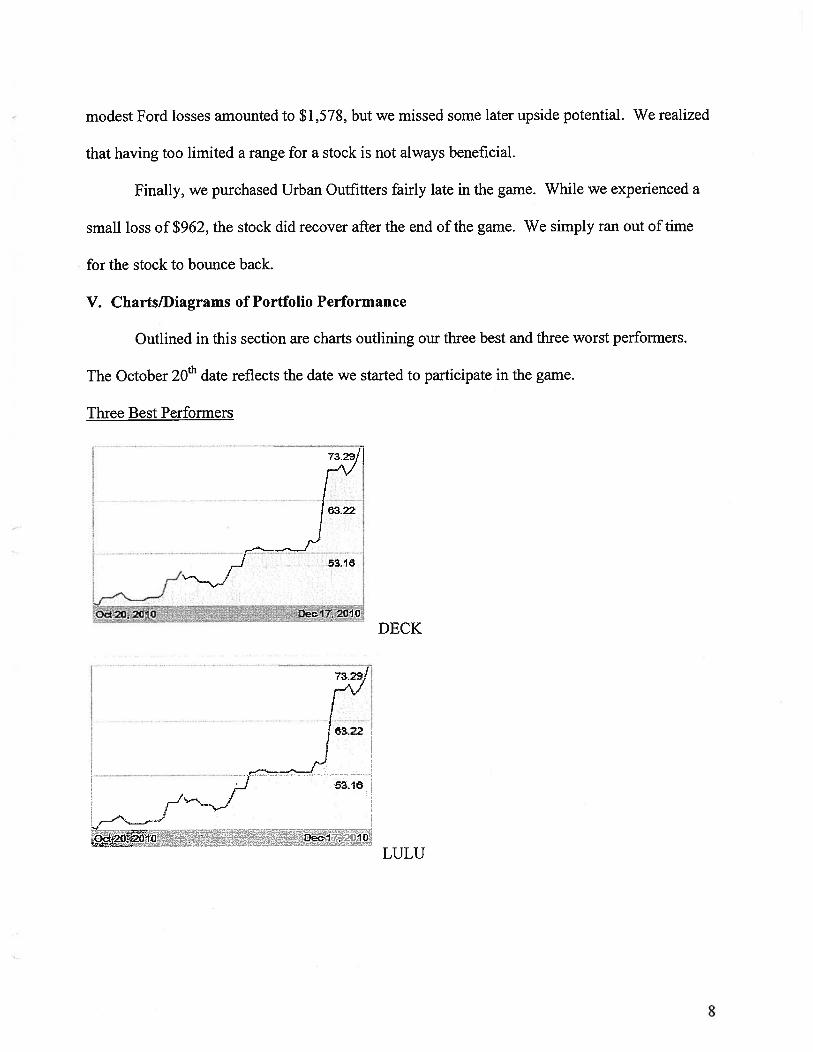
modest Ford losses amounted to $1,578, but we missed some later upside potential. We realized
that having too limited a range for a stock is not always beneficial.
Finally, we purchased Urban Outfitters fairly late in the game. While we experienced a
small loss of $962, the stock did recover after the end of the game. We simply ran out of time
for the stock to bounce back.
V. Charts/Diagrams of Portfolio Performance
Outlined in this section are charts outlining our three best and three worst performers.
The October 2O1 date reflects the date we started to participate in the game.
Three Best Performers
I _fj632218
DECK
7a2J
az2
i—I 53.18/__J
O2 2O1C Dec17 2010
LULU
8

NG
Three Worst Performers
URBAN OUTFITTERS
r1 335
1•FORD
9
n
/ v _
BP
VI. Bibliography
Duprey, Rich I More. “Amass Your Fortune with These Top Stocks (DECK,
JASO, LDK, RGR, SWHC, YGE).” Fool. corn: Stock Investing Advice Stock Research.
Web. 18 Apr. 2011. <http://www.fool.comlinvestinglgeneral/20 10/1 0/22/amass-your-
fortune-with-these-top-stocks.aspx>.
Duprey, Rich More. “Whoa! What Just Happened to My Stock? (ANF, ASTM, CSKI,
RTNO, SNY, URBN).” Fool.corn: Stock Investing Advice I Stock Research. Web.
18 Apr. 2011. <http://www.foo1.com/investing/genera1/2010/11 / 17/whoa-what-just-
happened-to-my-stock.aspx>.
“FT.com / Companies / Automobiles - Toyota Suffers Further Slide in US Sales.” World
Business, Finance, and Political Newsfrom the Financial Times - FT corn. Web. 18 Apr.
2011. <http ://www.ft.comlcms/s/9f83 629c-fda4- 11 df-9ea5 -
001 44feab49a,Authorised=false.html?ilocation=http ://www.ft.cornlcms/s/0/9f83 629c-
fda4-1 ldf-9ea5-
001 44feab49a,sO 1 = 1 .html?referrer_id=yahoofinance&ft ref=yahoo 1 &segid03 058>.
“GM, Ford, Chrysler U.S. Sales Rise as Demand for SUVs, Pickup Trucks Gains —
10
Bloomberg.” Bloomberg - Business & Financial News, Breaking News Headlines. Web.
18 Apr. 2011. <http://www.b1oomberg.com/news/20 10-12-01 1gm-s-u-s-sales-in-
november-climbed-il -boosted-by-equinox-terrain-suvs.html?cmpid=yhoo>.
Investing, Stock Quotes and Research, Personal Finance and Business News —
InvestorGuide. corn. Web. 18 Apr. 2011. <http://www.investorguide.comlstock-news
show.php?storyid=3 7174430>.
Pedone, Roberto. “3 Earnings Short-Squeeze Stocks - The Street.1’Stock Market Today —
Financial News, Quotes andAnalysis - The Street. 01 Dec. 2010. Web. 18 Apr.2011.
<http:Ilwww.thestreet.comlstory/10935600/3/3 -earnings-short-squeeze-stocks .html>.
Tse, Andrea. ‘Gold Prices Pop on Election-Eve Jitters - The Street.” Stock Market Today
— Financial News, Quotes and Analysis - The Street. 02 Nov. 2010. Web. 18 Apr. 2011.
<http ://www.thestreet. cornlstory/1 0908271/1/gold-prices-pop-on-election-
enthusiasm.html>.
11


STOCK MARKET GAME
Free State DECA
Lawrence Free State High School
4700 Overland Drive
Lawrence, Kansas, 66049
Rachel Harkin
April 13, 2011

Table of Contents
I. Executive Summary 1
II. Analysis of Portfolio Performance 2
Ill. Rationale 3
A. Explanation of research conducted prior to selection 3-4
of stocks and/or fundsB. Strategy used to diversify investment portfolio 4
C. Description of how selected stocks and/or funds 4-5
fit strategy
IV. Conclusions and Findings 5
A. Explanation of strategy effectiveness 5
B. Proposed changes in strategy for future investments 5-6
V. Charts/Diagrams of portfolio performance 6-7
VI. Bibliography 8

I. Executive Summary
Upon first hearing my teacher talk about the Stock Market Game, I didn’t really take it too
seriously. I thought that there was no way a sixteen year old high school student could wisely
invest in stocks that would actually do well without luck being involved. It then struck me, that
while luck is a part of it, doing some research and careful analysis can greatly increase your
chances. No one can actually master the stock market and predict dead on trends. It’s
something that will fluctuate no matter what.
Our task was to strategize a plan to invest in stocks over a four month period that would
produce the highest return, while at the same time minimize our losses. We were given
$100,000 to start with, and were given the choice to buy on margin. I decided to take the risk,
and margin 100%. Although the risks were great in doing so, I felt like since this is a simulation,(
that I could test the waters this way instead of in the actual Stock Market. This gave me a
starting total of $200,000 to invest.
One thing my teacher told the class as we started choosing stocks to invest in, really hit
home with me, and that was to invest in things that we know, and businesses that we like.
After that, I decided to use that strategy and do some research to see what stocks seemed to
be going up, and to think of things that teenagers like. I had to take into account though that if I
picked a broad range of stocks to invest in, some of them would ultimately lead to losses.
During my research, I examined pricing trends and P/E ratios to confirm my stock
selections. I was able to grow the value of my account to $130,000 by the end of the game.
1

II. Analysis of Portfolio Performance
No. of Purchase Purchase Purchase SellingCompany Symbol Shares Date Price Amount Date Sold Price Amount Gain
ppIe AAPL 200 9/8/2010 262.92 52,584 12/17/2010 320.61 64,122 11,538
kami Tech AKAM 250 9/8/2010 50.51 12,628 10/6/2010 44.25 11,063 (1,565)
3ank ofmer BAC 700 9/8/2010 13.37 9,359 10/18/2010 12.34 8,638 (721)
-lershey HSY 100 9/8/2010 46.43 4,643 10/18/2010 51.33 5,133 490
\Iike NKE 650 9/8/2010 74.14 48,191 12/17/2010 90.05 58,533 10,342
ed Hat RHT 350 9/8/2010 37.08 12,978 12/17/2010 47.83 16,741 3,763
S -ker SJM 500 9/8/2010 60.61 30,305 10/18/2010 63.11 31,555 1,250
ymoenetics ZGEN 1000 9/8/2010 9.76 9,760 10/26/2010 9.75 9,750 (10)
Dhipotle CMG 250 10/18/2010 183.69 45,923 12/17/2010 238.02 59,505 13,583
Nalmart WMT 200 11/5/2010 55.20 11,040 12/17/2010 54.41 10,882 (158)
SPDR Gold GLD 150 11/5/2010 136.38 20,457 12/17/2010 134.2 20,130 (327)
\Jicor, Inc GAS 100 11/5/2010 47.43 4,743 12/17/2010 49.67 4,967 224
ommissions Paid (6,878)
\let Interest Expense (1,490)
ncrease in Account Value 30,040
2

Ill. Rationale
A. Explanation of research conducted prior to selection of stocks and/or funds
Before choosing my stocks I started out by doing some thinking about what
exactly I wanted to use as my main area of focus. I ended up choosing to use
teenagers as my main demographic focus, because being a teenager myself I
decided I would just choose stocks based on things that I know are popular to young
adults as well as being able to pick stocks that I know something about. I started by
focusing on one of the main things that I know teenagers love, food. Being from a
college town, restaurants here either make it or break it, and one of the most
popular restaurants in town is Chipotle. Every time I go in to one of the two
locations here, there is a line out the door. After looking over the Chipotle Facebook
page I learned that they were planning on expanding and adding hundreds of
locations all over America. The next area that I focused on was technology, and one
of the biggest and most well-known companies of all is Apple. Many of my friends
c have iPhones, and I have noticed that their middle aged parents are starting to carry
them as well. Apple has also just had success with the iPad, and it seems like they
are just an unstoppable powerhouse when it comes to the latest in technology. The
next area I focused on was athletic apparel. Teenagers are often involved in a variety
of sports, and they need a reliable well known company to depend on. Nike is one of
the biggest athletic apparel companies out there, and caters to many different
sports. With the holiday season approaching I believed that sales would increase. By
3

having a wide range of stocks picked, I knew that the risks I was taking were
inevitably going to lead in some losses, but would overall generate bigger gains. I
also used stock price trends to confirm my selections as I went along.
B. Strategy used to diversify investment portfolio
To diversify my portfolio I focused on all aspects of the teenage life when picking
stocks: like food, technology, and athletic apparel and I used reliable, well-known
companies. This gave me exposure to three sectors of the economy. I researched my
stocks before choosing them, and tried to stick with companies that I know to limit
my risks, while still leaving an opportunity to maximize my profits.
C. Description of how selected stocks and/or funds fit strategy
Although I picked a wide variety of different stocks, they all have one common
bond, and that’s that they fit into the lifestyle of a teenager. There were a couple
that I picked like the Bank of America, that in the long run didn’t do well for me, but
I picked it because it was something I know. I have heard of the Bank of America all
my life, and although this specific stock didn’t increase profits for me, it was part of
my plan that did turn out to maximize my profits.
Two of my main areas of focus were technology and the food industry. Apple
brought in a steady profit, due to the ever increasing technology, and how teenagers
are becoming so reliant on it. The food industry on the other hand is continuously
the same when it comes to teenagers. Chipotle is a fast and on the go restaurant
4
that uses natural food products, and promotes good eating habits. Along with my
other stocks, these two come together and share similarities in the fact that they are
popular with the teenage demographics.
IV. Conclusions and Findings
A. Explanation of strategy effectiveness
After the project ended I gathered together my stocks and looked over
how effectively my plan worked. I noticed that in the beginning I made a couple
mistakes by straying away from my plan and investing in a couple of companies
that I thought were going to do well, but honestly were off strategy. Other than
that, my plan overall worked out better than I had expected. By following the
simple rule of just picking stocks that I know and like I was able to gain a return.
B. Proposed changes in strategy for future investments
In future investments, I plan on changing a couple of things that would
really improve my overall strategy. First I would do more research from the start
just to see what companies are doing well at the time. I made this mistake with
Bank of America, because I did not realize the troubles that they were going
through. I would also follow my strategy of investing in companies I know and
not just pick stocks at random that looked like they were doing well on a chart. I
would make a plan of action from the start and follow it accordingly. I also
5

realize that in real life it would not be prudent to invest with 100% margin, but in
this simulation, it worked out to my advantage.
V. Charts/Diagrams of portfolio performances
—-——.-.---,------,.-——----..-.--..----—-——-——........—.-.-...----.-..-....,-
- —30
10
)(
Starting Price: $74.14 Ending Price: $90.05 Percent Gain: 21.6%
NKE (Nike Inc.) NYSE17-0 eo-20 10
RSI(14) 71.26
- .
-
.Opcn 89.05 High 90.03 Low 88.Q7 Close 89 73 Volume 2.QM Chg+0.82c+O.92%)
Q NKE (Daily) 89.73—MA(SO) 8368—r1A(2UO) 7S.37ThVIria 2234S26
go
7126
41±It’4I?
83
82
81
80
79
7810.0 M
75M
5.OM ..37
25M
13 20 27 Oct 11 18 25 Nov 8 15 22 2gDec 8 13
—MACD(12,26,9) 1.700, 1.599, .C1 20
13 - 20 - 27 Oct 11 18 25 Now 8 15 22 290ec 6 13
6

0-
U
-
±
0-
4,4
‘pCLOrJCD
(3L)
I—Di
03mr’Ja)L)4—
-zuJ
0Nr03ci)4—c4.-
CD.4
-,
10
oC
o[-4
)
*4)4,
H
!H
‘>
10
-=
o—
o-
-0
3
t?i\
2
0--I0-
2Il
‘P0CD
(34-.
ci)Li
4.-
ci)
LDr’ici)4-)4.-
4a0
uJ
r.J
ccci)1)
.4.-
0bD
4-.
CD4-,
N

VI. Bibliography
• -Stockcharts.com
• -Yahoo Finance
• -StockMarketGame.org
• -Google Finance
8