i | u s c i c u › content › dam › site › global › ... · 7kh glylghqg iruhfdvw iru wkh...
TRANSCRIPT
1
FY20 Financial Results
Honda Motor Co., Ltd.May 12, 2020
Accord(Japan)
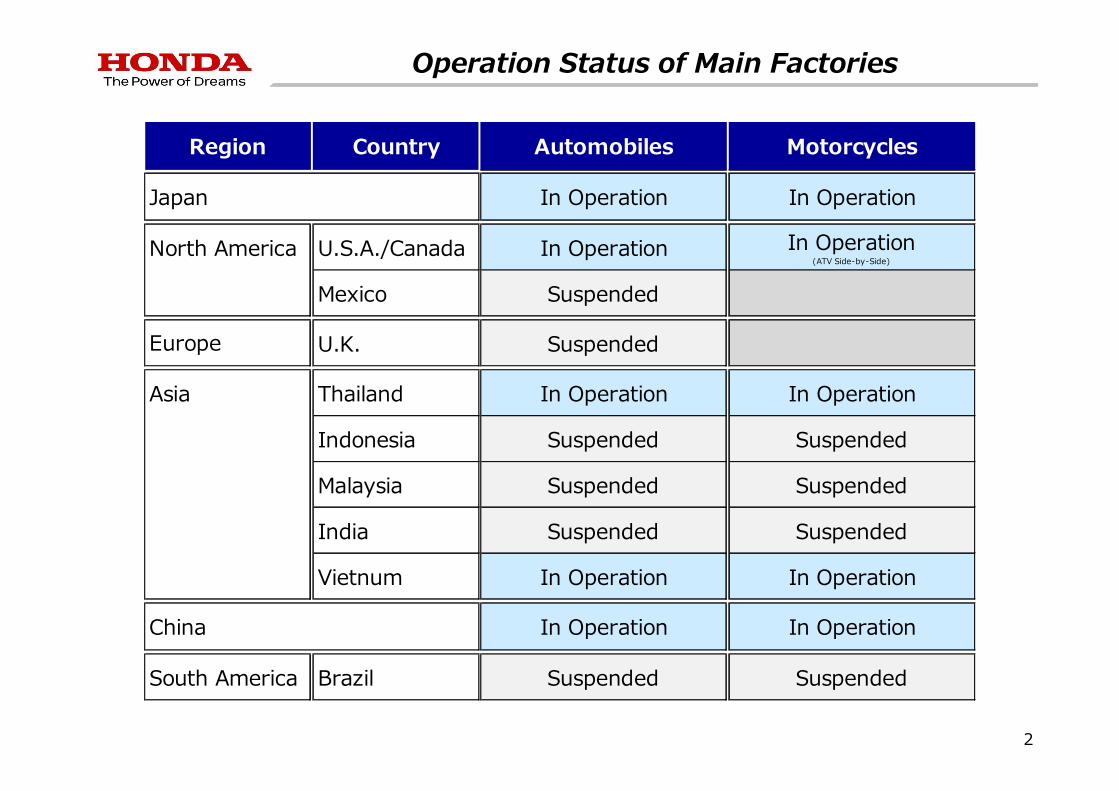
Operation Status of Main Factories
2
Region Country Automobiles
In Operation In Operation
North America U.S.A./Canada In Operation In Operation(ATV Side-by-Side)
Mexico Suspended
U.K. Suspended
Asia Thailand In Operation In Operation
Indonesia Suspended Suspended
Malaysia Suspended Suspended
India Suspended Suspended
Vietnum In Operation In Operation
In Operation In Operation
South America Brazil Suspended Suspended
China
Motorcycles
Japan
Europe
Contents
• Outline of FY20 Financial Results
• FY20 Financial Results
3

Unit (thousand)
Motorcycles Automobiles Life Creation
FY19 FY20 Change FY19 FY20 Change FY19 FY20 Change
Japan 207 205 - 2 719 672 - 47 336 312 - 24
NorthAmerica
301 330 + 29 1,954 1,825 - 129 3,049 2,848 - 201
Europe 249 239 - 10 169 133 - 36 984 845 - 139
Asia 18,224 17,262 - 962 2,233 1,952 - 281 1,559 1,375 - 184
OtherRegions
1,257 1,304 + 47 248 208 - 40 373 321 - 52
Total 20,238 19,340 - 898 5,323 4,790 - 533 6,301 5,701 - 600
Change(%) - 4.4% - 10.0% - 9.5%
*
* - 110 thousand in China are included
Honda Group Unit Sales <FY20 Twelve Months>
4
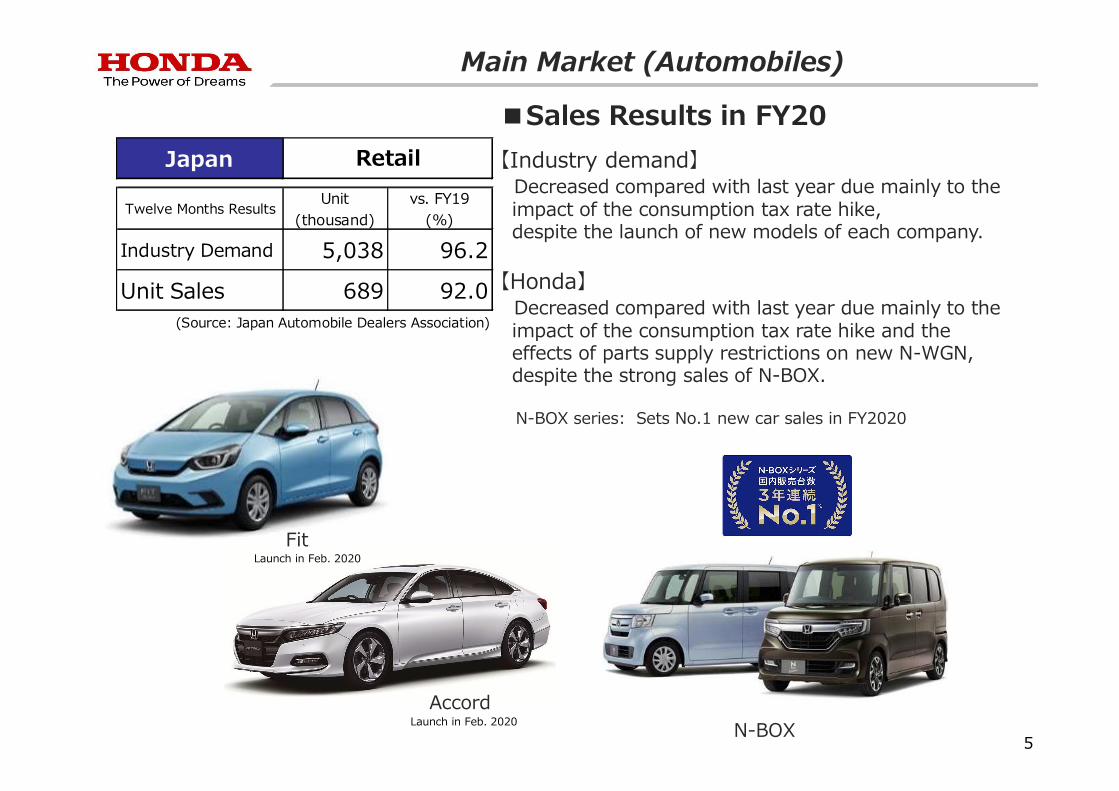
Japan
Twelve Months ResultsUnit
(thousand)vs. FY19
(%)
Industry Demand 5,038 96.2
Unit Sales 689 92.0(Source: Japan Automobile Dealers Association)
Retail
■Sales Results in FY20
【Industry demand】Decreased compared with last year due mainly to the impact of the consumption tax rate hike, despite the launch of new models of each company.
【Honda】Decreased compared with last year due mainly to the impact of the consumption tax rate hike and the effects of parts supply restrictions on new N-WGN, despite the strong sales of N-BOX.
N-BOX series: Sets No.1 new car sales in FY2020
Main Market (Automobiles)
Fit
N-BOX
Launch in Feb. 2020
5
AccordLaunch in Feb. 2020

■Sales results in FY20
【Industry demand】Decreased compared with last year due to the COVID-19 effects. An increase in the light truck marketand a decline in the sedan market.
【Honda】Decreased compared with last year due to theslowdown in market despite of introducing Passport and increase sales in HR-V.
U.S.
Twelve Months ResultsUnit
(thousand)vs. FY19
(%)
Industry Demand 16,549 96.4
Unit Sales 1,537 95.4(Source: Autodata)
Retail
Main Market (Automobiles)
6
CR-V Hybrid
HR-V: Sets a new all-time monthly record with sales in February.
Realized as the most fuel-efficient, low CO2 emissions full-line automaker in The 2019 EPA Automotive Trends Report
HR-V
Passport
Launch in Mar. 2020
China
Twelve Months ResultsUnit
(thousand)vs. FY19
(%)
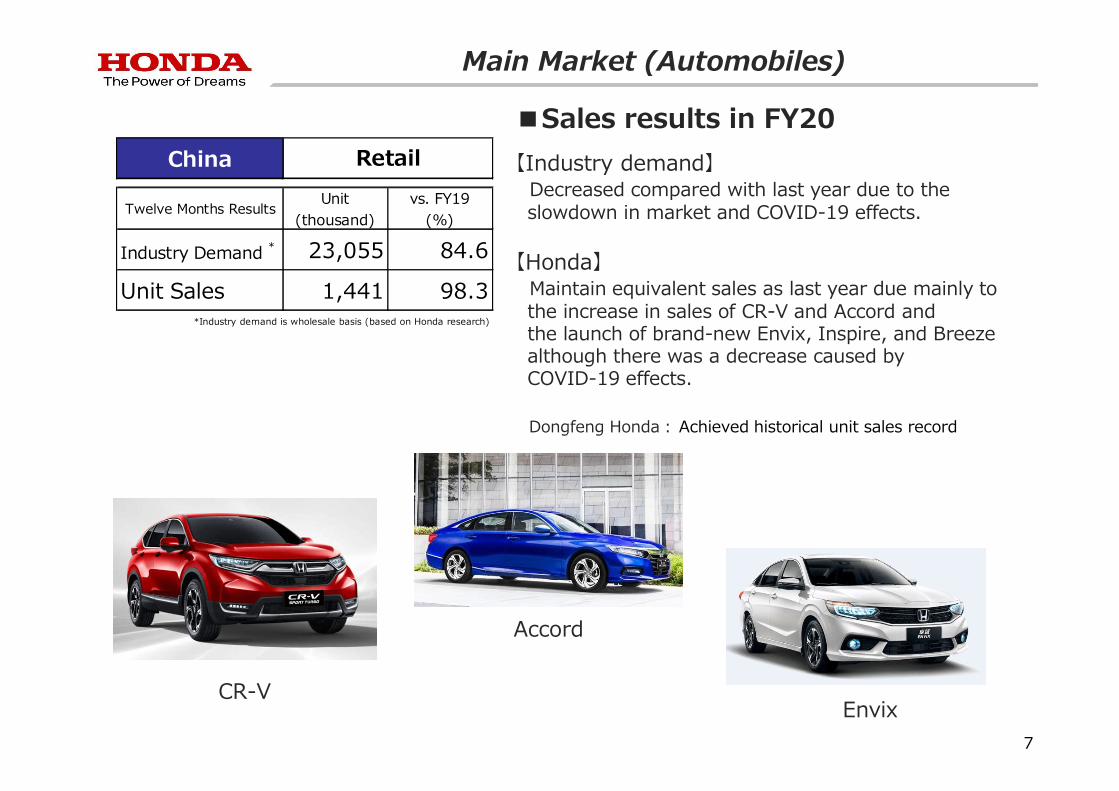
Industry Demand * 23,055 84.6
Unit Sales 1,441 98.3
Retail
*Industry demand is wholesale basis (based on Honda research)
■Sales results in FY20
【Industry demand】Decreased compared with last year due to the slowdown in market and COVID-19 effects.
【Honda】Maintain equivalent sales as last year due mainly to the increase in sales of CR-V and Accord and the launch of brand-new Envix, Inspire, and Breezealthough there was a decrease caused by COVID-19 effects.
Dongfeng Honda: Achieved historical unit sales record
Main Market (Automobiles)
CR-V
Accord
7
Envix
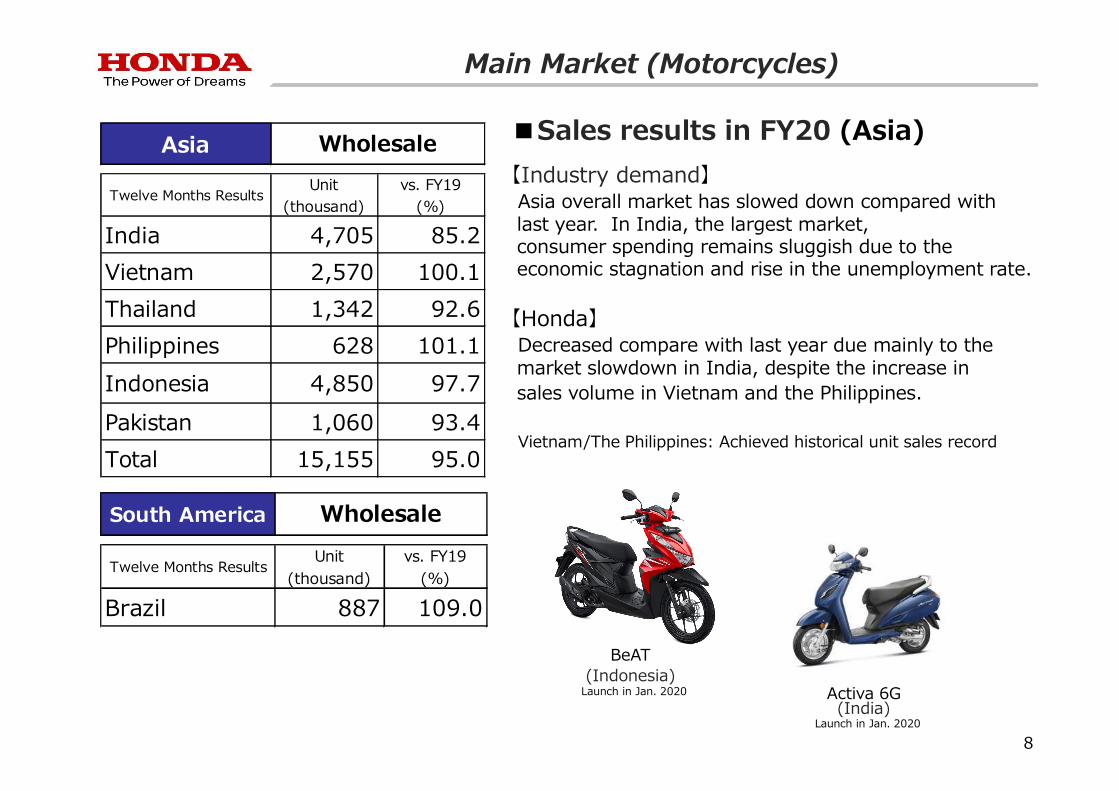
■Sales results in FY20 (Asia)
【Industry demand】Asia overall market has slowed down compared with last year. In India, the largest market, consumer spending remains sluggish due to the economic stagnation and rise in the unemployment rate.
【Honda】Decreased compare with last year due mainly to the market slowdown in India, despite the increase in sales volume in Vietnam and the Philippines.
Vietnam/The Philippines: Achieved historical unit sales record
Asia
Twelve Months ResultsUnit
(thousand)vs. FY19
(%)
India 4,705 85.2
Vietnam 2,570 100.1
Thailand 1,342 92.6
Philippines 628 101.1
Indonesia 4,850 97.7
Pakistan 1,060 93.4
Total 15,155 95.0
Wholesale
Main Market (Motorcycles)
BeAT(Indonesia)
Launch in Jan. 2020 Activa 6G (India)
Launch in Jan. 2020
South America
Twelve Months ResultsUnit
(thousand)vs. FY19
(%)
Brazil 887 109.0
Wholesale
8
FY19Results
FY20Results
Change
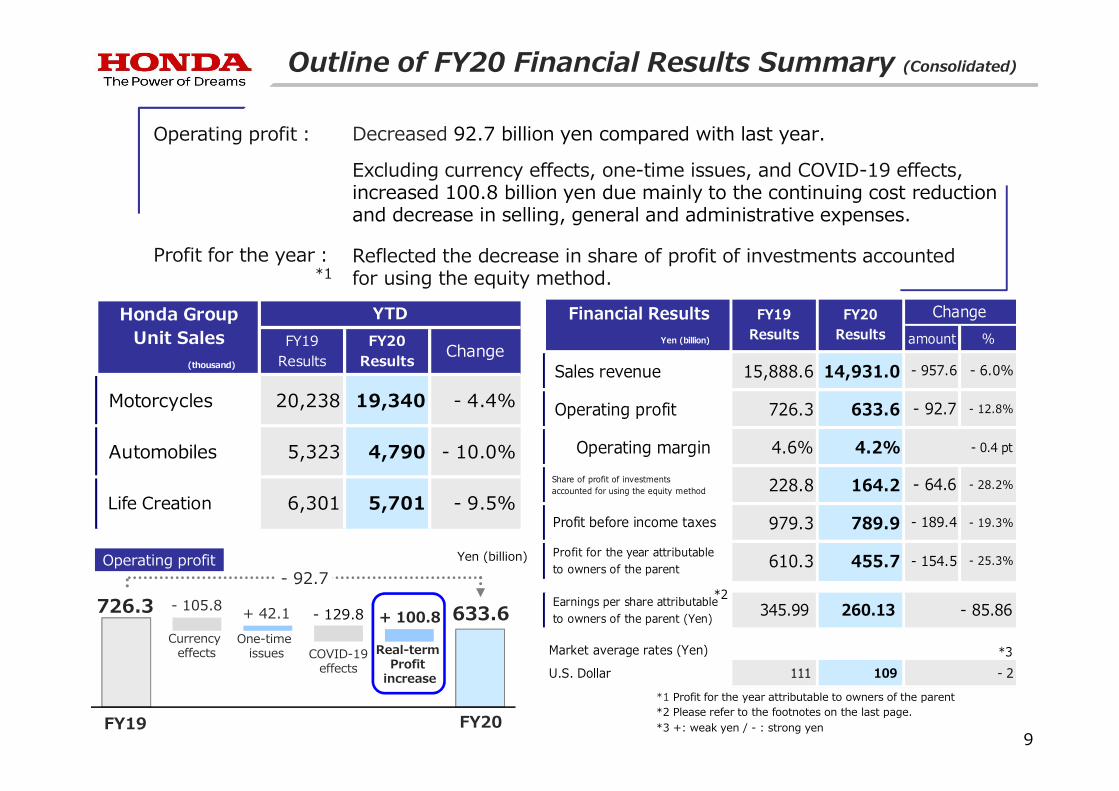
Motorcycles 20,238 19,340 - 4.4%
Automobiles 5,323 4,790 - 10.0%
Life Creation 6,301 5,701 - 9.5%
Honda GroupUnit Sales
(thousand)
YTDamount %
Sales revenue 15,888.6 14,931.0 - 957.6 - 6.0%
Operating profit 726.3 633.6 - 92.7 - 12.8%
Operating margin 4.6% 4.2% - 0.4 pt
Share of profit of investments accounted for using the equity method 228.8 164.2 - 64.6 - 28.2%
Profit before income taxes 979.3 789.9 - 189.4 - 19.3%
Profit for the year attributable to owners of the parent 610.3 455.7 - 154.5 - 25.3%
Earnings per share attributable to owners of the parent (Yen) 345.99 260.13
Market average rates (Yen)
U.S. Dollar 111 109
Financial Results Yen (billion)
Change
- 85.86
- 2
FY19Results
FY20Results
*2
*3
Excluding currency effects, one-time issues, and COVID-19 effects,increased 100.8 billion yen due mainly to the continuing cost reduction and decrease in selling, general and administrative expenses.
Profit for the year:*1
Reflected the decrease in share of profit of investments accountedfor using the equity method.
Outline of FY20 Financial Results Summary (Consolidated)
*1 Profit for the year attributable to owners of the parent*2 Please refer to the footnotes on the last page.*3 +: weak yen / - : strong yen
9
Decreased 92.7 billion yen compared with last year.Operating profit:
726.3 633.6
- 92.7
- 105.8- 129.8 + 100.8
Operating profit Yen (billion)
Currency effects Real-term
Profit increase
One-time issues COVID-19
effects
FY19 FY20
+ 42.1
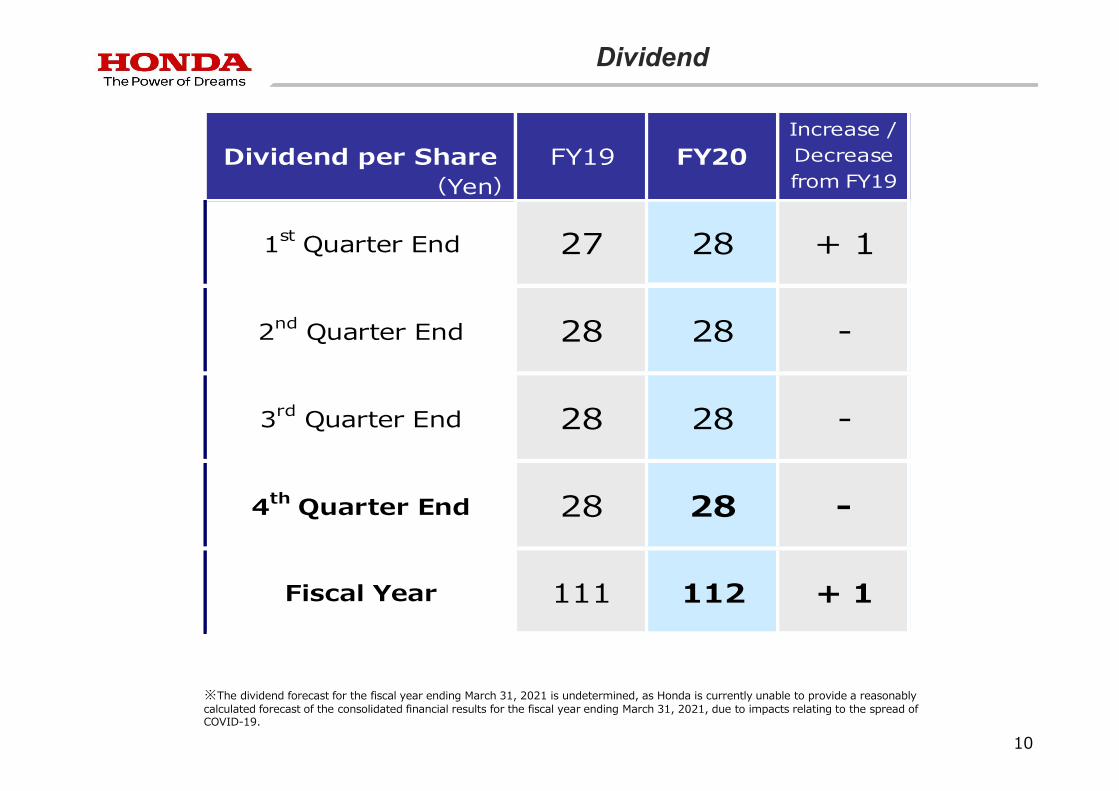
1st Quarter End 27 28 + 1
2nd Quarter End 28 28 -
3rd Quarter End 28 28 -
4th Quarter End 28 28 -
Fiscal Year 111 112 + 1
Dividend per Share FY19 FY20Increase /Decreasefrom FY19(Yen)
10
Dividend
※The dividend forecast for the fiscal year ending March 31, 2021 is undetermined, as Honda is currently unable to provide a reasonably calculated forecast of the consolidated financial results for the fiscal year ending March 31, 2021, due to impacts relating to the spread of COVID-19.

Contents
11
• Outline of FY20 Financial Results
• FY20 Financial Results

FY19 FY20 Change
Motorcycles 4,558 4,302 - 5.6%
Automobiles 1,364 981 - 28.1%
Life Creation 2,347 2,071 - 11.8%
Honda GroupUnit Sales
QTD
(thousand)
Decreased by 14.6%, to 3,458 billion from the same period last year, due mainly to decreased sales revenue in Automobile business which was partially offset by increased sales revenue in Financial services business operations.
Decreased by 47.9 billion, to -5.6 billion from the same period last year, due mainly to a decrease in profit attributable to decreased sales revenue and model mix, which was partially offset by the continuing cost reduction and decrease in selling, general and administrative expenses.
Decreased by 16.5 billion, to -29.5 billion from the same period last year, due to decreased in profit before income taxes.
FY20 4th Quarter Financial Results (Consolidated)
Decreased by 75.6%, to 14.4 billion from the same period last year, due mainly to a decrease in sales revenue and model mix in China.
Decreased unit sales in India, Indonesia, and Thailand despite the increase in Vietnam.
Decreased unit sales in China, the United States and India.
12
FY19 FY20 Change
Sales revenue 4,049.1 3,458.0 - 14.6%
Operating profit 42.3 - 5.6 - 47.9 bn.
Operating margin 1.0% - 0.2% - 1.2pt
Share of profit of investments accounted for using the equity method 59.1 14.4 - 75.6%
Profit before income taxes 111.1 3.7 - 96.6%
Profit for the period attributable to owners of the parent - 13.0 - 29.5 - 16.5 bn.
Earnings per share attributable to owners of the parent (Yen) - 7.40 - 17.01 - 9.61
Market average rates (Yen)
U.S. Dollar 110 109 - 1
Financial Results Yen (billion)
QTD
Motorcycles
Automobiles
Sales revenue
Operating profit
Share of profit of investments accounted for using the equity method
Profit for the period
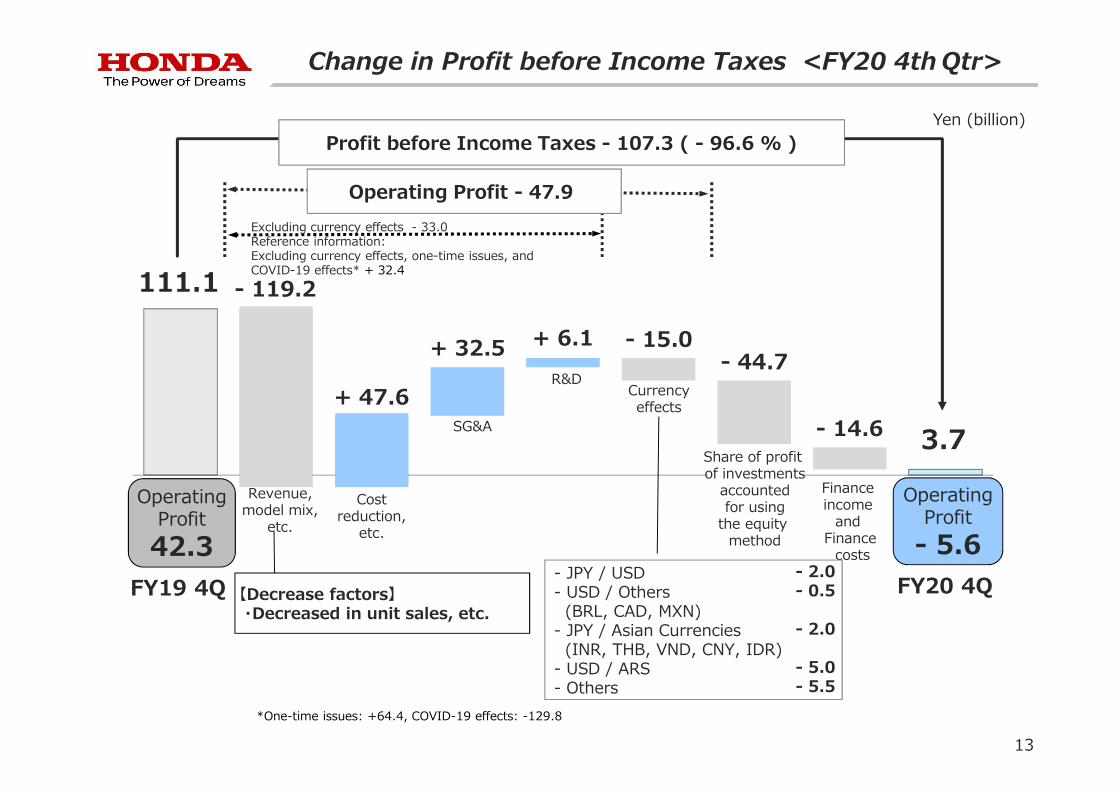
Change in Profit before Income Taxes <FY20 4th Qtr>
Profit before Income Taxes - 107.3 ( - 96.6 % )
Operating Profit - 47.9
Yen (billion)
FY19 4Q
OperatingProfit
42.3
OperatingProfit
- 5.6
Revenue,model mix,
etc.
R&D
Costreduction,
etc.
SG&A
Share of profit of investments
accountedfor using
the equity method
Finance income
and Finance
costs
Currencyeffects
FY20 4Q- JPY / USD- USD / Others
(BRL, CAD, MXN)- JPY / Asian Currencies
(INR, THB, VND, CNY, IDR)- USD / ARS- Others
- 2.0- 0.5
- 2.0
- 5.0- 5.5
111.1 - 119.2
+ 6.1
+ 47.6
+ 32.5
- 14.6
- 15.0
3.7
- 44.7
【Decrease factors】・Decreased in unit sales, etc.
13
Excluding currency effects - 33.0Reference information:Excluding currency effects, one-time issues, and COVID-19 effects* + 32.4
*One-time issues: +64.4, COVID-19 effects: -129.8
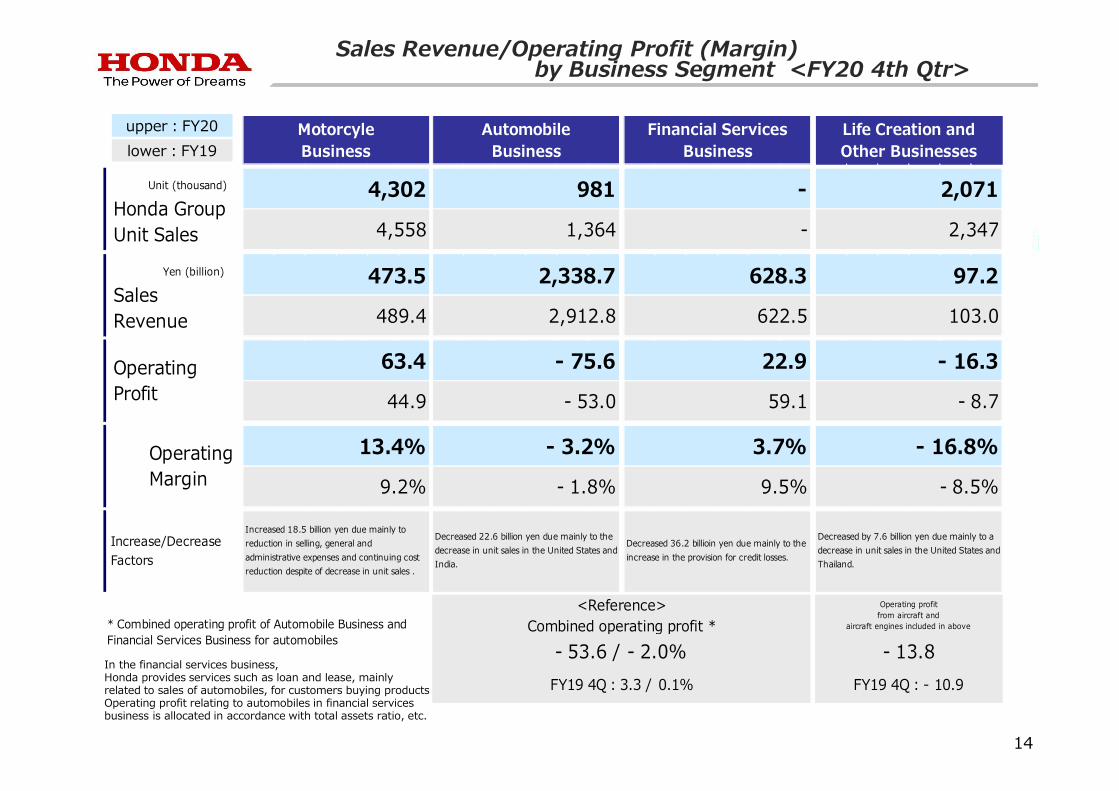
Sales Revenue/Operating Profit (Margin) by Business Segment <FY20 4th Qtr>
lower:FY19
upper:FY20
In the financial services business, Honda provides services such as loan and lease, mainly related to sales of automobiles, for customers buying products.Operating profit relating to automobiles in financial services business is allocated in accordance with total assets ratio, etc.
14
Increase/Decrease Factors
MotorcyleBusiness
AutomobileBusiness
Financial ServicesBusiness
Life Creation andOther Businesses
Unit (thousand)
Honda Group Unit Sales
4,302 981 - 2,071
4,558 1,364 - 2,347
Yen (billion)
Sales Revenue
473.5 2,338.7 628.3 97.2
489.4 2,912.8 622.5 103.0
Operating Profit
63.4 - 75.6 22.9 - 16.3
44.9 - 53.0 59.1 - 8.7
OperatingMargin
13.4% - 3.2% 3.7% - 16.8%
9.2% - 1.8% 9.5% - 8.5%
FY19 4Q:3.3 / 0.1% FY19 4Q:- 10.9
Increased 18.5 billion yen due mainly toreduction in selling, general andadministrative expenses and continuing costreduction despite of decrease in unit sales .
Decreased 22.6 billion yen due mainly to thedecrease in unit sales in the United States andIndia.
Decreased 36.2 billioin yen due mainly to theincrease in the provision for credit losses.
Decreased by 7.6 billion yen due mainly to adecrease in unit sales in the United States andThailand.
<Reference>Combined operating profit *
Operating profitfrom aircraft and
aircraft engines included in above* Combined operating profit of Automobile Business andFinancial Services Business for automobiles
- 13.8- 53.6 / - 2.0%
15
amount %
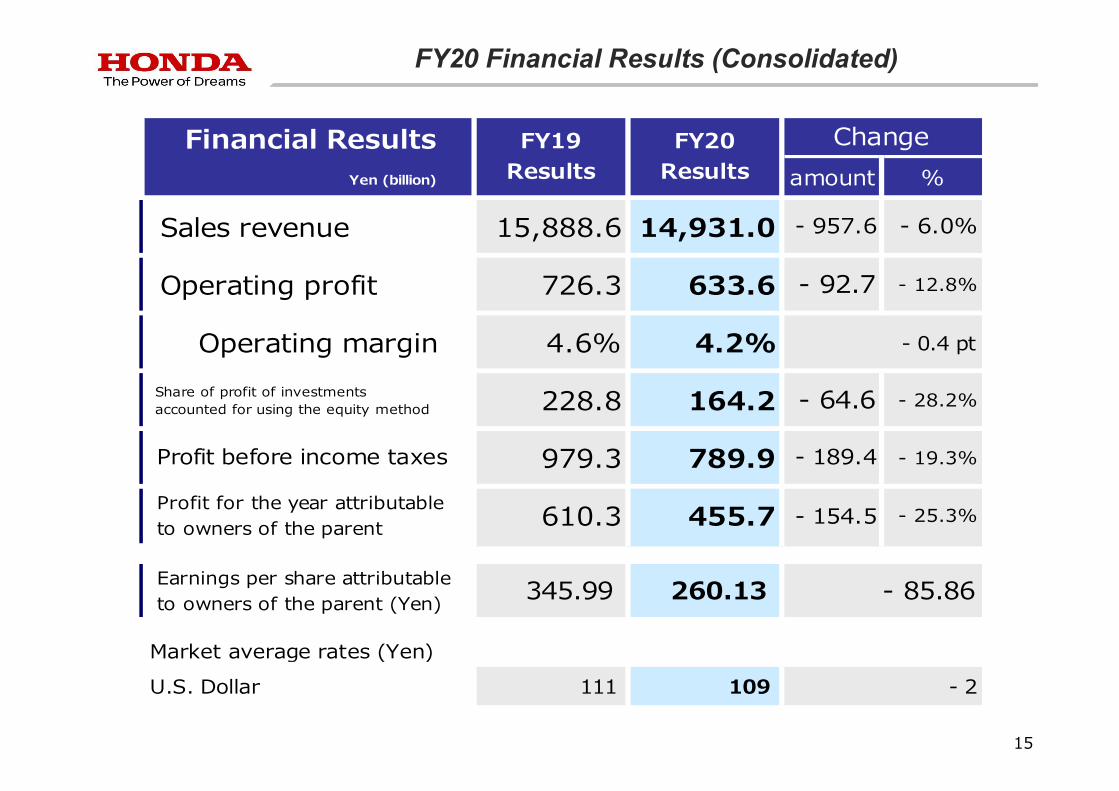
Sales revenue 15,888.6 14,931.0 - 957.6 - 6.0%
Operating profit 726.3 633.6 - 92.7 - 12.8%
Operating margin 4.6% 4.2% - 0.4 pt
Share of profit of investments accounted for using the equity method 228.8 164.2 - 64.6 - 28.2%
Profit before income taxes 979.3 789.9 - 189.4 - 19.3%
Profit for the year attributable to owners of the parent 610.3 455.7 - 154.5 - 25.3%
Earnings per share attributable to owners of the parent (Yen) 345.99 260.13
Market average rates (Yen)
U.S. Dollar 111 109
Financial Results Yen (billion)
Change
- 85.86
- 2
FY19Results
FY20Results
FY20 Financial Results (Consolidated)
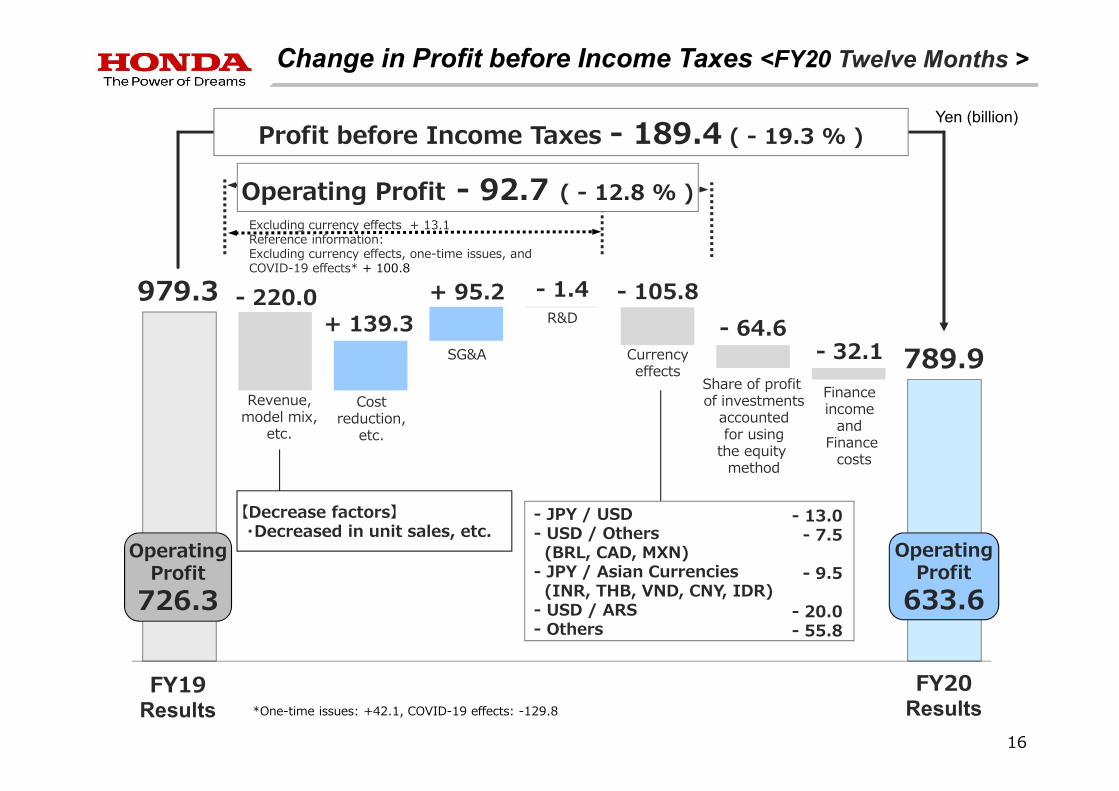
979.3 - 220.0 - 1.4
+ 139.3+ 95.2
- 32.1
- 105.8
- 64.6789.9
Profit before Income Taxes - 189.4 ( - 19.3 % )
Operating Profit - 92.7 ( - 12.8 % )
FY19Results
OperatingProfit
726.3
OperatingProfit
633.6
FY20Results
- JPY / USD- USD / Others
(BRL, CAD, MXN)- JPY / Asian Currencies
(INR, THB, VND, CNY, IDR)- USD / ARS- Others
- 13.0- 7.5
- 9.5
- 20.0- 55.8
Revenue,model mix,
etc.
R&D
Costreduction,
etc.
SG&A
Share of profit of investments
accountedfor using
the equity method
Finance income
and Finance
costs
Currencyeffects
Excluding currency effects + 13.1Reference information:Excluding currency effects, one-time issues, andCOVID-19 effects* + 100.8
16
【Decrease factors】・Decreased in unit sales, etc.
Change in Profit before Income Taxes <FY20 Twelve Months >
Yen (billion)
*One-time issues: +42.1, COVID-19 effects: -129.8
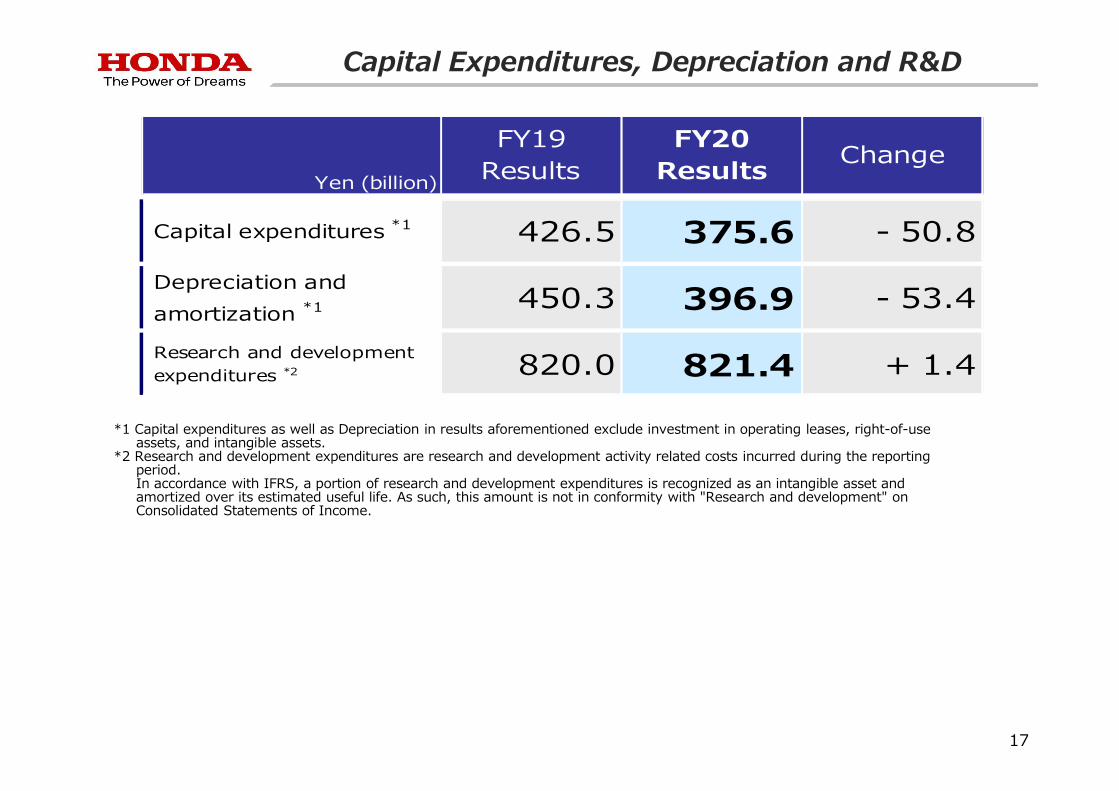
Capital expenditures *1 426.5 375.6 - 50.8
Depreciation and
amortization *1 450.3 396.9 - 53.4
Research and development expenditures *2 820.0 821.4 + 1.4
Yen (billion)Change
FY20Results
FY19Results
Capital Expenditures, Depreciation and R&D
17
*1 Capital expenditures as well as Depreciation in results aforementioned exclude investment in operating leases, right-of-use assets, and intangible assets.
*2 Research and development expenditures are research and development activity related costs incurred during the reporting period.In accordance with IFRS, a portion of research and development expenditures is recognized as an intangible asset and amortized over its estimated useful life. As such, this amount is not in conformity with "Research and development" on Consolidated Statements of Income.

Yen (billion)
Twelve MonthsFY19 FY20
Cash flows from operating activities + 1,138.3 + 1,055.0
Cash flows from investing activities - 524.8 - 584.3
Free cash flow + 613.5 + 470.6
Cash flows from financing activities - 397.5 - 302.5
Effect of exchange rate changes + 15.2 - 86.9
Net change of cash and cash equivalents + 231.3 + 81.2
Cash & Cash equivalents at end of the year 2,381.4 2,462.6
Net cash at end of the year 1,943.5 1,930.6
Cash Flows of Non-financial Services Businesses
18

Accounting standards: Our consolidated financial statements are prepared in conformity with International Financial Reporting Standards (IFRS), as issued by the International Accounting Standards Board (IASB)
Notice on the Factors for Increases and Decreases in Income:With respect to the discussion above of the change in Operating profit, management has identified the factors set forth below and used what it believes to be a reasonable method to analyze the respective changes in such factors. Each of these factors is explained below. Management has analyzed changes in these factors at the levels of the Company and its material consolidated subsidiaries.(1)“Currency effects” consist of translation adjustments, which come from the translation of the currency of foreign subsidiaries’ financial statements into Japanese Yen, and foreign currency adjustments, which result from foreign-currency-denominated sales, which, at the levels of the Company and those consolidated subsidiaries which have been analyzed, primarily relate to the following currencies: U.S. dollar, Canada dollar, Euro, GBP, BRL and Japanese Yen. (2) With respect to “Cost reduction, etc.”, management has analyzed cost reduction and effects of raw material cost fluctuations at the levels of the Company and its material foreign manufacturing subsidiaries in North America, Europe, Asia and other regions.(3) With respect to “Revenue, model mix, etc.”, management has analyzed changes in sales volume and in the mix of product models sold in major markets which have resulted inincreases/decreases in profit, as well as certain other reasons for increases/decreases in sales revenue and cost of sales.(4) With respect to “Selling, General and Administrative expenses”, management has analyzed reasons for an increase/decrease in selling, general and administrative expenses from the previous fiscal year net of currency translation effects.(5) With respect to “Research and Development expenses”, management has analyzed reasons for an increase/decrease in research and development expenses from the previous fiscal year net of currency translation effects.
Unit sales:Motorcycle BusinessHonda Group Unit Sales is the total unit sales of completed products, including motorcycles, ATVs, and Side-by-Sides of Honda, its consolidated subsidiaries and its affiliates and joint ventures accounted for using the equity method. Consolidated Unit Sales is the total unit sales of completed products corresponding to consolidated sales revenue to external customers, which consists of unit sales of completed products of Honda and its consolidated subsidiaries.Automobile BusinessHonda Group Unit Sales is the total unit sales of completed products of Honda, its consolidated subsidiaries and its affiliates and joint ventures accounted for using the equity method. Consolidated Unit Sales is the total unit sales of completed products corresponding to consolidated sales revenue to external customers, which consists of unit sales of completed products of Honda and its consolidated subsidiaries. Certain sales of automobiles that are financed with residual value type auto loans by our Japanese finance subsidiaries and sold through our consolidated subsidiaries are accounted for as operating leases in conformity with IFRS and are not included in consolidated sales revenue to the external customers in our Automobile business. Accordingly, they are not included in Consolidated Unit Sales, but are included in Honda Group Unit Sales of our Automobile business.Life Creation BusinessHonda Group Unit Sales is the total unit sales of completed power products of Honda, its consolidated subsidiaries and its affiliates and joint ventures accounted for using the equity method. Consolidated Unit Sales is the total unit sales of completed power products corresponding to consolidated sales revenue to external customers, which consists of unit sales of completed power products of Honda and its consolidated subsidiaries. In Life Creation business, there is no discrepancy between Honda Group Unit Sales and Consolidated Unit Sales since no affiliate and joint venture accounted for using the equity method was involved in the sale of Honda power products.
- 4th Quarter FY19: 1,759,562,000 (approx) , FY20: 1,737,161,000 (approx) - Fiscal year FY19: 1,763,983,000 (approx) , FY20: 1,752,006,000 (approx)
* Earnings per share attributable to owners of the parent is calculated based on weighted average number of shares outstanding as shown below:
19


Appendix

compared with FY19 4Q : - 591.0 / - 14.6 % (Excluding currency translation effects:- 526.6 / - 13.0 %)
compared with FY19 : - 957.6 / - 6.0 % (Excluding currency translation effects:- 599.2 / - 3.8 %)
Change in Sales Revenue (Sales revenue from external customers)
Yen (billion)
Twelve Months
Three Months
22
(%)
Motorcycle Business 489.4 473.5 - 15.8 + 0.9 + 0.2%
Automobile Business 2,843.9 2,267.9 - 576.0 - 536.8 - 18.9%
Financial Services Business 619.0 625.0 + 5.9 + 12.5 + 2.0%
Life Creation and Other Businesses 96.6 91.5 - 5.1 - 3.2 - 3.4%
Total 4,049.1 3,458.0 - 591.0 - 526.6 - 13.0% Market average rate (Yen)
U.S. Dollar 110 109
ChangeFY20FY19Change
excluding currency translation effects
(%)
Motorcycle Business 2,100.1 2,059.3 - 40.8 + 24.8 + 1.2%
Automobile Business 11,072.1 9,959.0 - 1,113.0 - 872.9 - 7.9%
Financial Services Business 2,365.3 2,586.9 + 221.6 + 266.1 + 11.2%
Life Creation and Other Businesses 350.9 325.6 - 25.3 - 17.2 - 4.9%
Total 15,888.6 14,931.0 - 957.6 - 599.2 - 3.8% Market average rate (Yen)
U.S. Dollar 111 109
ChangeFY20FY19Change
excluding currency translation effects

* Combined operating profit of Automobile Business andFinancial Services Business for automobiles
- 42.2
FY19 YTD: - 40.2
<Reference>Combined operating profit *
Operating profitfrom aircraft and
aircraft engines included in above
363.6 / 2.9%
FY19 YTD:445.6 / 3.3%
Operating Margin
13.9% 1.5% 8.4% - 7.1%
13.9% 1.9% 9.9% - 2.9%
Operating Profit
285.6 153.3 219.7 - 25.0
291.6 209.6 235.9 - 10.9
Yen (billion)
Sales Revenue
2,059.3 10,194.6 2,600.9 350.6
2,100.1 11,287.7 2,380.0 377.2
MotorcyleBusiness
AutomobileBusiness
Financial ServicesBusiness
Life Creation andOther Businesses
Unit (thousand)
Honda Group Unit Sales
19,340 4,790 - 5,701
20,238 5,323 - 6,301
lower:FY19
upper:FY20
In the financial services business, Honda provides services such as loan and lease, mainly related to sales of automobiles, for customers buying products.Operating profit relating to automobiles in financial services business is allocated in accordance with total assets ratio, etc.
Sales Revenue/Operating Profit (Margin) by Business Segment <FY20 Twelve Months>
23

Sales Revenue / Operating Profit by Geographical Segment
Yen (billion)
24
FY19 FY20 FY19 FY20 FY19 FY20 FY19 FY20 FY19 FY20
Sales Revenue
4,848.3 4,422.9 9,023.9 8,556.8 927.4 772.5 4,272.2 3,859.7 764.4 693.6
Operating Profit
0.0 - 28.1 299.7 305.3 - 6.6 14.9 404.2 319.5 22.6 37.2
Change (%)
Other RegionsTwelve Months
Japan North America Europe Asia
- 28.1 billion yen + 1.9% + 21.6 billion yen - 20.9% + 64.9%
FY19 FY20 FY19 FY20 FY19 FY20 FY19 FY20 FY19 FY20
Sales Revenue
1,206.3 1,084.6 2,329.1 2,012.1 260.5 189.5 997.0 826.1 189.9 148.4
Operating Profit
- 85.4 - 66.2 85.9 24.5 - 15.2 3.9 60.9 44.6 - 10.1 1.7
Change (%)
Other RegionsThree Months
Japan North America Europe Asia
+ 19.2 billion yen - 71.4% + 19.1 billion yen - 26.7% + 11.8 billion yen
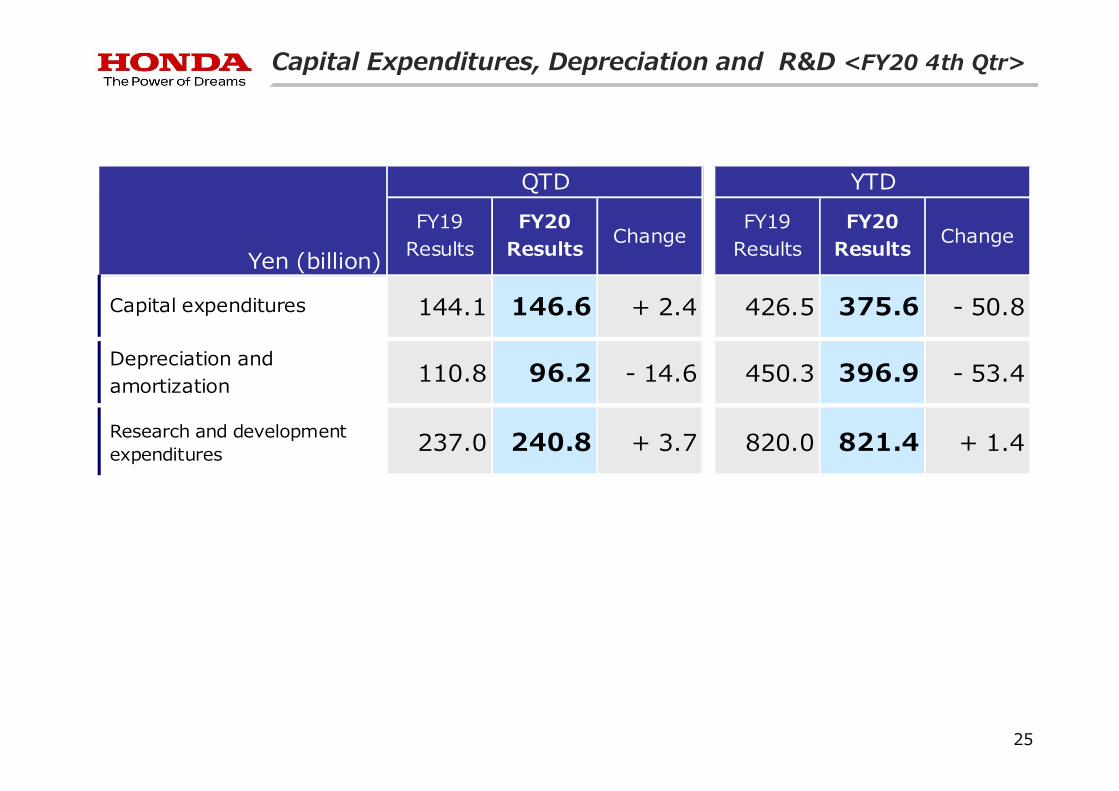
Capital expenditures 144.1 146.6 + 2.4 426.5 375.6 - 50.8
Depreciation and amortization 110.8 96.2 - 14.6 450.3 396.9 - 53.4
Research and development expenditures 237.0 240.8 + 3.7 820.0 821.4 + 1.4
YTD
Yen (billion)Change
FY20Results
FY19Results
QTD
FY19Results
FY20Results
Change
25
Capital Expenditures, Depreciation and R&D <FY20 4th Qtr>
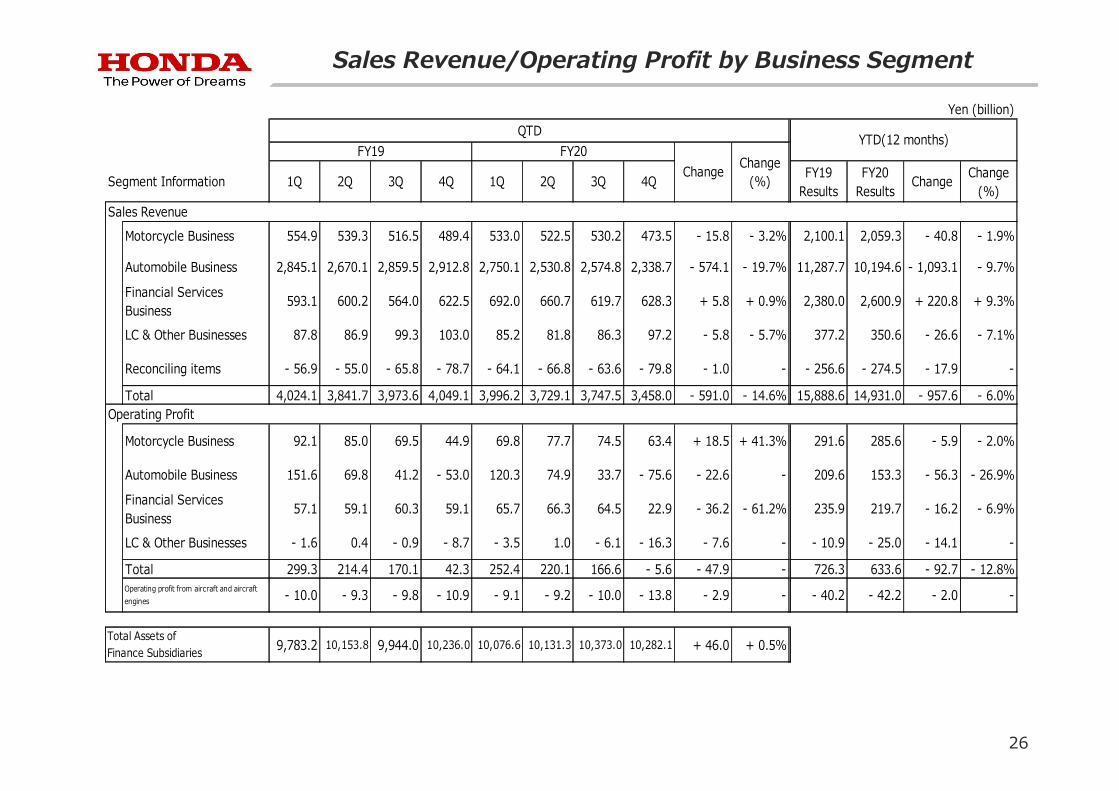
1Q 2Q 3Q 4Q 1Q 2Q 3Q 4QFY19
ResultsFY20
ResultsChange
Change(%)
Sales Revenue
Motorcycle Business 554.9 539.3 516.5 489.4 533.0 522.5 530.2 473.5 - 15.8 - 3.2% 2,100.1 2,059.3 - 40.8 - 1.9%
Automobile Business 2,845.1 2,670.1 2,859.5 2,912.8 2,750.1 2,530.8 2,574.8 2,338.7 - 574.1 - 19.7% 11,287.7 10,194.6 - 1,093.1 - 9.7%
Financial ServicesBusiness
593.1 600.2 564.0 622.5 692.0 660.7 619.7 628.3 + 5.8 + 0.9% 2,380.0 2,600.9 + 220.8 + 9.3%
LC & Other Businesses 87.8 86.9 99.3 103.0 85.2 81.8 86.3 97.2 - 5.8 - 5.7% 377.2 350.6 - 26.6 - 7.1%
Reconciling items - 56.9 - 55.0 - 65.8 - 78.7 - 64.1 - 66.8 - 63.6 - 79.8 - 1.0 - - 256.6 - 274.5 - 17.9 -
Total 4,024.1 3,841.7 3,973.6 4,049.1 3,996.2 3,729.1 3,747.5 3,458.0 - 591.0 - 14.6% 15,888.6 14,931.0 - 957.6 - 6.0%Operating Profit
92.1 85.0 69.5 44.9 69.8 77.7 74.5 63.4 + 18.5 + 41.3% 291.6 285.6 - 5.9 - 2.0%
151.6 69.8 41.2 - 53.0 120.3 74.9 33.7 - 75.6 - 22.6 - 209.6 153.3 - 56.3 - 26.9%
57.1 59.1 60.3 59.1 65.7 66.3 64.5 22.9 - 36.2 - 61.2% 235.9 219.7 - 16.2 - 6.9%
- 1.6 0.4 - 0.9 - 8.7 - 3.5 1.0 - 6.1 - 16.3 - 7.6 - - 10.9 - 25.0 - 14.1 -
Total 299.3 214.4 170.1 42.3 252.4 220.1 166.6 - 5.6 - 47.9 - 726.3 633.6 - 92.7 - 12.8%Operating profit from aircraft and aircraftengines - 10.0 - 9.3 - 9.8 - 10.9 - 9.1 - 9.2 - 10.0 - 13.8 - 2.9 - - 40.2 - 42.2 - 2.0 -
9,783.2 10,153.8 9,944.0 10,236.0 10,076.6 10,131.3 10,373.0 10,282.1 + 46.0 + 0.5%
Yen (billion)
Total Assets ofFinance Subsidiaries
QTDYTD(12 months)
FY19
Segment Information
LC & Other Businesses
Motorcycle Business
Automobile Business
Financial ServicesBusiness
FY20Change
Change(%)
Sales Revenue/Operating Profit by Business Segment
26

Honda Group Unit Sales/Consolidated Unit Sales
1Q 2Q 3Q 4Q 1Q 2Q 3Q 4Q ChangeFY19
ResultsFY20
ResultsChange
Motorcycles 5,352 5,315 5,013 4,558 4,921 5,098 5,019 4,302 - 256 20,238 19,340 - 898Japan 49 55 53 50 51 61 42 51 + 1 207 205 - 2North America 72 78 66 85 74 75 72 109 + 24 301 330 + 29Europe 80 61 40 68 84 57 45 53 - 15 249 239 - 10Asia 4,840 4,824 4,523 4,037 4,378 4,575 4,500 3,809 - 228 18,224 17,262 - 962Other Regions 311 297 331 318 334 330 360 280 - 38 1,257 1,304 + 47
Automobiles 1,305 1,246 1,408 1,364 1,321 1,241 1,247 981 - 383 5,323 4,790 - 533Japan 162 170 183 204 181 183 125 183 - 21 719 672 - 47North America 518 428 498 510 495 433 474 423 - 87 1,954 1,825 - 129Europe 42 38 41 48 34 34 35 30 - 18 169 133 - 36Asia 520 551 627 535 554 540 561 297 - 238 2,233 1,952 - 281Other Regions 63 59 59 67 57 51 52 48 - 19 248 208 - 40
1,341 1,262 1,351 2,347 1,280 1,155 1,195 2,071 - 276 6,301 5,701 - 600Japan 72 89 85 90 74 80 64 94 + 4 336 312 - 24North America 575 548 658 1,268 605 504 552 1,187 - 81 3,049 2,848 - 201Europe 229 173 198 384 198 154 150 343 - 41 984 845 - 139Asia 395 376 309 479 347 346 345 337 - 142 1,559 1,375 - 184Other Regions 70 76 101 126 56 71 84 110 - 16 373 321 - 52
Consolidated Unit SalesMotorcycles 3,615 3,533 3,230 2,837 3,264 3,278 3,190 2,694 - 143 13,215 12,426 - 789
Japan 49 55 53 50 51 61 42 51 + 1 207 205 - 2North America 72 78 66 85 74 75 72 109 + 24 301 330 + 29Europe 80 61 40 68 84 57 45 53 - 15 249 239 - 10Asia 3,103 3,042 2,740 2,316 2,721 2,755 2,671 2,201 - 115 11,201 10,348 - 853Other Regions 311 297 331 318 334 330 360 280 - 38 1,257 1,304 + 47
Automobiles 952 875 942 979 905 828 808 777 - 202 3,748 3,318 - 430Japan 145 154 165 179 161 163 107 158 - 21 643 589 - 54North America 518 428 498 510 495 433 474 423 - 87 1,954 1,825 - 129Europe 42 38 41 48 34 34 35 30 - 18 169 133 - 36Asia 184 196 179 175 158 147 140 118 - 57 734 563 - 171Other Regions 63 59 59 67 57 51 52 48 - 19 248 208 - 40
1,341 1,262 1,351 2,347 1,280 1,155 1,195 2,071 - 276 6,301 5,701 - 600Japan 72 89 85 90 74 80 64 94 + 4 336 312 - 24North America 575 548 658 1,268 605 504 552 1,187 - 81 3,049 2,848 - 201Europe 229 173 198 384 198 154 150 343 - 41 984 845 - 139Asia 395 376 309 479 347 346 345 337 - 142 1,559 1,375 - 184Other Regions 70 76 101 126 56 71 84 110 - 16 373 321 - 52
Life Creation
Life Creation
QTDYTD
HondaGroupUnit Sales
FY19 FY20
Unit (thousand)
27
28
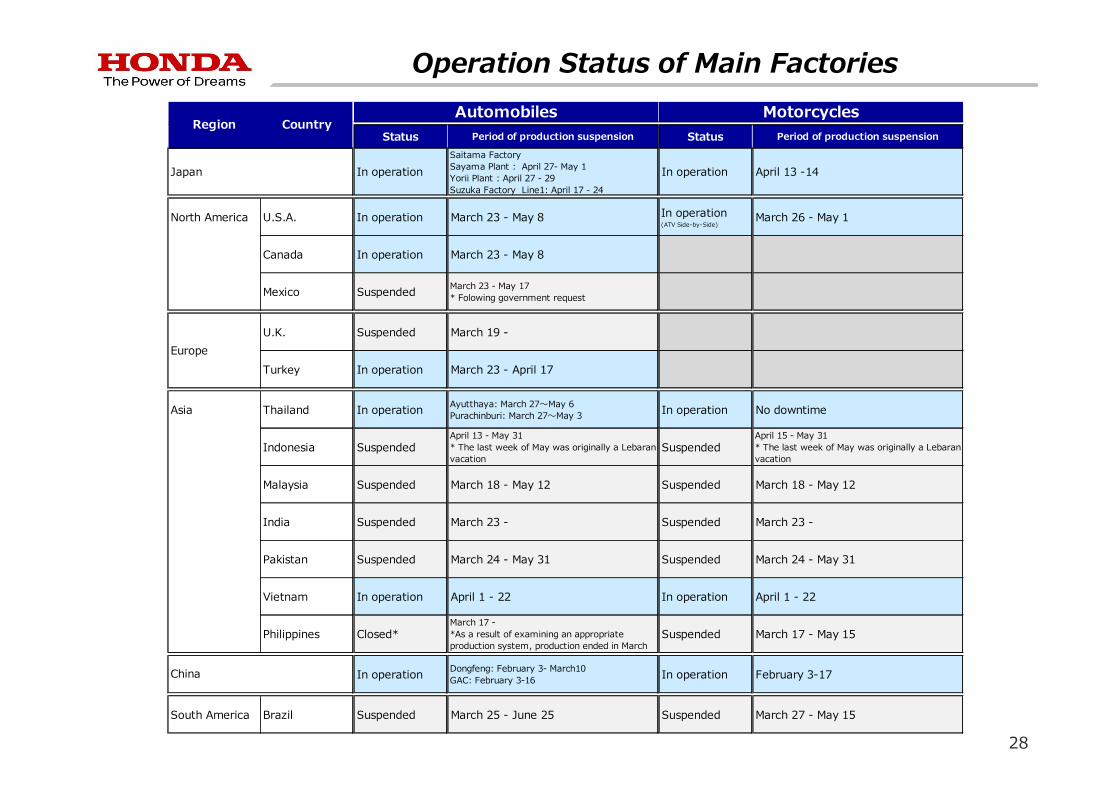
Operation Status of Main Factories
Status Period of production suspension Status Period of production suspension
In operation
Saitama FactorySayama Plant : April 27- May 1Yorii Plant : April 27 - 29Suzuka Factory Line1: April 17 - 24
In operation April 13 -14
North America U.S.A. In operation March 23 - May 8 In operation(ATV Side-by-Side)
March 26 - May 1
Canada In operation March 23 - May 8
Mexico Suspended March 23 - May 17* Folowing government request
U.K. Suspended March 19 -
Turkey In operation March 23 - April 17
Asia Thailand In operation Ayutthaya: March 27~May 6Purachinburi: March 27~May 3 In operation No downtime
Indonesia SuspendedApril 13 - May 31* The last week of May was originally a Lebaranvacation
Suspended April 15 - May 31* The last week of May was originally a Lebaranvacation
Malaysia Suspended March 18 - May 12 Suspended March 18 - May 12
India Suspended March 23 - Suspended March 23 -
Pakistan Suspended March 24 - May 31 Suspended March 24 - May 31
Vietnam In operation April 1 - 22 In operation April 1 - 22
Philippines Closed*March 17 -*As a result of examining an appropriateproduction system, production ended in March
Suspended March 17 - May 15
In operation Dongfeng: February 3- March10GAC: February 3-16 In operation February 3-17
South America Brazil Suspended March 25 - June 25 Suspended March 27 - May 15
Automobiles Motorcycles
Japan
Europe
China
Region Country