iaea international collaborative standard problemon
TRANSCRIPT

Gru
pp
o R
icer
ca N
ucl
eare
S. P
iero
a G
rad
o
Fourth Workshop for the ICSP on Integral Water Cooled Reactor Designs, Pisa 25-28 February 2013, Italy
IAEA
International Collaborative Standard Problem on
Integral PWR Design Natural Circulation Flow Stability and
Thermo-hydraulic Coupling of Containment and
Primary System during Accidents
OPEN OPEN OPEN OPEN CalculationCalculationCalculationCalculation ResultsResultsResultsResults
FulvioFulvioFulvioFulvio MascariMascariMascariMascari, Giuseppe , Giuseppe , Giuseppe , Giuseppe VellaVellaVellaVella
Dipartimento Energia, Ingegneria dell’Informazione e Modelli Matematici(DEIM)
Università degli Studi di Palermo
1

Gru
pp
o R
icer
ca N
ucl
eare
S. P
iero
a G
rad
oContents
Fourth Workshop for the ICSP on Integral Water Cooled Reactor Designs, Pisa 25-28 February 2013, Italy
2
�TRACE REACTOR SYSTEM ANALYSIS CODE
�OSU MASLWR VS TRACE MODEL DESCRIPTION
�TEST2 ANALYSIS
�TEST3 ANALYSIS
�LEASSON LEARNED
Gru
pp
o R
icer
ca N
ucl
eare
S. P
iero
a G
rad
oTRACE REACTOR SYSTEM ANALYSIS CODE
� The U.S. Nuclear Regulatory Commission (USNRC) is in the process of developing a modern code for reactor analysis.
� It is an evolutionary code that merges RAMONA, RELAP5, TRAC-PWR and TRAC-BWR into a single code.
� The consolidated code is called the TRAC/RELAP Advanced Computational Engine or TRACE.
Fourth Workshop for the ICSP on Integral Water Cooled Reactor Designs, Pisa 25-28 February 2013, Italy
3

Gru
pp
o R
icer
ca N
ucl
eare
S. P
iero
a G
rad
oTRACE REACTOR SYSTEM ANALYSIS CODE
Fourth Workshop for the ICSP on Integral Water Cooled Reactor Designs, Pisa 25-28 February 2013, Italy
� TRACE is a component-oriented code designed to analyze reactor transients and accidents up to the point of fuel failure.
� It is a finite-volume, two-fluid, compressible flow code with 3-D capability.
� It can model heat structures and control systems that interact with the component models and the fluid solution.
� TRACE can be run in a coupled mode with the PARCS three dimensional reactor kinetics code.
� TRACE can be run in parallel.
� TRACE has been coupled to CONTAIN through its exterior communications interface (ECI).
� TRACE has been coupled to as user-friendly front end, SNAP (Symbolic Nuclear Analysis Package), that supports input model development and accepts existing RELAP5 and TRAC-P input models.
4

Gru
pp
o R
icer
ca N
ucl
eare
S. P
iero
a G
rad
oTRACE FIELD EQUATIONS
5
Fourth Workshop for the ICSP on Integral Water Cooled Reactor Designs, Pisa 25-28 February 2013, Italy
•Mixture mass conservation equation:
0)]1([])1([ =−+⋅∇+−+∂∂
αραρρααρ llvvlv vvt
rr
•Vapor mass conservation equation:
vvvv vt
Γ=⋅∇+∂∂
)()( αραρr
•Liquid momentum conservation equation:
gvvc
vvvvvvc
pvvt
vll
l
wlv
l
condlvlv
l
i
l
lll rrrrrrrrrrrr
+−
+−−Γ
−−−−
+∇−=∇⋅+∂∂
||)1(
)()1(
||)()1(
1
ραραραρ
•Gas momentum conservation equation:
gvvc
vvvvvvc
pvvt
vvv
v
wvlv
v
Boiling
lvlv
v
i
v
vvv rrrrrrrrrrrr
++−Γ
−−−+∇−=∇⋅+∂
∂||)(||)(
1
αραραρρ
•Mixture energy conservation equation:
dlvwllvlllvvvllvv qqvvpveveeet
++−+⋅∇−=−+⋅∇+−+∂∂
])1([])1([])1([(rrrr
αααραραραρ
•Vapor energy conservation equation:
vvivdvwvvvvvvv hqqqvpt
pveet
Γ++++⋅∇−∂∂
−=⋅∇+∂∂
)()()(rr
αα
αραρ
Gru
pp
o R
icer
ca N
ucl
eare
S. P
iero
a G
rad
oTRACE FIELD EQUATIONS
6
Fourth Workshop for the ICSP on Integral Water Cooled Reactor Designs, Pisa 25-28 February 2013, Italy
Gru
pp
o R
icer
ca N
ucl
eare
S. P
iero
a G
rad
oTRACE REACTOR SYSTEM ANALYSIS CODE
Fourth Workshop for the ICSP on Integral Water Cooled Reactor Designs, Pisa 25-28 February 2013, Italy
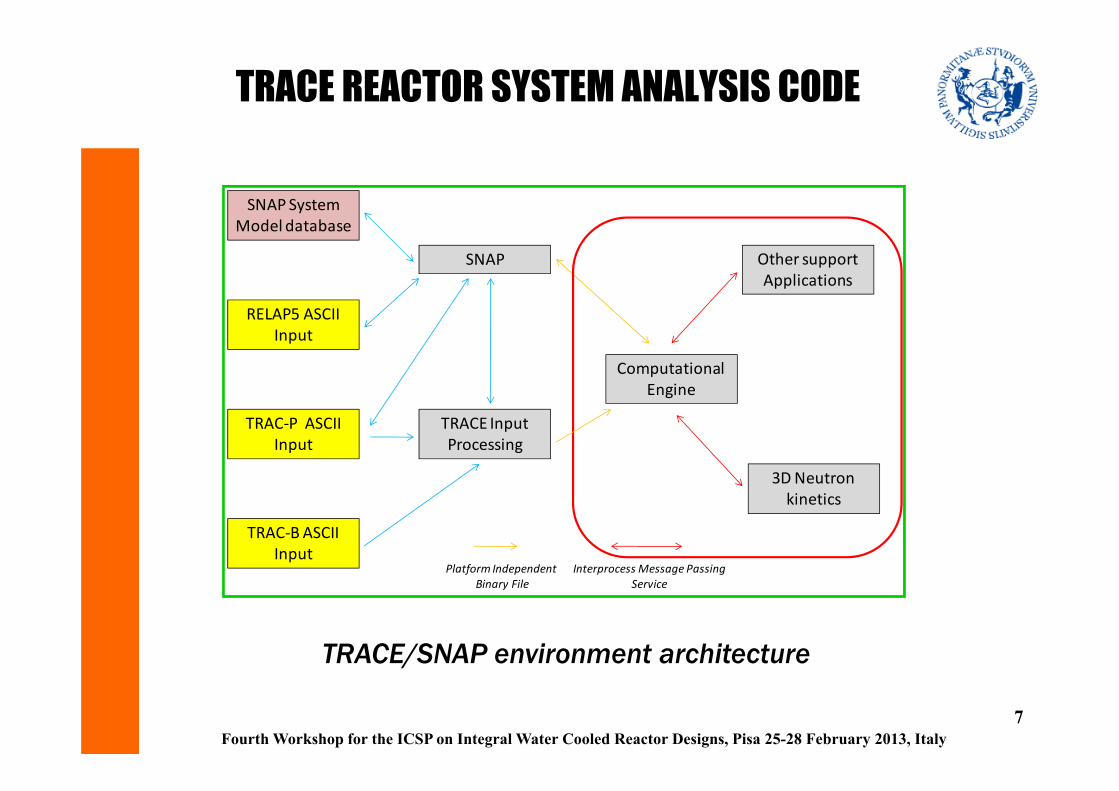
TRACE/SNAP environment architecture
SNAP System
Model database
RELAP5 ASCII
Input
TRAC-P ASCII
Input
TRAC-B ASCII
Input
SNAP
TRACE Input
Processing
Computational
Engine
Other support
Applications
3D Neutron
kinetics
Platform Independent
Binary File
Interprocess Message Passing
Service
7

Gru
pp
o R
icer
ca N
ucl
eare
S. P
iero
a G
rad
oOSU-MASLWR TRACE MODEL
8
Fourth Workshop for the ICSP on Integral Water Cooled Reactor Designs, Pisa 25-28 February 2013, Italy

Gru
pp
o R
icer
ca N
ucl
eare
S. P
iero
a G
rad
o
OSU-MASLWR VS TRACE MODEL
Primary System
9
Fourth Workshop for the ICSP on Integral Water Cooled Reactor Designs, Pisa 25-28 February 2013, Italy
Core:
One thermal hydraulic region
thermally coupled with one
equivalent active heat structure
simulating the 56 electric heaters
Helical Coil
Steam Generator
Thick Baffle Plate
RPV is divided in two slice
hydraulic regions
PRZ:
divided in two hydraulic
regions to allow natural
circulation convection
phenomena
UP:
UP is divided in two
thermal hydraulic regions
connected to the PRZ.
TEE components are used

Gru
pp
o R
icer
ca N
ucl
eare
S. P
iero
a G
rad
o
OSU-MASLWR VS TRACE MODEL
Primary System
10
Fourth Workshop for the ICSP on Integral Water Cooled Reactor Designs, Pisa 25-28 February 2013, Italy
Lower core flow plate
FDP-131: primary volumetric flow rate

Gru
pp
o R
icer
ca N
ucl
eare
S. P
iero
a G
rad
o
OSU-MASLWR VS TRACE MODEL
Primary System
11
Fourth Workshop for the ICSP on Integral Water Cooled Reactor Designs, Pisa 25-28 February 2013, Italy
Parameters OSU-MASLWR
facility
TRACE
model
Error (m)
inch m m
Vent line elevation from the hydraulic bottom 174.44 4.4308 4.3616 0.07
Blow-down line elevation from the hydraulic bottom 53.25 1.3526 1.2931 0.06
Sump line elevation from the hydraulic bottom 29 0.7366 0.7020 0.03
Core heaters length 23.5 0.5969 - -
Total core heaters length (56 heaters) 1316 33.4264 33.4264 0.00
Non active core heaters length - 0.1401 - -
Total non active core heaters length - 7.8456 7.8456 0.00
PRZ heaters length - 0.2032 - -
Total PRZ heaters length (3 heaters) - 0.6096 0.6096 0.00
Lower shell section length 27 0.6858 0.6716 0.01
Coil section length (a) 49.25 1.2510 1.2510 0.00
Coil section length (b) 41.25 1.0478 1.0478 0.00
Steam drum section length 12 0.3048 0.3048 0.00
Steam line inlet position in the steam drum 11.75 0.2985 0.3048 0.01
Average position of the outlet coils in the steam
drum
4.38 0.1113 0.1113 0.00
Flange length 4.631 0.1176-
-
Total flange length-
0.23530.2352574
0.00
Gru
pp
o R
icer
ca N
ucl
eare
S. P
iero
a G
rad
o
OSU-MASLWR VS TRACE MODEL
Primary System heat structures
12
Fourth Workshop for the ICSP on Integral Water Cooled Reactor Designs, Pisa 25-28 February 2013, Italy
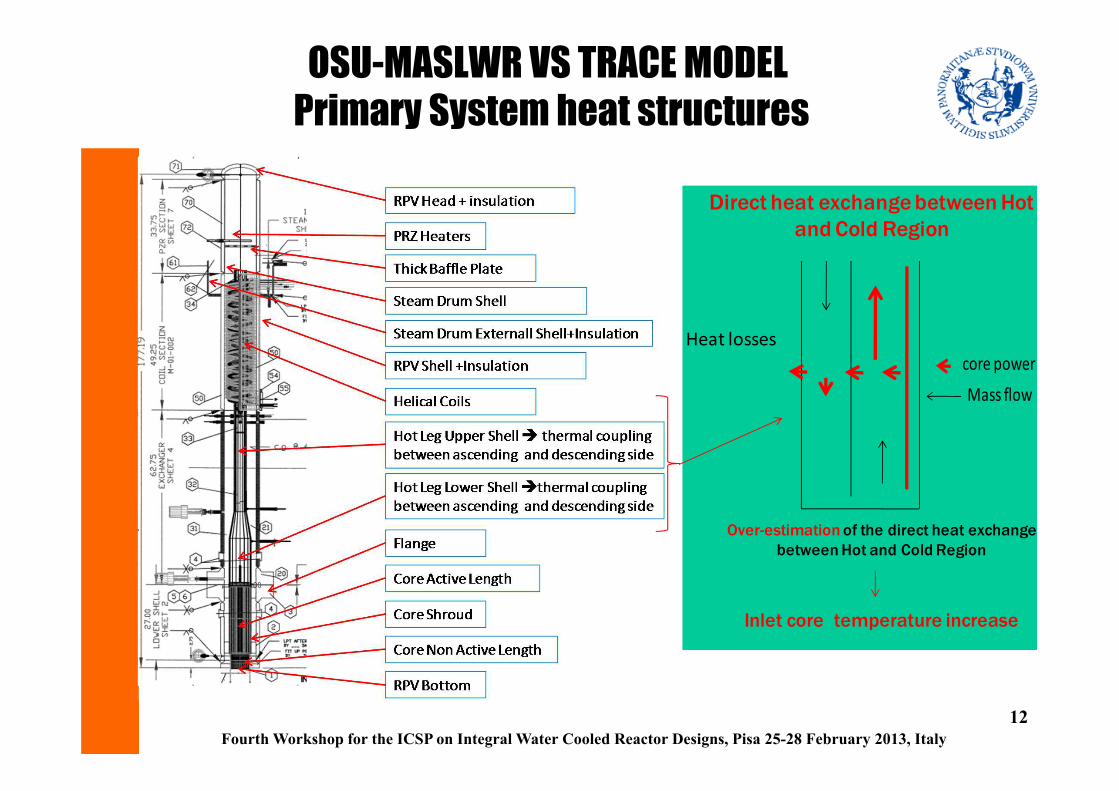
Heat losses
core power
Mass flow
Over-estimation of the direct heat exchange
between Hot and Cold Region
Inlet core temperature increase
Direct heat exchange between Hot
and Cold Region
20

Gru
pp
o R
icer
ca N
ucl
eare
S. P
iero
a G
rad
oOSU MASLWR - Secondary System
� Steam generators.
• Helical coil, once through heat exchangers.
• Located within the pressure vessel in the annular space between the hot leg riser and the inside surface of the pressure vessel.
Fourth Workshop for the ICSP on Integral Water Cooled Reactor Designs, Pisa 25-28 February 2013, Italy
� Steam produced in the steam generators is vented to the atmosphere.
13

Gru
pp
o R
icer
ca N
ucl
eare
S. P
iero
a G
rad
oOSU MASLWR - Secondary System
� Steam generator consists of 3 separate parallel sections.
• Outer coil and middle coils consist of 5 tubes each. Inner coil consists of 4 tubes.
• Common inlet header to ensure pressure equilibrium.
Fourth Workshop for the ICSP on Integral Water Cooled Reactor Designs, Pisa 25-28 February 2013, Italy
Inner Coils
Middle Coils
Outer Coils
14

Gru
pp
o R
icer
ca N
ucl
eare
S. P
iero
a G
rad
o
OSU-MASLWR VS TRACE MODEL
SG COILS (three equivalent group of pipe)
15
Fourth Workshop for the ICSP on Integral Water Cooled Reactor Designs, Pisa 25-28 February 2013, Italy
Prim
ary
sid
e v
olu
me
Gru
pp
o R
icer
ca N
ucl
eare
S. P
iero
a G
rad
o
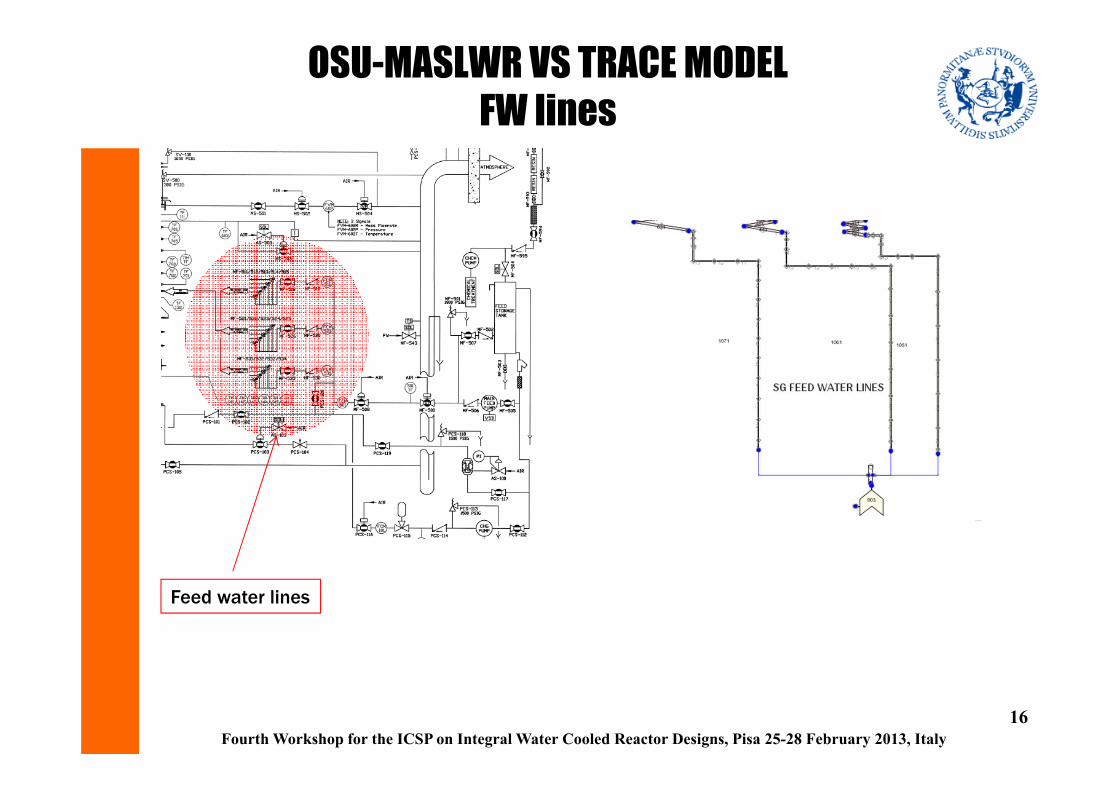
OSU-MASLWR VS TRACE MODEL
FW lines
16
Fourth Workshop for the ICSP on Integral Water Cooled Reactor Designs, Pisa 25-28 February 2013, Italy
Feed water lines

Gru
pp
o R
icer
ca N
ucl
eare
S. P
iero
a G
rad
o
OSU-MASLWR VS TRACE MODEL
SG COILS
� SG coils, are modeled with three different “equivalent” oblique group of pipes in order to simulate the three separate parallel helical coils.
� The equivalent group of pipes simulating the outer coils characterizes only four helical coils because, as it is described in the information’s disclosed to the ICSP participants, one of the outer coil is plugged.
� In order to simulate the metal mass of this helical coil a passive heat structure is modeled.
� Previous analyses, based on the TRACE simulation of the OSU-MASLWR-002 test, showed that the instabilities of the superheat condition of the fluid at the outlet of the SG are also related to the equivalent SG model. Since in theses analyses a model with one equivalent vertical group of pipes shows a more stable fluid temperature at the SG outlet, this model is used as reference for the ICSP test 2 and 3. A sensitivity analyses with three different equivalent oblique group of pipe is considered for the ICSP test 3
17
Fourth Workshop for the ICSP on Integral Water Cooled Reactor Designs, Pisa 25-28 February 2013, Italy

Gru
pp
o R
icer
ca N
ucl
eare
S. P
iero
a G
rad
o
OSU-MASLWR VS TRACE MODEL
SG COILS (1 equivalent group of pipe)
18
Fourth Workshop for the ICSP on Integral Water Cooled Reactor Designs, Pisa 25-28 February 2013, Italy

Gru
pp
o R
icer
ca N
ucl
eare
S. P
iero
a G
rad
o
OSU-MASLWR VS TRACE MODEL
Primary and secondary System
19
Fourth Workshop for the ICSP on Integral Water Cooled Reactor Designs, Pisa 25-28 February 2013, Italy
Parameters OSU-MASWR Facility
ID (m) Thickness (m) OD (m) Insulation (m) Total thickness (m)
RPV external shell 0.2921 0.03175 0.3556 0.102 0.13375
HL lower shell 0.1971 0.00305 0.2032 -
HL upper shell 0.1023 0.00602 0.11434 -
Core heater rods - - 0.0125 -
PRZ heater rods - - 0.016 -
SG coils 0.0126 0.00165 0.0159
Steam line 0.03504 0.00356 0.04216 - -
Feed water lines 0.0094 0.00165 0.0127 - -
ParametersTRACE Model
ID (m) Thickness (m) OD (m) Insulation (m) Total thickness (m)
RPV external shell 0.2921 0.03175 0.3556 0.102 0.13375
HL lower shell 0.1971 0.00305 0.2032 -
HL upper shell 0.1023 0.00602 0.11434 -
Core heater rods - - 0.0125 -
PRZ heater rods - - 0.016 -
SG coils 0.0126 0.00165 0.0159
Steam line 0.03504 0.00356 0.04216 0.055 0.05856
Feed water lines 0.0094 - - - -

Gru
pp
o R
icer
ca N
ucl
eare
S. P
iero
a G
rad
oOSU MASLWR - Containment
• One vessel models the suppression pool volume, vapor bubble volume and the condensation surface inside of the containment vessel.
• The second vessel models the heat capacity of the water pool within which the containment vessel is held.
• Two tanks are separated by a plate of 0.04 m thick stainless steel.
� Models the heat transfer between the containment vessel and the surrounding vessel pool.
Fourth Workshop for the ICSP on Integral Water Cooled Reactor Designs, Pisa 25-28 February 2013, Italy
� The MASLWR containment vessel and the surrounding containment pool are modelled in the OSU test facility as two separate vessels.
20
Gru
pp
o R
icer
ca N
ucl
eare
S. P
iero
a G
rad
o
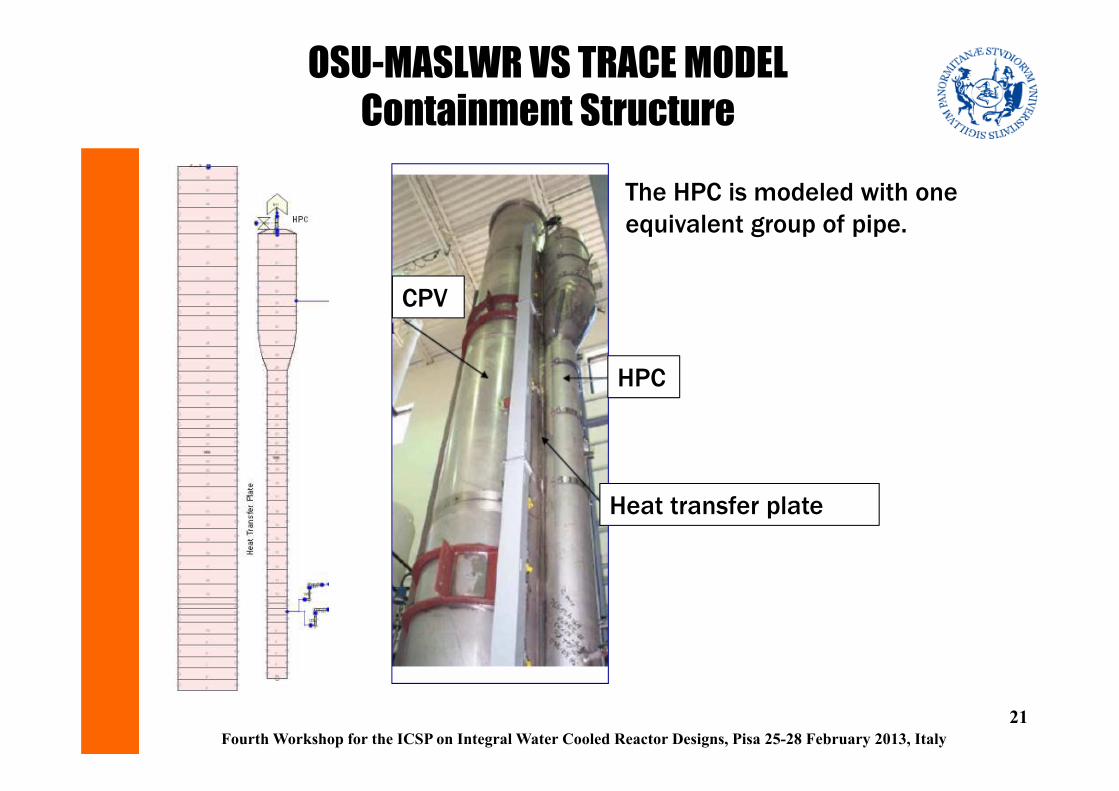
OSU-MASLWR VS TRACE MODEL
Containment Structure
21
Fourth Workshop for the ICSP on Integral Water Cooled Reactor Designs, Pisa 25-28 February 2013, Italy
The HPC is modeled with one
equivalent group of pipe.
HPC
CPV
Heat transfer plate

Gru
pp
o R
icer
ca N
ucl
eare
S. P
iero
a G
rad
o
OSU-MASLWR VS TRACE MODEL
Containment Structure-Sensitivity Study
22
Fourth Workshop for the ICSP on Integral Water Cooled Reactor Designs, Pisa 25-28 February 2013, Italy
The HPC is modeled with two
different pipes, connected by
single junctions, in order to allow
possible natural circulation
/convection phenomena inside the
containment.
HPC
CPV
Heat transfer plate
FOR THE SIMULATION OF THE ICSP
TEST 2 (one sensitivity study)

Gru
pp
o R
icer
ca N
ucl
eare
S. P
iero
a G
rad
o
OSU-MASLWR VS TRACE MODEL
Containment Structures
23
Fourth Workshop for the ICSP on Integral Water Cooled Reactor Designs, Pisa 25-28 February 2013, Italy
Parameters OSU-MASWR Facility
ID (m) Thicknes
s (m)
OD (m) Insulation
(m)
Total
thickness
(m)
L (m)
HPC lower external
shell 0.26162 0.00419 0.27 0.102 0.10619 3.87
HPC upper cylindrical
shell 0.49128 0.00476 0.508 0.102 0.10676 1.21
CPV external shell 0.7493 0.00635 0.762 0.508 0.51435 7.15
Thikness
(m) Wide (m) - - - L (m)
Heat transfer plate 0.0381 0.168 - - - 5.59
Parameters OSU-MASLWR TRACE Model
ID (m) Thicknes
s (m)
OD (m) Insulation
(m)
Total
thickness
(m)
L (m)
HPC lower external
shell 0.26162 0.00419 0.27 0.102 0.106 3.87
HPC upper cylindrical
shell 0.49128 0.00476 0.508 0.102 0.10676 1.21
CPV external shell 7.15
Thikness
(m)
Wide (m)
- - -
L(m)
Heat transfer plate 0.0381 0.168 - - - 5.59

Gru
pp
o R
icer
ca N
ucl
eare
S. P
iero
a G
rad
oOSU MASLWR – ADS LINES
Fourth Workshop for the ICSP on Integral Water Cooled Reactor Designs, Pisa 25-28 February 2013, Italy
� The containment vessel is connected to the reactor pressure vessel by six independent lines.
• Two Automatic Depressurization System (ADS) lines.
• Two vent lines.
• Two sump recirculation lines.
• Flow controlled by an independent automatically operated valve.
24

Gru
pp
o R
icer
ca N
ucl
eare
S. P
iero
a G
rad
o
OSU-MASLWR VS TRACE MODEL
ADS LINES
25
Fourth Workshop for the ICSP on Integral Water Cooled Reactor Designs, Pisa 25-28 February 2013, Italy
In order to simulate the
ICSP test 2, the ADS lines
are modeled separately
in order to correctly
simulate the different
ADS valve actions
Gru
pp
o R
icer
ca N
ucl
eare
S. P
iero
a G
rad
o
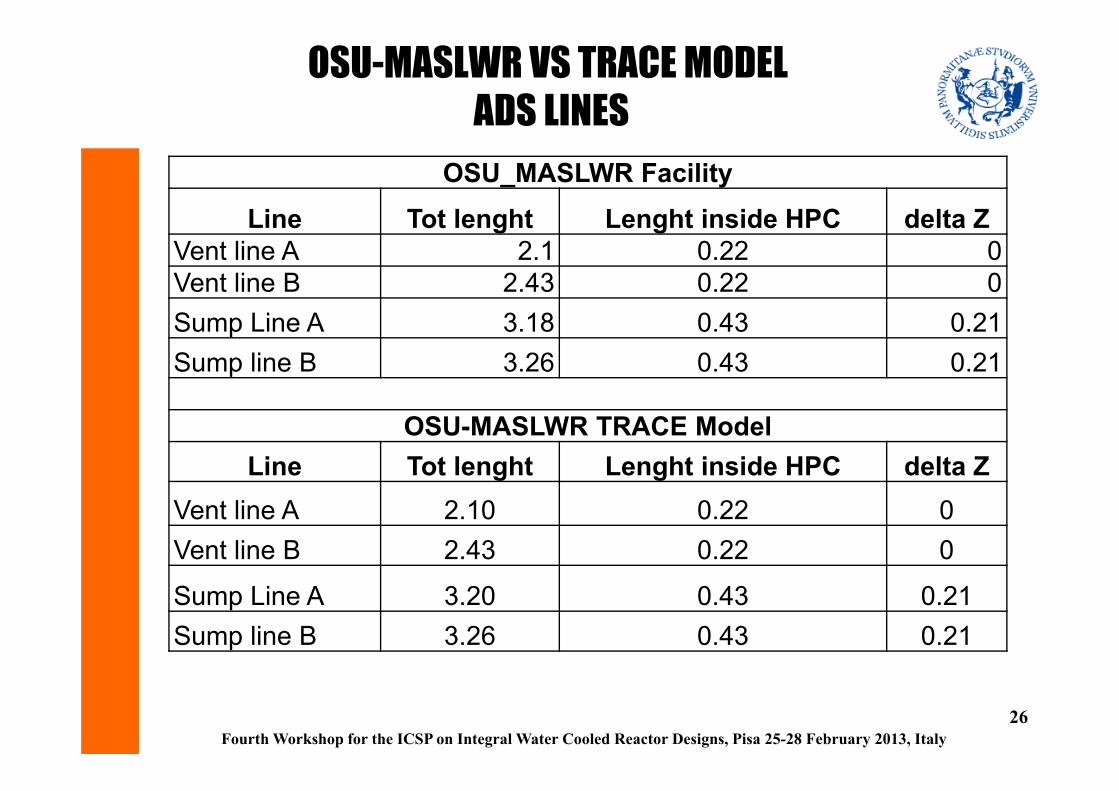
OSU-MASLWR VS TRACE MODEL
ADS LINES
26
Fourth Workshop for the ICSP on Integral Water Cooled Reactor Designs, Pisa 25-28 February 2013, Italy
OSU_MASLWR Facility
Line Tot lenght Lenght inside HPC delta Z
Vent line A 2.1 0.22 0
Vent line B 2.43 0.22 0
Sump Line A 3.18 0.43 0.21
Sump line B 3.26 0.43 0.21
OSU-MASLWR TRACE Model
Line Tot lenght Lenght inside HPC delta Z
Vent line A 2.10 0.22 0
Vent line B 2.43 0.22 0
Sump Line A 3.20 0.43 0.21
Sump line B 3.26 0.43 0.21

Gru
pp
o R
icer
ca N
ucl
eare
S. P
iero
a G
rad
o
OSU-MASLWR VS TRACE MODEL
PD CALIBRATION
�The value of roughness used in the hydraulic component is 5.0E-6 m.
�In order to estimate the k loss coefficient different options have been used. �For an abrupt expansion the Borda-Carnot loss coefficient
has been used:
27
Fourth Workshop for the ICSP on Integral Water Cooled Reactor Designs, Pisa 25-28 February 2013, Italy
2
1
1
−=
+j
j
A
AK
�For an abrupt contraction a table for
= +
j
j
A
AKK
1
has been used

Gru
pp
o R
icer
ca N
ucl
eare
S. P
iero
a G
rad
o
OSU-MASLWR VS TRACE MODEL
PD CALIBRATIONConsidering the mass flow rate of the OSU-MASLWR-002 [core power
80kW – 160 kW ] a sensitivity analysis of the core pressure drop has
been performed in order to have a comparable mass flow rate during its
simulation.
28
Fourth Workshop for the ICSP on Integral Water Cooled Reactor Designs, Pisa 25-28 February 2013, Italy
The resulting k coefficients
in the core region have
been used for the
simulation of the
ICSP test 1.
This is only a preliminary
analysis.
More Detail analysis is
required for the pressure
drop evaluation.

Gru
pp
o R
icer
ca N
ucl
eare
S. P
iero
a G
rad
o
OSU MASLWR- TEST FACILITY PROCESS
AND INSTRUMENTATION DIAGRAM
Fourth Workshop for the ICSP on Integral Water Cooled Reactor Designs, Pisa 25-28 February 2013, Italy
29
Gru
pp
o R
icer
ca N
ucl
eare
S. P
iero
a G
rad
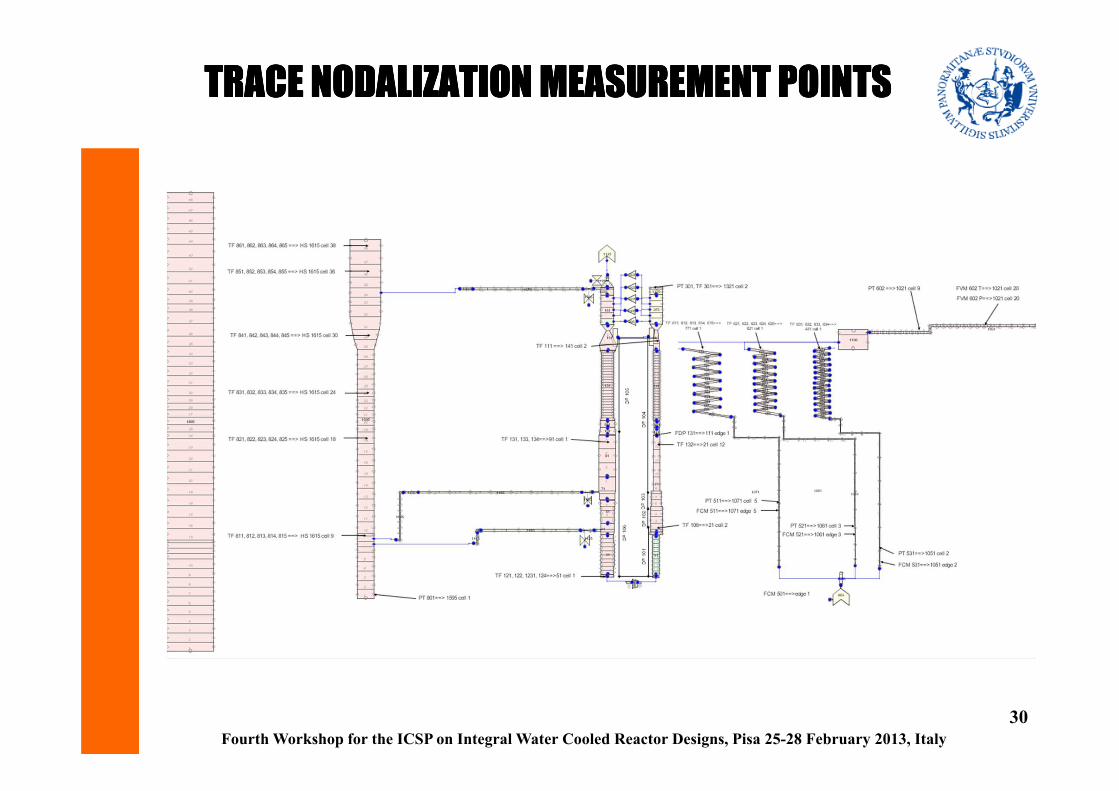
oTRACE NODALIZATION MEASUREMENT POINTSTRACE NODALIZATION MEASUREMENT POINTSTRACE NODALIZATION MEASUREMENT POINTSTRACE NODALIZATION MEASUREMENT POINTS
30
Fourth Workshop for the ICSP on Integral Water Cooled Reactor Designs, Pisa 25-28 February 2013, Italy

Gru
pp
o R
icer
ca N
ucl
eare
S. P
iero
a G
rad
oTRACE NODALIZATION MEASUREMENT POINTSTRACE NODALIZATION MEASUREMENT POINTSTRACE NODALIZATION MEASUREMENT POINTSTRACE NODALIZATION MEASUREMENT POINTS
31
Fourth Workshop for the ICSP on Integral Water Cooled Reactor Designs, Pisa 25-28 February 2013, Italy
Facility instrumentation TRACE model measurement points
PT 301 1325 cell 2
TF 121, 122, 123, 124 51 cell 1
TF 106 21 cell 2
FDP 131 111 edge 1
TF 111 141 cell 2
TF 131, 133, 134 91 cell 1
DP 101 [RV 101-102] cb22 [1 cell 1 - 21 cell 2]
DP 102 [RV102- 103] cb 23 [21 cell 2- 21 cell 5]
DP 103 [RV 103 104] cb24 [21 cell 5 - 21 cell 8]
DP 104 [RV 104 108] cb 25 [21 cell 8 - 141 cell 2]
DP 105 [RV 105 108] cb55 [141 cell 2 - 101 cell 1]
DP 106 [RV 101 105] cb56 [101 cell 1 - 1 cell 1]
LDP 301 cb12
LDP 106 cb18
FCM 511 1071 edge 5
FCM 521 1061 edge 3
FCM 531 1051 edge 2
PT 511 1071 cell 5
PT 521 1061 cell 3
PT 531 1051 cell 2
TF 611, 612, 613, 614, 615 771 cell 1
TF 621, 622, 623, 624, 625 621 cell 1
TF 631, 632, 633, 634 431 cell 1
FVM 602 T 1021 cell 20
FVM 602 P 1021 cell 20
Secondary steam superheat cb30
Facility instrumentation TRACE model measurement points
FMM-501 1315 edge 1
TLN 501 1315 cell 1
PCS-106 A Flow 1585 edge 2
PCS-106 B Flow 961 edge 2
PCS-108 A Flow 1425 edge 2
PCS-108 B Flow 1001 edge 2
Total primary mass Cb 21
Void Fraction (Core Outlet) 21 cell 2
Void Fraction (Upper Plenum Bottom)
141 cell 1
Primary Void Fraction (SG Inlet)
151 cell 3
Primary Void Fraction (SG outlet)
861 cell 1
Heat Transfer (Core Rod)
905
Core power Heat structure 915
Heat Transfer (SG - Primary to Secondary)
Heat strctures 781(single coil)-441
Heat structures 781, 791, 801 (three equivalent coil)
441
Heat Transfer (Across Chimney - Hot to Cold Leg)
Heat strctures 831+821+823
Heat Losses Cb2
TF 811, 821, 831, 841, 851,861 1595 cell 9, 18, 24, 30, 36,
38
TF 812, 822, 832, 842, 852, 862
1615 A9, 18,24,30,36,38
R02
TF 813, 823, 833, 843, 853, 863
1615 A9, 18,24,30,36,38
R03
TF 814, 824, 834, 844, 854, 864
1615 A9, 18,24,30,36,38
R04
TF 815, 825, 835, 845, 855, 865
1605 cell 14, 23, 29, 35, 31,
43
PT 801 1595 cell 1
Gru
pp
o R
icer
ca N
ucl
eare
S. P
iero
a G
rad
oICSP TEST 2
�In order to improve the results of the TRACE ICSP test 2 calculated data, few modifications have been implemented in the input deck. �An increase of the heat losses;
�A better fitting of the SG secondary side outlet pressure, that is considered as a BIC
�The control of the SG outlet temperature during the steady state phase has been implemented as well.
�The SG outlet pressure, the SG inlet pressure, the SG inlet temperature and the SG mass flow rate are imposed as BIC. Considering the availability of the experimental data a revision of these BIC has been implemented during the OPEN case.
32
Fourth Workshop for the ICSP on Integral Water Cooled Reactor Designs, Pisa 25-28 February 2013, Italy

Gru
pp
o R
icer
ca N
ucl
eare
S. P
iero
a G
rad
oICSP TEST2 ANALYSES PERFORMED
33
Fourth Workshop for the ICSP on Integral Water Cooled Reactor Designs, Pisa 25-28 February 2013, Italy
BL
IND
PH
AS
E
ID
Calculation
Variation from reference
calculation
Target of the
sensitivity
analyses
Results of the
sensitivity analyses
REF2
BLIND
Reference BLIND PHASE
calculation
REF It is not considered the delay of the
logic
There isn’t sensible
difference with the
results of the REF2
case considering a
contemporary action
of the valve 106 A
and B, 108 A and B
when the difference of
pressure between the
RPV and the HPC is
0.034 Pa
SEN1 Change the control of the FW mass
flow rate, during the steady state
phase, in order to have an hotter
primary side condition with respect
to the ICSP specification
Show the effect
of the initial
condition on the
cycling phase
characterizing
the transient
An increase of the
cycling region has
been predicted by the
code
SEN2 Change the control of the FW mass
flow rate, during the steady state
phase, in order to have a colder
primary side condition with respect
to the ICSP specification
Show the effect
of the initial
condition on the
cycling phase
characterizing
the transient
A decrease of the
cycling region has
been predicted by the
code
SEN4 Increase of the heat losses of the
facility
Show the effect
of the heat losses
in the transient
A general reduction of
the cycling phase is
predicted by the code.
The primary system
shows a faster
depressurization as it
is expected.
SEN5 Decrease of the k coefficient of the
PCS 106 A
Show the effect
of the k
coefficient in the
transient
A variation of the
HPC pressure
behavior is observed
SEN6 Increase of the k coefficient of the
PCS 106 A
Show the effect
of the k
coefficient in the
transient
A variation of the
HPC pressure
behavior is observed
2C Divide the HPC in two thermal
hydraulic regions
Allow the
potential natural
circulation
convetion
phenomena
The thermal
stratification in the
HPC is influenced
OP
EN
PH
AS
E OPEN Reference OPEN PHASE
calculation
Gru
pp
o R
icer
ca N
ucl
eare
S. P
iero
a G
rad
oINITIAL CONDITION FOR THE ICSP TEST INITIAL CONDITION FOR THE ICSP TEST INITIAL CONDITION FOR THE ICSP TEST INITIAL CONDITION FOR THE ICSP TEST 2222
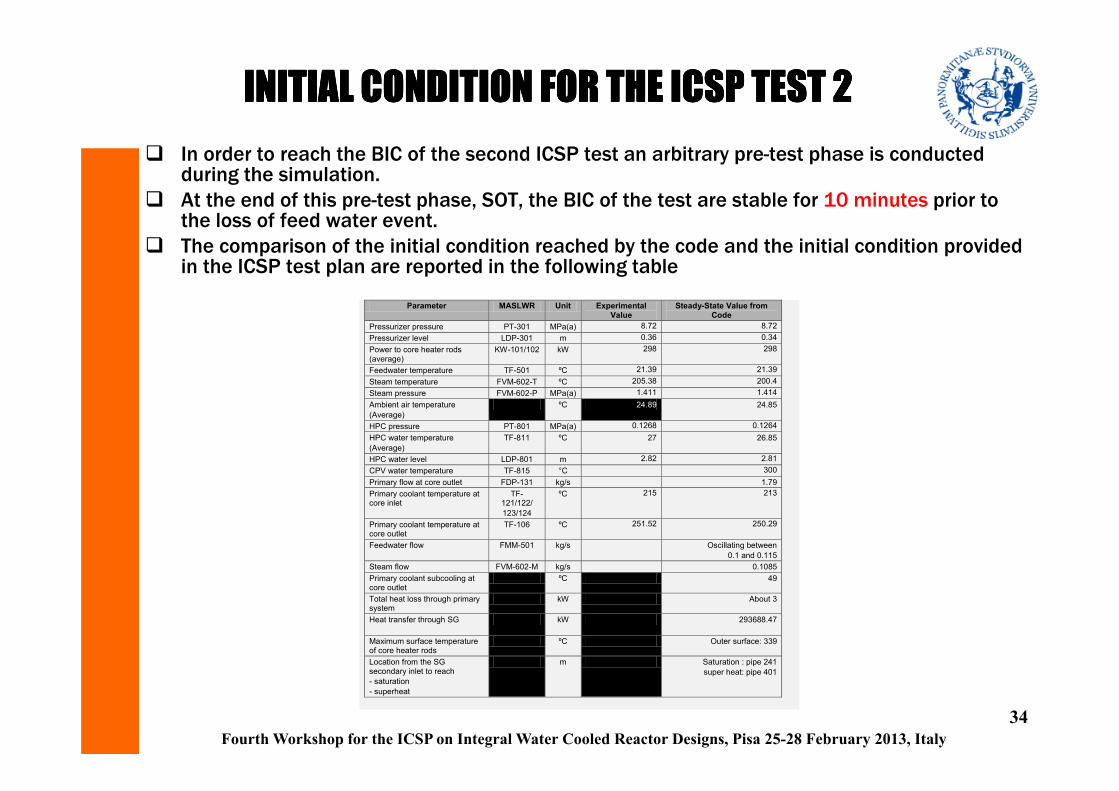
� In order to reach the BIC of the second ICSP test an arbitrary pre-test phase is conducted during the simulation.
� At the end of this pre-test phase, SOT, the BIC of the test are stable for 10 minutes prior to the loss of feed water event.
� The comparison of the initial condition reached by the code and the initial condition provided in the ICSP test plan are reported in the following table
34
Fourth Workshop for the ICSP on Integral Water Cooled Reactor Designs, Pisa 25-28 February 2013, Italy
Parameter MASLWR Unit Experimental Value
Steady-State Value from Code
Pressurizer pressure PT-301 MPa(a) 8.72 8.72
Pressurizer level LDP-301 m 0.36 0.34
Power to core heater rods (average)
KW-101/102 kW 298 298
Feedwater temperature TF-501 ºC 21.39 21.39
Steam temperature FVM-602-T ºC 205.38 200.4
Steam pressure FVM-602-P MPa(a) 1.411 1.414
Ambient air temperature
(Average)
ºC 24.89 24.85
HPC pressure PT-801 MPa(a) 0.1268 0.1264
HPC water temperature
(Average)
TF-811 ºC 27 26.85
HPC water level LDP-801 m 2.82 2.81
CPV water temperature TF-815 °C 300
Primary flow at core outlet FDP-131 kg/s 1.79
Primary coolant temperature at core inlet
TF- 121/122/
123/124
ºC 215 213
Primary coolant temperature at core outlet
TF-106 ºC 251.52 250.29
Feedwater flow FMM-501 kg/s Oscillating between
0.1 and 0.115
Steam flow FVM-602-M kg/s 0.1085
Primary coolant subcooling at core outlet
ºC 49
Total heat loss through primary system
kW About 3
Heat transfer through SG kW 293688.47
Maximum surface temperature of core heater rods
ºC Outer surface: 339
Location from the SG secondary inlet to reach
- saturation
- superheat
m Saturation : pipe 241
super heat: pipe 401

Gru
pp
o R
icer
ca N
ucl
eare
S. P
iero
a G
rad
o
FACILITY CONFIGURATION BEFORE
THE SOT OF THE TEST 2
35
Fourth Workshop for the ICSP on Integral Water Cooled Reactor Designs, Pisa 25-28 February 2013, Italy
System Facility
Operati
on
TRACE Model
Operation
Note
Core Heaters ON ON
PRZ Heaters ON ON
It is defined a table in order to control
the primary pressure
Independent variable = PRZ pressure
Dependent variable = PRZ heater
power
In order to
maintain the
primary pressure
set-point
Containment
Heaters
OFF OFF -
Feed water ON ON
It is defined a table in order to control
the outlet SG temperature
Independent variable = outlet SG
temperature Dependent variable =
feed water mass flow rate
In order to
remove the net
primary power
[primary power
less ambient
losses]
Main feed
water pump
ON
Charging
pump
OFF - -

Gru
pp
o R
icer
ca N
ucl
eare
S. P
iero
a G
rad
o
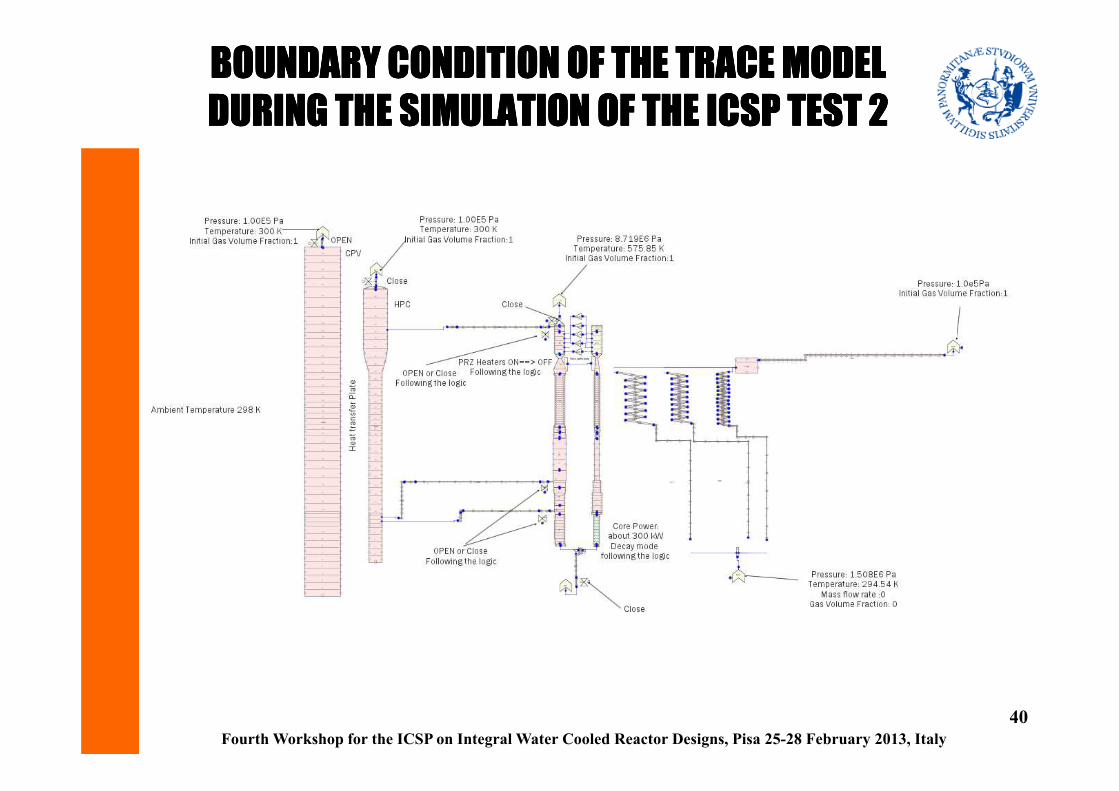
BOUNDARY CONDITION OF THE TRACE MODEL
DURING THE PRE-TEST PHASE OF THE ICSP TEST 2
36
Fourth Workshop for the ICSP on Integral Water Cooled Reactor Designs, Pisa 25-28 February 2013, Italy
Gru
pp
o R
icer
ca N
ucl
eare
S. P
iero
a G
rad
o
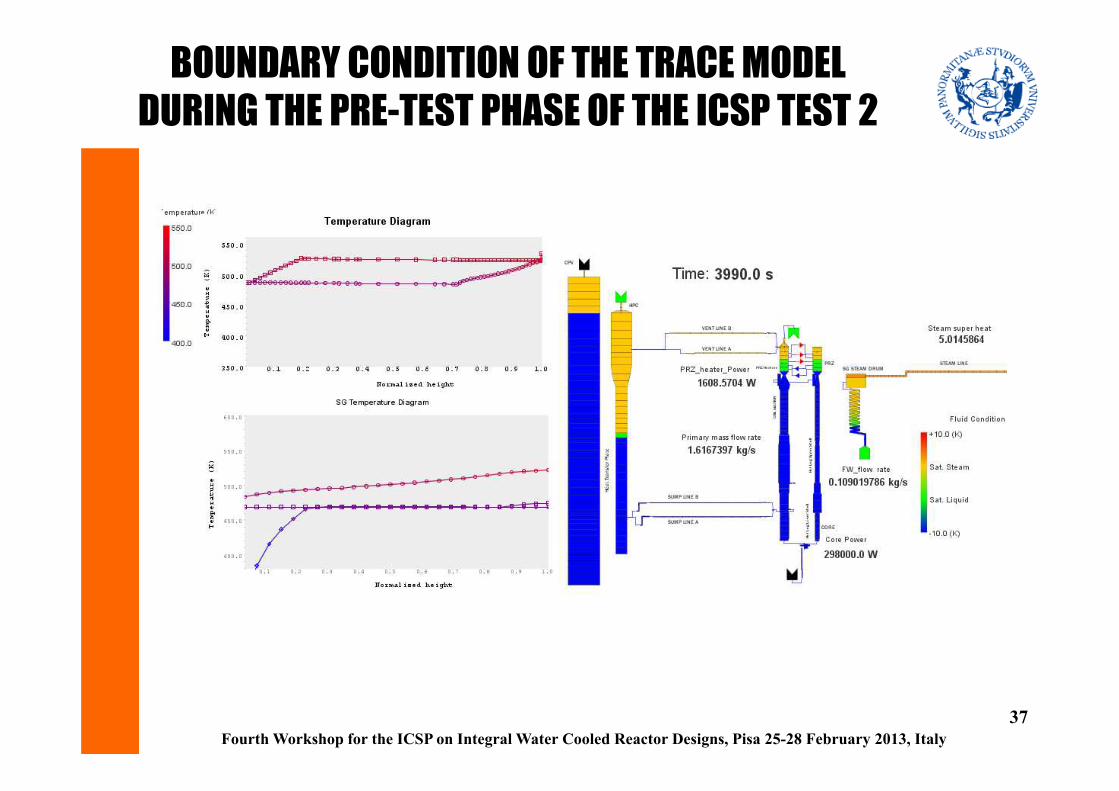
BOUNDARY CONDITION OF THE TRACE MODEL
DURING THE PRE-TEST PHASE OF THE ICSP TEST 2
37
Fourth Workshop for the ICSP on Integral Water Cooled Reactor Designs, Pisa 25-28 February 2013, Italy

Gru
pp
o R
icer
ca N
ucl
eare
S. P
iero
a G
rad
oTEST TEST TEST TEST 2 2 2 2 PROCEDUREPROCEDUREPROCEDUREPROCEDURE
� The test 2 involves a loss of FW transient with subsequent automatic depressurization system actuation and long term cooling.
38
Fourth Workshop for the ICSP on Integral Water Cooled Reactor Designs, Pisa 25-28 February 2013, Italy
Time Facility Operation
0 (SOT) Start of simulation – steady state
(start of data collection)
De-energize PZR heaters
Once the transient has begun, the
pressurizer heaters are manually
deenergized.
Event 1 Stop MFP
Shut HPC vent valve SV – 800
Event 2 PZR pressure (PT-301) reaches 9.064 MPa(a) (1300 psig)
Enter decay power mode
~ 30 s
Event 3 Open ADS vent valve (PCS-106A) Major procedural change was that the
blowdown began 18 seconds after the
decay power was initiated at 1300 psig
instead of waiting until the pressure had
risen to 1350 psig.
Event 4 Different actions take place following the condition reported in the table 3-4.
Record opening and closing times for PCS-106A
Event 5 Start long-term cooling when pressure difference between primary system and
HPC (PT-301 minus PT-801) becomes less than 5 psi (0.034 MPa)
Open and remain open of PCS-106A and PCS-106B
Open and remain open of PCS-108A and PCS-108B
Event 6 End of test when one of the following conditions is reached:
- PZR pressure ≤ 0.135 MPa(a) (5 psig)
- Primary coolant temperature (TF-132) ≤ 35 ºC (95 ºF)
- 24 hours have elapsed
PT 801 indicating Pressure PCS 106 A SV-800250 psig SHUT SHUT
275 psig SHUT OPEN
200 psig OPEN SHUT
Gru
pp
o R
icer
ca N
ucl
eare
S. P
iero
a G
rad
o
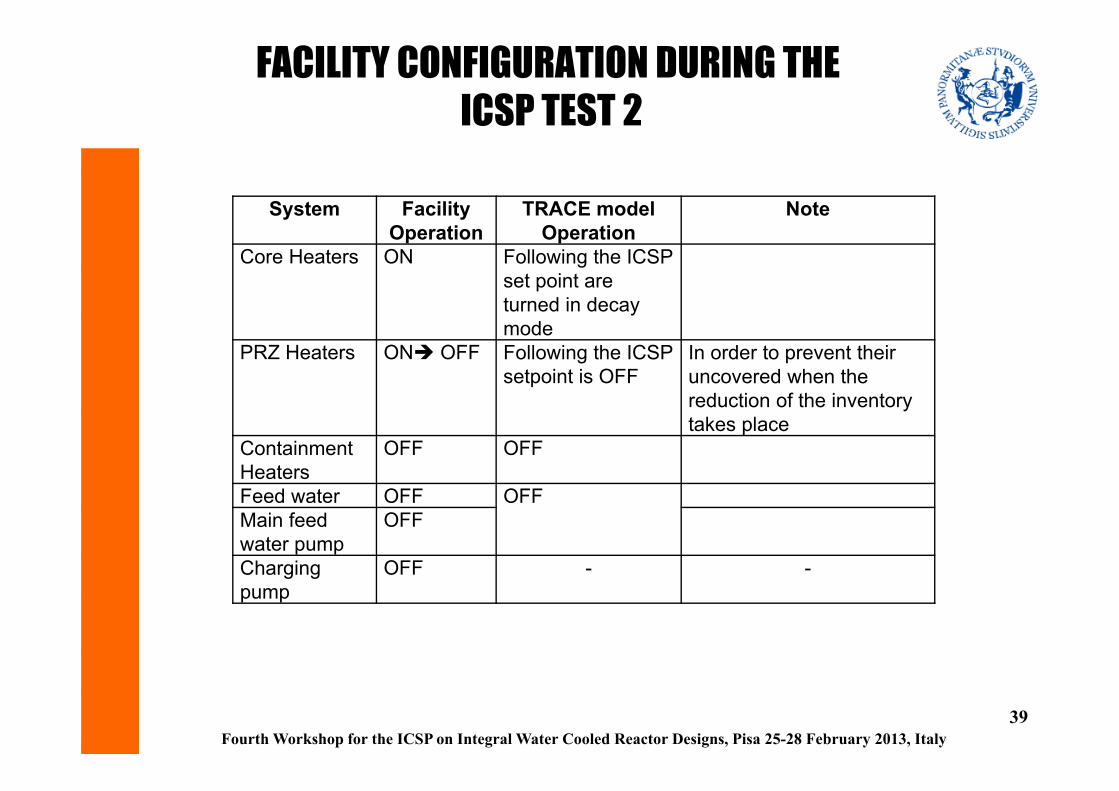
FACILITY CONFIGURATION DURING THE
ICSP TEST 2
39
Fourth Workshop for the ICSP on Integral Water Cooled Reactor Designs, Pisa 25-28 February 2013, Italy
System Facility
Operation
TRACE model
Operation
Note
Core Heaters ON Following the ICSP
set point are
turned in decay
mode
PRZ Heaters ON� OFF Following the ICSP
setpoint is OFF
In order to prevent their
uncovered when the
reduction of the inventory
takes place
Containment
Heaters
OFF OFF
Feed water OFF OFF
Main feed
water pump
OFF
Charging
pump
OFF - -
Gru
pp
o R
icer
ca N
ucl
eare
S. P
iero
a G
rad
o
BOUNDARY CONDITION OF THE TRACE MODEL BOUNDARY CONDITION OF THE TRACE MODEL BOUNDARY CONDITION OF THE TRACE MODEL BOUNDARY CONDITION OF THE TRACE MODEL
DURING THE SIMULATION OF THE ICSP TEST DURING THE SIMULATION OF THE ICSP TEST DURING THE SIMULATION OF THE ICSP TEST DURING THE SIMULATION OF THE ICSP TEST 2222
40
Fourth Workshop for the ICSP on Integral Water Cooled Reactor Designs, Pisa 25-28 February 2013, Italy

Gru
pp
o R
icer
ca N
ucl
eare
S. P
iero
a G
rad
o
ICSP TEST 2
EVENT SEQUENCE
41
Fourth Workshop for the ICSP on Integral Water Cooled Reactor Designs, Pisa 25-28 February 2013, Italy

Gru
pp
o R
icer
ca N
ucl
eare
S. P
iero
a G
rad
o
42
Fourth Workshop for the ICSP on Integral Water Cooled Reactor Designs, Pisa 25-28 February 2013, Italy

Gru
pp
o R
icer
ca N
ucl
eare
S. P
iero
a G
rad
oANALYSES OF THE ICSP TEST 2
�At the SOT a At the SOT a At the SOT a At the SOT a loss of feed water loss of feed water loss of feed water loss of feed water event takes placeevent takes placeevent takes placeevent takes place
�Since the energy removing capacity of the secondary Since the energy removing capacity of the secondary Since the energy removing capacity of the secondary Since the energy removing capacity of the secondary side tends to zero a primary pressure increase takes side tends to zero a primary pressure increase takes side tends to zero a primary pressure increase takes side tends to zero a primary pressure increase takes place. place. place. place.
�When the primary pressure reaches the value of When the primary pressure reaches the value of When the primary pressure reaches the value of When the primary pressure reaches the value of 9.064 9.064 9.064 9.064 MPaMPaMPaMPa the core heaters are turned in the core heaters are turned in the core heaters are turned in the core heaters are turned in decay decay decay decay modemodemodemode following the experimental data disclosed in following the experimental data disclosed in following the experimental data disclosed in following the experimental data disclosed in the blind ICSP phase specification the blind ICSP phase specification the blind ICSP phase specification the blind ICSP phase specification
((((BLIND: BLIND: BLIND: BLIND: 26 s - OPEN:42s after the SOT).).).).
�The valve PCS The valve PCS The valve PCS The valve PCS 106 106 106 106 A opens A opens A opens A opens (BLIND: 44 s - OPEN: 59 s after the SOT) and a and a and a and a bowdownbowdownbowdownbowdown takes place. takes place. takes place. takes place.
�The primary and HPC pressure starts a The primary and HPC pressure starts a The primary and HPC pressure starts a The primary and HPC pressure starts a process of process of process of process of equalizationequalizationequalizationequalization
43
Fourth Workshop for the ICSP on Integral Water Cooled Reactor Designs, Pisa 25-28 February 2013, Italy

Gru
pp
o R
icer
ca N
ucl
eare
S. P
iero
a G
rad
oANALYSES OF THE ICSP TEST 2
�Chocked flow phenomena Chocked flow phenomena Chocked flow phenomena Chocked flow phenomena takes place in the vent line Atakes place in the vent line Atakes place in the vent line Atakes place in the vent line A
�A rapid increase of the HPC pressure takes place. The A rapid increase of the HPC pressure takes place. The A rapid increase of the HPC pressure takes place. The A rapid increase of the HPC pressure takes place. The volume of the HPC is filled with steam condensing in the volume of the HPC is filled with steam condensing in the volume of the HPC is filled with steam condensing in the volume of the HPC is filled with steam condensing in the containment wall transferring energy to the CPVcontainment wall transferring energy to the CPVcontainment wall transferring energy to the CPVcontainment wall transferring energy to the CPV
�At BLIND: At BLIND: At BLIND: At BLIND: 125 125 125 125 s s s s –––– OPEN OPEN OPEN OPEN 134 134 134 134 s s s s after the SOT the valve after the SOT the valve after the SOT the valve after the SOT the valve PCS PCS PCS PCS 106 106 106 106 A, starts to A, starts to A, starts to A, starts to cyclingcyclingcyclingcycling following the logic actuation following the logic actuation following the logic actuation following the logic actuation of the table of the table of the table of the table 3333----4444. . . . InfactInfactInfactInfact ,,,,
between between between between BLIND: BLIND: BLIND: BLIND: 125125125125----4062 4062 4062 4062 s s s s –––– OPEN OPEN OPEN OPEN 134134134134----4039 4039 4039 4039 ssss, the , the , the , the
HPC pressure oscillates but never reach the HPC pressure oscillates but never reach the HPC pressure oscillates but never reach the HPC pressure oscillates but never reach the setpointsetpointsetpointsetpoint of of of of
275 275 275 275 psig.psig.psig.psig.
44
Fourth Workshop for the ICSP on Integral Water Cooled Reactor Designs, Pisa 25-28 February 2013, Italy

Gru
pp
o R
icer
ca N
ucl
eare
S. P
iero
a G
rad
o
ANALYSES OF THE ICSP TEST 2
Long term phase
� BLIND: BLIND: BLIND: BLIND: 4062 4062 4062 4062 s s s s ---- OPEN :OPEN :OPEN :OPEN :4039 4039 4039 4039 s after s after s after s after the SOT the pressure the SOT the pressure the SOT the pressure the SOT the pressure differences between the primary side and the HPC is less than differences between the primary side and the HPC is less than differences between the primary side and the HPC is less than differences between the primary side and the HPC is less than 0.034 0.034 0.034 0.034 MPaMPaMPaMPa, therefore the valve PCS , therefore the valve PCS , therefore the valve PCS , therefore the valve PCS 106 106 106 106 A stays permanently open.A stays permanently open.A stays permanently open.A stays permanently open.
� The valves PCS The valves PCS The valves PCS The valves PCS 106 106 106 106 B (BLIND B (BLIND B (BLIND B (BLIND 4152415241524152ssss---- OPEN OPEN OPEN OPEN 4129412941294129s after the SOT), s after the SOT), s after the SOT), s after the SOT), PCS PCS PCS PCS 108 108 108 108 A (BLIND A (BLIND A (BLIND A (BLIND 4154 4154 4154 4154 ssss----OPEN OPEN OPEN OPEN 4131413141314131s after the SOT) and B s after the SOT) and B s after the SOT) and B s after the SOT) and B (BLIND:(BLIND:(BLIND:(BLIND:4155415541554155s s s s ---- OPEN OPEN OPEN OPEN 4132413241324132s after the SOT) s after the SOT) s after the SOT) s after the SOT) stay permanently open stay permanently open stay permanently open stay permanently open permitting the permitting the permitting the permitting the refill of the primary side and the long term cooling refill of the primary side and the long term cooling refill of the primary side and the long term cooling refill of the primary side and the long term cooling phenomenology typical of the MASLWR designphenomenology typical of the MASLWR designphenomenology typical of the MASLWR designphenomenology typical of the MASLWR design
� During the long term cooling the During the long term cooling the During the long term cooling the During the long term cooling the vapor produced in the core goes in vapor produced in the core goes in vapor produced in the core goes in vapor produced in the core goes in the upper part of the facility and through the vent valve goes to the the upper part of the facility and through the vent valve goes to the the upper part of the facility and through the vent valve goes to the the upper part of the facility and through the vent valve goes to the HPC where it is condensed. HPC where it is condensed. HPC where it is condensed. HPC where it is condensed. At this point through the sump line the At this point through the sump line the At this point through the sump line the At this point through the sump line the fluid goes to the core again. fluid goes to the core again. fluid goes to the core again. fluid goes to the core again.
� At the end of the test At the end of the test At the end of the test At the end of the test (15814 s after the SOT) the primary pressure the primary pressure the primary pressure the primary pressure is at about is at about is at about is at about BLIND: BLIND: BLIND: BLIND: 0.6 0.6 0.6 0.6 MpaMpaMpaMpa----OPEN:OPEN:OPEN:OPEN:0.52 0.52 0.52 0.52 MpaMpaMpaMpa....
45
Fourth Workshop for the ICSP on Integral Water Cooled Reactor Designs, Pisa 25-28 February 2013, Italy

Gru
pp
o R
icer
ca N
ucl
eare
S. P
iero
a G
rad
o
ANALYSES OF THE ICSP TEST 2
LONG TERM COOLING TYPICAL OF THE MASLWR
46
Fourth Workshop for the ICSP on Integral Water Cooled Reactor Designs, Pisa 25-28 February 2013, Italy
Loss of feed water
When Primary P = 9.064
MPa:
Core decay mode
PCS 106 A open
Start of the Blowdown
When the pressure differences between
the RPV and HPS is less than 0.034
PCS 106 A and B and PCS 108 A nad B
stay permanently open
During the long term cooling the vapor
produced in the core goes in the upper
part of the facility and through the vent
valve goes to the HPC where it is
condensed. At this point through the
sump line the fluid go to the core again.

Gru
pp
o R
icer
ca N
ucl
eare
S. P
iero
a G
rad
o
ANALYSES OF THE ICSP TEST 2
Blowdown; Break Flow; Cycling Phase.
47
Fourth Workshop for the ICSP on Integral Water Cooled Reactor Designs, Pisa 25-28 February 2013, Italy

Gru
pp
o R
icer
ca N
ucl
eare
S. P
iero
a G
rad
o
ANALYSES OF THE ICSP TEST 2
Blowdown; Break Flow; Cycling Phase.
�The primary pressure behaviour is well predicted by the TRACE code.
�Four different phases could be identify:
�Primary pressure peak phase, �Blowdown phase, �Valve cycling phase and �Long term cooling phase.
�The The The The open calculation results show a more accurate open calculation results show a more accurate open calculation results show a more accurate open calculation results show a more accurate primary pressure primary pressure primary pressure primary pressure behaviorbehaviorbehaviorbehavior prediction; this is related prediction; this is related prediction; this is related prediction; this is related to an increase of the heat losses of the RPV TRACE to an increase of the heat losses of the RPV TRACE to an increase of the heat losses of the RPV TRACE to an increase of the heat losses of the RPV TRACE modelmodelmodelmodel
48
Fourth Workshop for the ICSP on Integral Water Cooled Reactor Designs, Pisa 25-28 February 2013, Italy

Gru
pp
o R
icer
ca N
ucl
eare
S. P
iero
a G
rad
o
ANALYSES OF THE ICSP TEST 2
Blowdown; Break Flow; Cycling Phase.
49
Fourth Workshop for the ICSP on Integral Water Cooled Reactor Designs, Pisa 25-28 February 2013, Italy
� The oscillation of the primary pressure
is well predicted by the TRACE code
and its length is in general depended
from
� the steady state conditions before
the SOT (for example the way to
control the feed water mass flow
rate before the SOT can influence
the fluid condition of the facility
before the SOT) and
� the heat losses of the facility
as it is shown from the sensitivity
analyses performed in the BLIND
phase of the ICSP.

Gru
pp
o R
icer
ca N
ucl
eare
S. P
iero
a G
rad
o
ANALYSES OF THE ICSP TEST 2
Blowdown; Break Flow; Cycling Phase.
50
Fourth Workshop for the ICSP on Integral Water Cooled Reactor Designs, Pisa 25-28 February 2013, Italy
PCS106 A
PCS106 B

Gru
pp
o R
icer
ca N
ucl
eare
S. P
iero
a G
rad
o
ANALYSES OF THE ICSP TEST 2
Blowdown; Break Flow; Cycling Phase.
51
Fourth Workshop for the ICSP on Integral Water Cooled Reactor Designs, Pisa 25-28 February 2013, Italy
PCS108 A
PCS108 B
Gru
pp
o R
icer
ca N
ucl
eare
S. P
iero
a G
rad
o
ANALYSES OF THE ICSP TEST 2
Blowdown; Break Flow; Cycling Phase.
�TTTThe expected behavior of the vent and sump recirculation valves are predicted by the code.
�The behavior of the PCS 106 A, is characterized by an oscillating mass flow rate due to the valve cycling and a long term cooling mass flow rate behavior.
�The PCS 106 B is characterized by a first mass flow ratepeak, when the valves is opened, and a long termcooling phase mass flow rate; no oscillation are presentfor these valves.
�The PCS 108A/B are characterized by a first mass flow rate direction change with consequent mass flow rate peak and an long term cooling phase mass flow rate behavior
52
Fourth Workshop for the ICSP on Integral Water Cooled Reactor Designs, Pisa 25-28 February 2013, Italy

Gru
pp
o R
icer
ca N
ucl
eare
S. P
iero
a G
rad
o
ANALYSES OF THE ICSP TEST 2
Natural Circulation Phenomena
53
Fourth Workshop for the ICSP on Integral Water Cooled Reactor Designs, Pisa 25-28 February 2013, Italy

Gru
pp
o R
icer
ca N
ucl
eare
S. P
iero
a G
rad
o
ANALYSES OF THE ICSP TEST 2
Natural Circulation Phenomena
54
Fourth Workshop for the ICSP on Integral Water Cooled Reactor Designs, Pisa 25-28 February 2013, Italy

Gru
pp
o R
icer
ca N
ucl
eare
S. P
iero
a G
rad
o
ANALYSES OF THE ICSP TEST 2
Natural Circulation Phenomena
55
The core outlet and the The core outlet and the The core outlet and the The core outlet and the average inlet temperature, average inlet temperature, average inlet temperature, average inlet temperature, are predicted by the code. are predicted by the code. are predicted by the code. are predicted by the code.
A decrease of the inlet core A decrease of the inlet core A decrease of the inlet core A decrease of the inlet core temperature is temperature is temperature is temperature is experimentally observed experimentally observed experimentally observed experimentally observed when the refill of the core when the refill of the core when the refill of the core when the refill of the core takes place. takes place. takes place. takes place.
During the simulation the During the simulation the During the simulation the During the simulation the decrease of the inlet decrease of the inlet decrease of the inlet decrease of the inlet temperature is not observed temperature is not observed temperature is not observed temperature is not observed and, as it is observed by the and, as it is observed by the and, as it is observed by the and, as it is observed by the analysis of the delta T core, a analysis of the delta T core, a analysis of the delta T core, a analysis of the delta T core, a difference of temperature is difference of temperature is difference of temperature is difference of temperature is always present though minor always present though minor always present though minor always present though minor from a quantitative point of from a quantitative point of from a quantitative point of from a quantitative point of view.view.view.view.
This could be related to the This could be related to the This could be related to the This could be related to the mono dimensional model of mono dimensional model of mono dimensional model of mono dimensional model of the downthe downthe downthe down----comer causing a comer causing a comer causing a comer causing a general mixing of the water in general mixing of the water in general mixing of the water in general mixing of the water in the volumesthe volumesthe volumesthe volumes. A fine three. A fine three. A fine three. A fine three----dimensional model of the dimensional model of the dimensional model of the dimensional model of the entire RPV could improve the entire RPV could improve the entire RPV could improve the entire RPV could improve the quantitative prediction of quantitative prediction of quantitative prediction of quantitative prediction of these parameters.these parameters.these parameters.these parameters.
Fourth Workshop for the ICSP on Integral Water Cooled Reactor Designs, Pisa 25-28 February 2013, Italy

Gru
pp
o R
icer
ca N
ucl
eare
S. P
iero
a G
rad
o
ANALYSES OF THE ICSP TEST 2
Natural Circulation Phenomena
56
Fourth Workshop for the ICSP on Integral Water Cooled Reactor Designs, Pisa 25-28 February 2013, Italy
As it is expected the primary
temperature behavior is
dependent from the heat
losses of the facility
(BLIND SENSITIVITY ANALYSYS)

Gru
pp
o R
icer
ca N
ucl
eare
S. P
iero
a G
rad
o
ANALYSES OF THE ICSP TEST 2
Natural Circulation Phenomena
57
Fourth Workshop for the ICSP on Integral Water Cooled Reactor Designs, Pisa 25-28 February 2013, Italy

Gru
pp
o R
icer
ca N
ucl
eare
S. P
iero
a G
rad
oANALYSES OF THE ICSP TEST 2
58
Fourth Workshop for the ICSP on Integral Water Cooled Reactor Designs, Pisa 25-28 February 2013, Italy
In relation to the RPV and PRZ In relation to the RPV and PRZ In relation to the RPV and PRZ In relation to the RPV and PRZ level, the results of the calculated level, the results of the calculated level, the results of the calculated level, the results of the calculated data show a general agreement data show a general agreement data show a general agreement data show a general agreement with the experimental data. with the experimental data. with the experimental data. with the experimental data.
The core, as in the experimental The core, as in the experimental The core, as in the experimental The core, as in the experimental data, data, data, data, is never uncoveredis never uncoveredis never uncoveredis never uncovered. . . .
The oscillation phase and the refill The oscillation phase and the refill The oscillation phase and the refill The oscillation phase and the refill phase phase phase phase are are are are predicted by the code. In predicted by the code. In predicted by the code. In predicted by the code. In both the simulations, both the simulations, both the simulations, both the simulations, BLIND and BLIND and BLIND and BLIND and OPEN, an underestimation of the OPEN, an underestimation of the OPEN, an underestimation of the OPEN, an underestimation of the RPV refill level rise is observedRPV refill level rise is observedRPV refill level rise is observedRPV refill level rise is observed, , , , therefore an underestimation of the therefore an underestimation of the therefore an underestimation of the therefore an underestimation of the long term core cooling phase RPV long term core cooling phase RPV long term core cooling phase RPV long term core cooling phase RPV level is observed.level is observed.level is observed.level is observed.
PRZ level
RPV level

Gru
pp
o R
icer
ca N
ucl
eare
S. P
iero
a G
rad
oANALYSES OF THE ICSP TEST 2
59
Fourth Workshop for the ICSP on Integral Water Cooled Reactor Designs, Pisa 25-28 February 2013, Italy
As it is expected the primary level behavior is dependent
from the heat losses of the facility
(BLIND SENSITIVITY ANALYSES)

Gru
pp
o R
icer
ca N
ucl
eare
S. P
iero
a G
rad
o
Thermo-fluid dynamics and pressure drops in various
geometrical configurations
60
Fourth Workshop for the ICSP on Integral Water Cooled Reactor Designs, Pisa 25-28 February 2013, Italy
�Cycling behavior
�Long term behavior
The analyses of the
BLIND/OPEN pressure
drop calculated data
show a general
underestimation in
comparison with the
experimental data.
More instrumentation
information’s are
necessary in order to
characterize these
differences.

Gru
pp
o R
icer
ca N
ucl
eare
S. P
iero
a G
rad
o
ANALYSES OF THE ICSP TEST 2
SECONDARY SIDE BEHAVIOR
61
Fourth Workshop for the ICSP on Integral Water Cooled Reactor Designs, Pisa 25-28 February 2013, Italy
Gru
pp
o R
icer
ca N
ucl
eare
S. P
iero
a G
rad
o
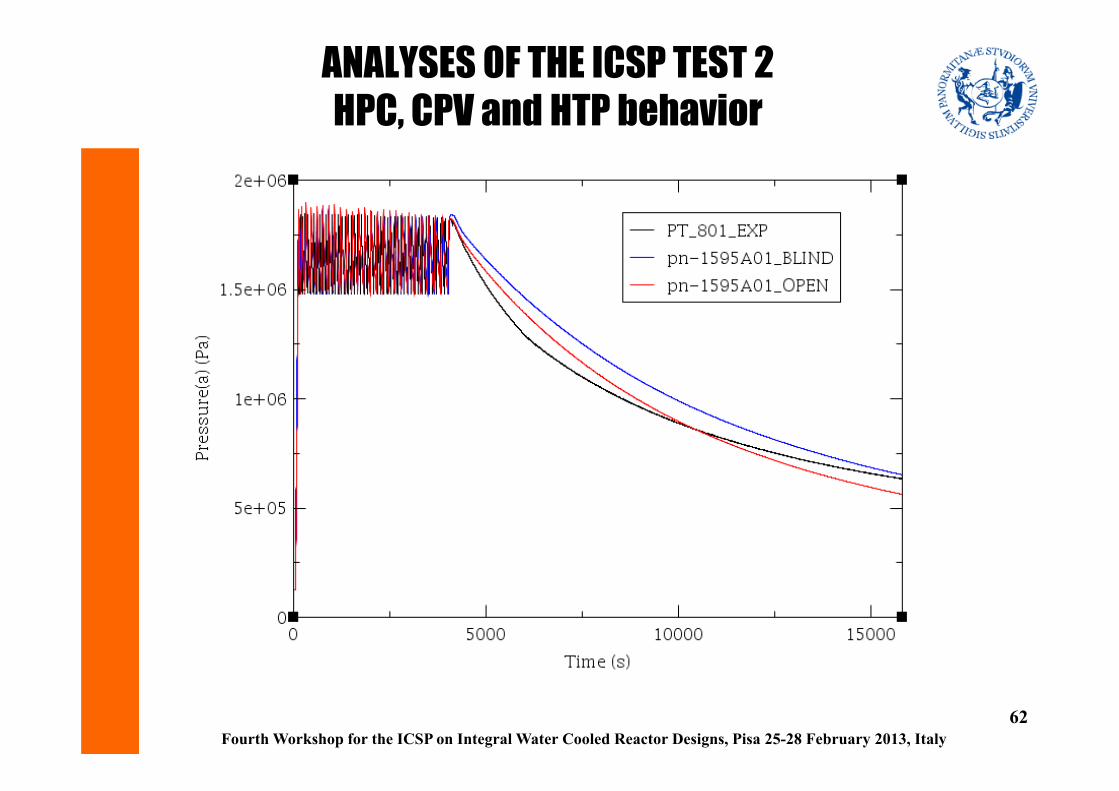
ANALYSES OF THE ICSP TEST 2
HPC, CPV and HTP behavior
62
Fourth Workshop for the ICSP on Integral Water Cooled Reactor Designs, Pisa 25-28 February 2013, Italy

Gru
pp
o R
icer
ca N
ucl
eare
S. P
iero
a G
rad
oANALYSES OF THE ICSP TEST 2
63
Fourth Workshop for the ICSP on Integral Water Cooled Reactor Designs, Pisa 25-28 February 2013, Italy
� The HPC pressure behaviour is characterized by different phases:
� a first pressure increase, � an oscillation phase, � and a long term cooling phase.
� The results of the BLIND calculated data show that the HPC pressure behavior and its different phases are predicted by the code.
� As in the experimental data the HPC pressure oscillates between the setpoint values .
� The HPC pressure long term cooling phase is in general overestimated in comparison with the experimental.
� A better quantitative prediction of the long term cooling phase is observed during the OPEN calculation, though and underestimation is observed in the last part of the transient. This is related to the better quantitative RPV pressure prediction of the OPEN calculations.

Gru
pp
o R
icer
ca N
ucl
eare
S. P
iero
a G
rad
oANALYSES OF THE ICSP TEST 2
64
Fourth Workshop for the ICSP on Integral Water Cooled Reactor Designs, Pisa 25-28 February 2013, Italy
It is to underline that, as it is
shown from the BLIND sensitivity
calculations, the slope of the HPC
pressure increase is related to the
PCS 106 A valve k loss coefficient.
Considering the RPV/HPC coupling, it is
to underline that the length of the HPC
pressure oscillation is in general
depended from the steady state
conditions before the SOT and the heat
losses of the facility as it is shown from
the sensitivity analyses performed in
the BLIND phase of the ICSP.

Gru
pp
o R
icer
ca N
ucl
eare
S. P
iero
a G
rad
oANALYSES OF THE ICSP TEST 2
65
Fourth Workshop for the ICSP on Integral Water Cooled Reactor Designs, Pisa 25-28 February 2013, Italy
� The first rapid increase of
level and the decrease of the
HPC level slope are predicted
by the simulations.
� When the sump recirculation
valves open, the decrease of
the HPC level is well
predicted by the TRACE code
as the long term steady state
level phase.
� In general during the
simulations, though the long
term level is in a quantitative
agreement with the
experimental data, it is
underestimated the HPC
level increase.

Gru
pp
o R
icer
ca N
ucl
eare
S. P
iero
a G
rad
oANALYSES OF THE ICSP TEST 2
66
Fourth Workshop for the ICSP on Integral Water Cooled Reactor Designs, Pisa 25-28 February 2013, Italy
From the BLIND calculated data
it is observed that the maximum
level reached by the HPC level is
dependent by the PCS 106 A k
loss coefficient
The slope of the HPC level increase
is in general depended from the
heat losses of the facility.

Gru
pp
o R
icer
ca N
ucl
eare
S. P
iero
a G
rad
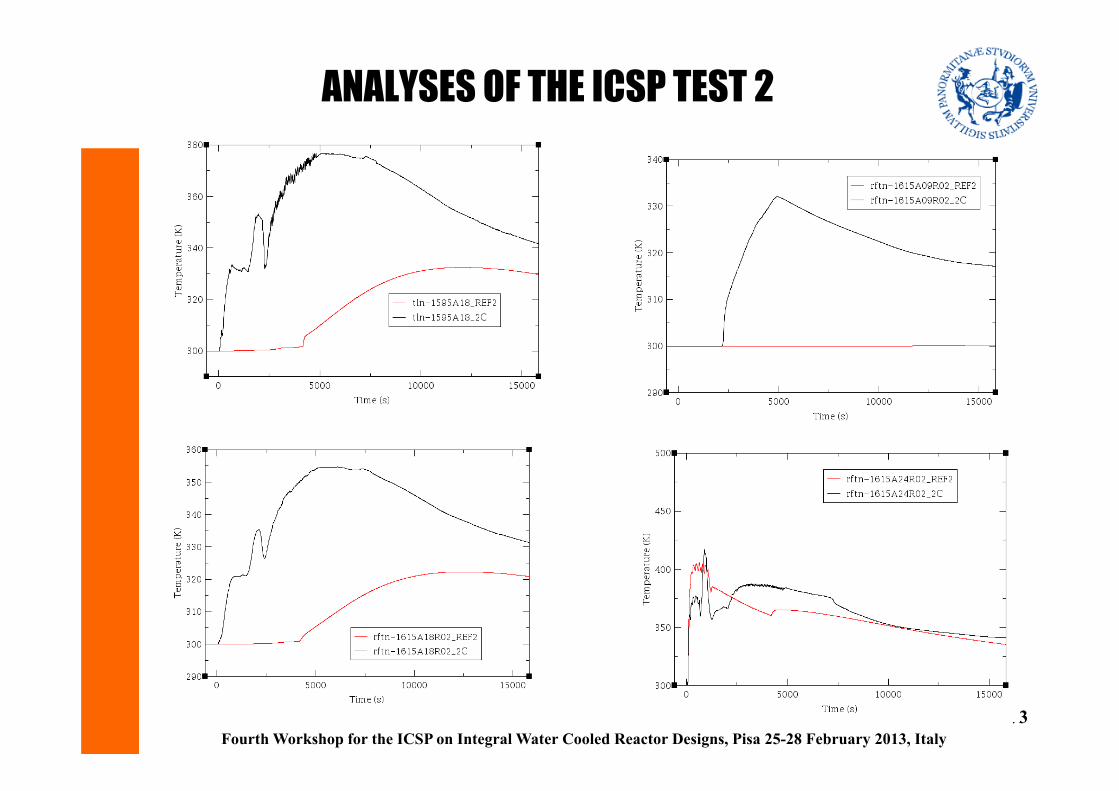
oANALYSES OF THE ICSP TEST 2
� The TF 811 and 821 are the lower thermocouples.
� The TF 811 thermal behaviour is not predicted by the code. This is related to the mono dimensional model of the containment. In particular in the experimental data is observed a general mixing of the primary vapour with the HPC water, then a rapid increase of the HPC water temperature.
� The calculated TF 821 temperature increases but with delay and a different behaviour in comparison with the experimental data.
� The TF 831, 841, 851, 861, are qualitatively but not quantitatively predicted by the code. A general overestimation of the calculated data is observed. This is could be related to the position of the thermocouples; in fact they are located very close to the heat transfer plate, therefore they could not represent the bulk water temperature; the temperature calculated by the code is the bulk temperature related to the nodalizationvolume. It is underline that the rapid increase of the HPC temperature is well predicted by the TRACE code.
67
Fourth Workshop for the ICSP on Integral Water Cooled Reactor Designs, Pisa 25-28 February 2013, Italy

Gru
pp
o R
icer
ca N
ucl
eare
S. P
iero
a G
rad
oANALYSES OF THE ICSP TEST 2
68
Fourth Workshop for the ICSP on Integral Water Cooled Reactor Designs, Pisa 25-28 February 2013, Italy

Gru
pp
o R
icer
ca N
ucl
eare
S. P
iero
a G
rad
o
69
Fourth Workshop for the ICSP on Integral Water Cooled Reactor Designs, Pisa 25-28 February 2013, Italy

Gru
pp
o R
icer
ca N
ucl
eare
S. P
iero
a G
rad
o
70
Fourth Workshop for the ICSP on Integral Water Cooled Reactor Designs, Pisa 25-28 February 2013, Italy

Gru
pp
o R
icer
ca N
ucl
eare
S. P
iero
a G
rad
oANALYSES OF THE ICSP TEST 2
71
Fourth Workshop for the ICSP on Integral Water Cooled Reactor Designs, Pisa 25-28 February 2013, Italy
In relation to the TF 891, 892, 893, 894, the comparison with the
experimental data show that there is an agreement with the experimental
data but more investigation need these parameters.

Gru
pp
o R
icer
ca N
ucl
eare
S. P
iero
a G
rad
oANALYSES OF THE ICSP TEST 2
�Thermal stratification Thermal stratification Thermal stratification Thermal stratification in the HPC and in the CPV is in the HPC and in the CPV is in the HPC and in the CPV is in the HPC and in the CPV is observed. The strong thermal stratification observed observed. The strong thermal stratification observed observed. The strong thermal stratification observed observed. The strong thermal stratification observed in the CPV could be related to in the CPV could be related to in the CPV could be related to in the CPV could be related to nodalizationnodalizationnodalizationnodalization option.option.option.option.
The effect of the nodalization strategy used to model large tanks, where possible natural/circulation
convection phenomena could take place, is characterized; the nodalization strategy could
influence the entity of the thermal stratification that could be present in the system
72
Fourth Workshop for the ICSP on Integral Water Cooled Reactor Designs, Pisa 25-28 February 2013, Italy
Gru
pp
o R
icer
ca N
ucl
eare
S. P
iero
a G
rad
oANALYSES OF THE ICSP TEST 2
73
Fourth Workshop for the ICSP on Integral Water Cooled Reactor Designs, Pisa 25-28 February 2013, Italy

Gru
pp
o R
icer
ca N
ucl
eare
S. P
iero
a G
rad
oANALYSES OF THE ICSP TEST 2
74
Fourth Workshop for the ICSP on Integral Water Cooled Reactor Designs, Pisa 25-28 February 2013, Italy
Gru
pp
o R
icer
ca N
ucl
eare
S. P
iero
a G
rad
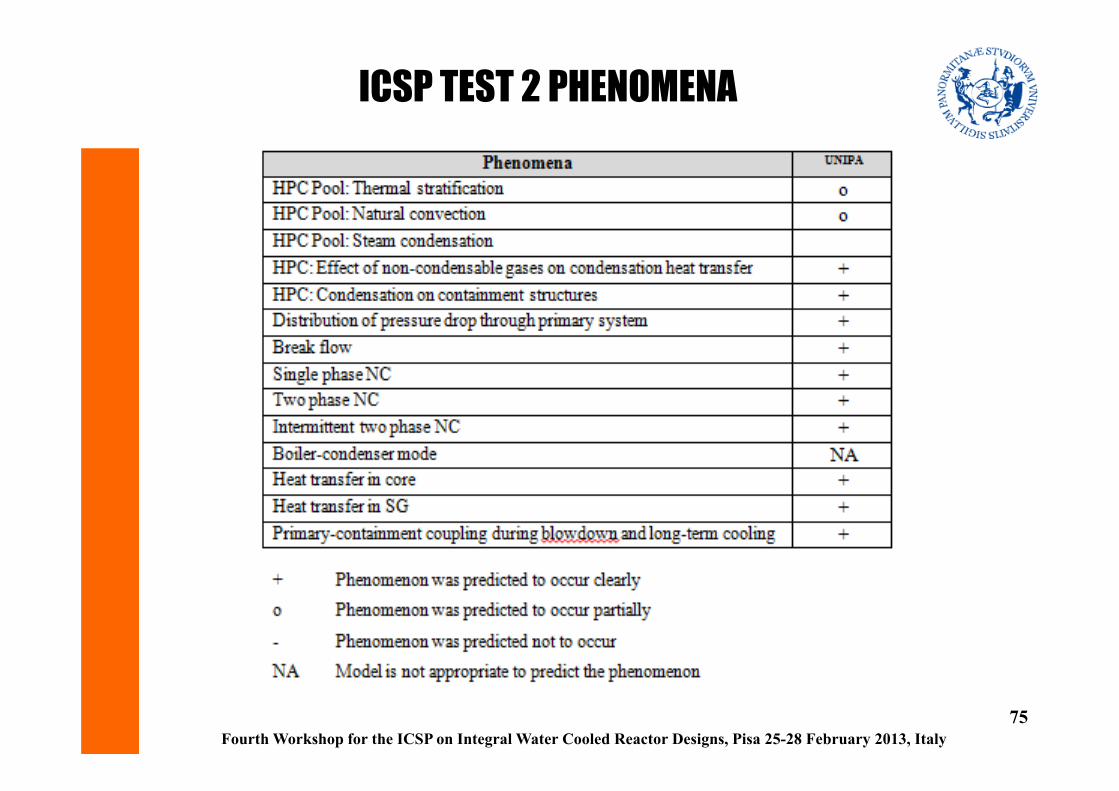
oICSP TEST 2 PHENOMENA
75
Fourth Workshop for the ICSP on Integral Water Cooled Reactor Designs, Pisa 25-28 February 2013, Italy

Gru
pp
o R
icer
ca N
ucl
eare
S. P
iero
a G
rad
oINITIAL CONDITION FOR THE ICSP TEST INITIAL CONDITION FOR THE ICSP TEST INITIAL CONDITION FOR THE ICSP TEST INITIAL CONDITION FOR THE ICSP TEST 3333
� In order to reach the BIC of the first ICSP test an arbitrary pre-test phase is conducted during the simulation
� At the end of this pre-test phase, SOT, the BIC of the test are stable for 10 minutes prior to the first mass reduction.
� The comparison of the initial condition reached by the code and the initial condition provided in the ICSP test plan are reported in the following table
Parameter MASLWR Unit Experimental Value
Steady-State Value from Code
Pressurizer pressure PT-301 MPa(a) 8.72 8.72
Pressurizer level LDP-301 m 0.3574 0.36
Power to core heater rods KW-101/102 kW 40 40
Feedwater temperature
(Average)
TF-501 ºC 31.49 31.49
Steam temperature FVM-602-T ºC 205.44 223.49
Steam pressure FVM-602-P MPa(a) 1.446 1.446
Ambient air temperature ºC 22 22
Primary flow at core outlet FDP-131 kg/s 0.646
Primary coolant temperature at core inlet
TF- 121/122/
123/124
ºC 250 250
Primary coolant temperature at core outlet
TF-106 ºC 263 262.56
Feedwater flow FMM-501 kg/s - 0.0117
Steam flow FVM-602-M kg/s 0.0117
Primary coolant subcooling at core outlet
ºC 38.5
Total heat loss through primary system
kW About 8
Heat transfer through SG kW 33183.711
Maximum surface temperature of core heater rods
ºC Outer surface: 280
Location from the SG secondary inlet to reach
- saturation
- superheat
m Saturation : Cell 201
Superheat: Cell 211
Fourth Workshop for the ICSP on Integral Water Cooled Reactor Designs, Pisa 25-28 February 2013, Italy
76

Gru
pp
o R
icer
ca N
ucl
eare
S. P
iero
a G
rad
o
FACILITY CONFIGURATION BEFORE
THE SOT OF THE TEST 3
77
Fourth Workshop for the ICSP on Integral Water Cooled Reactor Designs, Pisa 25-28 February 2013, Italy
System Facility
Operation
TRACE Model
Operation
Note
Core Heaters ON ON
PRZ Heaters ON ON
It is defined a table in order to control the
primary pressure
Independent variable = PRZ pressure
Dependent variable = PRZ heater power
In order to maintain
the primary
pressure set-point
Containment
Heaters
OFF OFF -
Feed water ON ON
It is defined a table in order to control the
secondary side steam super heat value
Independent variable = secondary side
steam super heat
Dependent variable = feed water mass
flow rate
In order to remove
the net primary
power [primary
power less ambient
losses]
Main feed
water pump
ON
Charging
pump
OFF - -
Gru
pp
o R
icer
ca N
ucl
eare
S. P
iero
a G
rad
o
BOUNDARY CONDITION OF THE TRACE MODEL
At the end of the Steady State Phase
78
Fourth Workshop for the ICSP on Integral Water Cooled Reactor Designs, Pisa 25-28 February 2013, Italy

Gru
pp
o R
icer
ca N
ucl
eare
S. P
iero
a G
rad
o
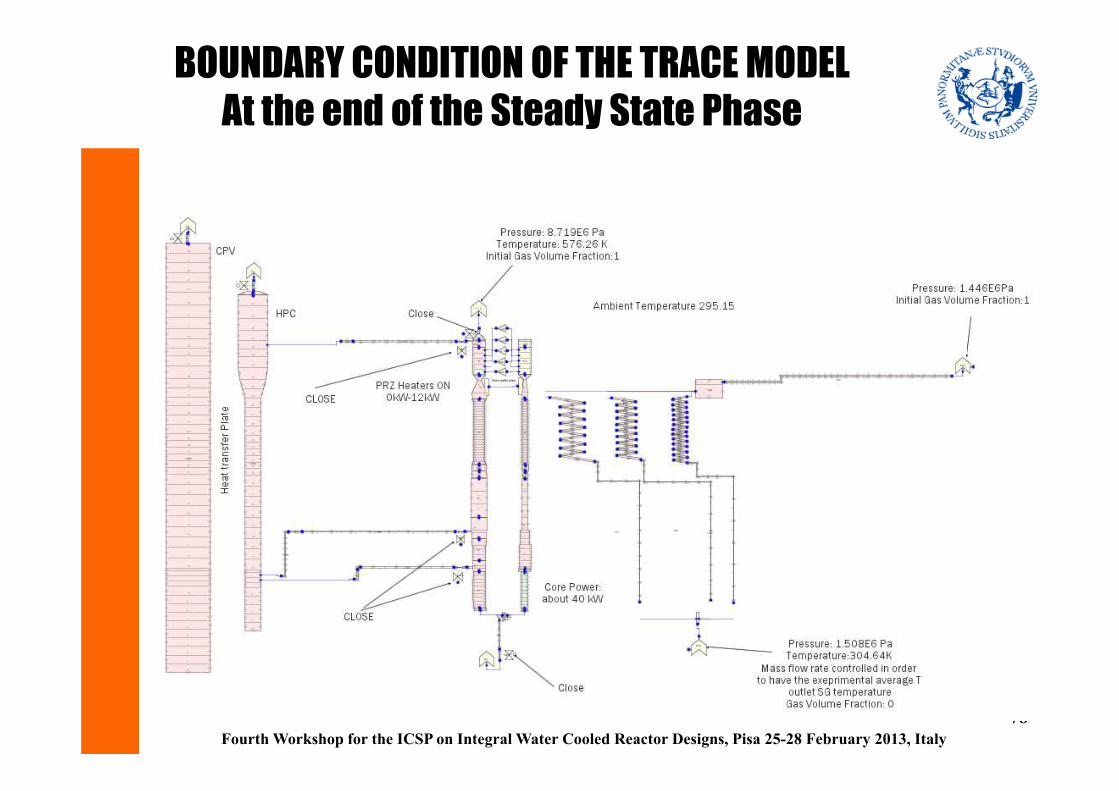
BOUNDARY CONDITION OF THE TRACE MODEL
At the end of the Steady State Phase
79
Fourth Workshop for the ICSP on Integral Water Cooled Reactor Designs, Pisa 25-28 February 2013, Italy

Gru
pp
o R
icer
ca N
ucl
eare
S. P
iero
a G
rad
oTEST TEST TEST TEST 3 3 3 3 PROCEDUREPROCEDUREPROCEDUREPROCEDURE
� The ICSP test 3 investigated the primary and secondary side thermal hydraulic behavior for a variety of core power levels and FW flow rate. The test stepped power level incrementally up to about 300 kW, varying FW flow rate at each power level. During this test seven different core powers were used.
80
Fourth Workshop for the ICSP on Integral Water Cooled Reactor Designs, Pisa 25-28 February 2013, Italy

Gru
pp
o R
icer
ca N
ucl
eare
S. P
iero
a G
rad
o
FACILITY CONFIGURATION DURING THE
ICSP TEST 3
81
Fourth Workshop for the ICSP on Integral Water Cooled Reactor Designs, Pisa 25-28 February 2013, Italy
System Facility
Operation
TRACE model
Operation
Note
Core Heaters ON ON
PRZ Heaters ON ON In order to control the
primary pressure
Containment
Heaters
OFF OFF
Feed water ON ON
( fixed as experimental
data)
In order to remove the net
primary power [core power
less ambient losses].
Charging
pump
OFF
Main feed
water pump
ON - -

Gru
pp
o R
icer
ca N
ucl
eare
S. P
iero
a G
rad
oICSP TEST 3
�In order to improve the results of the TRACE ICSP test 3 calculated data, few modifications have been implemented in the input deck. �An increase of the heat losses and
�an increase of the SG coil surface heat transfer area have been implemented.
� It is to underline that in order to have a better fitting of the RPV mass flow rate a Reynolds number - dependent loss coefficient could be necessary. Since this option is not available in the TRACE code version used for this ICSP (TRACEV5-patch1), a fictitious valve with flow area dependent from the core power has been implemented at the core entrance.
82
Fourth Workshop for the ICSP on Integral Water Cooled Reactor Designs, Pisa 25-28 February 2013, Italy

Gru
pp
o R
icer
ca N
ucl
eare
S. P
iero
a G
rad
oICSP TEST3 ANALYSES PERFORMED
83
Fourth Workshop for the ICSP on Integral Water Cooled Reactor Designs, Pisa 25-28 February 2013, Italy
ID
Calculation
Variation from
reference
calculation
Target of the
sensitivity
analyses
Results of the sensitivity
analyses
BL
IND
PH
AS
E
REF
BLIND
Reference
BLIND PHASE
calculation
SM Increase the
surface multiplier
of the equivalent
SG helical coil
heat structure
Increase the
primary/secondary
heat transfer
An increase of the primary
secondary heat transfer is
predicted by the code. This
effect increases with the
increase of the power. A general
colder primary system is
observed in particular in the last
part of the transient.
HL Increase the heat
losses of the
TRACE model
Decrease the
energy transferred
to the secondary
side
A general colder primary system
is observed
3T The SG is
modeld with 3
equivalent group
of pipes, one of
each bank.
Characterize the
facility with a
group of pipe for
each tube bank
A more detailed analyses is
obtained. More oscillation are
predicted in the secondary side
OP
EN
PH
AS
E
Open Reference
OPEN PHASE
Calculation

Gru
pp
o R
icer
ca N
ucl
eare
S. P
iero
a G
rad
o
Thermo-fluid dynamics and pressure drops in
various geometrical configurations
84
Fourth Workshop for the ICSP on Integral Water Cooled Reactor Designs, Pisa 25-28 February 2013, Italy
The analyses of the
BLIND/OPEN
pressure drop
calculated data
show a general
underestimation in
comparison with the
experimental data.
More
instrumentation
information’s are
necessary in order
to characterize
these differences

Gru
pp
o R
icer
ca N
ucl
eare
S. P
iero
a G
rad
o
Natural circulation/heat transfer in
covered core
85
Fourth Workshop for the ICSP on Integral Water Cooled Reactor Designs, Pisa 25-28 February 2013, Italy

Gru
pp
o R
icer
ca N
ucl
eare
S. P
iero
a G
rad
o
Natural circulation/heat transfer in
covered core
86
Fourth Workshop for the ICSP on Integral Water Cooled Reactor Designs, Pisa 25-28 February 2013, Italy
Gru
pp
o R
icer
ca N
ucl
eare
S. P
iero
a G
rad
o
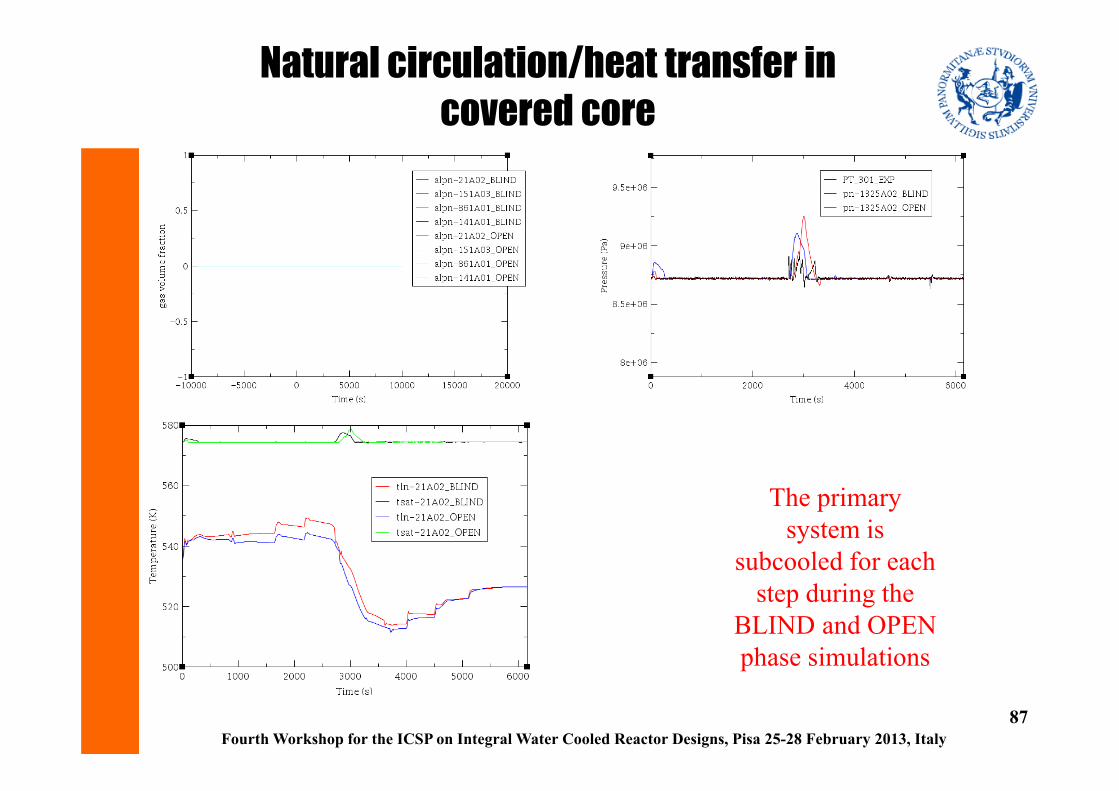
Natural circulation/heat transfer in
covered core
87
Fourth Workshop for the ICSP on Integral Water Cooled Reactor Designs, Pisa 25-28 February 2013, Italy
The primary
system is
subcooled for each
step during the
BLIND and OPEN
phase simulations

Gru
pp
o R
icer
ca N
ucl
eare
S. P
iero
a G
rad
o
Heat transfer in SG/super heating in
secondary side
88
Fourth Workshop for the ICSP on Integral Water Cooled Reactor Designs, Pisa 25-28 February 2013, Italy

Gru
pp
o R
icer
ca N
ucl
eare
S. P
iero
a G
rad
o
ICSP3 Calculated data
Direct heat exchange
89
Fourth Workshop for the ICSP on Integral Water Cooled Reactor Designs, Pisa 25-28 February 2013, Italy

Gru
pp
o R
icer
ca N
ucl
eare
S. P
iero
a G
rad
oHeat transfer in SG
Super heating in secondary side
BLIND Sensitivity Analysis (SG with three equivalent group of pipe)
90
Fourth Workshop for the ICSP on Integral Water Cooled Reactor Designs, Pisa 25-28 February 2013, Italy

Gru
pp
o R
icer
ca N
ucl
eare
S. P
iero
a G
rad
oICSP3 BLIND Sensitivity Calculated Data
91
Fourth Workshop for the ICSP on Integral Water Cooled Reactor Designs, Pisa 25-28 February 2013, Italy
Heat Losses
effect
SM
effect
Gru
pp
o R
icer
ca N
ucl
eare
S. P
iero
a G
rad
o
92
Fourth Workshop for the ICSP on Integral Water Cooled Reactor Designs, Pisa 25-28 February 2013, Italy

Gru
pp
o R
icer
ca N
ucl
eare
S. P
iero
a G
rad
oICSP3 CODE PHENOMENA PREDICTION
93
Fourth Workshop for the ICSP on Integral Water Cooled Reactor Designs, Pisa 25-28 February 2013, Italy

Gru
pp
o R
icer
ca N
ucl
eare
S. P
iero
a G
rad
oLeasson Learned
� The expected phenomena are predicted by the TRACE code.
� RPV Natural circulation is predicted by the code� The RPV/containment coupling is predicted by the code (long term cooling
phenomenology typical of the MASLWR design)� The SG coil behavior:
� The subcooled, saturated and superheated regions are predicted by the code
� The superheating at the SG exit is predicted by the code
� More investigation’s are needed for a quantitative assessment
� The results of the calculated data show a strong user effect
� Way of reaching the BIC,� K loss coefficient of the vent valve� Nodalization strategy for the simulation of large pool� Nodalization strategy for the simulation of helical coil SG (different system
behavior if the system is modeld with one equivalnet helical coil or threedifferent equivalent helical coils)
� The graphical user interfaces is a mature tool for the analyses of the calculateddata. This is a way of reducing the user effect. Usefull application are the visulization of selected calcuated data and the temperature profile visualization.
�
94
Fourth Workshop for the ICSP on Integral Water Cooled Reactor Designs, Pisa 25-28 February 2013, Italy

Gru
pp
o R
icer
ca N
ucl
eare
S. P
iero
a G
rad
oLeasson Learned
� Considering� The general importance of heat losses calibration for the simulation of
experimental test facility
� The general importance of pressure drop calibration for the simulationexperimental test facility
� The results of the calculated data showing the influenze of the heat losses
� One issue is the quantitative validation of the code for the heat transfer between the primary and secondary side in presence of helical coil steamgenerator
� The general results of the primary side parameters
� The results of the comparison between the experimental and the calculatedpressure drop
� The importance of the pressure drop in natural circulation regime
It is fundamental for the use of best estimate thermal hydraulic system code for the analyses of small modular nuclear reactor a
� detailed characterization of the experimental test facilities: heat lossescharacterization at different primary temperatures; pressure dropcharacterization at different mass flow rates
� A detailed characterization of the facilities instrumentation.
95
Fourth Workshop for the ICSP on Integral Water Cooled Reactor Designs, Pisa 25-28 February 2013, Italy