ib 362 lecture 12 productivity and food webs
TRANSCRIPT

IB 362Lecture 12Productivity and Food Webs


Marine Biology: Function, Biodiversity, Ecology, 3/e
Levinton Copyright © 2009 by Oxford University Press, Inc.
FIG. 10.1 Food web constructed from the feeding relationships of the North Sea herring Clupea harengus during different life history stages. A simplified food chain leading to the adult herring is diagrammed at left. (Modified after Russell-Hunter, 1970.)


Marine Biology: Function, Biodiversity, Ecology, 3/e
Levinton Copyright © 2009 by Oxford University Press, Inc.
FIG. 10.2 Variation in the trophic levels of planktonic ecosystems, ranging from oceanic environments to coastal environments to turbulent, upwelled high-nutrient environments. (After Landry, 1977.)

Castro and Huber 2010 Marine Biology

Castro and Huber 2010 Marine Biology

Carbon cycle
Castro and Huber 2010 Marine Biology

Nitrogen cycle
Castro and Huber 2010 Marine Biology

Phosphorus cycle
Castro and Huber 2010 Marine Biology

Productivity: the amount of living tissue produced per unit time
Primary productivity: productivity attributed to photosynthesis(usually interested in net rather than gross p. p.)
Secondary productivity: productivity attributed to organisms thatconsume the primary producers
(Usually expressed as grams of carbon produced per day per square meter)
Biomass: amount of living biological material present at any one time
(usually expressed as grams of carbon per square meter)

FIG. 10.3 Measurement of photosynthesis with light and dark bottles. Light and dark bottles are suspended on a line in a series, at various depths. The change of oxygen in the light bottle provides data on photosynthesis plus respiration, whereas the change in the dark bottle provides data on respiration only.
Castro and Huber 2010 Marine Biology Levinton 2009 Marine Biology
(can also measure carbon directly using radiocarbon labeling)

Marine Biology: Function, Biodiversity, Ecology, 3/e
Levinton Copyright © 2009 by Oxford University Press, Inc.
FIG. 10.5 Geographic variation in euphotic zone depth, nutrient concentration, and primary productivity on a transect from the coast of Georgia, United States, to the outer continental shelf. (After Haines, 1979, with permission of the Plenum Publishing Corporation.)

Marine Biology: Function, Biodiversity, Ecology, 3/e
Levinton Copyright © 2009 by Oxford University Press, Inc.
FIG. 10.6 Distribution of primary production in the oceans. (After Koblentz-Mishke et al., 1970.)

Castro and Huber 2010 Marine Biology

Marine Biology: Function, Biodiversity, Ecology, 3/e
Levinton Copyright © 2009 by Oxford University Press, Inc.
FIG. 10.4 Color detectors in a satellite measure the radiance of the ocean, or the light that is reradiated after the sun’s light encounters and partially penetrates the ocean (the light that reaches the ocean is called the irradiance).

Marine Biology: Function, Biodiversity, Ecology, 3/e
Levinton Copyright © 2009 by Oxford University Press, Inc.
FIG. 10.7 Worldwide, year-round integrated estimate of chlorophyll concentration derived from data collected by the SeaWiFS satellite. False colors are used to represent the data, according to the accompanying scale.

Marine Biology: Function, Biodiversity, Ecology, 3/e
Levinton Copyright © 2009 by Oxford University Press, Inc.
FIG. 9.4 A phytoplankton bloom dominated by the phytoplanktonic coccolithophorid Emiliania huxleyi (inset upper left) in the Bering Sea, September 2000. The blue-white waters seen here may represent living or dead cells, as their reflective properties do not change significantly when the cells die. (Courtesy of NASA.)

Marine Biology: Function, Biodiversity, Ecology, 3/e
Levinton Copyright © 2009 by Oxford University Press, Inc.
FIG. 9.3 Idealized diagram tracing changes in phytoplankton, zooplankton, light, and nutrients during the year in a temperate–boreal inshore body of water. (Modified after Russell-Hunter, 1970.)

Marine Biology: Function, Biodiversity, Ecology, 3/e
Levinton Copyright © 2009 by Oxford University Press, Inc.
FIG. 9.5 Phytoplankton and zooplankton in a seasonal cycle: (a) Arctic, (b) temperate–boreal, and (c) tropical. (After Cushing, 1975.)
Marine Biology: Function, Biodiversity, Ecology, 3/e
Levinton Copyright © 2009 by Oxford University Press, Inc.
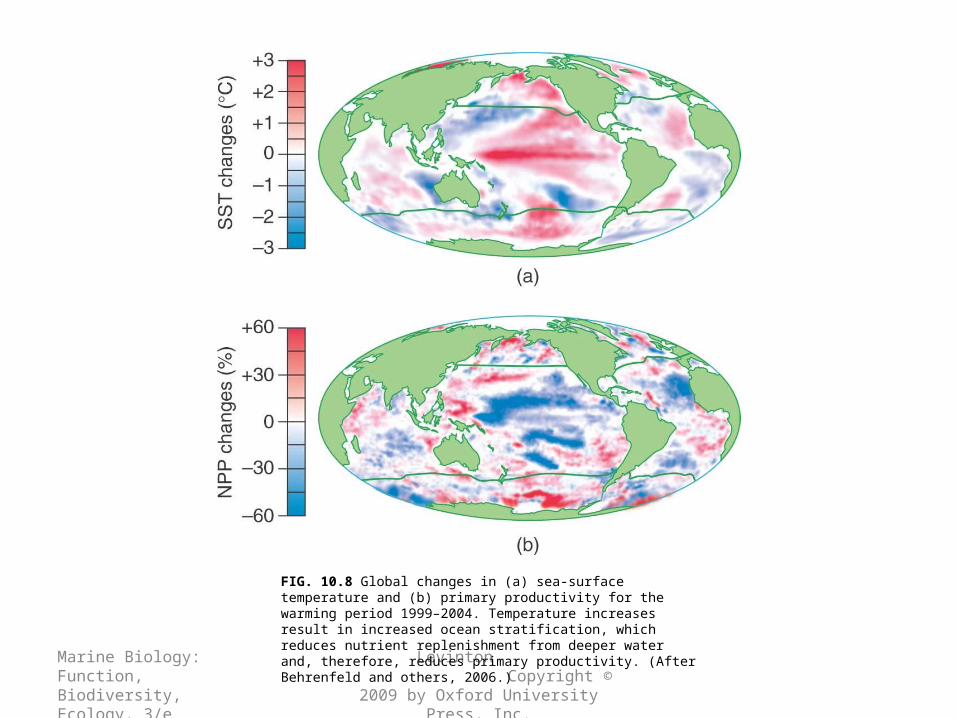
FIG. 10.8 Global changes in (a) sea-surface temperature and (b) primary productivity for the warming period 1999–2004. Temperature increases result in increased ocean stratification, which reduces nutrient replenishment from deeper water and, therefore, reduces primary productivity. (After Behrenfeld and others, 2006.)