ibm academic initiative pace...
TRANSCRIPT

© 2009 IBM Corporation
IBM Academic Initiative: building skills for a smarter planet
1
IBM Academic Initiativebuilding skills for a smarter planet
Analytics: Faculty Brief, Pace University
Robert BryRelationship ManagerAcademic [email protected]

© 2009 IBM Corporation
IBM Academic Initiative: building skills for a smarter planet
2
IBM Academic Initiative
Business Analytics
Resources
Next Steps
1
2
3
4
© 2009 IBM Corporation
IBM Academic Initiative: building skills for a smarter planet
3
Let’s build a smarter planet
www.ibm.com/academicinitiative
Content

© 2009 IBM Corporation
IBM Academic Initiative: building skills for a smarter planet
4
Key Resources
Getting Started Guide: IBM Cognos 10 on the Cloud
IBM Cognos 10 Quick Tour
IBM Cognos, SPSS Modeler Courseware Modules
IBM Cognos 10 Sample Data Sets (Greater Outdoors)
IBM Cognos 10 Business Intelligence 10.1 Handbook
1
2
3
4
5

© 2009 IBM Corporation
IBM Academic Initiative: building skills for a smarter planet
5
IBM Academic Initiative: Courseware Modules Analytics & Predictive Analytics
Business Analytics (A3030) Cognos Express Xcelerator: Navigating Data (V9)(A3032) Essentials for IBM Cognos Express Reporter (V9)(B2406) Cognos 8 Go! Search Introduction(B2420) Cognos 8 BI Analysis Studio: Analyze Data V8.4(B2424) Cognos 8 BI Report Studio: Express Authoring(B2425) Cognos 8 BI Report Studio Introduction(B2426) Cognos 8 BI Report Studio: Intermediate(B2427) Cognos 8 BI Query Studio: Build Ad Hoc Reports(B2432) Cognos 8 BI: Essentials for Managing BI Projects (B2440i) Cognos 8 Go! Search Administration(B2455) Cognos 8 BI Administration(B2470) Essentials for IBM Cognos 8 BI(B2488) Cognos 8 BI Cognos Connection for Consumers
Predictive Analytics (SP0A002) Intro to IBM SPSS Modeler and Data Mining (SP0A032) Predictive Modeling with IBM SPSS Modeler(SP0A042) Clustering & Association Models SPSS Modeler(SP0A052) Advanced Data Preparation with SPSS Modeler
(B2431) Cognos 8 BI Event Studio: Create and Manage Agents(B2454) Cognos 8 BI: Report and Analyze Data for Business Authors
(B5152) IBM Cognos Framework Manager: Design Metadata Models (V10.1)
(B5160) IBM Cognos Report Studio: Author Professional Reports (V10.1)
(B5161) IBM Cognos Report Studio: Author Reports with Multidimensional
(B5197) IBM Cognos Business Insight: Create Dashboards V10.1
(B5183) IBM Cognos Business Insight Advanced: Introduction
(B5160) Cognos Report Studio: Author Professional Reports V10.1
(B5152) Cognos Framework Manager: Design Metadata Models V10.1
(B5146) IBM Cognos Mobile for Consumers Using iPhone V10.1
(B5143) IBM Cognos Mobile Administration V10.1
(B5142) IBM Cognos Mobile for Consumers Using BlackBerry V10.1
(SP0G507) Introduction to IBM SPSS Statistics ‐ Intro(SP0G517) Introduction to Statistical Analysis Using SPSS Statistics(SP0G527) Data Management and Manipulation with SPSS Statistics

© 2009 IBM Corporation
IBM Academic Initiative: building skills for a smarter planet
6
IBM Cognos 10 Getting Started Guide
Summary of Business Intelligence Capabilities Instruction Exercises

© 2009 IBM Corporation
IBM Academic Initiative: building skills for a smarter planet
7
IBM Cognos Getting Started Guide
Activity Component Example / Exercise
Publishing, managing, and viewing content
IBM Cognos Connection "Example - Run a Report" (p. 19),"Example - Schedule a Report" (p. 22), and "Example -Create a Portal Page" (p. 24).
Interactive dashboards IBM Cognos Business Insight
Simple reporting and data exploration
IBMCognos Business Insight Advanced
"Example - Create a Statement-Style Report" (p. 32).
Ad hoc querying IBM Cognos Query Studio "Example - Create a Query" (p. 27).
Managed reporting IBM Cognos Report Studio "Example - Create a Report" (p. 36
Event management and alerting
IBM Cognos Event Studio "Example - Manage an Event" (p. 40).
Scorecarding and metrics IBM Cognos Metric Studio "Example - Monitor Performance" (p. 44).
Analyzing your business IBM Cognos Analysis Studio "Example - Create an Analysis" (p. 49).
Working with IBM Cognos BI content in Microsoft® IBM Cognos for Microsoft Office
IBM Cognos for Microsoft Office
"Example - Work with IBMCognos Content in Microsoft Excel" (p. 53).

© 2009 IBM Corporation
IBM Academic Initiative: building skills for a smarter planet
8
Leverage Cognos 10
IBM Cognos offers you interactive quick tours that introduce you to Cognos capabilities and teach basic skills.

© 2009 IBM Corporation
IBM Academic Initiative: building skills for a smarter planet
9
Leverage Cognos 10
IBM® Cognos® Analysis Studio Quick Tour (SAMPLE)
1. Instead of quantity sold, you decide that you want to see revenue. Because you previously assigned sort criteria to the 2006 data, IBM® Cognos® Analysis Studio automatically re-sorts when you change the measure.
To replace Quantity sold with Revenue, in the Insertable Objects pane, expand the Measures folder and click Revenue.
2. One of the powerful features in IBM® Cognos® Analysis Studio is the ability to drill down on a member to see a lower level of detail. For example, instead of revenue by year, we want to look at the four quarters that make up 2006.
Pause the pointer over the 2006 column label. When the hyperlink appears, click the label.
Leverages Greater Outdoors Sample Data

© 2009 IBM Corporation
IBM Academic Initiative: building skills for a smarter planet
10
IBM Cognos Business Intelligence 10: Getting Started Guide
In IBM® Cognos® Analysis Studio, you can manipulate items in your data interactively so that you can identify and understand the problems and issues in your business.
In this exercise, you will learn how to– drill down– create a top filter– create a summary calculation– create a crosstab and a chart
Scenario: You are a business analyst for the Great Outdoors Company.
You want to further analyze the returns business items to find out where and why products are the most frequently returned, and that have the biggest impact on the company’s profit.
Example Create an Analysis

© 2009 IBM Corporation
IBM Academic Initiative: building skills for a smarter planet
11
IBM Cognos Business Intelligence 10: Course Module
A three day, instuctor led course. It is designed for report authors to learn report building techniques using relational datamodels, and ways of enhancing, customizing, and managing professional reports.
Scenario: You are a business user and report creator for the Great Outdoors Company.
You want to further analyze and customize data for better decision making.
Author Professional Reports Fundamentals (v10.1)
Student Guide Volume 1 Course Code B5158
© 2009 IBM Corporation
IBM Academic Initiative: building skills for a smarter planet
12
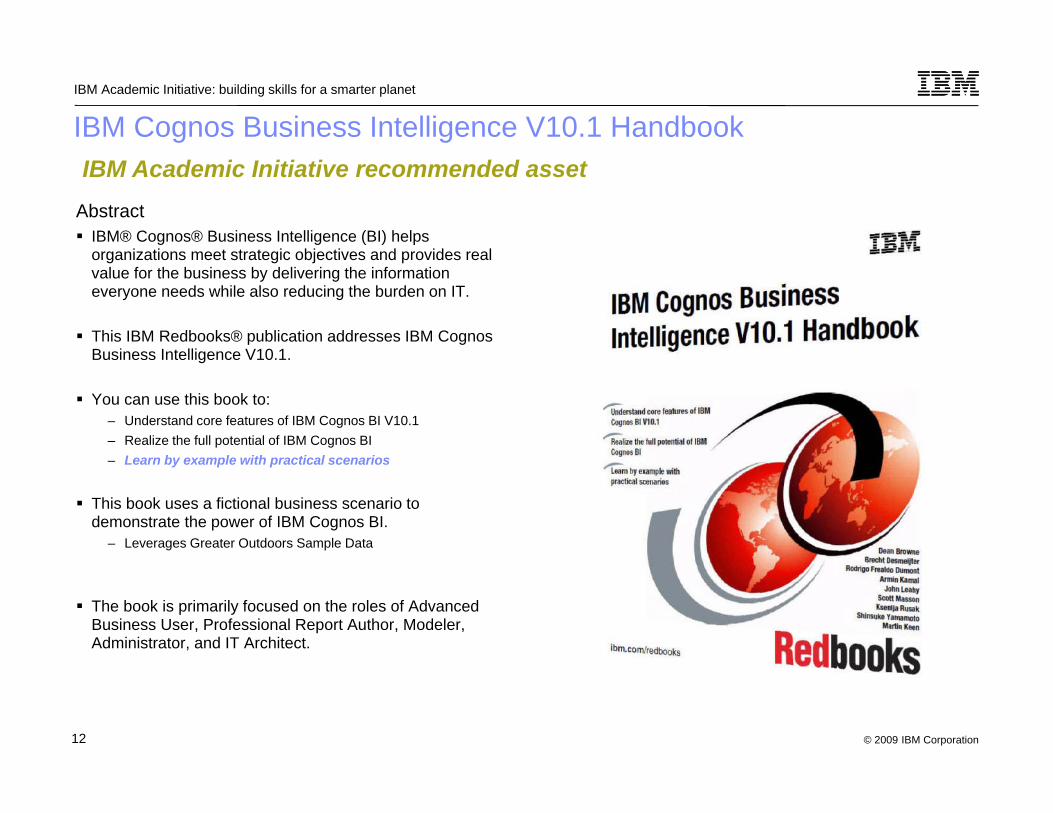
IBM Cognos Business Intelligence V10.1 Handbook
Abstract IBM® Cognos® Business Intelligence (BI) helps
organizations meet strategic objectives and provides real value for the business by delivering the information everyone needs while also reducing the burden on IT.
This IBM Redbooks® publication addresses IBM Cognos Business Intelligence V10.1.
You can use this book to:– Understand core features of IBM Cognos BI V10.1– Realize the full potential of IBM Cognos BI– Learn by example with practical scenarios
This book uses a fictional business scenario to demonstrate the power of IBM Cognos BI.
– Leverages Greater Outdoors Sample Data
The book is primarily focused on the roles of Advanced Business User, Professional Report Author, Modeler, Administrator, and IT Architect.
IBM Academic Initiative recommended asset

© 2009 IBM Corporation
IBM Academic Initiative: building skills for a smarter planet
13
IBM Cognos Business Intelligence V10.1 Handbook
Exercise Examples: Advanced Business User Our goal is to create a dashboard for Great Outdoors company
executives and business users that combines all the relevant information that is needed to gain better insight into business performance of the company.
The dashboard must include data about sales performance as well as product returns, sales forecasting, marketing data, and external data.
Advanced Business User Scenario: Great Outdoors Uses the IBM Cognos Business Insight interface to create and change
dashboards, including data that is relevant for the users, but is missing in the current version of a dashboard.
Later, interacts with the reports, creates additional calculations, and adds filters to allow users to narrow the scope of data.
Begins by opening the current version of the GO Sales Dashboard, making some changes on the layout, and removing reports that are redundant.
Click Open. The GO Sales Initial Dashboard opens– GO Sales Initial Dashboard opens in Business Insight
To show titles:– a. On the Application bar, click Layout and Style, and then click Edit
Dashboard Style.– b. In the Edit Dashboard Style window, click Show Titles
IBM Academic Initiative recommended asset

© 2009 IBM Corporation
IBM Academic Initiative: building skills for a smarter planet
14
About Sample Data Sets
Fictional company used for exercises and samples IBM provides samples as part of IBM Cognos software, based on a fictional Great Outdoors
company to describe business scenarios and product functionality.
About Greater Outdoors The fictional Great Outdoors company began in October 2004 as a business-to-business
company. It does not manufacture its own products; rather, the products are manufactured by a third party and are sold to third-party retailers. The company built its business by selling products to other vendors.
Recently, the Great Outdoors company expanded its business by creating a website to sell products directly to consumers.

© 2009 IBM Corporation
IBM Academic Initiative: building skills for a smarter planet
15
Greater Outdoors
The Great Outdoors organization is made up of six companies. These companies are primarily geographically-based, with the exception of GO Accessories, which sells to retailers from Geneva, Switzerland. Each of these countries has one or more branches.
The Great Outdoors company includes the following subsidiaries:– GO Americas– GO Asia Pacific– GO Central Europe– GO Northern Europe– GO Southern Europe– GO Accessories
Each of these subsidiaries sells camping equipment, golf equipment, mountaineering equipment, outdoor protection, and personal accessories. GO Accessories sells only Personal Accessories.

© 2009 IBM Corporation
IBM Academic Initiative: building skills for a smarter planet
16
About Sample Data Sets
The samples consist of the following:
2 databases that contain all corporate data, and related sample models for query / analysis
5 samples cubes and the related models
A metrics data source including associated metrics and a strategy map for the consolidated company, and a model for Metric extracts.
Reports, queries, query templates, and dashboards

© 2009 IBM Corporation
IBM Academic Initiative: building skills for a smarter planet
17
Greater Outdoors
Because the company has steadily grown into a worldwide operation over the last several years, it has been difficult for managers of the Great Outdoors company to run their branches and monitor only performance indicators based on sales. The Great Outdoors company executives need a clear view of where the pain points exist in the sales process.
Business questions to address: Based on this scenario, chapters within this book focus on creating a dashboard that provides
insight to address the following questions, helping the Great Outdoors company sales executives to make better decisions:
– Are we selling the right products?– Have we been growing our profit margin?– Have we had a considerable number of returns?– How many units of a product should we buy by each period of the year?– How does the performance of our business compare to last year?– How does the performance of our business compare to what we planned?– Can we add meaningful information about our competitors?– How successful are our promotions?

© 2009 IBM Corporation
IBM Academic Initiative: building skills for a smarter planet
18
About Sample Data Sets: GO Data Warehouse (analysis) Package
Employee Satisfaction Dashboard This report shows different measures for employee satisfaction, such as investment in training,employee survey
results (by department and by topic, including a comparison with the planned survey results), and a list of bonuses for employees, sorted by country. The Slider Filter applies to the bonus list.
Revenue Data Dashboard– This dashboard shows the revenue by region, country (controlled by a Select Value Filter), product type
(controlled by a Select Value Filter), and order method.
Sales By Year Dashboard– This dashboard shows different sales indicators for a year range controlled by the Slider Filter: profit margin,
gross profit, product cost, quantity sold, revenue by region, and a comparison between actual and planned revenue. The Slider Filter controls all widgets.

© 2009 IBM Corporation
IBM Academic Initiative: building skills for a smarter planet
19
About Sample Data Sets: GO Data Warehouse (query) Package
Marketing Dashboard This dashboard shows the results of different promotional campaigns. The select value filter for campaign name
applies to the first two charts. The product line Select Value Filter applies to the advertising cost chart, and the year Slider Filter applies to the advertising cost crosstab.
Recruiting Dashboard This dashboard shows the recruiting results (average number of days to fill positions) for different indicators: by
organization, department, branch, and year, and detailed information about the success of different recruiting techniques. Two Select Value Filters control three of the widgets.
Revenue Data Dashboard This dashboard shows the revenue by region, country (controlled by a Select Value Filter), product type (controlled
by a Select Value Filter), and order method.
Sales By Year Dashboard This dashboard shows different sales indicators for a year range controlled by the Slider Filter: profit margin, gross
profit, product cost, quantity sold, revenue by region, and a comparison between actual and planned revenue. The Slider Filter controls all widgets.

© 2009 IBM Corporation
IBM Academic Initiative: building skills for a smarter planet
20
Advanced User: Sample

© 2009 IBM Corporation
IBM Academic Initiative: building skills for a smarter planet
21
Greater Outdoors: Personas
To demonstrate the samples and business scenarios, the exercises leverage user roles, called personas, that represent people in a real Business Analytics deployment. We describe scenarios are that meet the business needs of these users. A user can take on the role of one or more personas (for example Advanced Business Users and Professional Report Author).
The six personas are as follows:– Advanced Business User– Professional Report Author– Modeler– Administrator– Analyst– Business User
Each these personas has different needs and expectations that must be delivered by the Business Analytics platform. IBM Cognos BI addresses these business needs with a range of integrated tools, such as IBM Cognos Business Insight and IBM Cognos Business Insight Advanced.

© 2009 IBM Corporation
IBM Academic Initiative: building skills for a smarter planet
22
Greater Outdoors: Advanced Business User
This persona has a deep understanding of the business needs and a good understanding of technology. The Advanced Business User leads the interpretation of business requirements and creates reports to answer business questions.
Persona’s needs– The Advanced Business User has the following business needs:– Get the right advice to senior management– Self-sufficiency– Look at the problem from different angles– Needs tools that integrate seamless and allow full collaboration with colleagues– Get things done quickly– Trust the data

© 2009 IBM Corporation
IBM Academic Initiative: building skills for a smarter planet
23
Greater Outdoors: Report Author
Professional Report Author This persona has a deep understanding of Cognos tools and creating reports based on
business requirements.
Persona’s needs The Professional Report Author has the following business needs: Scale to meet the needs of different types of users Quality content regardless of locale or environment Streamlined development environment Enhanced collaboration with business users

© 2009 IBM Corporation
IBM Academic Initiative: building skills for a smarter planet
24
Greater Outdoors: Modeler
This persona works closely with the Business Analyst to understand the business needs and to translate them in data models.
The Modeler has a deep understanding of technology, databases, and leading practices of data modeling to deliver the best data models to be used in IBM Cognos solutions.
Persona’s needs The Modeler has the following business needs: Complete and consistent information Fewer iterations of models Ability to develop and change quickly

© 2009 IBM Corporation
IBM Academic Initiative: building skills for a smarter planet
25
Greater Outdoors: Analyst
This persona uses dashboards and reports when connected to the network (mobile computer or mobile phone) or when not able to access the network to provide consolidated, detailed reports and statistical analysis to support management decisions. The Analyst also collaborates with colleagues to provide insight about Great Outdoors
business performance.
Remaining personas: The remaining personas are not advanced users. They are consumers of reports and dashboards that were created by an Advanced Business User or a Professional Report Author. The personas described here might also perform ad-hoc analysis.
Persona’s needs The Analyst has the following business needs: Analyze large or complex data sets Explore data from new perspectives and dimensions Identify relationships and trends Freedom to apply specific styles and formatting to results

© 2009 IBM Corporation
IBM Academic Initiative: building skills for a smarter planet
26
Greater Outdoors: Business User
This persona uses dashboards and reports that have been created specifically for this persona to understand aspects of the performance for this persona’s area of the Great Outdoors company.
Persona’s needs The Business User has the following business needs: Access anywhere No investment in training or software Simple and intuitive interface

© 2009 IBM Corporation
IBM Academic Initiative: building skills for a smarter planet
27
Advanced Business User: 6.3 Interaction with the dashboard components
Dashboards created with IBM Cognos Business Insight allow business users an integrated business intelligence experience together with collaborative decision making. Users can complete a wide variety of tasks quickly and easily. For example, you can view and interact with reports, sort data or perform additional calculations, or share information with the other members of the team.
Users have different needs for reports and data, so they can make use of the free-form layout and can rearrange reports or add new reports.
Our goal is to create a dashboard for Great Outdoors company executives and business users that combines all the relevant information that is needed to gain better insight into business performance of the company. The dashboard must include data about sales performance as well as product returns, sales forecasting, marketing data, and external data.

© 2009 IBM Corporation
IBM Academic Initiative: building skills for a smarter planet
28
Advanced Business User: 6.3 Interaction with the dashboard components
In this scenario, Lynn Cope is an Advanced Business User in the Great Outdoors company.
Her role is to enable senior management to have access to all relevant information in a dashboard. She uses the IBM Cognos Business Insight interface to create and change dashboards, including data that is relevant for the users, but is missing in the current version of a dashboard.
Later, she interacts with the reports, creates additional calculations, and adds filters to allow users to narrow the scope of data. She begins by opening the current version of the GO Sales Dashboard, making some changes on the layout, and removing reports that are redundant.

© 2009 IBM Corporation
IBM Academic Initiative: building skills for a smarter planet
29
Advanced Business User: 6.3 Interaction with the dashboard components
To begin this scenario:– 1. Open the IBM Cognos Connection using the following URL: http://machinename/ibmcognos– 2. On the My Actions pane click Create my dashboards to open a Getting Started Page of IBM
Cognos Business Insight. On this page, you can create a new existing dashboard. Open an existing dashboard to change it by clicking Open Existing and navigating to the folder where you imported the deployment archive that is provided in the additional material that is supplied with this book. Open the Business Insight folder, and click GO Sales Initial Dashboard

© 2009 IBM Corporation
IBM Academic Initiative: building skills for a smarter planet
30
Charts
Column charts Line charts Pie charts Bar charts Area charts Point charts Combination charts Scatter charts Bubble chart
Bullet charts Gauge charts Pareto charts Progressive charts Quadrant charts Marimekko charts Radar charts Win-loss charts Polar charts
Charts are the visual representation of quantitative information. They reveal trends and relationships between values that are not evident in lists or crosstab reports. For example, you can create a report that visually compares actual sales and planned sales or that shows the percentage share of product lines in the total revenue of the company.

© 2009 IBM Corporation
IBM Academic Initiative: building skills for a smarter planet
31
IBM Cognos Business Intelligence V10.1 Help Documentation
Exercises
Example - Run a Report Example - Schedule a Report Example - Create a Portal Page Example - Create a Query Example - Work with a Dashboard Example - Create a Statement-Style Report Example - Create a Report Example - Manage an Event Example - Monitor Performance Example - Create an Analysis Example - Work with IBM Cognos Content in
Microsoft Excel
IBM Academic Initiative recommended asset

© 2009 IBM Corporation
IBM Academic Initiative: building skills for a smarter planet
32
Let’s build a smarter planet
www.ibm.com/academicinitiative
Cloud & Deployment Options
© 2009 IBM Corporation
IBM Academic Initiative: building skills for a smarter planet
33
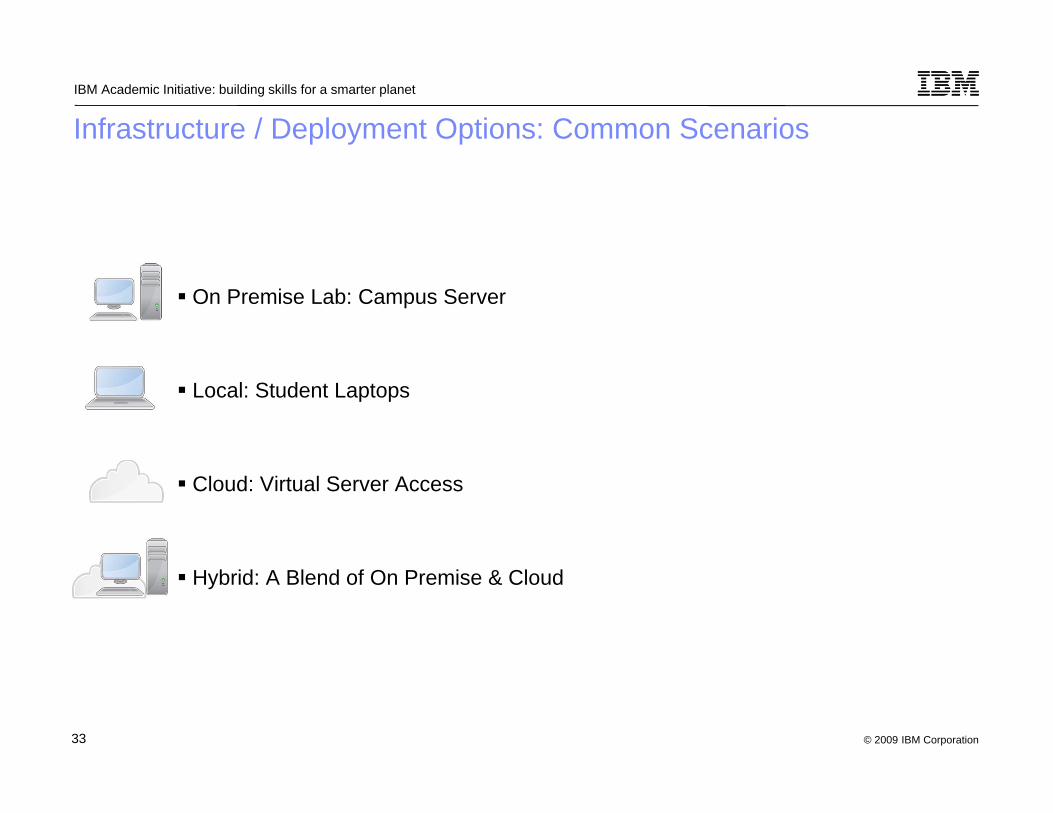
Infrastructure / Deployment Options: Common Scenarios
On Premise Lab: Campus Server
Local: Student Laptops
Cloud: Virtual Server Access
Hybrid: A Blend of On Premise & Cloud

© 2009 IBM Corporation
IBM Academic Initiative: building skills for a smarter planet
34
Next Steps
Course Assessment
Identify Current CourseCourse Goals
Syllabus
Key Skills
Identify Key Analytics Capabilities
1Technology Alignment
Business AnalyticsOn premise
Cloud virtualization
Deployment Planning
Schedule Skills Transfer (Faculty Briefing/Workshop)
2Content Review
Align Sample ExercisesReview Candidate Tutorials
Map To Syllabus
Brainstorm/Planning Session
3
© 2009 IBM Corporation
IBM Academic Initiative: building skills for a smarter planet
35
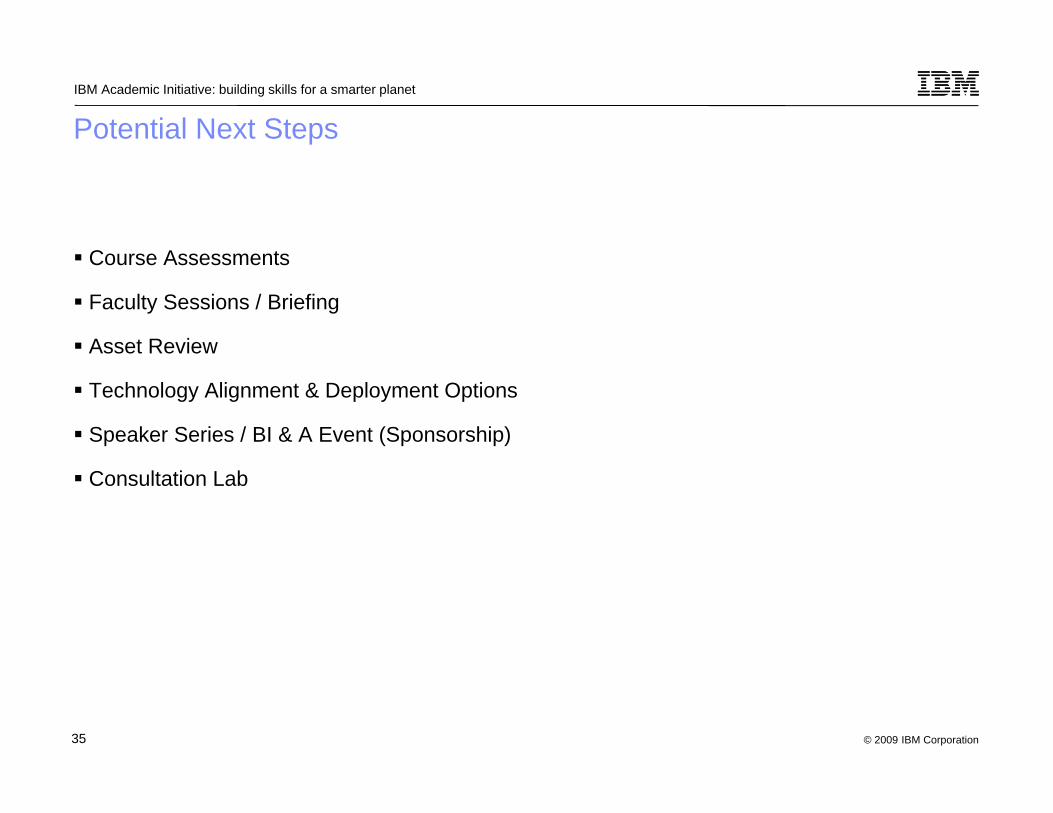
Potential Next Steps
Course Assessments
Faculty Sessions / Briefing
Asset Review
Technology Alignment & Deployment Options
Speaker Series / BI & A Event (Sponsorship)
Consultation Lab

© 2009 IBM Corporation
IBM Academic Initiative: building skills for a smarter planet
36
Analytics: Resources
IBM Analytics– www.ibm.com/analytics
Analytics: The Widening Divide– https://www14.software.ibm.com/webapp/iwm/web/signup.do?source=swg-
BA_WebOrganic&S_PKG=500016919&S_CMP=web_ba_hp_right
Smart Analytics– http://www.ibm.com/smarterplanet/us/en/business_analytics/ideas/index.html
Smarter Analytics Case Studies– http://www.ibm.com/smarterplanet/us/en/business_analytics/examples/index.html?lnk=us
sph2.12
IBM Institute for Business Value: Business Analytics Papers– http://www.ibm.com/services/us/gbs/thoughtleadership/bao.html

© 2009 IBM Corporation
IBM Academic Initiative: building skills for a smarter planet
37
Let’s build a smarter planet


© 2009 IBM Corporation
IBM Academic Initiative: building skills for a smarter planet
39
Watson
© 2009 IBM Corporation
IBM Academic Initiative: building skills for a smarter planet
40
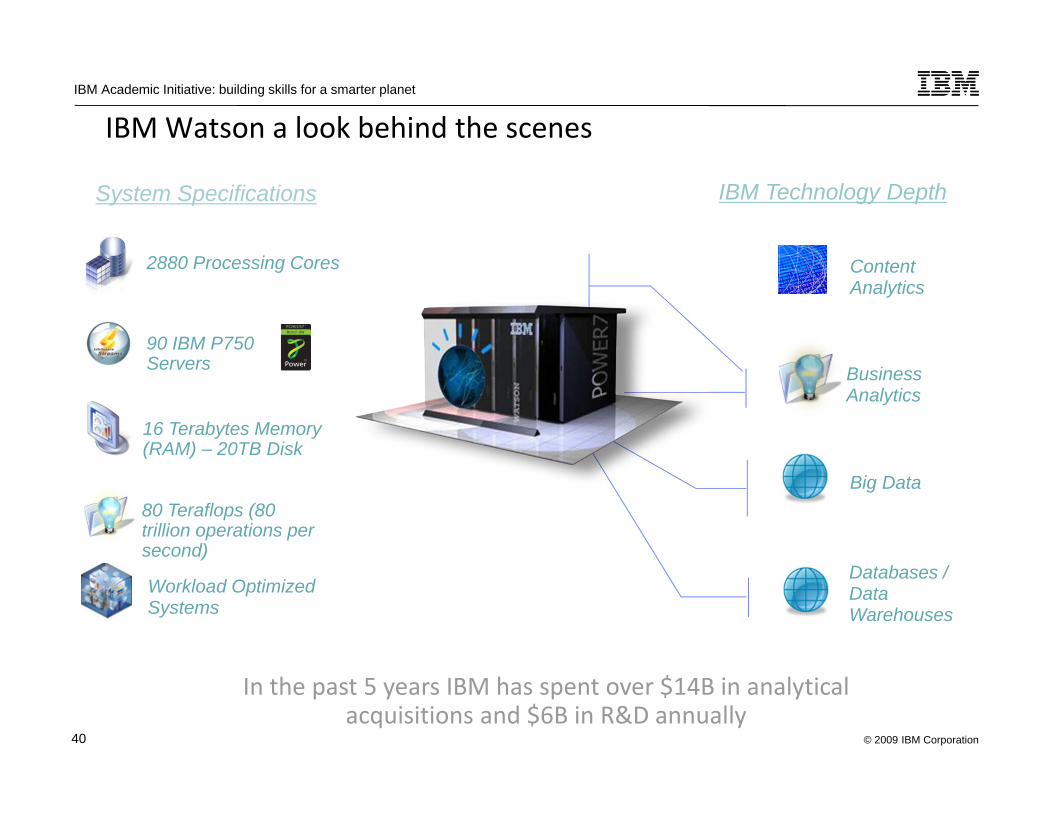
IBM Watson a look behind the scenes
Big Data
Content Analytics
IBM Technology Depth
Business Analytics
Databases / Data Warehouses
2880 Processing Cores
16 Terabytes Memory (RAM) – 20TB Disk
System Specifications
90 IBM P750 Servers
80 Teraflops (80 trillion operations per second)
Workload Optimized Systems
In the past 5 years IBM has spent over $14B in analytical acquisitions and $6B in R&D annually

© 2009 IBM Corporation
IBM Academic Initiative: building skills for a smarter planet
41
99%60%10%
Understands natural language and human speech
Adapts and Learns from user selections and responses
Generates and evaluates
hypothesis for better outcomes
3
2
1
…built on a massively parallel probabilistic evidence‐based architecture optimized for POWER7
IBM Watson brings together a set of transformational technologies to drive optimized outcomes

© 2009 IBM Corporation
IBM Academic Initiative: building skills for a smarter planet
42
Retail
After Watson: What are . . . the greatest possibilities?
Banking and Financial Markets Healthcare
Government

© 2009 IBM Corporation
IBM Academic Initiative: building skills for a smarter planet
43
Let’s build a smarter planet
www.ibm.com/academicinitiative
Business Analytics Skills Gap & Opportunity
© 2009 IBM Corporation
IBM Academic Initiative: building skills for a smarter planet
44

© 2009 IBM Corporation
IBM Academic Initiative: building skills for a smarter planet
45
The 2011 IBM Tech Trends Report offers a glimpse into the future of where technology is headed over the next two years. More than 4,000 IT professionals from 93 countries and 25 industries shared their opinions, and the report highlights trends from thefive countries with the highest number of responses: the United States, Brazil, Russia, India and China.
The survey focuses on business analytics, mobile, cloud and social business, four critical and interconnected technologies that developers can use today to determine which skills they need to build a Smarter Planet. Over the next 24 months, these areas will only continue to grow, fueling development, architectural and analytic opportunities:
•Business analytics•Mobile computing•Cloud Computing•Social Business

© 2009 IBM Corporation
IBM Academic Initiative: building skills for a smarter planet
46
© 2009 IBM Corporation
IBM Academic Initiative: building skills for a smarter planet
47

© 2009 IBM Corporation
IBM Academic Initiative: building skills for a smarter planet
48
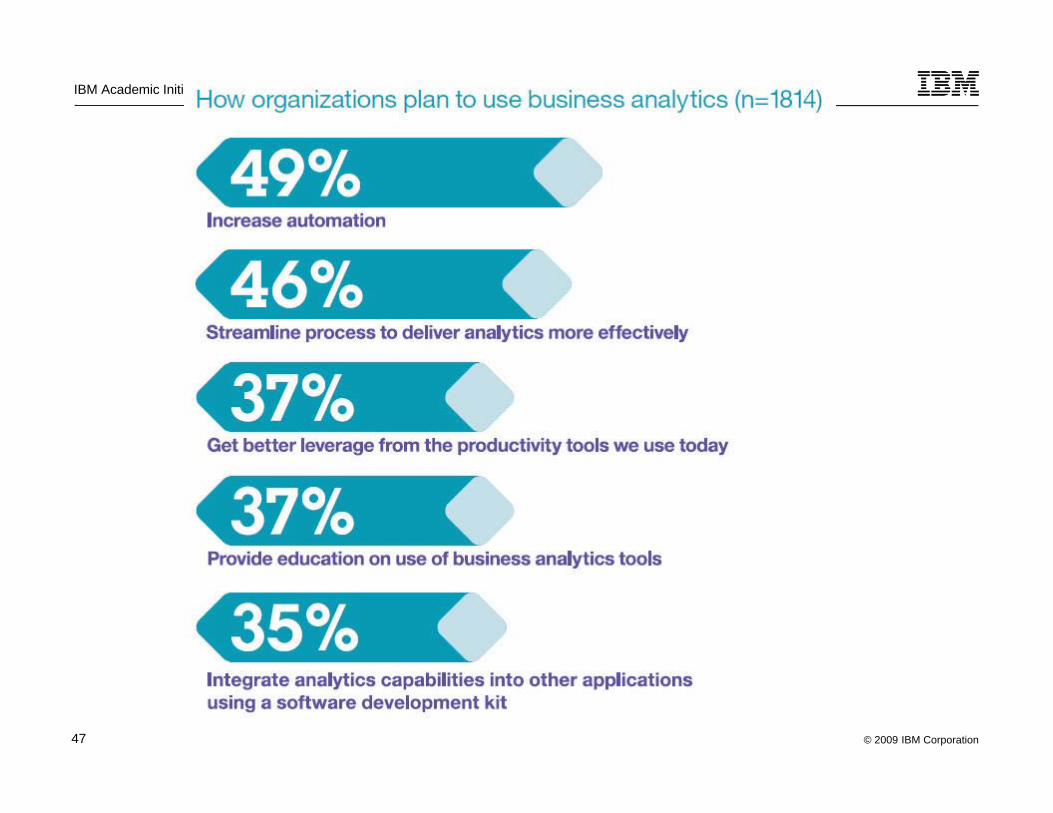
Industry Needs Help Developing Analytics Skills
Companies look to educational institutions to provide essential skills:
– 76% look for analysis and architectural skills– 86% look for database skills
Only 11% of companies feel new IT hires are well-trained and ready to go
Enterprise architecture skills and analytics/BI skills are in demand
– Close to 50% of large companies (> 10,000 employees) in survey are hiring architects
Source: Closing the IT Skills Gap: 2011 SHARE Survey for Guiding University and College IT Agendas
Source: SHARE
Not enough students are graduating today with the skills to handle the current information complexity. The size of the skills gap will grow only larger over the next 3-5 years as organizations look to make more use of their information assets..

© 2009 IBM Corporation
IBM Academic Initiative: building skills for a smarter planet
49
McKinsey Survey Forecasts Need for Information SkillsSurvey of IT professionals points to challenges moving to analytics-driven decisions
Information and analytics-driven decision making is used in almost all corporate functions
53% indicate improving the talent and capabilities of IT staff is a priority
Respondents highlight three inhibitors to using information in decision making:
– a cultural preference for using experience over data
– a lack of skills in synthesizing and translating the analytics and data
– concerns about data quality
Challenges with data analytics are “creating a ‘single source’ of truth, consolidating data architectures, and developing analytic tools and skills.”
McKinsey Quarterly December 2011:A rising role for IT: McKinsey Global Survey Results
http://bit.ly/w1RfyV

© 2009 IBM Corporation
IBM Academic Initiative: building skills for a smarter planet
50
Inc. The 5 Hardest Jobs to Fill 2012While you're planning your expansion, you're going to find that talent is in short supplyBy Keith Cline | Dec 19, 2011
So, what are the most competitive areas for talent these days? Here's a look:1. Software Engineers and Web Developers
2. Creative Design and User Experience
3. Product Management
4. Marketing
5. Analytics
Since data is becoming more and more accessible, smart companies are increasingly making decisions driven by metrics. Analytics is becoming a central hub across companies where everything (web, marketing, sales, operations) is being measured and each decision is supported by data. Thus, we are seeing a high level of demand for analytics and business intelligence professionals who almost act like internal consultants; they help determine what should be measured and then build out the capability for a company.
htt // i /k ith li /t l t h t i 2012 ht l

© 2009 IBM Corporation
IBM Academic Initiative: building skills for a smarter planet
51
Let’s build a smarter planet
www.ibm.com/academicinitiative
Big Data

© 2009 IBM Corporation
IBM Academic Initiative: building skills for a smarter planet
52
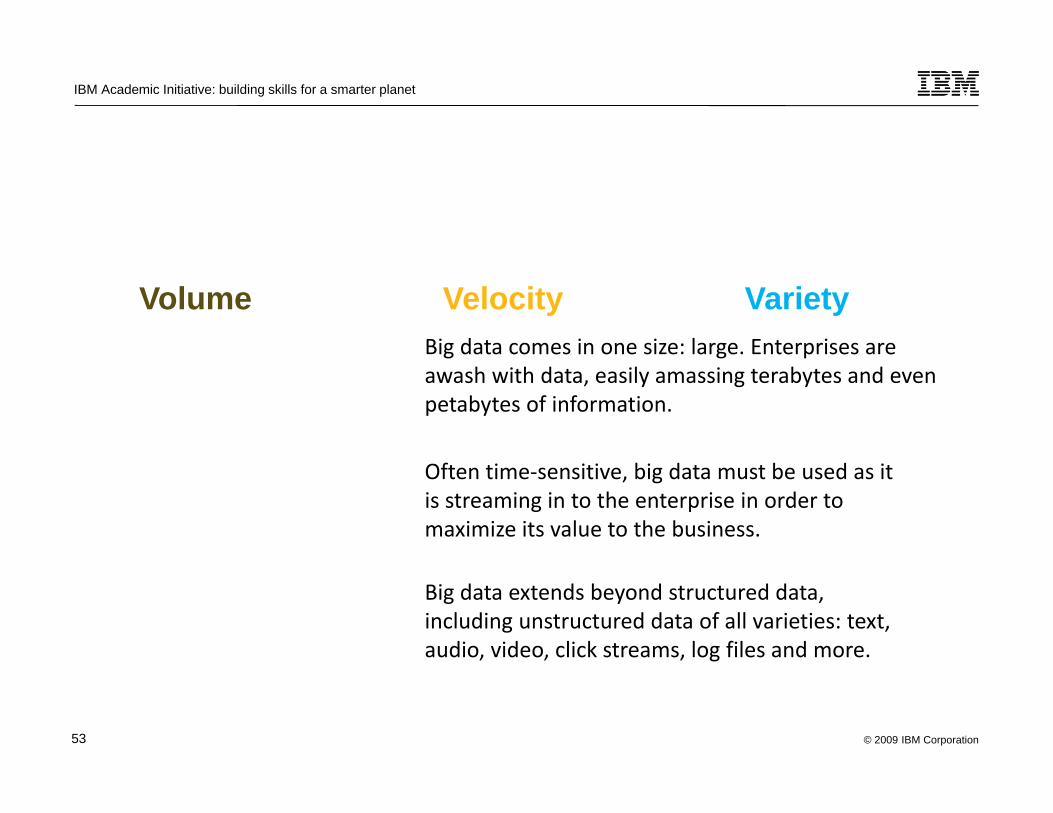
Volume Velocity
Everyday, we create 2.5 quintillion bytes of data–so much that 90% of the data in the world today has been created in the last two years alone.
Variety
© 2009 IBM Corporation
IBM Academic Initiative: building skills for a smarter planet
53
Volume Velocity VarietyBig data comes in one size: large. Enterprises are awash with data, easily amassing terabytes and even petabytes of information.
Often time‐sensitive, big data must be used as it is streaming in to the enterprise in order to maximize its value to the business.
Big data extends beyond structured data, including unstructured data of all varieties: text, audio, video, click streams, log files and more.

© 2009 IBM Corporation
IBM Academic Initiative: building skills for a smarter planet
54
Information is Exploding…
2009800,000 petabytes
202035 zettabytes
as much Information will be createdover the coming decade44x Of the world’s data
is unstructured80%
Source: IDC, The Digital Universe Decade – Are You Ready?, May 2010

© 2009 IBM Corporation
IBM Academic Initiative: building skills for a smarter planet
55
What can organizations do with Big Data?
UtilitiesWeather impact analysis on
power generationTransmission monitoringSmart grid management
Retail360° View of the CustomerClick-stream analysisReal-time promotions
Law EnforcementReal-time multimodal surveillanceSituational awarenessCyber security detection
TransportationWeather and traffic
impact on logistics and fuel consumption
Financial ServicesFraud detectionRisk management360° View of the Customer
ITTransition log analysis
for multiple transactional systemsCybersecurity
Health & Life Sciences Epidemic early warning
system ICU monitoring Remote healthcare monitoring
TelecommunicationsCDR processingChurn predictionGeomapping / marketingNetwork monitoring
55

© 2009 IBM Corporation
IBM Academic Initiative: building skills for a smarter planet
56
Enterprises are addressing challenges that emerged during the last era of computing..
1.2 Zetabytes (1.2trillion gigabytes) existin the “digital universe” 50% YTY growth 25% of data is unique;
75% is a copy
32.6 million serversworldwide 85% idle computer
capacity 15% of servers run 24/7
without being activelyused on a daily basis
Data centers havedoubled their energy usein the past five years 18%increase in data center
energy costs projected
Internet connected devices growing 42% per year
Since 2000 security vulnerabilities grew eightfold
…while ITbudgetsare growing
less than 1% per year.
Between 2000 and 2010 servers grew 6x (‘00-’10) storage grew 69x (‘00-’10) virtual machines grew 51% CAGR (‘04-’10)