ibm aix with oracle database performance: a beginner’s … · good knowledge of oracle database...
TRANSCRIPT

© Copyright IBM Corporation, 2012. All Rights Reserved. All trademarks or registered trademarks mentioned herein are the property of their respective holders
. . . . . . . .
IBM AIX with Oracle Database performance: a b eginner’s guide
Francisco Martín Riccio Chávez In collaboration with the
IBM Oracle International Competency Center July 18, 2012

IBM AIX performance with Oracle Database performance: a beginner’s guide http://www.ibm.com/support/techdocs © Copyright 2012, IBM Corporation
Table of Contents
Table of Contents .................................. ................................................................................... 2
Abstract........................................... .......................................................................................... 1
Prerequisites...................................... ....................................................................................... 1
Introduction ....................................... ....................................................................................... 1
Oracle Database tuning methodology ................. ................................................................... 1 Tuning methodology........................................................................................................................... 1
Scenarios analyzed ................................. ................................................................................. 3 Scenario one...................................................................................................................................... 3
Operating system metrics ............................................................................................. 3 Oracle Database metrics .............................................................................................. 4
Scenario two .....................................................................................................................................10 Operating system metrics ............................................................................................10 Database metrics.........................................................................................................15
Scenario three ..................................................................................................................................33 Operating system metrics ............................................................................................33 Database metrice ........................................................................................................41
Summary............................................ ..................................................................................... 57
References......................................... ..................................................................................... 58 Oracle documentation .......................................................................................................................58 IBM documentation ...........................................................................................................................58 IBM and Oracle Web sites.................................................................................................................58
About the author................................... .................................................................................. 59
Trademarks and special notices ..................... ...................................................................... 60

IBM AIX performance with Oracle database performance: a beginnner’s guide http://www.ibm.com/support/techdocs © Copyright 2012, IBM Corporation 1
Abstract
The purpose of this paper is to assist those who are experiencing performance problems with the Oracle Database running under IBM AIX® and need to review some methodologies and considerations for addressing these problems. This is a beginner’s guide. The information provided here is based on experiences with tests done at the IBM Oracle International Competency Center, and on available public documentation from IBM and Oracle.
Prerequisites � Good knowledge of Oracle Database (installation, configuration, architecture). � Knowledge of the IBM AIX operating system.
Introduction
This paper will discuss the necessary steps that a database administrator (DBA) could follow as a methodology for resolving performance problems by examining three real cases presented here.
For this paper, we have used some available tools for the Oracle Database such as Orion, OS Watcher Black Box, AWR and ASH Report.
The objective of this document is to document how to:
• Follow a methodology to resolve performance problems.
• Learn how to use some monitoring tools to identify problems.
• Develop an action plan to address some common performance problems.
Oracle Database tuning methodology
Tuning methodology
The summary of this methodology is represented by the following graphic:

IBM AIX performance with Oracle database performance: a beginnner’s guide http://www.ibm.com/support/techdocs © Copyright 2012, IBM Corporation 2
Figure 1: Oracle Database tuning methology
As general rule, heavy CPU usage can be caused by badly written SQL statements whereas a high value of wait time can be caused by a miss-configuration of the database, operating system or storage.
At this point, a DBA first needs to identify whether the performance problem is a problem with badly written queries or a problem in the infrastructure configuration.
We will use the following formulas as part of the methodology:
Response Time = CPU Time + Wait Time
Where:
CPU Time = CPU Parse (parse time cpu) + CPU Recursive (recursive cpu usage) + CPU Other
CPU Other = CPU used by this session - parse time cpu - recursive cpu usage
When we want to analyze a performance problem, it is important that we analyze a one-hour maximum time window to apply the methodology; these values can be obtained with some tools that this document will refer in the examples.
In addition, it is important that we know which metrics we can review to determine if the changes we’ve made have provided an improvement in the system performance.
I recommend using the metric Average Active Session (AAS). This metric can be used also as our response time of our database.
This metric has the following formula:
Average Active Session = DBTime / Elapsed Time
Database time (DBTime) is total time spent by user processes (foreground sessions) either actively working or actively waiting in a database call; it excludes idle wait time.
As rule:

IBM AIX performance with Oracle database performance: a beginnner’s guide http://www.ibm.com/support/techdocs © Copyright 2012, IBM Corporation 3
If Average Active Session > # CPU Cores then your database performance is likely slow.
Scenarios analyzed
In the following pages, we will review different real cases and we will show you how to apply the methodology.
Scenario one
In scenario one, I have analyzed an in-house application running under Oracle Database 10.2.0.4 for AIX 6.1. The server is a Power 750 with two cores, 32 GB of RAM and the data files of our database are in file system JSF2. The cores are configured with SMT so there are 8 threads available.
In this case my interval analysis is: 12:00 pm – 13:00 pm.
First, we should select know the hour that we will review. This input can be obtained from tools that can examine the operating system performance data and also the end-user’s perceptions of application performance.
Operating system metrics
Oracle provides a tool named Oracle OSWatcher Black Box, it is documented on the “My Oracle Support” web site in note 301137.1 (OS Watcher Black Box User Guide). This tool lets us use some metrics from the operating system.
In my analysis, I show some important metrics as:
Process Run Queue:
This is the number of processes waiting to be served by the processor. We have the following rule:
If run queue > 2x#Cores then the operating system performance is degraded; this holds true for both is for Intel® and POWER5® processor types
If run queue > 3x#Cores then the operating system performance is degraded; this holds true for POWER6® and POWER7® processors.
In this case, our server is a two-core Power 750, where each core has 4 threads because it is configured with SMT.
So, in the following graphic we can see that from 12:00 pm to 13:00 pm there are peaks above 20 as a run queue.
20 run queue > 2 (core) x 4 (threads x CPU) x 3

IBM AIX performance with Oracle database performance: a beginnner’s guide http://www.ibm.com/support/techdocs © Copyright 2012, IBM Corporation 4
Also we can see that there is a high percent CPU utilization for applications (CPU Utilization User).
Note: A metric of 100% CPU is not necessarily related to equipment degradation; it should be confirmed with the run queue metric.
Also we can see that our utilization by the operating system’s kernel is slow.
As rule, the value of this metric must be less than 30%.
In respect to these graphics we can infer that the CPU utilization is high.
Oracle Database metrics
Since we are using Oracle Database 10g we can get two important reports, the AWR and ASH report. The first report will provide a summary report regarding the behavior of our database and the second report will provide information about the active sessions that were running during the interval analyzed.
Information about AWR report can be read at the following url: http://www.oracle.com/technetwork/database/focus-areas/performance/tips-perf-awr-sql-report-129542.pdf
The following link can be read to get information about ASH report:
http://docs.oracle.com/cd/B19306_01/server.102/b14211/autostat.htm

IBM AIX performance with Oracle database performance: a beginnner’s guide http://www.ibm.com/support/techdocs © Copyright 2012, IBM Corporation 5
In both links, the steps necessary to generate the reports the reports are shown.
In our case, we will review the report AWR.
Average Active Session:
Average Active Session = DBTime / Elapsed Time => 3342.73 / 60.61 = 55.15
Average Active Session > # Cores, so 55.15 > 12, showing this is a database with poor response time in the interval analyzed.
So, we have a database with degraded performance and this is related to what we saw with the operating system metrics.
Review General Load Profile:
Looking at this report we can draw the following conclusions:
� The number of hard parses is very low because of 40.30 parses only 1.79 is by hard parses. Also we can see that our number of soft parses is low because of 18675.43 executions only 40.30 were by parses. So we can infer that our shared pool apparently is set up well.
� The number of physical reads is a low value with respect to logical reads. So we can infer that our buffer cache pool apparently is set up well.
IBM AIX performance with Oracle database performance: a beginnner’s guide http://www.ibm.com/support/techdocs © Copyright 2012, IBM Corporation 6
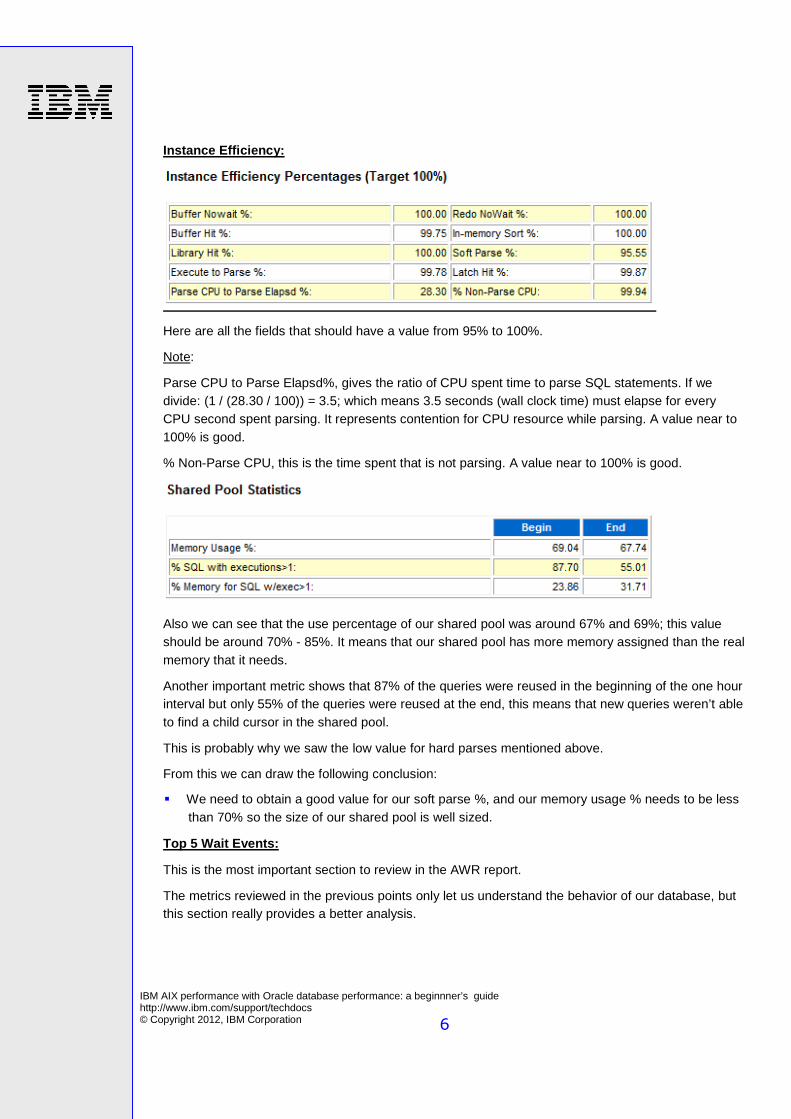
Instance Efficiency:
Here are all the fields that should have a value from 95% to 100%.
Note:
Parse CPU to Parse Elapsd%, gives the ratio of CPU spent time to parse SQL statements. If we divide: (1 / (28.30 / 100)) = 3.5; which means 3.5 seconds (wall clock time) must elapse for every CPU second spent parsing. It represents contention for CPU resource while parsing. A value near to 100% is good.
% Non-Parse CPU, this is the time spent that is not parsing. A value near to 100% is good.
Also we can see that the use percentage of our shared pool was around 67% and 69%; this value should be around 70% - 85%. It means that our shared pool has more memory assigned than the real memory that it needs.
Another important metric shows that 87% of the queries were reused in the beginning of the one hour interval but only 55% of the queries were reused at the end, this means that new queries weren’t able to find a child cursor in the shared pool.
This is probably why we saw the low value for hard parses mentioned above.
From this we can draw the following conclusion:
� We need to obtain a good value for our soft parse %, and our memory usage % needs to be less than 70% so the size of our shared pool is well sized.
Top 5 Wait Events:
This is the most important section to review in the AWR report.
The metrics reviewed in the previous points only let us understand the behavior of our database, but this section really provides a better analysis.

IBM AIX performance with Oracle database performance: a beginnner’s guide http://www.ibm.com/support/techdocs © Copyright 2012, IBM Corporation 7
Here we can apply the formula: Response Time = CPU Time + Wait Time
� CPU Time = 34.9% and Wait Time = 65.1%
So we must analyze the principal events: CPU Time, TCP Socket (KGAS) and enq: TX – row lock contention.
Analyzing CPU Time:
Potential high CPU consumption can be caused by poorly designed queries or high numbers of hard parses. In our case the number of hard parses is low, as seen in the previous sections. Therefore we should review the queries that are taking up too much CPU processing, they can be found in the section SQL ordered by CPU Time.
These queries should be reviewed with the developer’s team to get a better design for the query. Looking at the first query; we would estimate that it is a query with a high cost of 3032, as shown in the following report. Experience shows a heavy query has a cost above 1000.

IBM AIX performance with Oracle database performance: a beginnner’s guide http://www.ibm.com/support/techdocs © Copyright 2012, IBM Corporation 8
Examining the SQL for the query shows that there are some possible improvements that could be made, for this query they would be:
� Replace the count(*) by count(1). � Avoid full table scans. � Use the clause WITH to allow for reuse of the result set of a subquery called multiple times. This
query uses a union for all four identical subqueries so the Oracle Database will execute the subqueries four times, using the clause WITH instead, the Oracle Database will execute only one subquery and reuse the same result set in the following executions.
Wait Time:
TCP Socket (KGAS)
This wait event occurs as a result of waiting for the response of some remote service using TCP, TCPS, FTP, POP3, etc.
In our example we have this wait event, so we must review the codes that are waiting for this reason, we can get that from the ASH report.
Reviewing the ASH report, we will see the following sub-report:

IBM AIX performance with Oracle database performance: a beginnner’s guide http://www.ibm.com/support/techdocs © Copyright 2012, IBM Corporation 9
The SQL ID f3vugcnjd2jmk not only is waiting for this event but also is causing a 16.68% impact in the response time. In the AWR report we can identify that the same query has the most runtime in the analysis period.
Reviewing the code we can see the following as a fragment in the code:
The code is consuming a web service, so the delay time in the database occurs because the web service is taking a long time to give the result. The web service owner should then review this delay time in the overall service.
enq: TX - row lock contention:
This waiting event occurs when there are multiple requests for blocks to a set of rows. It is important to review in the AWR report the section “Segment by Row Lock Wait”.

IBM AIX performance with Oracle database performance: a beginnner’s guide http://www.ibm.com/support/techdocs © Copyright 2012, IBM Corporation 10
After we reviewed it with the development team, we learned that the application must allow users to generate multiple DML operations on a same set of rows concurrently.
Conclusions:
� Improving the design of the queries (code) listed early in the AWR report in the section: SQL Ordered by CPU.
� Review with the application's functional analysts the reason of executing DML operations concurrently by different users in the following tables. � PERDATMAE. � IM1HISTEXAMEN. � LQDOPERA. � LQDLIQUID. � PBFDOCVTA.
� Once the changes are applied, next we must look again at the metrics and ensure that the Average Active Session value is less than it was before.
Scenario two
In the scenario two, we will analyze an SAP system (version 6) using the Oracle Database 10.2.0.5 with AIX 5.3. The SAP application and Oracle Database are on the same server.
The server is a Power 750 with 16 cores, 256 GB of RAM and the data files for the database are in file system JSF2. The cores are configured with SMT so there are 32 threads available.
The database has a contingency solution using Oracle Standby Database.
In this case my interval analysis is 8:00 am – 10:00 am.
Operating system metrics
IBM provides a tool named: NMON, this tool provide performance metrics for the operating system. Information about NMON is available in the following URL:
http://www.ibm.com/developerworks/wikis/display/WikiPtype/nmon
In my analysis, I show some important metrics as:
CPU Usage

IBM AIX performance with Oracle database performance: a beginnner’s guide http://www.ibm.com/support/techdocs © Copyright 2012, IBM Corporation 11
In this graphic, we can see that CPU usage is a low.

IBM AIX performance with Oracle database performance: a beginnner’s guide http://www.ibm.com/support/techdocs © Copyright 2012, IBM Corporation 12
Process Run Queue:
From this graph we can see that our process run queue value never gets higher than 20. The database server has 32 (SMT) cores so a run queue of 20 is a good metric. We would have problems if we get a process run queue value higher than 96 (32 cores (SMT) x 3). From this we can conclude that CPU’s resource is not a possible problem for our database.
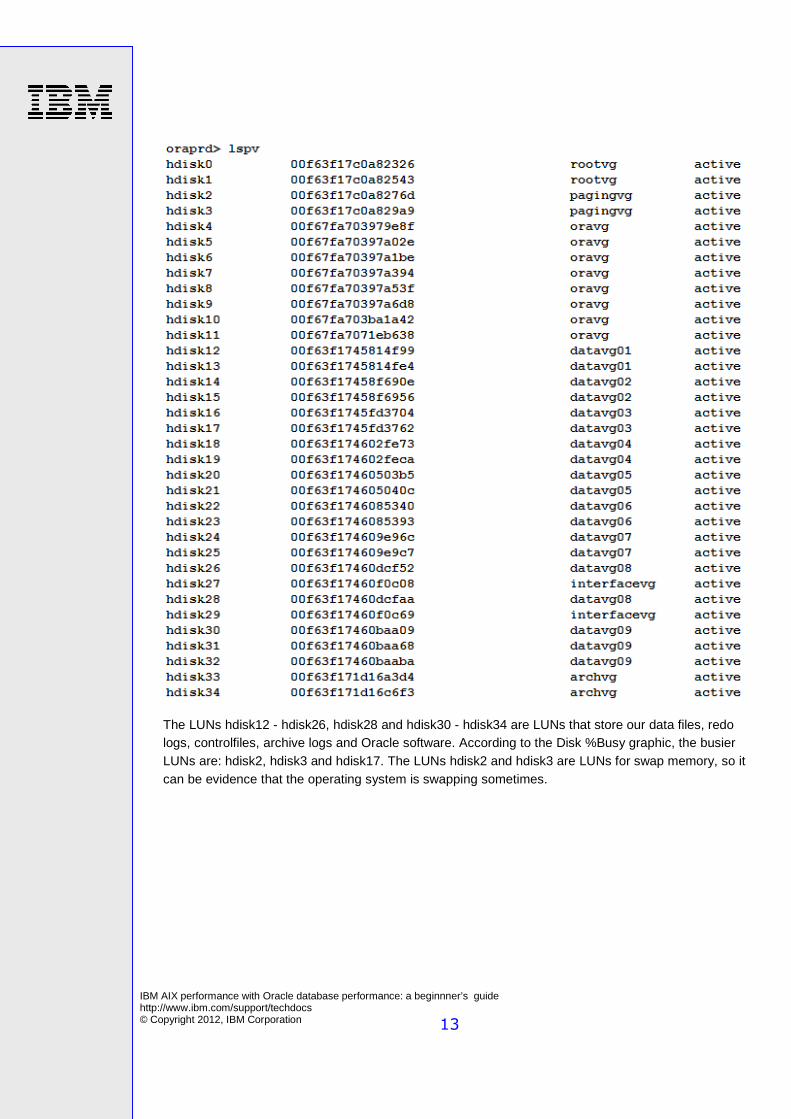
Disk Usage:
Here we can see that some LUNs are more saturated than others.
IBM AIX performance with Oracle database performance: a beginnner’s guide http://www.ibm.com/support/techdocs © Copyright 2012, IBM Corporation 13
The LUNs hdisk12 - hdisk26, hdisk28 and hdisk30 - hdisk34 are LUNs that store our data files, redo logs, controlfiles, archive logs and Oracle software. According to the Disk %Busy graphic, the busier LUNs are: hdisk2, hdisk3 and hdisk17. The LUNs hdisk2 and hdisk3 are LUNs for swap memory, so it can be evidence that the operating system is swapping sometimes.

IBM AIX performance with Oracle database performance: a beginnner’s guide http://www.ibm.com/support/techdocs © Copyright 2012, IBM Corporation 14
Memory Usage:
Here we can observe our server is using swap memory from 8:00 am until 7:30 pm. We can also see an excesive use of memory RAM, an interesanting performance formula is:
SYSTEM % + PROCESS % < 65% (Recommended)
In our case the sum of SYSTEM % + PROCESS % has a value higher than 80%. From this we can infer that our database may have possible problems with getting free memory. It is important to know how much memory our Oracle process is consuming, and also how it is using the memory in the server.

IBM AIX performance with Oracle database performance: a beginnner’s guide http://www.ibm.com/support/techdocs © Copyright 2012, IBM Corporation 15
Here we can see that the SAP process as an application is taking more memory than other processes. In second place is the database server process.
Database metrics
The source of information for this section is the AWR report.
Average Active Session:
Reviewing this general metric, we have the following information.
So, our Average Active Session is: 1,816.46 / 120.11 = 15.12. This is an acceptable value; we would have problems if the value was closer to 32.

IBM AIX performance with Oracle database performance: a beginnner’s guide http://www.ibm.com/support/techdocs © Copyright 2012, IBM Corporation 16
Load Profile:
From this we can draw some possible conclusions:
� There is a low value of hard parses with respect to total number of parses. This may indicate that the Shared Pool is properly configured and good programming practices are being used.
� There is a low value of physical reads vs. logical reads. This may indicate that Buffer Cache is properly configured.
� There aren’t many transactions in the analyzed interval but each transaction has modified many data blocks. Also there are few rollbacks in the completed transactions.
The following information can help us to confirm our possible conclusions:
Here we can see that our Shared Pool has been used at 75%, which is a good metric; it should be between 70% and 85%. Also 86% of the total of queries executed in our analysis interval have been executed more than once.

IBM AIX performance with Oracle database performance: a beginnner’s guide http://www.ibm.com/support/techdocs © Copyright 2012, IBM Corporation 17
Here we can see that our buffer cache in the analysis interval remained with the same amount of memory utilized.
Instance Efficiency Percentages:
Here all our fields have a value higher than 95% except the field: Parse CPU to Parse Elapsd %, which shows us that every 8.95 seconds the CPU works one second in the parse phase.
The value of 8.95 is calculated as: 1 / (11.17 / 100). Next we’ll confirm that our instance is set up well.
Top 5 Wait Events:
So, if we apply the formula:
Response Time = CPU Time + Wait Event
CPU Time = 22.4%
Wait Time = 77.6%
This database is not experiencing long CPU wait times, also from the operating system reports we arrived at a similar conclusion.

IBM AIX performance with Oracle database performance: a beginnner’s guide http://www.ibm.com/support/techdocs © Copyright 2012, IBM Corporation 18
In the following steps we will analyze how to improve the response time decreasing the wait event “db file sequential read” and the CPU time.
db file sequential read:
This event means that the user process is reading data into the SGA buffer cache and is waiting for a physical I/O call to return. db file sequential read corresponds to a single-block read. Single block I/Os are usually the result of using indexes. The result set of an index scan is large.
Some tips to decrease the wait time for this event:
� Check if an execution plan is executing a “TABLE ACCESS BY INDEX ROWID”; this operation makes random accesses to the table rows and has an expensive cost. It may be worth creating a new index that avoids the operations of “TABLE ACCESS BY INDEX ROWID”.
� Improve the I/O devices where the table resides. � Validate that our index is not fragmented. � Consider using parallel execution with high degree. � Consider using IOT if the index is defined on a unique key. � Consider increasing buffer cache so that more table blocks can be cached. It is a good idea to
use keep buffer pool if the table is frequently accessed. � Move the table into the tablespace with a larger block size. And, it may be a little helpful to
reorganize the table so the index may have a smaller clustering factor.
As a first step, we must review the SQL ordered by Gets and Reads.
Remember that Gets are logical reads. We will analyze the following queries:
Queries: 6ywpf1zpv1jdt and du6mhrh8xhrq5, both queries take 6.94% (4.39% + 2.55%) DB Time.
The first query is an anonymous PLSQL that executes an sql statement under some conditions; this sql statement is the second query reported in the grid. This query is not executed by the SAP application, but is code that is a specialized tool for monitoring the Oracle Database.
Researching the documentation of this tool, this statement is executed for each ORA- error message that is detected by the Oracle Database server. So this query was executed 40,160 times as average in an interval of one hour, so 40,160 times an ORA- error message was detected in the Oracle Database server.

IBM AIX performance with Oracle database performance: a beginnner’s guide http://www.ibm.com/support/techdocs © Copyright 2012, IBM Corporation 19
The plan execution has low cost:
So here the problem is that this query is executing it multiple times, so it is important to disable this option in the monitoring tool and work with SAP support to find out why the application is having lots of ORA- error messages.
Query: 4zpk2sj4913q5, it has a % Wait Time: 1.92. Its executing plan is:
We can see that its cost is low and is using an index with the step INDEX RANGE SCAN. When we review the index TRFCQOUT~3, we see the following information:

IBM AIX performance with Oracle database performance: a beginnner’s guide http://www.ibm.com/support/techdocs © Copyright 2012, IBM Corporation 20
So we will create an index that was built in the same order that is defined in the clause WHERE for this query:
The hide parameter “_use_nosegment_indexes” lets us test if new indexes will be used for the optimizer.
We can see that the cost of this plan is less than the previous plan. Also we must remember that this query is executed 3,835 times in one hour. As the query belongs to Standard Query of SAP, so the creation of this index must be validated by SAP support.

IBM AIX performance with Oracle database performance: a beginnner’s guide http://www.ibm.com/support/techdocs © Copyright 2012, IBM Corporation 21
Query: 6hb11zp0dz0wc, this query has the following plan:
Remember that this query had executed 1,124 times and taken 1.87% DB Time. We will review the structure of the index KSSK ~0:
We will create an index that is built in the same order that is defined in the “where” of this query:
We will review again the execution plan:

IBM AIX performance with Oracle database performance: a beginnner’s guide http://www.ibm.com/support/techdocs © Copyright 2012, IBM Corporation 22
We can see that the cost in this new execution plan is 1; again this new index must be checked on with SAP support.
Remember that: Reads are physical reads.
Query 3mnbr73n5stj8, this query is taking 5.13% of DB Time.
Each execution takes 1,387,864.25 blocks, so 1,387,864.25 x 8,192 bytes (1 data block is 8,192 bytes), this means 10.59 GB of RAM taken in each execution. This is a high value, so it takes a lot of space in the Buffer Cache in our SGA.
Reviewing the execution plan:

IBM AIX performance with Oracle database performance: a beginnner’s guide http://www.ibm.com/support/techdocs © Copyright 2012, IBM Corporation 23
This query has a high cost and the execution plan executes a full scan table. So, we will create a possible index:
We can see that the cost of this new execution plan is 1. This recommendation must be confirmed with SAP support.
The following query 607mk13ad6a6n, is the second top query when ordered by reads and the sixth query when ordered by gets. We will review the execution plan:

IBM AIX performance with Oracle database performance: a beginnner’s guide http://www.ibm.com/support/techdocs © Copyright 2012, IBM Corporation 24
We can see that it has a low value (2) and it is executed 4,747,348 times taking a 1.96% DB Time. This is the structure of the index MSEG~Z03.
We will create one index that is created with the same columns defined as in the WHERE clause.
The cost is reduced to 1 reducing the % DB Time by about 50%. This recommendation should be confirmed working together with SAP support.

IBM AIX performance with Oracle database performance: a beginnner’s guide http://www.ibm.com/support/techdocs © Copyright 2012, IBM Corporation 25
At this point we have reviewed the queries that together are taking the 17.82% DB Time.If we review the statistics about our tablespaces:
A good metric is when a tablespace has an Av. Rd (ms) and Av. Buf Wt (ms) that are less than 20. A value between 5 and 10 is excellent. Above we have highlighted the tablespaces that have a metric that is not acceptable.
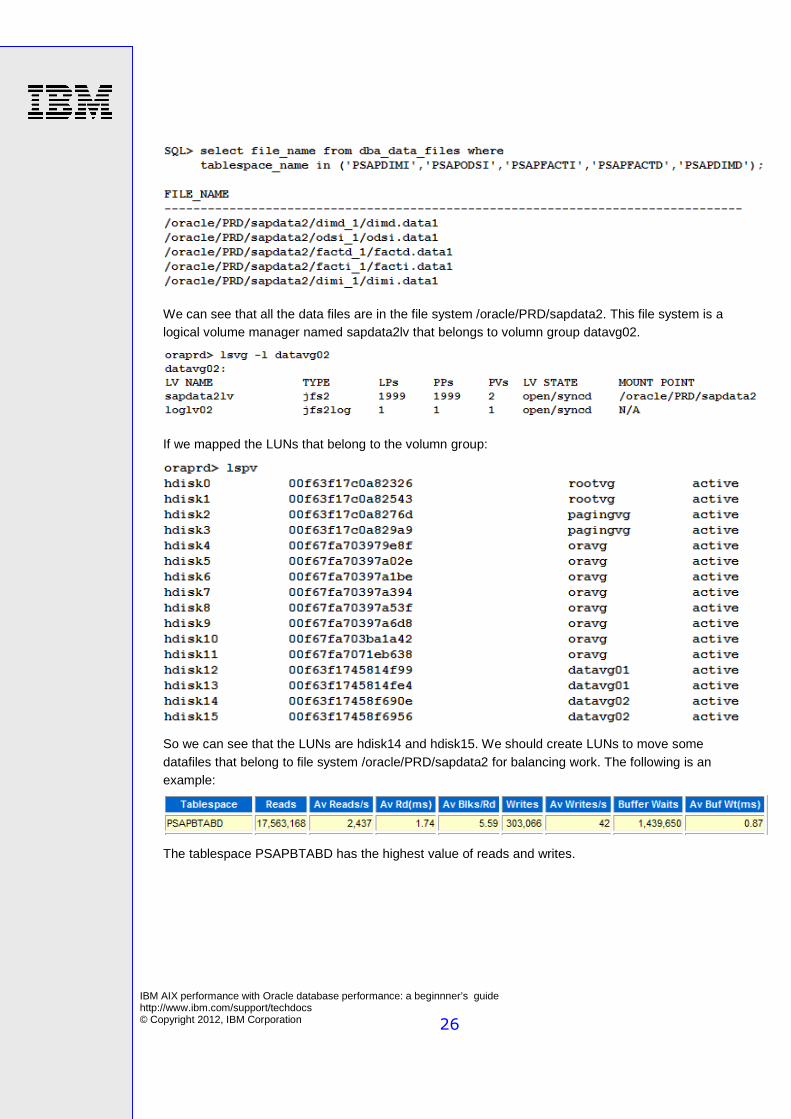
If we review the data files that belong to the five top tablespaces io stats.
IBM AIX performance with Oracle database performance: a beginnner’s guide http://www.ibm.com/support/techdocs © Copyright 2012, IBM Corporation 26
We can see that all the data files are in the file system /oracle/PRD/sapdata2. This file system is a logical volume manager named sapdata2lv that belongs to volumn group datavg02.
If we mapped the LUNs that belong to the volumn group:
So we can see that the LUNs are hdisk14 and hdisk15. We should create LUNs to move some datafiles that belong to file system /oracle/PRD/sapdata2 for balancing work. The following is an example:
The tablespace PSAPBTABD has the highest value of reads and writes.
IBM AIX performance with Oracle database performance: a beginnner’s guide http://www.ibm.com/support/techdocs © Copyright 2012, IBM Corporation 27
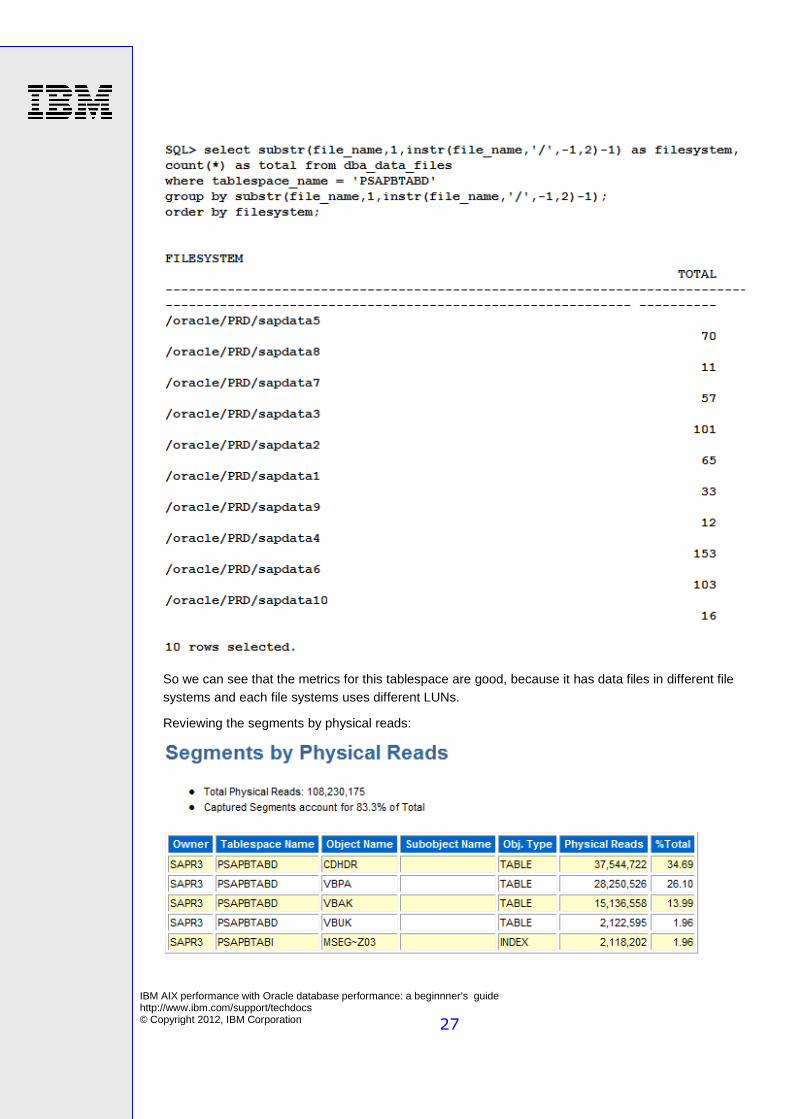
So we can see that the metrics for this tablespace are good, because it has data files in different file systems and each file systems uses different LUNs.
Reviewing the segments by physical reads:

IBM AIX performance with Oracle database performance: a beginnner’s guide http://www.ibm.com/support/techdocs © Copyright 2012, IBM Corporation 28
The size of the tables CDHDR and VBPA are:
The table CDHDR was used by the query: 3mnbr73n5stj8.
This query is:
SELECT /*+ FIRST_ROWS (1) */ * FROM "CDHDR" WHERE "MANDANT" = :A0 AND "CHANGENR" = :A1 AND ROWNUM <= :A2
As this query is executed 4 times; each execution tries to allocate 10.59 GB (1,387,864.25 * 8192 bytes) of memory RAM; and as seen in the previous sections we would like to improve the response time. The table VBPA only was used one time by each query: gmfy98q99g9g8 and 7f816a6uc39cc.
If it is only executed twice and works with lots of data blocks, we should enable the Recycle Pool.

IBM AIX performance with Oracle database performance: a beginnner’s guide http://www.ibm.com/support/techdocs © Copyright 2012, IBM Corporation 29
Remember that the Recycle Pool is just for big tables with a very little use.
It is recommendable to enable with 2 GB of RAM.
SQL> alter system set db_recycle_cache_size = 2G;
Then: SQL> ALTER TABLE SAPR3.VBPA STORAGE (BUFFER_POOL RECYCLE);
Also, it is important to review if each table in the top of segments are fragmented by physical reads. So for the table: CDHDR:
select
round((ds.blocks-dt.empty_blocks-dt.blocks)/(ds.blocks-dt.empty_blocks),2) as ratio
from dba_tables dt join dba_segments ds on ds.segment_name = dt.table_name
and ds.owner = 'SAPR3' and ds.segment_type='TABLE' and dt.table_name = 'CDHDR';
In case of a ratio of 20, it would be advisable to execute a defragmentation operation of due to the fact that the table has a big size.
The table: VBPA
Both tables aren’t fragmented.
Another consideration, if the tablespace PERFSTAT is created, this tablespace is used by Statspack. Since we are using AWR, we can uninstall the Statspack product.

IBM AIX performance with Oracle database performance: a beginnner’s guide http://www.ibm.com/support/techdocs © Copyright 2012, IBM Corporation 30
Analyzing CPU Time:
It is important to identify the percentage of CPU that uses our instance. We must do the following calculation:
% TOTAL CPU FOR INSTANCE = (TIME DB CPU (Wait Events) / ELAPSED TIME (sec)) / # CORES
% UTILIZATION CPU SO = (USER_TIME+SYS_TIME) / (IOWAIT_TIME+BUSY_TIME+IDLE_TIME)
% UTILIZATION CPU TOTAL = % TOTAL CPU FOR INSTANCE / % UTILIZATION CPU SO
So the database instance is using a 31.715% of all the CPU available in the server. We must apply the formula:
CPU Time = CPU Parse (parse time cpu) + CPU Recursive (recursive cpu usage) + CPU Other
Where:

IBM AIX performance with Oracle database performance: a beginnner’s guide http://www.ibm.com/support/techdocs © Copyright 2012, IBM Corporation 31
CPU Other = CPU used by this session - parse time cpu - recursive cpu usage
These values are got in the section of AWR Report named Instance Activity Stats.
CPU Other = 1,497,235 + 14,398 - 97,796 = 1,413,837 cs, so 14,138.37 seconds,
14,138.37 / CPU Time = 14,138.37 / 24,411 = 57.92% x 22.4% (CPU Time % Total) = 12.97%
CPU Parse = 14,398 cs / 100 = 143.98 seconds, so 143.98 / 24,411 = 0.59% x 22.4% = 0.13%
CPU Recursive = 97,796 cs / 100 = 977.96 seconds, so 977.96 / 24,411 = 4.01% x 22.4% = 0.90%
CPU Other is a significant component with a value of 12.97%, so the possible next step is to look at the SQL ordered by Gets section. This activity was previously done.
It is also recommended to review the SQL ordered by CPU.
Where the first top query was reviewed in the SQL ordered by Gets.
The second query is:
SELECT /*+ FIRST_ROWS (1) */ * FROM SAPR3."CE41000"
WHERE "MANDT" = :A0 AND "AKTBO" = :A1 AND "KNDNR" = :A2 AND "ARTNR" = :A3 AND "FKART" = :A4 AND "KAUFN" = :A5 AND "KDPOS" = :A6 AND "AUFNR" = :A7 AND "BUKRS" = :A8 AND "KOKRS" = :A9 AND "WERKS" = :A10 AND "GSBER" = :A11 AND "VKORG" = :A12 AND "VTWEG" = :A13 AND "SPART" = :A14 AND "PRCTR" = :A15 AND "PPRCTR" = :A16 AND "KSTRG" = :A17 AND "PSPNR" = :A18 AND "MEINH" = :A19 AND "KMVKBU" = :A20 AND "WGRU1" = :A21 AND "WGRU2" = :A22 AND "WGRU3" = :A23 AND "MATKL" = :A24 AND "WW001" = :A25 AND "WW002" = :A26 AND "BZIRK" = :A27 AND "WW008" = :A28 AND "WW009" = :A29 AND "KMVTNR" = :A30 AND "PAPH1" = :A31 AND "PAPH2" = :A32 AND "PAPH3" = :A33 AND "WW012" = :A34 AND "COPA_KOSTL" = :A35 AND "WW013" = :A36 AND "WW011" = :A37 AND "WW014" = :A38 AND "PV2NR" = :A39 AND "WW015" = :A40 AND "PV3NR" = :A41 AND "PLGTP" = :A42 AND "PV4NR" = :A43 AND "VKGRP" = :A44 AND "PV5NR" = :A45 AND "WW018" = :A46 AND "WW019" = :A47 AND "WW020" = :A48 AND "WW017" = :A49 AND "SOBSL" = :A50 AND "WW021" = :A51 AND "EXTWG" = :A52 AND "WW022" = :A53 AND "WW023" = :A54 AND "WW024"

IBM AIX performance with Oracle database performance: a beginnner’s guide http://www.ibm.com/support/techdocs © Copyright 2012, IBM Corporation 32
= :A55 AND "AUART" = :A56 AND "MVGR1" = :A57 AND "WW026" = :A58 AND "WW027" = :A59 AND "MVGR2" = :A60 AND ROWNUM <= :A61;
Where its execution plan is:
If the cost of this query is low and the query has lots of filter fields in the WHERE clause, the execution plan is well done.
Conclusions:
� I am concluding that CPU’s resource is not a possible problem for our database. � Together with SAP support review the indexes as recommended in the document. � Disable the option: monitoring of messages ORA- temporally. � We should create LUNs to move some datafiles that belong to file system /oracle/PRD/sapdata2
for balancing work. � It is important to move some data files to /oracle/PRD/sapdata9 where its LUNs hdisk30, hdisk31
and hdisk32 are with few I/O operations. � Uninstall the product Statspack. � For now we should not reduce the RAM size allocated to the SGA and PGA. For the SGA we saw
evidence that it has pools with the correct values. � With respect to PGA Area we can see the following metric:
Ideally all the operations are performed in memory “workarea executions – optimal”, whereas onepass and multipass operations indicate some use of temporary segments; some small amount of onepass operations is tolerable, but multipass operations ought to be avoided if

IBM AIX performance with Oracle database performance: a beginnner’s guide http://www.ibm.com/support/techdocs © Copyright 2012, IBM Corporation 33
possible. In our case we have a value of 0 for “workarea executions – onepass”, this is an excellent value; for this reason we have a PGA Cache Hit to 100%.
� After we apply the recommendations we must again review the pool of memory because the SAP recommendation is that the database takes only 30% of the whole memory RAM, 60% for the SAP application and 10% the operating system. In our case actually the Oracle Database server is taking 115 GB / 256 GB = 44.9%. It is also important to review with SAP support the amount of memory that the application is actually taking.
� It is recommended to review the parameters of our Oracle Database according to the SAP note, it is important to choose the correct version: � SAP Note 124361 - Oracle parameterization (R/3 >= 4.x,Oracle 8.x/9.x). � SAP Note 830576 - Parameter recommendations for Oracle 10g. � SAP Note 1431798 - Oracle 11.2.0: Database Parameter Settings.
Scenario three
In the scene #3, I have analyzed a system named Peoplesoft version 9 under an Oracle Database Server 11.2.0.2 for AIX 6.1. The Process Scheduler (PeopleSoft’s component) and Oracle Database are in the same server. The Oracle Database Server is configured with Real Application Cluster.
Each instance is in a server Power 750 with 1.5 cores, 20 GB of RAM and the datafiles of our database are in filesystem ASM. The cores are configured with SMT so there are 8 threads available.
In this case my interval analysis is: 9 am - 10 am.
Operating system metrics
In this analysis, we will examine some important metrics, such as:
CPU Usage :
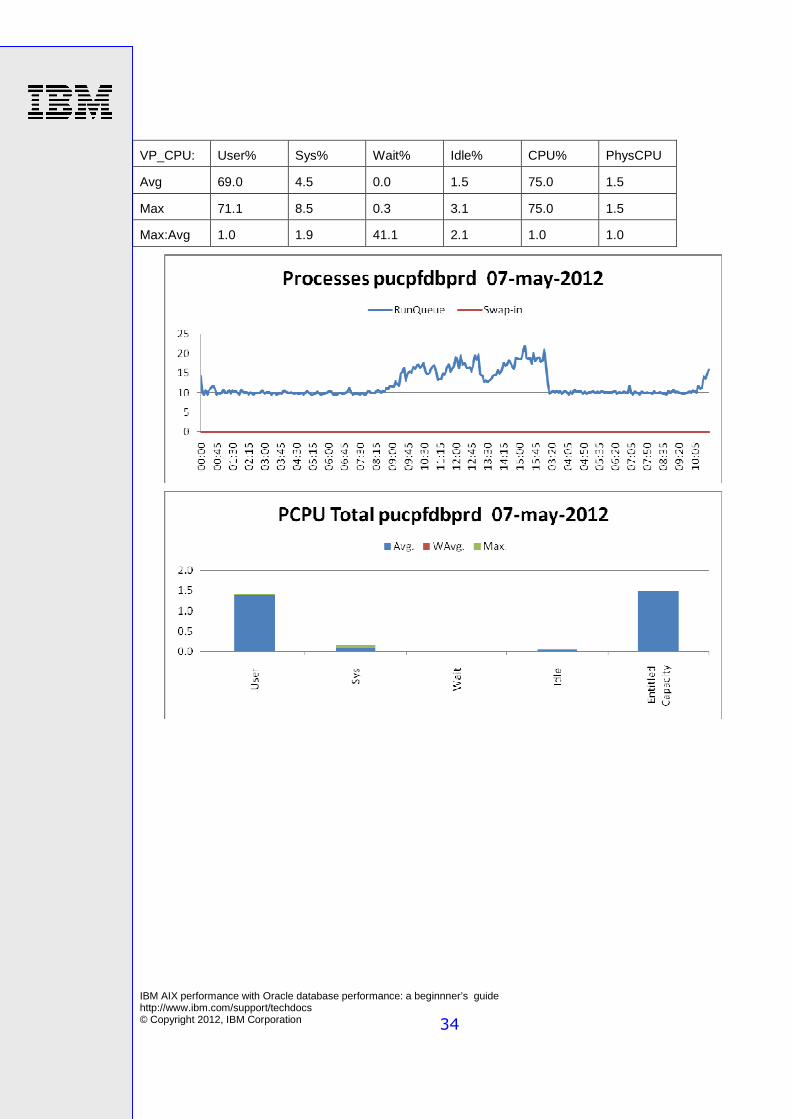
Node 1:
IBM AIX performance with Oracle database performance: a beginnner’s guide http://www.ibm.com/support/techdocs © Copyright 2012, IBM Corporation 34
VP_CPU: User% Sys% Wait% Idle% CPU% PhysCPU
Avg 69.0 4.5 0.0 1.5 75.0 1.5
Max 71.1 8.5 0.3 3.1 75.0 1.5
Max:Avg 1.0 1.9 41.1 2.1 1.0 1.0

IBM AIX performance with Oracle database performance: a beginnner’s guide http://www.ibm.com/support/techdocs © Copyright 2012, IBM Corporation 35
Node 2:
VP_CPU: User% Sys% Wait% Idle% CPU% PhysCPU
Avg 70.9 4.0 0.0 0.0 74.9 1.5
Max 71.5 7.0 0.0 0.0 75.0 1.5
Max:Avg 1.0 1.7 0.0 32.4 1.0 1.0

IBM AIX performance with Oracle database performance: a beginnner’s guide http://www.ibm.com/support/techdocs © Copyright 2012, IBM Corporation 36
Looking at both graphics we can draw some conclusions:
� Both servers are balancing the workload because both of them have the same % CPU busy average; this means that Oracle RAC is correctly configured in its balancing load.
� The graphics show a saturated system by CPU, it is probably because the Oracle Database server is experiencing a high CPU time value.
Disk Usage:
Node 1:
We can see that some LUNs are more saturated than others.

IBM AIX performance with Oracle database performance: a beginnner’s guide http://www.ibm.com/support/techdocs © Copyright 2012, IBM Corporation 37
Node 2:
Each LUN was tested for response time using an Oracle tool named Orion. Orion is a tool that helps to predict I/O performance loads on Oracle databases. Orion is specifically designed to simulate and

IBM AIX performance with Oracle database performance: a beginnner’s guide http://www.ibm.com/support/techdocs © Copyright 2012, IBM Corporation 38
predict I/O bottlenecks against Oracle databases. More information is available at the following url: http://www.oracle.com/technetwork/topics/index-089595.html
The results of the tests for the LUNS in this example are:
We can see some excellent metrics in each field (MBPS, IOPS and Latency) analyzed.
The information in the instance ASM is:
Here we can draw some conclusions:
� The response time of each LUN measured from each LPAR is good and the disks aren’t saturated.

IBM AIX performance with Oracle database performance: a beginnner’s guide http://www.ibm.com/support/techdocs © Copyright 2012, IBM Corporation 39
� It is important to review the LUN hdisk17 in the node 2 because it has a high load and this LUN is
not a part of our solution in ASM and also it doesn’t belong to any volume group in the operating system.
� We have confirmed that the database instances most likely don’t have many wait events associated with slow disk access.
Memory Usage:
Node 1:

IBM AIX performance with Oracle database performance: a beginnner’s guide http://www.ibm.com/support/techdocs © Copyright 2012, IBM Corporation 40
Node 2:

IBM AIX performance with Oracle database performance: a beginnner’s guide http://www.ibm.com/support/techdocs © Copyright 2012, IBM Corporation 41
Here we can observe our servers have a small peak in the use of swap memory before 9 am. Also we can see an excesive use of memory RAM, an interesting formula of performance is:
SYSTEM % + PROCESS % < 65% (Recommended)
In our case the sum of SYSTEM % + PROCESS % has a value higher to 90%. From the we can draw the following conclusions:
� We can infer that our database could have possible problems with getting free memory. � The Oracle Database server processes are responsible for this high use of memory.
Database metrice
Average Active Session:
The information source for this section is based in the AWR report.
Node 1:

IBM AIX performance with Oracle database performance: a beginnner’s guide http://www.ibm.com/support/techdocs © Copyright 2012, IBM Corporation 42
Node 2:
Average Active Session in the Instance 1 => 520.3 / 59.79 = 8.70
Average Active Session in the Instance 2 => 865.18 / 59.81 = 14.47
A value higher than 8 is symptom of slow response time in the Oracle Database server, in our case in both servers there are performance problems. Also in each database instance we see almost the same number of sessions.
Load Profile:
Node 1:

IBM AIX performance with Oracle database performance: a beginnner’s guide http://www.ibm.com/support/techdocs © Copyright 2012, IBM Corporation 43
Node 2:
We can draw the following conclusions:
� Both instances don’t have hard parses and physical reads so probably the Shared Pool and Buffer Cache are sized well.
� In the analyzed interval both instances generate few DML operations. This is confirmed because both instances have created two archive logs on average.
Node 1:

IBM AIX performance with Oracle database performance: a beginnner’s guide http://www.ibm.com/support/techdocs © Copyright 2012, IBM Corporation 44
Node 2:
The metrics about Shared Pool and Buffer Cache are as follows:
Node 1:
Node 2:
We can see that the Shared Pools in both cases had good values for memory usage. (A value among 70% and 85% is a good metric). We can also see that at the end of the analyzed interval only 65.8% of queries were executed more than one time.
Both Buffer Caches were stable because the memories of both pools weren’t resized.

IBM AIX performance with Oracle database performance: a beginnner’s guide http://www.ibm.com/support/techdocs © Copyright 2012, IBM Corporation 45
Instance Efficiency Percentages:
Node 1:
Node 2:
Here we can confirm that our pools are configured well. It is important to review the field Soft Parse % that for OLTP applications should be near 100%, but probably in DSS applications could be a lower value because in this kind of application we don't necessarily want to use bind variables for warehouse data.
It is important to see that in both instances we will have a low value of Execute to Parse % and Parse CPU to Parse Elapsd %. So we can draw the following conclusions:
� Execute to Parse % is calculated as = 1 – (# Parses / # Executions), so we have a regular number of parses. These parses can be soft and hard parses. Hard parses are low in our system so we are having soft parses in regular times.
� Parse CPU to Parse Elapsd % is a low value in our case for both instances so this value is probably low because our CPUs in both nodes were busy executing parsing activity.
Top 5 Wait Events:
Node 1:
IBM AIX performance with Oracle database performance: a beginnner’s guide http://www.ibm.com/support/techdocs © Copyright 2012, IBM Corporation 46
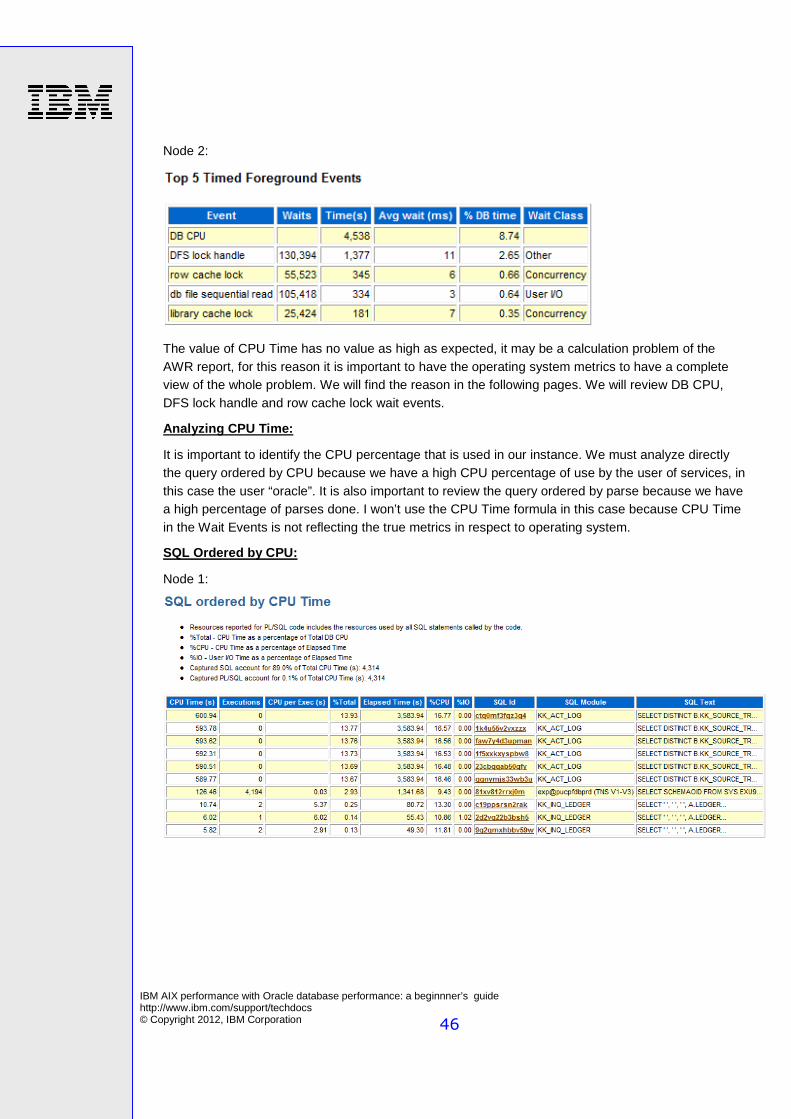
Node 2:
The value of CPU Time has no value as high as expected, it may be a calculation problem of the AWR report, for this reason it is important to have the operating system metrics to have a complete view of the whole problem. We will find the reason in the following pages. We will review DB CPU, DFS lock handle and row cache lock wait events.
Analyzing CPU Time:
It is important to identify the CPU percentage that is used in our instance. We must analyze directly the query ordered by CPU because we have a high CPU percentage of use by the user of services, in this case the user “oracle”. It is also important to review the query ordered by parse because we have a high percentage of parses done. I won’t use the CPU Time formula in this case because CPU Time in the Wait Events is not reflecting the true metrics in respect to operating system.
SQL Ordered by CPU:
Node 1:

IBM AIX performance with Oracle database performance: a beginnner’s guide http://www.ibm.com/support/techdocs © Copyright 2012, IBM Corporation 47
Node 2:
We can see that the top queries are just the same query using a changing literal value. The query is the following:
SELECT DISTINCT B.KK_SOURCE_TRAN , A.KK_TRAN_ID , TO_CHAR(A.KK_TRAN_DT, 'YYYY-MM-DD') , A.KK_TRAN_LN , A.LEDGER_GROUP , A.LEDGER , A.BUSINESS_UNIT , B.BUSINESS_UNIT , TO_CHAR(B.ACCOUNTING_DT, 'YYYY-MM-DD'), B.CC_GROUP_SEQ_NUM, B.CRDMEM_ACCT_NBR, B.CREDIT_CARD_VENDOR, B.CUST_ID, B.DEPOSIT_BU, B.DEPOSIT_ID, TO_CHAR(CAST((B.DT_TIMESTAMP) AS TIMESTAMP), 'YYYY-MM-DD-HH24.MI.SS.FF'), TO_CHAR(CAST((B.DTTM_STAMP) AS TIMESTAMP), 'YYYY-MM-DD-HH24.MI.SS.FF'), B.EMPLID, B.INTFC_ID, B.INV_ITEM_ID, B.INVOICE, B.ITEM, B.ITEM_LINE, B.ITEM_SEQ_NUM, TO_CHAR(B.JOURNAL_DATE, 'YYYY-MM-DD'), B.JOURNAL_ID, B.KK_AMOUNT_TYPE, B.KK_DISTRIB_STATUS, B.PAYMENT_SEQ_NUM, B.PO_ID, B.PROCESS_INSTANCE, B.REQ_ID, TO_CHAR(B.RUN_DT, 'YYYY-MM-DD'), B.RESOURCE_ID, B.SEQ_NBR, B.SEQNUM, B.SHEET_ID, TO_CHAR(B.TRANS_DT, 'YYYY-MM-DD'), B.TRANS_NBR, B.TRAVEL_AUTH_ID, B.UNPOST_SEQ, B.VOUCHER_ID, B.RECEIVER_ID, B.RECV_LN_NBR, B.RECV_SHIP_SEQ_NBR, B.DISTRIB_LINE_NUM, B.DST_ACCT_TYPE, B.APPL_JRNL_ID, B.ACCOUNTING_PERIOD, B.FISCAL_YEAR, B.ORIGINAL_TRANS, B.SEQUENCENO, B.LINE_NBR, B.EX_DOC_ID, B.EX_DOC_TYPE , A.ACCOUNT , A.DEPTID , A.OPERATING_UNIT, A.PRODUCT, A.FUND_CODE, A.CLASS_FLD, A.PROGRAM_CODE, A.BUDGET_REF, A.AFFILIATE, A.AFFILIATE_INTRA1, A.AFFILIATE_INTRA2, A.CHARTFIELD1, A.CHARTFIELD2, A.CHARTFIELD3 , A.BUSINESS_UNIT_PC, A.PROJECT_ID, A.ACTIVITY_ID, A.RESOURCE_TYPE, A.BUDGET_PERIOD , A.FISCAL_YEAR , A.ACCOUNTING_PERIOD , A.FOREIGN_CURRENCY , A.FOREIGN_AMOUNT , A.BASE_CURRENCY , A.MONETARY_AMOUNT , A.KK_QUANTITY , B.KK_PROCESS_STATUS , B.KK_PROC_INSTANCE , A.STATISTICS_CODE , A.STATISTIC_AMOUNT , A.ENTRY_EVENT , A.EE_PROC_STATUS , A.KK_BUDG_TRANS_TYPE , A.KK_GEN_PARENT , A.KK_AUTO_GEN , A.REFERENCED_BUDGET FROM PS_KK_ACTIVITY_LOG A , PS_KK_SOURCE_HDR B , PS_SEC_DEPT_ROLE SCF1, PSROLEUSER RUser1, PS_SEC_PROD_ROLE SCF2, PSROLEUSER RUser2 WHERE (A.BALANCING_LINE = 'N' AND A.KK_TRAN_ID = B.KK_TRAN_ID

IBM AIX performance with Oracle database performance: a beginnner’s guide http://www.ibm.com/support/techdocs © Copyright 2012, IBM Corporation 48
AND A.KK_TRAN_DT = B.KK_TRAN_DT) AND ( B.KK_SOURCE_TRAN = 'REQ_PREENC' AND A.KK_TRAN_ID = '0000010300' AND A.KK_TRAN_DT = TO_DATE('2012-04-08', 'YYYY-MM-DD') AND B.REQ_ID BETWEEN 'SC263050' AND 'SC263050'AND EXISTS (SELECT DISTINCT 'X' FROM PS_SEC_DEPT_ROLE SCF1, PSROLEUSER RUser1 WHERE A.DEPTID = SCF1.DEPTID AND SCF1.ROLENAME = RUser1.ROLENAME AND SCF1.PRODSRCID = 'KK' AND RUser1.ROLEUSER = '00007348') AND EXISTS (SELECT DISTINCT 'X' FROM PS_SEC_PROD_ROLE SCF2, PSROLEUSER RUser2 WHERE A.PRODUCT = SCF2.PRODUCT AND SCF2.ROLENAME = RUser2.ROLENAME AND SCF2.PRODSRCID = 'KK' AND RUser2.ROLEUSER = '00007348')) ORDER BY 1, 2, 3, 4, 5,
This is evidence that only the literal values are changing:
These queries came from module KK_ACT_LOG and they are taking a lot of DB Time in each node.

IBM AIX performance with Oracle database performance: a beginnner’s guide http://www.ibm.com/support/techdocs © Copyright 2012, IBM Corporation 49
Node 1:
Node 2:
We will review its execution plan:

IBM AIX performance with Oracle database performance: a beginnner’s guide http://www.ibm.com/support/techdocs © Copyright 2012, IBM Corporation 50
Here we see the cost is a high value although this query never finishes; so the user must cancel it before the query returns files. When the user cancels it, metrics about the query won’t be available in the AWR report. If we analyze the query we can see that in the clause FROM there are 4 tables which are unnecessary. These tables aren’t used in any CLAUSE statement (SELECT or WHERE). I have commented the reference to these tables and we can see the following execution plan:

IBM AIX performance with Oracle database performance: a beginnner’s guide http://www.ibm.com/support/techdocs © Copyright 2012, IBM Corporation 51
Here we will see that the query now has a low cost: only 22. It is important that this script will be replaced by bind variables because this query is executed with different literal values.

IBM AIX performance with Oracle database performance: a beginnner’s guide http://www.ibm.com/support/techdocs © Copyright 2012, IBM Corporation 52
SQL Ordered by Parse Calls:
Node 1:
Node 2:
We can see that each execution is making a parse call; we can improve this behavior by increasing the value of the parameter session_cached_cursors.
Wait Events
DFS lock handle
DFS lock handle is a wait event that it is associated with many different areas of database software code. It is important to identify the lock type, id1,id2 and understand the problem to resolve the root cause. Of course, many of these issues can be a new or already-identified software bugs too.
For this reason I will use an ASH report to get the parameters id1 and id2. We can see the following information:

IBM AIX performance with Oracle database performance: a beginnner’s guide http://www.ibm.com/support/techdocs © Copyright 2012, IBM Corporation 53
First of all, we need to identify the type of lock associated with this event so we will execute this query to get that information:
select chr(bitand(X,-16777216)/16777215)||chr(bitand(X,16711680)/65535) type,mod(X, 16) md from dual;
Where X will have the value of: 1230372869.
Type IV.- IV enqueues are acquired for invalidation lock. When a DDL is encountered on an object, then the dependent objects need to be invalidated. For example, cursors (SQL statements) that have dependency on a table need to be invalidated so that next execution of that cursor will reparse the cursor, after a DDL on that table. Only the permanent objects such as tables and indexes are globalised and the SQL statements need not be protected by global resources. SQL statements are in turn invalidated by the dependency mechanisms on the dependent objects. For example, if you alter a table to drop a column, then that DDL statement will trigger invalidation of dependent objects of that table from all instances, an indirect invalidation of cursors from all instances occurs. In some cases, library cache locks and pin waits can occur due to indirect dependency validation mechanisms.
Type SV - If the enqueue type is SV, then that enqueue is used to co-ordinate sequence values in a RAC cluster, for sequences declared with order and cache attributes. For the SV locks, id1 column will give us the object# of the sequence.
Type BB - BB XA enabled applications can connect to more than one instance in RAC from 11.2 onwards. Prior to 11.2, XA transaction can only connect to just one instance of RAC. GTX processes implement these global transactions and due to bug 13003033, GTX process waits for BB enqueue longer, leading to more DFS lock handle waits in 11.2. Only workaround at this point is to disable global transactions (11.2.0.2).
Type CI - CI mainly used to trigger an action in a background process such as DBWR, CKPT process etc, in a remote instance. Id1 and id2 columns of this CI enqueue have special significance. Depending upon the values of these id1, id2 fields a specific resource is manipulated to trigger a specific action in a background process. For example, truncating a table leads to foreground process marking a segment as temporary and requesting the background process to clean up the segments from their cache. Essentially, a co-ordination mechanism to ensure that all buffers about a segment is flushed out by DB Writer. Excessive truncate and DDL statement on objects can cause issues in RAC due to global lock activity.

IBM AIX performance with Oracle database performance: a beginnner’s guide http://www.ibm.com/support/techdocs © Copyright 2012, IBM Corporation 54
In our case we are using the type IV. But we don’t see any DDL activities in the AWR and ASH reports. We realized that this wait event is a natural behavior of an Oracle Database with RAC so it is important to avoid executing DDL operations during normal business hours.
Row Cache Lock Wait:
This wait event appears when we executed a DDL statement. A DDL operation must acquire a row cache lock to lock the Data Dictionary information. The Shared Pool contains a cache of rows from the data dictionary that helps to reduce physical I/O to the data dictionary tables and allows it to lock individual data dictionary rows. The locks on the data dictionary rows are called row cache enqueue locks. The enqueue lock structures are allocated from the shared pool as needed but when these requests wait and time out is when we see the row cache lock wait.
In this case we will use again the ASH report.
So we will use the parameter id1, this parameter has the value of 16.
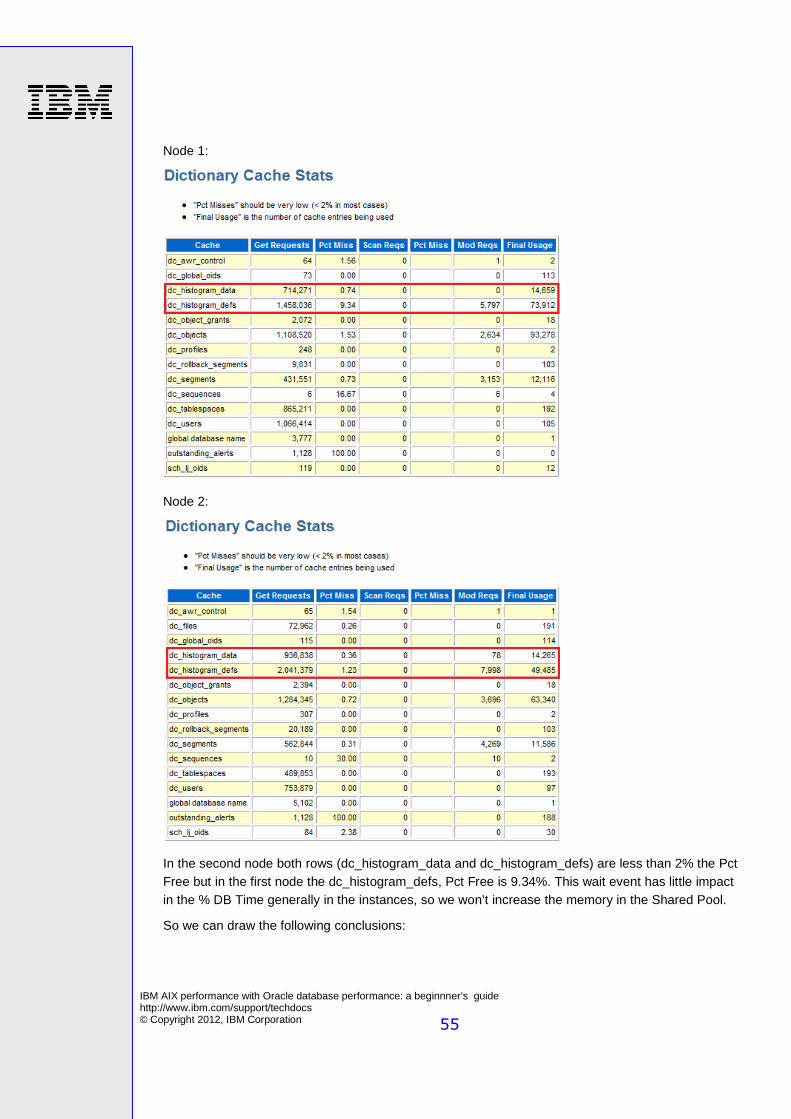
Using the AWR report, we can see the following information:
As a rule the field “Pct Miss” should be less than 2% of Get Requests, if there are a large number of requests and in order to reduce the “Pct Miss” value normally we need to increase the Shared Pool.
IBM AIX performance with Oracle database performance: a beginnner’s guide http://www.ibm.com/support/techdocs © Copyright 2012, IBM Corporation 55
Node 1:
Node 2:
In the second node both rows (dc_histogram_data and dc_histogram_defs) are less than 2% the Pct Free but in the first node the dc_histogram_defs, Pct Free is 9.34%. This wait event has little impact in the % DB Time generally in the instances, so we won’t increase the memory in the Shared Pool.
So we can draw the following conclusions:

IBM AIX performance with Oracle database performance: a beginnner’s guide http://www.ibm.com/support/techdocs © Copyright 2012, IBM Corporation 56
� We may conclude that a query is taking the CPU resources, the recommendations to avoid these
query problems were written in previous pages. It is also important to review the recommendation given before working together with Oracle support.
� We need to increase the value of the parameter SESSION_CACHED_CURSORS of 700 to 1000 to decrease the logical parses.
� It is advisable to review My Oracle Support (MOS), please read this documents: � Operating System, RDBMS & Additional Component Patches Required for Installation
PeopleTools 8.48 [ID 748747.1]. � PeopleTools Certifications - IBM AIX on POWER Systems (64-bit) Suggested Fixes [ID
1150797.1] � Required Interim Patches for the Oracle Database with PeopleSoft [ID 1100831.1]

IBM AIX performance with Oracle database performance: a beginnner’s guide http://www.ibm.com/support/techdocs © Copyright 2012, IBM Corporation 57
Summary
The purpose of this white paper is to show an orderly methodology for how to solve performance problems with an Oracle Database running with AIX. It also gives some recommendations and demonstrates the use of various tools that can help in analyzing the problems and allow you to be more accurate when deciding what actions to take to fix the problems.
If you have any questions or comments, please contact the IBM Oracle International Competency Center at: [email protected].

IBM AIX performance with Oracle database performance: a beginnner’s guide http://www.ibm.com/support/techdocs © Copyright 2012, IBM Corporation 58
References
Oracle documentation
� Oracle Database New Features Guide 11g Release 2 (11.2) E10700-02. � My Oracle Support (MOS) Notes: 748747.1, 1150797.1 and 1100831.1. � SAP Notes: 124361, 830576 and 1431798..
IBM documentation
� nmon for AIX Performance Monitoring http://www.ibm.com/developerworks/wikis/display/WikiPtype/nmon
IBM and Oracle Web sites
These Web sites provide useful references to supplement the information contained in this document:
� For further information about AWR Report please visit: http://www.oracle.com/technetwork/database/focus-areas/performance/tips-perf-awr-sql-report-129542.pdf For further information about ASH Report, please refer to this web site: http://docs.oracle.com/cd/B19306_01/server.102/b14211/autostat.htm
� For further information about ORION, refer to this web site: http://www.oracle.com/technetwork/topics/index-089595.html
� For the latest information regarding IBM AIX 5.3 and AIX 6.1 , please refer to: IBM AIX 5.3: http://www-03.ibm.com/systems/power/software/aix/v53/index.html IBM AIX 6.1: http://www-03.ibm.com/systems/power/software/aix/v61/index.html
� IBM RedBooks http://www.redbooks.ibm.com
� Oracle Database 11g Enterprise Edition http://www.oracle.com/database/enterprise_edition.html
� My Oracle Support (formerly Oracle Metalink) https://support.oracle.com/CSP/ui/flash.html

IBM AIX performance with Oracle database performance: a beginnner’s guide http://www.ibm.com/support/techdocs © Copyright 2012, IBM Corporation 59
About the author
Francisco Riccio Chávez is an IBM Senior IT Specialist recognized at Oracle ACE since 2011. His current Oracle Certification levels are: OCP 11i Applications Database Administrator, OCP Oracle Database 10g/11g, OCA OAS 10g, OCA Oracle PLSQL Developer, Oracle RAC 11g and Grid Infrastructure Administrator Expert, Oracle Database 10g RAC Certified Administrator Expert, Managing Oracle Database 10g on Linux, Oracle Database SQL Expert and Oracle Database 11g Essentials for Implementers. He also teaches Oracle’s certification at Peruvian universities. He works at IBM Global Technology Services SSO Peru Multi country SSA LA with the role SSO Data Management Service Line Owner for SSA.
E-mail address: [email protected]

IBM AIX performance with Oracle database performance: a beginnner’s guide http://www.ibm.com/support/techdocs © Copyright 2012, IBM Corporation 60
Trademarks and special notices
© Copyright. IBM Corporation 1994-2012. All rights reserved.
References in this document to IBM products or services do not imply that IBM intends to make them available in every country.
IBM. the IBM logo, ibm.com, AIX, POWER5, POWER6, and POWER7are trademarks or registered trademarks of International Business Machines Corporation in the United States, other countries, or both:
Microsoft, Windows, and the Windows logo are trademarks of Microsoft Corporation in the United States, other countries, or both.
Linux is a trademark of Linus Torvalds in the United States, other countries, or both.
Other company, product, or service names may be trademarks or service marks of others.
The information provided in this document is distributed “AS IS” without any warranty, either express or implied.
The information in this document may include technical inaccuracies or typographical errors.
Information concerning non-IBM products was obtained from a supplier of these products, published announcement material, or other publicly available sources and does not constitute an endorsement of such products by IBM. Sources for non-IBM list prices and performance numbers are taken from publicly available information, including vendor announcements and vendor worldwide homepages. IBM has not tested these products and cannot confirm the accuracy of performance, capability, or any other claims related to non-IBM products. Questions on the capability of non-IBM products should be addressed to the supplier of those products.
All statements regarding IBM future direction and intent are subject to change or withdrawal without notice, and represent goals and objectives only. Contact your local IBM office or IBM authorized reseller for the full text of the specific Statement of Direction.
Some information addresses anticipated future capabilities. Such information is not intended as a definitive statement of a commitment to specific levels of performance, function or delivery schedules with respect to any future products. Such commitments are only made in IBM product announcements. The information is presented here to communicate IBM's current investment and development activities as a good faith effort to help with our customers' future planning.
Performance is based on measurements and projections using standard IBM benchmarks in a controlled environment. The actual throughput or performance that any user will experience will vary depending upon considerations such as the amount of multiprogramming in the user's job stream, the I/O configuration, the storage configuration, and the workload processed. Therefore, no assurance can be given that an individual user will achieve throughput or performance improvements equivalent to the ratios stated here.
Photographs shown are of engineering prototypes. Changes may be incorporated in production models.
Any references in this information to non-IBM Web sites are provided for convenience only and do not in any manner serve as an endorsement of those Web sites. The materials at those Web sites are not part of the materials for this IBM product and use of those Web sites is at your own risk.