ibm august 10, 2011: 1:30 pm-2:30 pm session 9917 · top 10 tips for z/os network performance...
TRANSCRIPT
Top 10 Tips for z/OS Network Performance Monitoring with OMEGAMON
Ernie GilmanIBM
August 10, 2011: 1:30 PM-2:30 PMSession 9917

Page 2
• Overview of OMEGAMON for Mainframe Networks
• FP3 and z/OS 1.12
1. OSA Express and Interface status and utilization
2. Show all IP Stacks in one view
3. TCP/IP Connection backlog and rejections
4. High TCP/IP Connection Rates
5. High TCP/IP Connection response times
6. Zombie Connections
7. Single Application Focused Network Monitor
8. TN3270 Response time analysis
9. FTP Logon and transfer failures
10.EE and HPR performance issues
Agenda

Page 3
Preface
• This presentation will highlight best practices from customers
who use OMEGAMON XE for Mainframe Network to monitor
their z/OS Networking environment.
• Some of these best practices will include hundreds of new
metrics that came in with OMEGAMON MFN FP3 and new
interface details from IBM Communications Server for z/OS 1.12
• I created a custom Navigator view to highlight the best practices
discusses in this presentation

Page 4
Overview
• Solutions that Monitors IBM z/OS Network performance
• IBM OMEGAMON XE for Mainframe Networks V4R2
• Performance monitoring
• FP3 added hundreds of new metrics, see slide at the end for details
• IBM NetView for z/OS V6R1
• TEP Feeds
• DVIPA – Extensive monitoring
• TCP/IP Connection awareness
• Inactive Connections with termination code
• Real Time Packet and OSA Traces with on the fly analysis
Sockets
Sockets
IP
Stack
Gate
way/D
evic
es
Inte
rfaces
IP
ICMP
TCP/
UDPSockets
Ap
plic
atio
ns
OSA-Express
OSA-Express

Page 5
5
z/OS Network Performance Data Collection Points
•Collected using the TCP/IP NMI:•Applications, Connections, TCP/IP Memory Statistics, IPSec•FTP Sessions and Transfers, TN3270 Server Sessions, Interfaces (z/OS 1.12)
Collected using the VTAM API:VTAM Summary, CSM Buffer Pools
Enterprise Extender (EE), High Performance Routing (HPR)
Collected using SNMP:Interfaces (z/OS 1.11 or before)
OSA
VTAM APITCP/IP NMI SNMP
z/OS Communications Server
OMEGAMON XE for Mainframe Networks
Move from SNMP and NETSTAT COMMANDS to the NMI API
Less overhead
Scalable
NLDM API
Collected using the “Session Awareness and trace” API:SNA Session Awareness and Trace

Page 6
6
Tivoli Enterprise Portal (TEP) Highlights
• Common user interface• Manage z/OS system and distributed resources - single user interface.• Displays real time and historical ,and alerts at the same time• All customization and admin through the same interface• Define thresholds and generate events
• Out of the box Best Practices• Workspaces• Situations - Problem Signatures and Expert Advice (ALERTS)
• Create your own views and situations• To match responsibility and skill level

Page 7
7
Tivoli Enterprise Portal Situations and Thresholds
SituationsNotification, though the TEP or OMNIBUS or even an email-
View Thresholds TIP•Highlight metrics in a table you are viewing•Will bring out hidden problems•Help collate metrics to probable cause of problem
Page 8
8
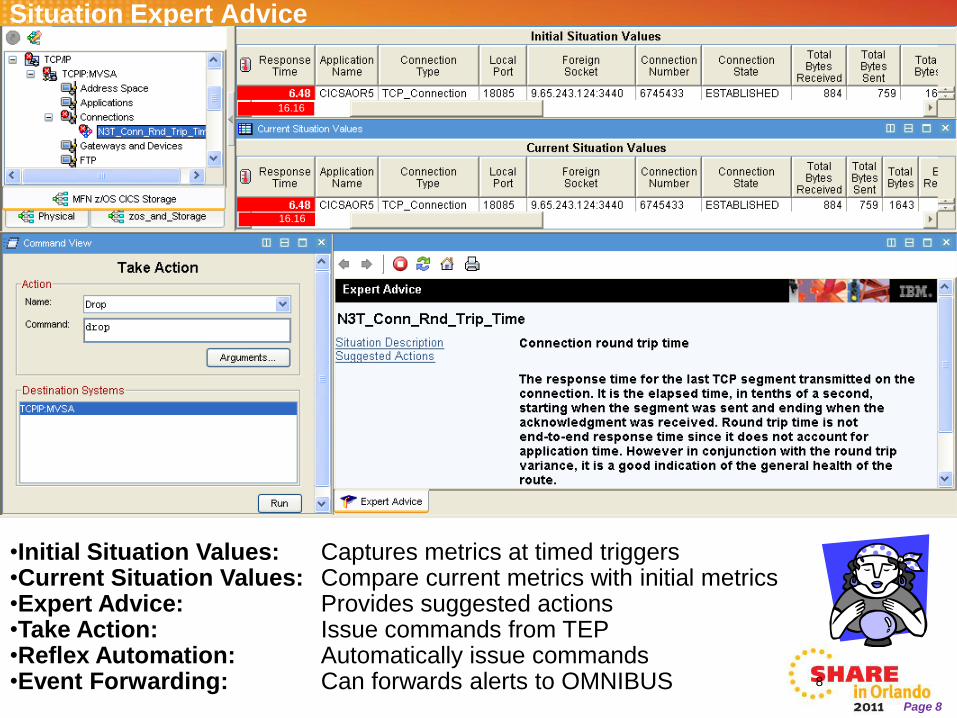
Situation Expert Advice
•Initial Situation Values: Captures metrics at timed triggers •Current Situation Values: Compare current metrics with initial metrics•Expert Advice: Provides suggested actions•Take Action: Issue commands from TEP•Reflex Automation: Automatically issue commands•Event Forwarding: Can forwards alerts to OMNIBUS
16.16
16.16

Page 9
OSA-Express and Interfaces
• Interface Status • (Enhancement with z/OS 1.12)
• Situation on OSA Interface Status.
• Alert of OSA Interface down.
• Check Microcode level
• Adjust MTU size to reduce fragmentation
• zEnterprise – Monitor new OSA types
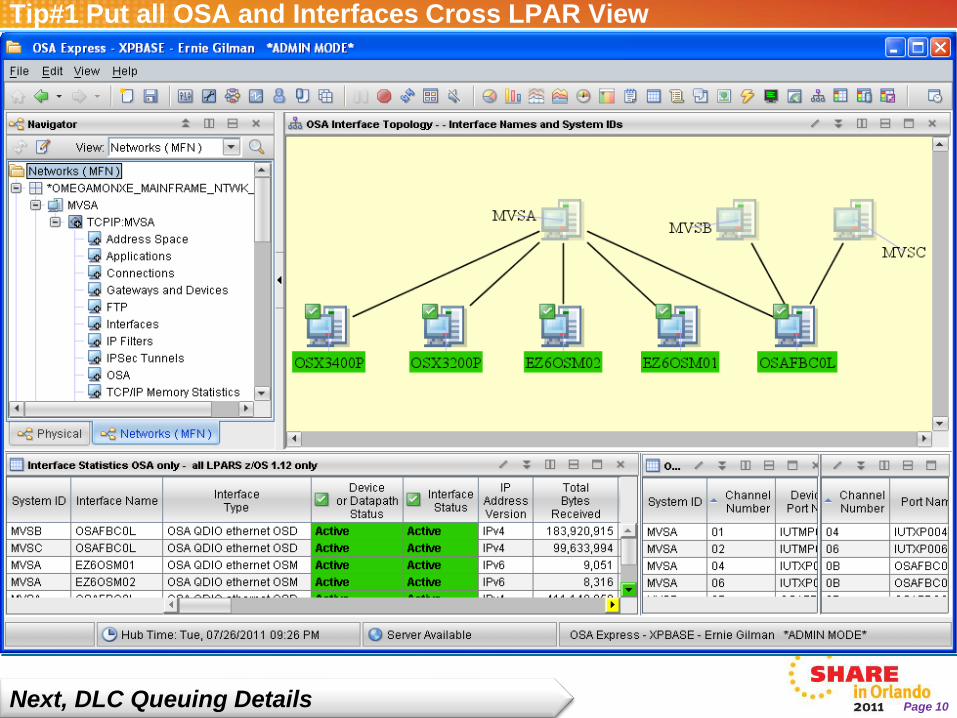
• Put all OSA and interfaces on one workspace
Out of Box Expert Advice
OSA Express• High BUS Utilization
• Channel utilization
• Missed packets
• Not Stored Frames
Gate
way/D
evic
es
IP
Sta
ck
Inte
rfaces
OSA-Express
OSA-Express
Next a customized OSA WORKSPACE
Out of Box Expert Advice
Interfaces• Device Inactive
• High bandwidth Utilization
• No traffic
• QDIO is Accelerating Bytes
• Max Staging queue depth
• DLC Read deferrals
• DLC Read Exhausted
Page 10
Tip#1 Put all OSA and Interfaces Cross LPAR View
Next, DLC Queuing Details
Page 11
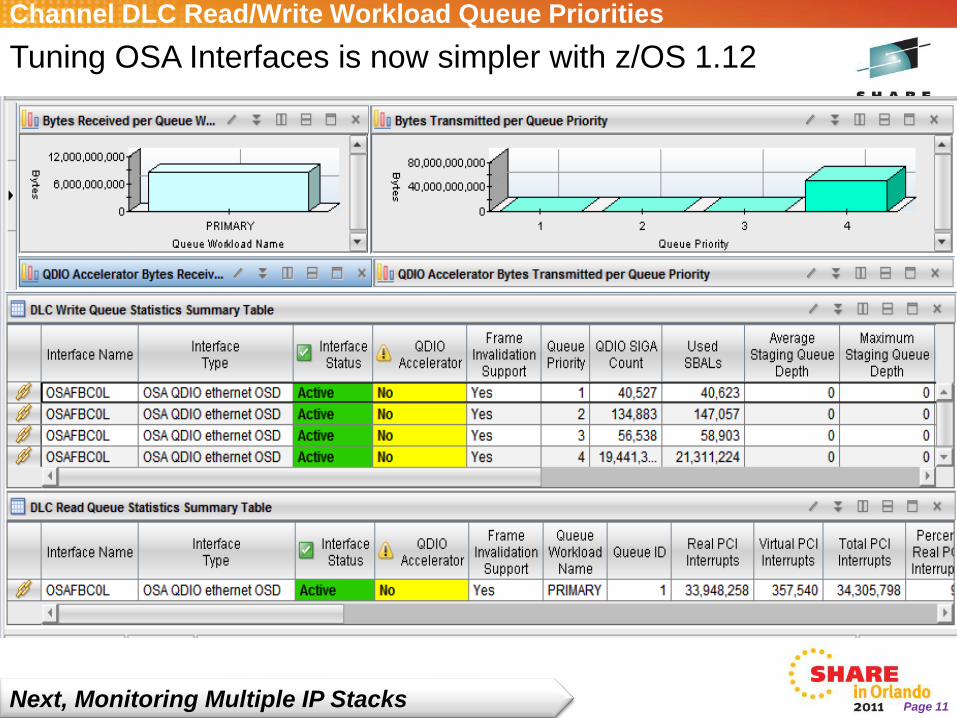
Channel DLC Read/Write Workload Queue Priorities
Next, Monitoring Multiple IP Stacks
Tuning OSA Interfaces is now simpler with z/OS 1.12

Page 12
Tip#2 Put all IP Stacks for all LPARs in one view
• Create Cross LPAR Stack view
• Number of Connections
• Errors
• Monitor DVIPA from NetView
Out of Box Expert Advice
IP Stack• Input Discards
• Output DiscardsNext a Connection Backlogs

Page 13
Exceeding Backlog Connection Limit
Backload
Limit
Backlog
Connections
Rejected
Application
Application will not be aware that connections are being rejected
Out of Box Expert Advice
Application problems• Backlog Connections Rejected
• Connections backlogged
• Not Accepting Connections
• Rejecting new connections
Next a Connection Backlog WORKSPACE

Page 14
Tip#3 Monitor Connection Backlog Rejections
•Application TCP Listeners workspace
•TCP Listeners workspace
Next a high connect / disconnect rate

Page 15
Tip#4 Monitor High Connection Rates
Application
A high connection rate with very
few active connection may
indicate a poor design and can
cause excess z/OS overhead. Requests Connections
Page 16
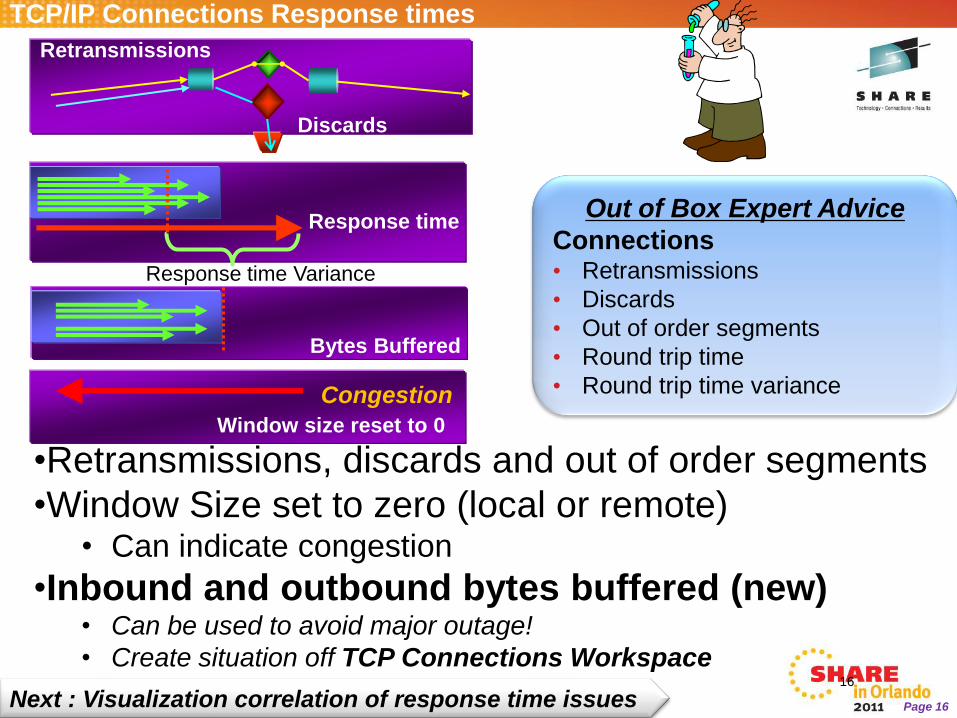
TCP/IP Connections Response times
16
Response time
Response time Variance
Discards
Retransmissions
Out of Box Expert Advice
Connections• Retransmissions
• Discards
• Out of order segments
• Round trip time
• Round trip time variance
Next : Visualization correlation of response time issues
•Retransmissions, discards and out of order segments
•Window Size set to zero (local or remote)• Can indicate congestion
•Inbound and outbound bytes buffered (new)• Can be used to avoid major outage!
• Create situation off TCP Connections Workspace
Bytes Buffered
Window size reset to 0
Congestion

Page 17
Tip#5 Correlate Response Times with Errors
•View all connections with high response times across all LPARS
•Turn on history to see when problems are occurring
•See if poor response time correlates with any errors.
•Notice Inbound Bytes Buffered
Next : Why filters can be so dramatic

Page 18
Filter Data from all z/OS LPARS
•Filter can be at TEPS Server or z/OS Agent
•Filtered Query is dynamically pushed to z/OS Agents
•Performance gain is dramatic and immediate
OMEGAMON
MFN Agent
z/OS
TEPS
FILTER
Next: Finding missing connections

Page 19
Where are my Connections?
• OMEGAMON for MFN default filters can hide problems
• It is simple is to override these filters.
Next: Let's see filters can find zombie connections

Page 20
Tip#6 Create custom query for zombie connections
• Connection that do not get dropped
• Connections could start to backlog
• Connections with no traffic for a long time.
• Filter out addresses like Loopback
• Also create situation on Bytes buffered
Next: Filter for zombies

Page 21
How to create a filter in Query Editor
Connections with no activity for > 10 Mins (600 seconds)
Filter out addresses such as loopback
Filter will automatically be pushed out to the MFN Agents

Page 22
Tip#7 Create Application Network Filtered Views
•Connection Rejections
•Backlog limit
•Number of Connections
•Connection Rate
Application
Client
Client
Client
Application
ListenerTCP/IP
Connections
Address
Space
•CPU
•Storage
•Priority
Next: Create filtered view on application
•Listener and connection feeds from OMEGAMON MFN
•Inactive connections feeds from NetView for Termination reasons
•Address Space feeds from OMEGAMON on z/OS
•Response times
•Buffers queued
•Connection hangs
•Congestion
• Reset windows
• Retries,
• Out of order
Examples:
•Connect:Direct
•MQ
•CICS
•WebSphere

Page 23
Application Monitor View
Next: TN3270
Here is one filtered on MQ
Page 24
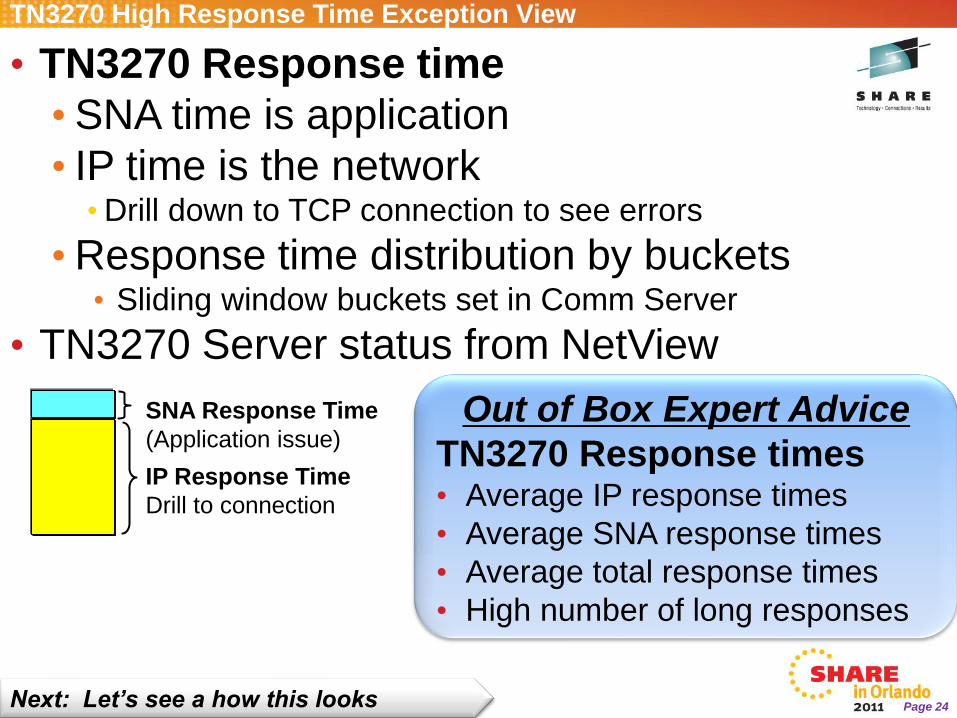
TN3270 High Response Time Exception View
• TN3270 Response time
• SNA time is application
• IP time is the network• Drill down to TCP connection to see errors
• Response time distribution by buckets• Sliding window buckets set in Comm Server
• TN3270 Server status from NetView
Out of Box Expert Advice
TN3270 Response times• Average IP response times
• Average SNA response times
• Average total response times
• High number of long responses
IP Response Time
Drill to connection
SNA Response Time
(Application issue)
Next: Let’s see a how this looks
Page 25
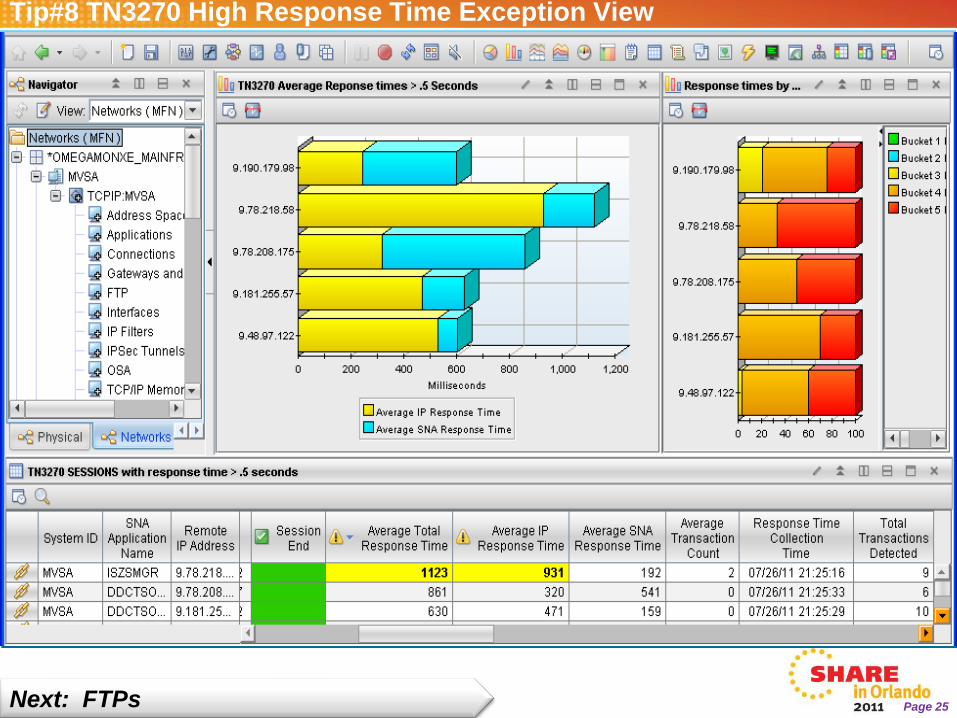
Tip#8 TN3270 High Response Time Exception View
Next: FTPs
Page 26
26
USS
FT
P
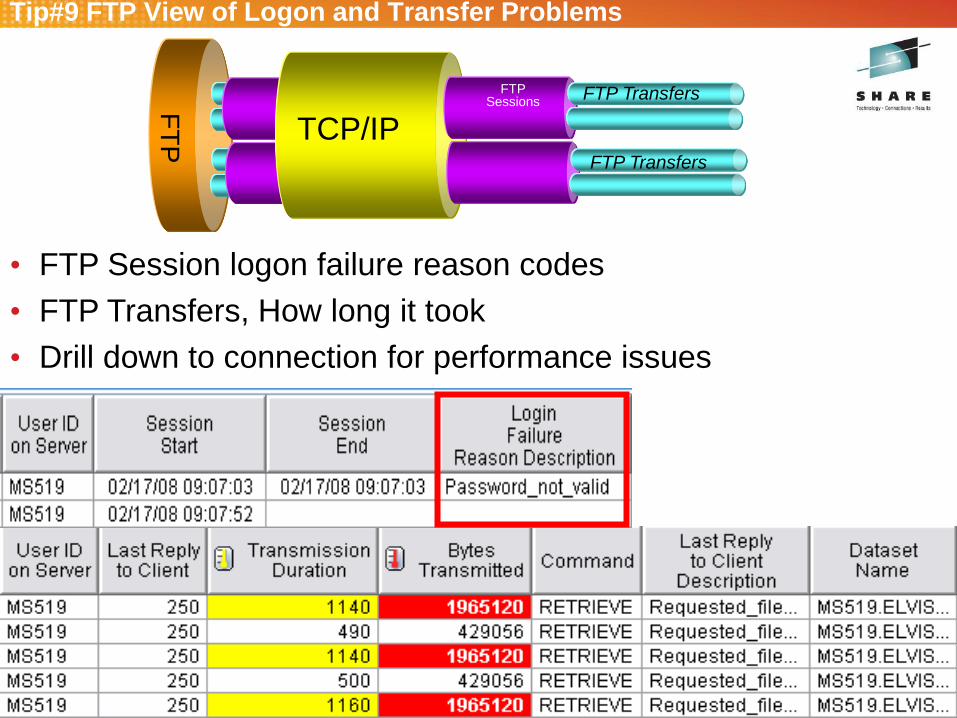
Tip#9 FTP View of Logon and Transfer Problems
FTPSessions
TCP/IPFTP Transfers
FTP Transfers
Sto
rage
• FTP Session logon failure reason codes
• FTP Transfers, How long it took
• Drill down to connection for performance issues

Page 27
Correlate FTP duration with bytes transmitted
Out of Box Expert Advice
FTP Session Errors:• Network or socket errors
• Error reply from server
• Invalid sequence from client
• Resource shortage (storage…)
FTP Transfer Errors• File, system or network errors

Page 28
Summary of Enterprise Extender and HPR
Expert Advice
HPR• Low initial throughput rate
• Path Switches
• ARB Mode Red, Persistent*
EE• High retransmissions
• Out of Sequence buffers
UDP
• High Discard Rates
• Long Queues exceeding Queue Limit*
*Simple to create
UDPEnterpriseExtender
CICS
IMS
WAS.
.
.
HPR
APPN Sessions
UDP Ports
12000
12001
12002
12003
12004
Network Priority Mappings
SNA Path Switch Timeout
LL2 (LIVTIME 10 Seconds)
Network 1 Minute
High TP(2) 2 Minutes
Medium TP(1) 3 Minutes
Low TP(0) 8 Minutes

Page 29
Tip#10 Show EE and HPR on one View for all LPARs

Page 30
30
TCP/IP and VTAM Address Spaces, Storage and Buffers
Out of Box Expert Advice
VTAM and TCP Address Space• CSA%, ECSA %, CPU % , Paging Rate, and Buffer Pool shortage

Page 31
Review
1. OSA Express and Interface status and utilization
2. Show all IP Stacks in one view
3. TCP/IP Connection backlog and rejections
4. High TCP/IP Connection Rates
5. High TCP/IP Connection response times
6. Zombie Connections
7. Single Application Focused Network Monitor
8. TN3270 Response time analysis
9. FTP Logon and transfer failures
10.EE and HPR performance issues
Page 32
Additional Information:
• OMEGAMON Recommended Maintenance: • https://www-304.ibm.com/support/docview.wss?uid=swg21290883
• OMEGAMON XE for MFN V4R2 Fix pack 3 4.2.0.3-TIV-KN3-IF0001
• Matching PTFs UA58835, UA59029, UA59138 , UA59709
• IBM Tivoli Monitoring V6.2.2
• Fix Pack 6.2.2-TIV-ITM-FP0005
• Matching PTFs UA60941, UA60942 ,UA60943, UA60944
Pulse 2011 Session 1254: Solving Application and Network issues using
IBM’s OMEGAMON Mainframe Networks by James T Sherpey II

Page 33
Top 10 Tips for z/OS Network Performance Monitoring with OMEGAMON
Ernie GilmanIBM
Session 9917