ibm global business services: global location … · annual report ibm global business services ......
TRANSCRIPT

Global Location TrendsAnnual Report
IBM Global Business Services
October 2008

IBM Global Business ServicesPage 2

Foreword
This year’s Global Location Trends report by IBM Global Business Services shows that global investment activity continues to widen, penetrating deeper into more economies, and bringing the potential for new growth and prosperity to more people than ever before.
This expansion has brought unprecedented levels of investment to countries previously on the periphery of the world economy. Companies are now actively seeking out and finding investment opportunities in Latin America and Africa, for example, capitalizing on the talents and assets that these vast regions have to offer.
Greater global inclusiveness and the growth of emerging economies is one side of the story. We found as well that organizations, propelled by competition and opportunity, are continuously reassessing and reshaping their global footprints as they search out the next location to open up new markets, realize greater efficiencies and tap into global talent pools.
These findings support the conclusions of IBM’s CEO study published earlier this year, which found that in the face of unprecedented change, successful companies are pursuing bold moves in global integration and innovation. As we learned in this year’s Global Location Trends study, innovation extends well beyond products and services to include the manner in which a business structures itself and operates globally.
As more emerging economies successfully grow their infrastructure, companies seeking first-mover advantage in new locations are learning to move fast. Change has become a constant and the ability to continuously adapt your global footprint, and anticipate the opportunity ahead stands at the forefront of companies’ strategic considerations.
Ginni RomettySenior Vice PresidentGlobal Business Services

IBM Global Business ServicesPage 5
IntroductionIBM’s Global Location Trends reports are based on analysis of data from IBM’s proprietary Global Investment Locations Database (GILD). GILD records investment project announcements around the world on an ongoing basis. With currently information for over 70,000 investment projects recorded since 2003, GILD provides unrivalled insight into global trends in corporate location decision making.
The GILD database is maintained by IBM-Plant Location International (IBM-PLI), a specialized service within IBM Global Business Services, Strategy & Change consulting. IBM-PLI is a global market leader in providing advice to companies on their location strategies, covering all sectors and types of business function. Moreover, drawing on our extensive expertise and knowledge of what shapes corporate investment decisions, IBM-PLI works with economic development organizations and investment promotion agencies in their efforts to improve and market their locations as attractive business environments for present and new investors.
About GILDGILD is a leading corporate investment tracking database, registering investment projects around the world. Our focus is on so-called ‘mobile’ projects, which means that for these investments a wider choice among different locations can be assumed. As such GILD allows representative and up-to-date location trend analysis on a global scale.
GILD is a dynamic database updated on a daily basis, with multiple media (newspapers, newsletters, websites, etc.) in the most important global languages screened for investment project announcements, which are then registered in GILD. Additional investment project data are received from many investment promotion agencies and other economic development organizations.
GILD monitors corporate investments at the project level. It records announcements and openings of new (greenfield) and expansion projects by companies. For each project announcement, details are registered on the investor, origin, location of investment, sector and cluster, activity and type of investment, as well as estimated jobs, capital invested, locations considered, and so on as available. Announcements of large labor intensive investment projects are validated directly with corporate sources, and corrected or excluded where appropriate to avoid overestimating projected job creations.
Investments through business mergers and acquisitions are not included in GILD since these investments are unrelated to attractiveness of individual locations. GILD aims at analyzing location decision trends, and as such it is the best possible information source for measuring countries’ and regions’ success in attracting new businesses.
The current Global Location Trends Report analyses location decisions announced in 2007, and provides the most comprehensive and up-to-date insight into global location trends available.

IBM Global Business ServicesPage 6
Since GILD is a dynamic database, data for previous years are constantly updated and extended. As more and better investment project data become available for countries and regions around the world, results for previous years are continuously updated to best reflect historical trends.
Substantial but reduced level of overall foreign investment activity …2007 was a mixed year for foreign investment. While the global economy generated a considerable amount of international investment activity, 2007 saw a decrease in the number of projects and jobs created compared to 2006. After a period of several years of sustained growth in international investment activity, with 2006 being a record year during which approximately 1.5 million jobs were created from foreign investment projects, there were approximately 10,000 foreign investment projects announced in 2007 that created a little over 1.2 million jobs around the world: a 20% decrease. This is perhaps unsurprising, as the global economic optimism of 2006 gave way to a slightly more cautious outlook during 2007, resulting in a reduced appetite for investing abroad. The forces of globalization, of which foreign investment is a fundamental embodiment, thus proved themselves subject to the volatility and cyclical trends that have shaped domestic economies and investment for previous decades.
… and continued widening of investment activity …While the overall investment activity slowed down in 2007 compared to the record levels of 2006, this was by no means a uniform trend across continents and countries. Jobs created by foreign investment decreased in Asia and North America, increased (considerably) in Africa and Latin America, and remained fairly stable in Europe. After years of Asian dominance of the market for foreign investment, Africa and Latin America are now emerging as important geographic regions, together receiving approximately 17% of the global jobs created from foreign greenfield and expansion projects in 2007, compared to 13% in 2006.
Despite the slowdown of investment in Asia, China and India continue to be the two top locations for foreign investment measured by jobs created. However, both countries saw a decrease in jobs created from foreign investment in 2007 compared to 2006, with India experiencing an almost 50% reduction. Furthermore, Vietnam received from foreign investment in 2007 less than one-third of the jobs it received from that investment in 2006, though the 2006 figures were due largely to a handful of very large projects. In contrast, countries such as Thailand and Mexico experienced increases in jobs created from foreign investment in 2007.
Moreover, within the different geographic regions, new countries are emerging as serious contenders for investment. For example, in Europe, Serbia and the Balkans more generally have become new major recipients of investment, as these locations are increasingly seen as alternatives to traditional Eastern European “hot spots” that are experiencing tighter labor markets and increased competition for skills. This is particularly evident when looking at jobs created from foreign investment compared to population size, where Bulgaria, Romania, and Serbia are all ranked in the top 10 globally, and Macedonia is in the global top 20.

IBM Global Business ServicesPage 7
Figure 1. Top ranking destination countries by estimated jobs – 2007 (06)
The widening of investment activity noted above is also evident in a gradually lower concentration of job creation among the top recipient countries, with the top 15 recipient countries now receiving less than 70% of global jobs created, compared to 73% in 2006 and 85% in 2005.
Figure 2. Top ranking destination countries* by estimated jobs, per 100,000 inhabitants – 2007 (06)
1 (1)2 (2)3 (3)4 (4)5 (6)6 (7)7 (8)8 (19)9 (18)10 (12)11 (9)12 (14)13 (13)14 (11)15 (5)16 (10)17 (16)18 (17)19 (20)20 (-)
0 20,000 40,000 60,000 80,000 100,000 120,000 140,000 160,000
IndiaChina
United StatesThailandMexico
United KingdomMalaysia
RussiaHungary
PhilippinesPoland
RomaniaBrazil
FranceVietnam
Czech RepublicMoroccoGermany
CanadaSpain
0 50 100 150 200 250 300 350 400
HungarySingapore
BulgariaCzech Republic
SlovakiaMalaysia
SerbiaRomaniaThailandIreland
NicaraguaCosta Rica
United KingdomPoland
MacedoniaBelgiumFinland
United Arab EmiratesMexico
Chile
1 (6)2 (1)3 (4)4 (2)5 (5)6 (7)7 ( -)8 (11)9 ( -)10 (3)11 ( -)12 (17)13 (19)14 (14)15 ( -)16 (15)17 ( -)18 (9)19 ( -)20 ( -)
* Countries with less than 1 million inhabitants not included

IBM Global Business ServicesPage 8
Hence, while the findings last year might have suggested that it was a rising tide of investment that lifted a number of new countries into contention for investment this year’s findings indicate that the widening of investment activity is the result more of structural shifts in the global economy. Even in the absence of growing global economic activity, companies are thus expanding their geographic scope. Thus the emergence of the global enterprise is not a cyclical but a structural phenomenon, manifesting itself in companies continually seeking opportunities in new places across the world. Companies are becoming truly global in their reach for opportunities offered by different locations around the world. As companies extend their search for markets, talents, and cost efficiency to new regions and countries of the world, concomitant opportunities arise for a range of locations that were previously ‘off the map’ for investors, while the competitive pressures on countries that have benefited from considerable investment activity in recent years are intensified.
… from a broadening source of investmentWe are seeing a considerable shift in the structure of the emerging global economic architecture, with China and India no longer confined to roles of recipients of investment. Rather, Chinese and Indian companies are now firmly established as key investors around the world, with companies from both countries increasing their job creation abroad compared to 2006. In total, companies from India and China created approximately 80,000 jobs abroad in 2007. Though much media attention is paid to Indian and Chinese acquisitions of foreign companies, our findings indicate that they are also actively expanding through greenfield and expansion investments around the world.
In contrast, US companies have cut back their overseas investment activities in 2007 compared to 2006, creating a little over 300,000 jobs abroad last year compared to almost half a million in 2006. This drop can be viewed as one of the key reasons for the overall reduction in global investment activity in 2007, and is most likely explained by the worsening economic outlook and reduced optimism of US companies setting in during the latter half of 2007.
The increased investment from other countries (particularly Germany and France) has been insufficient to offset the reductions in US investment, illustrating the still heavy reliance of the world economy on the US as a major source of job creating investment activity. However, this is likely to change as China, India, and other emerging nations increase such investment.

IBM Global Business ServicesPage 9
Figure 3. Top ranking origin countries by estimated jobs – 2007 (06)
Interestingly, the previous choices in outward investment from the various source countries are now less distinct. For example, while German companies have placed a large proportion of their outward investment in Eastern Europe in recent years, they now appear to be looking more widely for opportunities, with China, India, Mexico, and Malaysia among the main recipients of German investment in 2007. This is further evidence that companies across the world feel compelled to look beyond the more established locations for opportunities to recruit the best talent, optimize their supply chains, and take advantage of lower operating costs.
0 100,000 200,000 300,000 400,000
United StatesJapan
GermanyFrance
United KingdomTaiwan
IndiaSouth Korea
ChinaCanada
SwitzerlandItaly
NetherlandsSweden
SpainSingaporeDenmark
AustriaFinland
Australia
1 (1)2 (2)3 (3)4 (7)5 (4)6 (5)7 (10)8 (8)9 (17)10 (6)11 (11)12 (14)13 (13)14 (15)15 (9)16 (12)17 (19)18 (18)19 (16)20 (20)

IBM Global Business ServicesPage 10
Sectoral trendsThe sectoral composition of investment has remained fairly stable globally, with electronics, transport equipment, and the Information and Communications Technology (ICT) sector continuing to dominate. However, trends have by no means been uniform across sectors. For example, business services experience a notable decrease in investment activity. This is not surprising, as business services investment tends to be more sensitive to market fluctuations and thus more cyclical than other sectors. Hence, the drop in business services investment is linked to the recent decrease in outward US investment (traditionally a major source of business services investment) and partly explains the drop in inward investment to India (a major recipient of business services investment). In contrast, the chemicals and energy sectors saw considerable growth. The increase of the latter is due in part to growing activity in new sub-sectors in renewable energy that are starting to generate significant foreign investment as these sub-sectors mature. Notably, the solar energy sub-sector is quickly developing into a very powerful engine for economic development in multiple regions around the world, with almost 15,000 jobs created from the foreign projects announced during 2007.
Figure 4. Top ranking sectors by estimated jobs – 2007 (06)
0 50,000 100,000 150,000 200,000 250,000
Transport equipment
Electronics
ICT
Chemicals
Metals and products
Industrial equipment and machinery
Business services
Energy, Utilities, Waste management
Food, Beverages, Tobacco
Textiles, Clothing
1 (3)
2 (1)
3 (2)
4 (8)
5 (7)
6 (6)
7 (4)
8 ( -)
9 (9)
10 (5)

IBM Global Business ServicesPage 11
Interestingly, within each of the main sectors, some changes in the global composition of investment can be seen. We explore these changes for the major sectors in greater detail below.
ElectronicsThailand is the top location for electronics, receiving more than 37,000 jobs from foreign investment in the sector. China is second, with approximately 32,000 estimated jobs. Vietnam, a key recipient of investment in the sector in 2006, when its success was boosted by a handful of large investments by Japanese electronics companies, dropped out of the top 10, with the country receiving fewer than 3,000 jobs from foreign investment in the electronics sector in 2007.
Figure 5. Top ranking countries for jobs in electronics – 2007
Thailand19%
China16%
India13%Malaysia
10%
Mexico5%
United States4%
Other 21%
Romania3%
Poland3%
Czech Republic 4%
Hungary2%

IBM Global Business ServicesPage 12
Transport equipmentIn the transport equipment sector, Mexico is the top recipient by some distance, with the country receiving more than half of its overall number of jobs through foreign investment in 2007 in this sector. This is largely the result of German, US, and Chinese transport equipment companies investing heavily in Mexico, with investments from these three countries accounting for almost 70% of the country’s job creation from foreign investment in the sector. Last year’s top ranking recipient country, India, has experienced a dramatic decline in job creation from foreign investment, with only a little more than 13,000 jobs created.
Figure 6. Top ranking countries for jobs in transport equipment – 2007
Mexico13%
United States11%
China9%
Other 29%
India7%
Thailand7%
Russia9%
Hungary3%
Czech Republic 3%
Morocco6%
United Kingdom 3%

IBM Global Business ServicesPage 13
Information and Communications Technology (ICT)While India remains the top location for the ICT sector, China has increased its share considerably, and the Philippines has emerged as a new key recipient of investment in terms of absolute job numbers. Similarly, Ukraine now appears in the top 10, again highlighting that companies are looking further afield for opportunities to invest.
Figure 7. Top ranking countries for jobs in ICT – 2007
Functional distribution of investmentIn contrast to the sectoral composition of investment, the functional composition has changed considerably. Though production has remained fairly stable, service functions have seen a significant drop in investment activity. R&D activities also dropped slightly compared to 2006, in terms of the number of jobs created.
India30%
China16%
Philippines7%
United Kingdom 6%
Other 25%
Canada2%
United States6%
Ukraine2%
Spain2%
Romania2%
Mexico2%
IBM Global Business ServicesPage 14
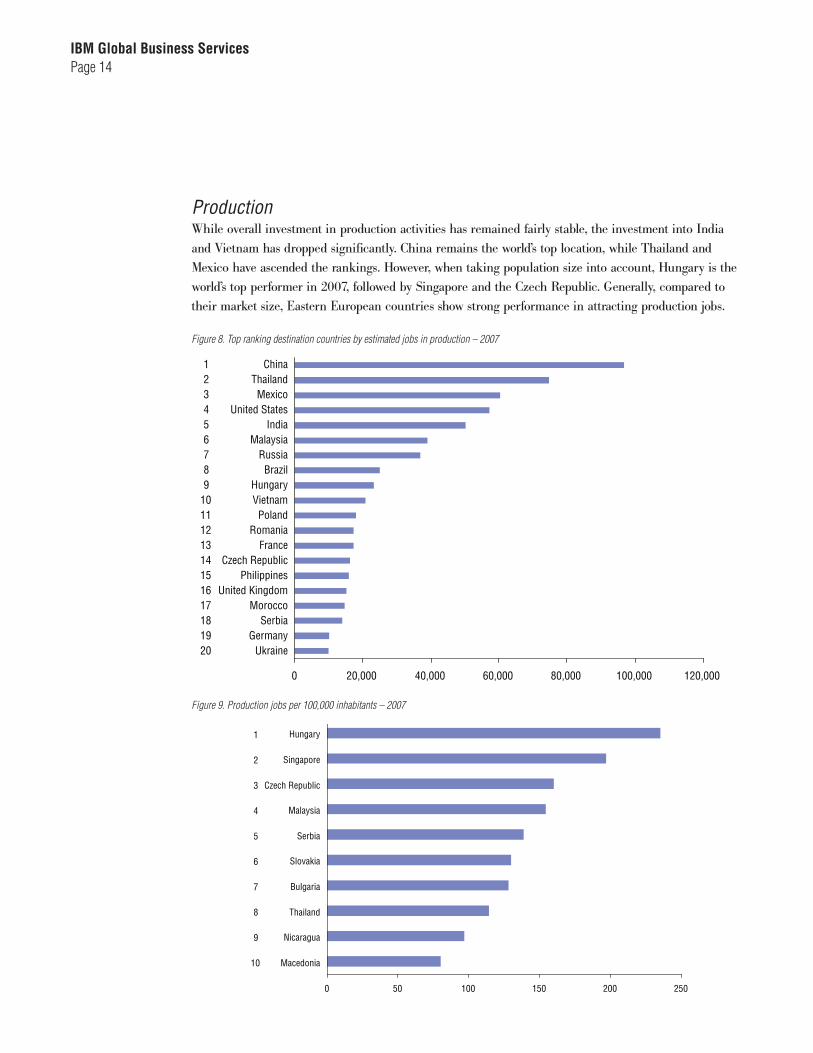
ProductionWhile overall investment in production activities has remained fairly stable, the investment into India and Vietnam has dropped significantly. China remains the world’s top location, while Thailand and Mexico have ascended the rankings. However, when taking population size into account, Hungary is the world’s top performer in 2007, followed by Singapore and the Czech Republic. Generally, compared to their market size, Eastern European countries show strong performance in attracting production jobs.
Figure 8. Top ranking destination countries by estimated jobs in production – 2007
Figure 9. Production jobs per 100,000 inhabitants – 2007
0 20,000 40,000 60,000 80,000 100,000 120,000
ChinaThailandMexico
United StatesIndia
MalaysiaRussiaBrazil
HungaryVietnamPoland
RomaniaFrance
Czech RepublicPhilippines
United KingdomMorocco
SerbiaGermany
Ukraine
123456789
1011121314151617181920
0 50 100 150 200 250
Hungary
Singapore
Czech Republic
Malaysia
Serbia
Slovakia
Bulgaria
Thailand
Nicaragua
Macedonia
1
2
3
4
5
6
7
8
9
10

IBM Global Business ServicesPage 15
Services2007 saw a significant drop in investment in service function activities, explained mostly by the decrease in overall investment from the US, the traditional mainstay of such investment. Indeed, while the US is the leading international investor for all business functions, the country’s importance as a source of investment globally is even more pronounced for services than for production.
Investment into India and China declined significantly in absolute numbers, but India remains the top location for services functions. More interestingly, Eastern European countries are quickly emerging as key locations for services investment, with Romania, Bulgaria, and Hungary among the top 10 global destinations. These developments indicate that some Eastern European locations are improving sufficiently in skills to become strong location alternatives for services investment, while maintaining cost advantages. This becomes particularly evident when taking account of differences in population size, with Bulgaria being the world’s top performer and Hungary number three.
Figure 10. Top ranking destination countries by estimated jobs in services – 2007
123456789
1011121314151617181920
0 10,000 20,000 30,000 40,000 50,000 60,000
IndiaUnited Kingdom
PhilippinesChina
United StatesRomaniaHungaryBulgaria
FranceChile
CanadaSpain
NetherlandsMoroccoVietnam
GermanyAustralia
PolandSouth Africa
Mexico
IBM Global Business ServicesPage 16
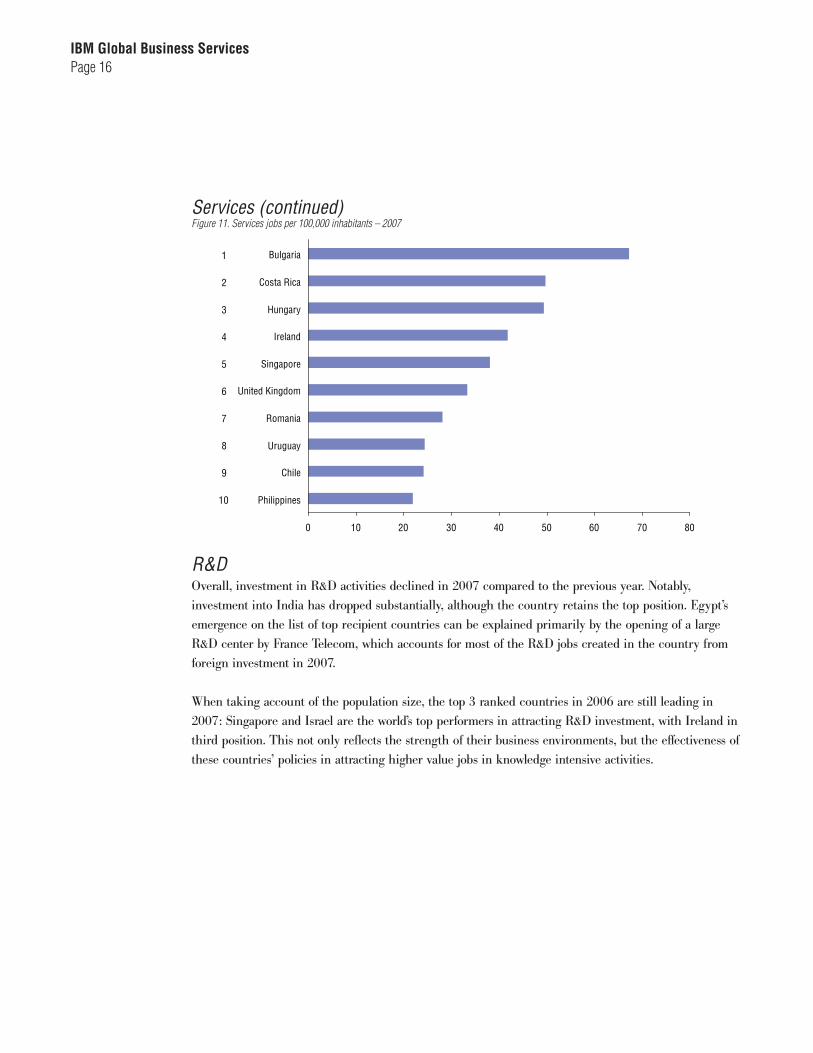
Services (continued)Figure 11. Services jobs per 100,000 inhabitants – 2007
R&D Overall, investment in R&D activities declined in 2007 compared to the previous year. Notably, investment into India has dropped substantially, although the country retains the top position. Egypt’s emergence on the list of top recipient countries can be explained primarily by the opening of a large R&D center by France Telecom, which accounts for most of the R&D jobs created in the country from foreign investment in 2007.
When taking account of the population size, the top 3 ranked countries in 2006 are still leading in 2007: Singapore and Israel are the world’s top performers in attracting R&D investment, with Ireland in third position. This not only reflects the strength of their business environments, but the effectiveness of these countries’ policies in attracting higher value jobs in knowledge intensive activities.
0 10 20 30 40 50 60 70 80
Bulgaria
Costa Rica
Hungary
Ireland
Singapore
United Kingdom
Romania
Uruguay
Chile
Philippines
1
2
3
4
5
6
7
8
9
10
IBM Global Business ServicesPage 17
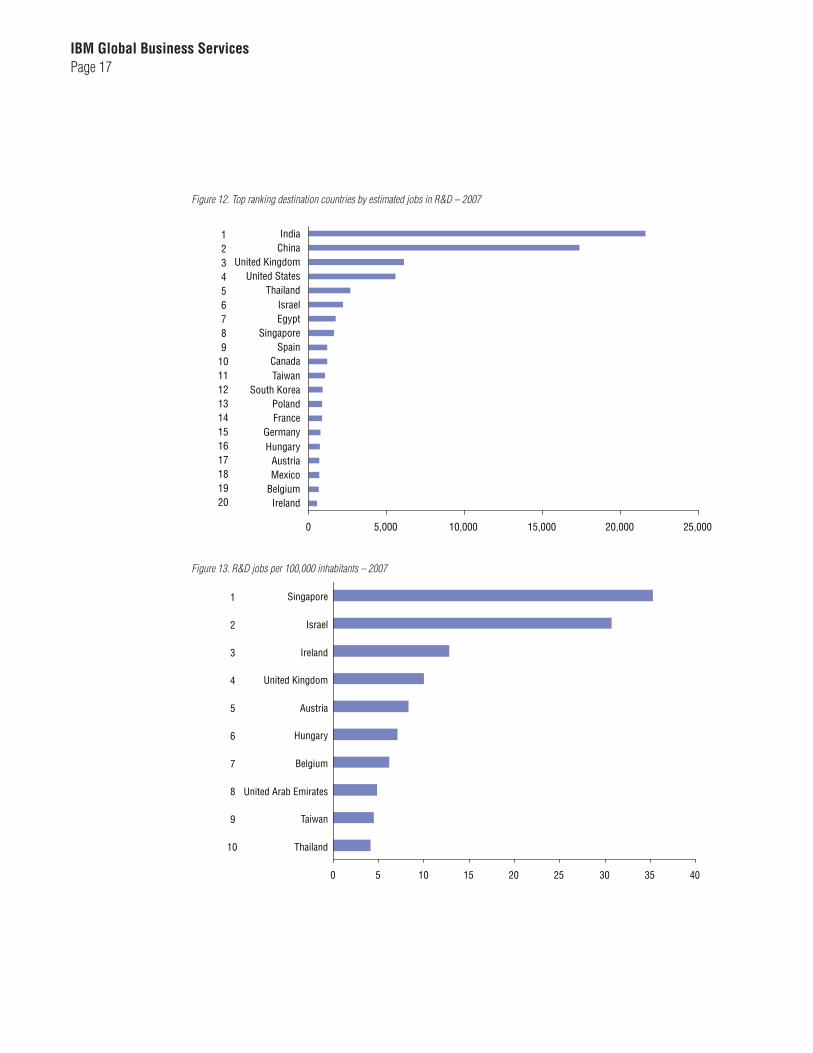
Figure 12. Top ranking destination countries by estimated jobs in R&D – 2007
Figure 13. R&D jobs per 100,000 inhabitants – 2007
123456789
1011121314151617181920
0 5,000 10,000 15,000 20,000 25,000
IndiaChina
United KingdomUnited States
ThailandIsraelEgypt
SingaporeSpain
CanadaTaiwan
South KoreaPolandFrance
GermanyHungary
AustriaMexico
BelgiumIreland
0 5 10 15 20 25 30 35 40
Singapore
Israel
Ireland
United Kingdom
Austria
Hungary
Belgium
United Arab Emirates
Taiwan
Thailand
1
2
3
4
5
6
7
8
9
10

IBM Global Business ServicesPage 18
Regional trendsNorth AmericaNorth America experienced an overall decline in inward investment in 2007, with a little more than 105,000 jobs created in the US and Canada from foreign investment projects. In particular, US inward and outward investment activity declined considerably, with the country receiving some 90,000 jobs from foreign investment activity and US investors creating approximately 300,000 jobs abroad. Canada’s inward and outward investment was more stable at 18,000 and 33,000 jobs created respectively.
The decline in US inward investment is likely explained by two main factors. First, the slowdown in economic activity and associated deterioration in market conditions setting in during 2007 has reduced some of the ‘market-driven’ investment that previously sought to take advantage of the buoyant US economy and consumer market. Second, US states may be facing increasing competition from improving near-shore alternatives, such as Mexico, that are now suitable locations for investments in a number of sectors, notably transport equipment.
Transport equipment and ICT are the largest sectors with respect to job creation from foreign investment in North America, with these two sectors accounting for more than 35% of the jobs created. Notwithstanding growing international competition, prominently from neighboring Mexico, the sheer size of the international market for investment in the transport equipment sector makes it a top sector in North America. Figure 14. Top ranking destination states/provinces in North America by estimated jobs – 2007 (06)
0 1,000 2,000 3,000 4,000 5,000 6,000 7,000 8,000 9,000
New York
Ontario
Quebec
Ohio
Texas
Indiana
Georgia
Pennsylvania
Illinois
Alabama
1 ( -)
2 (1)
3 ( -)
4 (5)
5 (2)
6 (3)
7 (7)
8 (6)
9 ( -)
10 ( -)
IBM Global Business ServicesPage 19
Functionally, 60% of the jobs are in production activities, while approximately 20% are in services and just over 5% are in R&D. This is broadly in line with the global pattern, although with a slightly greater emphasis on services and less on production than the global functional distribution. However, the production activities are concentrated more heavily in the US, while Canada’s inward investment has a relatively greater concentration on services.
Looking at the level of states and provinces in the US and Canada, New York is the main recipient of foreign investment measured by number of jobs created, followed by Ontario and Quebec. Taking population into account a different picture emerges, with a number of states in the Mid-West and South of the US dominating the ranking.
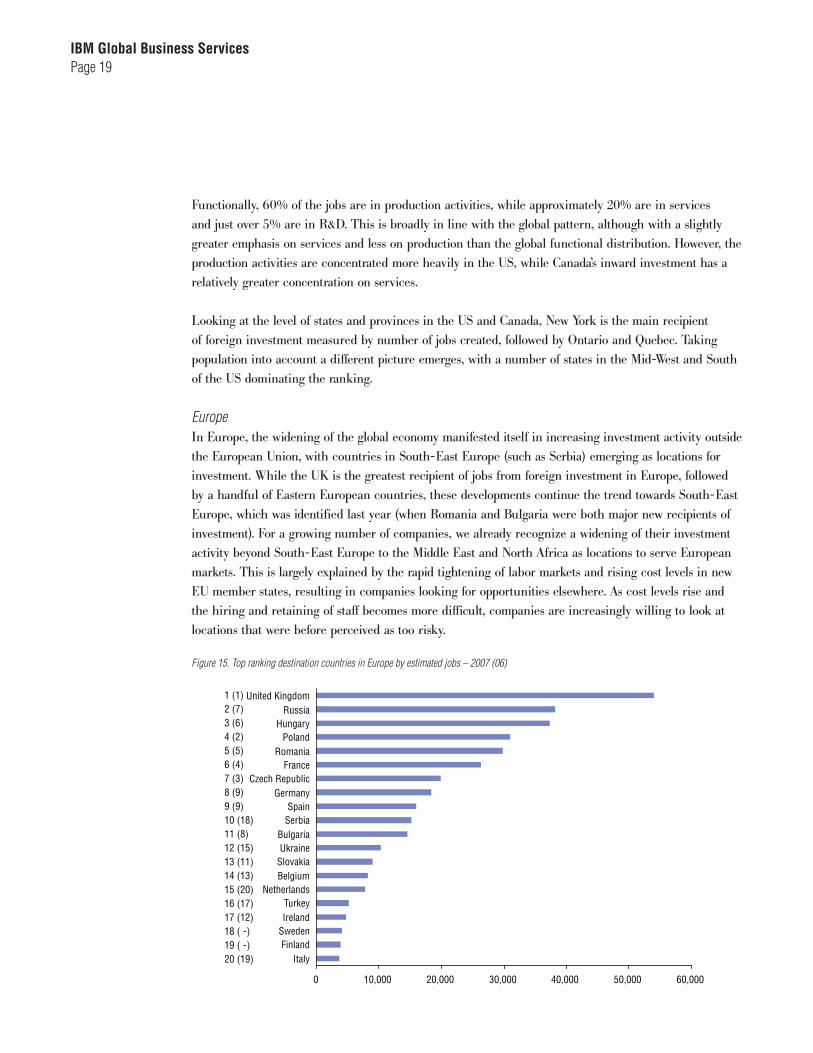
EuropeIn Europe, the widening of the global economy manifested itself in increasing investment activity outside the European Union, with countries in South-East Europe (such as Serbia) emerging as locations for investment. While the UK is the greatest recipient of jobs from foreign investment in Europe, followed by a handful of Eastern European countries, these developments continue the trend towards South-East Europe, which was identified last year (when Romania and Bulgaria were both major new recipients of investment). For a growing number of companies, we already recognize a widening of their investment activity beyond South-East Europe to the Middle East and North Africa as locations to serve European markets. This is largely explained by the rapid tightening of labor markets and rising cost levels in new EU member states, resulting in companies looking for opportunities elsewhere. As cost levels rise and the hiring and retaining of staff becomes more difficult, companies are increasingly willing to look at locations that were before perceived as too risky.
Figure 15. Top ranking destination countries in Europe by estimated jobs – 2007 (06)
0 10,000 20,000 30,000 40,000 50,000 60,000
United KingdomRussia
HungaryPoland
RomaniaFrance
Czech RepublicGermany
SpainSerbia
BulgariaUkraine
SlovakiaBelgium
NetherlandsTurkeyIreland
SwedenFinland
Italy
1 (1)2 (7)3 (6)4 (2)5 (5)6 (4)7 (3)8 (9)9 (9)10 (18)11 (8)12 (15)13 (11)14 (13)15 (20)16 (17)17 (12)18 ( -)19 ( -)20 (19)

IBM Global Business ServicesPage 20
When taking population size into account, the dominance of Eastern Europe is further highlighted, with the six top European locations being Eastern European countries. Ireland and the UK, followed by Belgium and Finland, are the top locations in Western Europe by this measure.
Furthermore, far from being merely the manufacturing hub of Europe, some locations in Eastern Europe are emerging as serious competitors for services investment. For example, a significant proportion of Romania’s and Hungary’s inward investment is now in service activities. Indeed, a large part of the growth in investment for these two countries has been in services rather than production. This suggests that the widening scope and competition for investment is extending into services functions that were previously focused on Western European locations.
Hence, while the functional distribution of inward investment for Europe as a whole is broadly similar to the global pattern, there are marked differences between individual European countries, with the UK the clear service center of Europe, attracting considerable numbers of headquarters and shared services operations, while countries such as the Czech Republic are heavily concentrated on production activities.
Sectorally, the distribution of investment in Europe is focused on transport equipment, electronics, and ICT, but again there are marked differences between the individual countries. For example, while more than 70% of the jobs created from foreign investment into the Czech Republic are in transport technologies and electronics, approximately half of Denmark’s inward investment is in life sciences and ICT. In Germany by contrast, and as one would expect given the size and scope of its economy, inward investment is distributed far more evenly across a wide range of sectors.
IBM Global Business ServicesPage 21
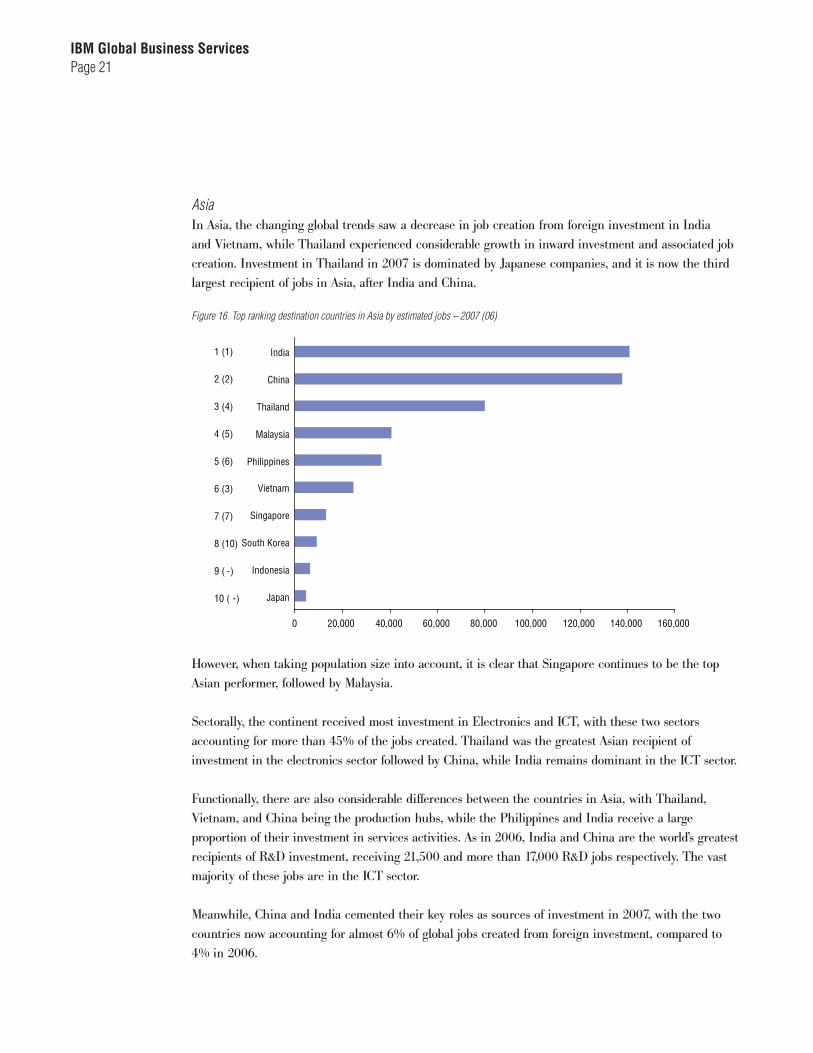
AsiaIn Asia, the changing global trends saw a decrease in job creation from foreign investment in India and Vietnam, while Thailand experienced considerable growth in inward investment and associated job creation. Investment in Thailand in 2007 is dominated by Japanese companies, and it is now the third largest recipient of jobs in Asia, after India and China.
Figure 16. Top ranking destination countries in Asia by estimated jobs – 2007 (06)
However, when taking population size into account, it is clear that Singapore continues to be the top Asian performer, followed by Malaysia.
Sectorally, the continent received most investment in Electronics and ICT, with these two sectors accounting for more than 45% of the jobs created. Thailand was the greatest Asian recipient of investment in the electronics sector followed by China, while India remains dominant in the ICT sector.
Functionally, there are also considerable differences between the countries in Asia, with Thailand, Vietnam, and China being the production hubs, while the Philippines and India receive a large proportion of their investment in services activities. As in 2006, India and China are the world’s greatest recipients of R&D investment, receiving 21,500 and more than 17,000 R&D jobs respectively. The vast majority of these jobs are in the ICT sector.
Meanwhile, China and India cemented their key roles as sources of investment in 2007, with the two countries now accounting for almost 6% of global jobs created from foreign investment, compared to 4% in 2006.
0 20,000 40,000 60,000 80,000 100,000 120,000 140,000 160,000
India
China
Thailand
Malaysia
Philippines
Vietnam
Singapore
South Korea
Indonesia
Japan
1 (1)
2 (2)
3 (4)
4 (5)
5 (6)
6 (3)
7 (7)
8 (10)
9 ( -)
10 ( -)

IBM Global Business ServicesPage 22
Latin AmericaLatin America saw an overall increase in jobs created from foreign investment in 2007 compared to 2006. In particular, Mexico, Colombia, and Nicaragua experienced large increases in jobs created, while Brazil and Chile maintained their positions as important destinations for investment. Nicaragua’s impressive performance – driven by several large new operations in the food and forestry industries - is further highlighted when taking account of the population size, with the country topping the Latin American ranking followed by Costa Rica.
Figure 17. Top ranking destination countries in Latin America by estimated jobs – 2007 (06)
Much of the foreign investment into Latin America originates from US companies, confirming our view that US firms are paying increasing attention to Latin America for low-cost operations that were previously located in lower-cost US states. However, European and Asian investors are also investing more in Latin America, with Germany and France being the second and third largest origin countries. Interestingly, Brazil, the largest economy in Latin America, is not among the top ten job creating countries in its own continent, suggesting limited investment activity between Latin American countries compared with the other continents.
Functionally, Latin America is heavily biased towards production, with more than 80% of jobs created in this type of investment. However, this is mainly a result of the heavy concentration of production activities in the two major Latin American countries, Brazil and Mexico, with production activities accounting for more than 90% of jobs created in both these countries. In contrast, Chile and Costa Rica are relatively more focused on services, with approximately 50% of jobs created in service activities. The dominant sectors for foreign investment in Latin America are transport equipment, electronics, metals, and ICT.
0 10,000 20,000 30,000 40,000 50,000 60,000 70,000
Mexico
Brazil
Chile
Colombia
Argentina
Nicaragua
Bolivia
Costa Rica
El Salvador
Peru
1 (1)
2 (2)
3 (4)
4 (8)
5 (6)
6 ( -)
7 (3)
8 (7)
9 (5)
10 ( -)

IBM Global Business ServicesPage 23
Africa2007 saw considerable growth in continent-wide job creation from foreign investment. The continent’s share of world-wide job creation from foreign investment – although still fairly small – has increased from a little over 3.5% of global jobs created in 2006 to more than 5% of global jobs in 2007. However, within Africa, the investment activity is still heavily concentrated in the North African countries and South Africa while large parts of the continent continue to see only limited investment activity. Mozambique ranks high as a result of a major investment by French chemicals company Pro-Cana. The dominance of North Africa on the continent is further evident when taking account of the population size, with Morocco, Tunisia, Algeria and Egypt among the top recipient countries.
Figure 18. Top ranking destination countries in Africa by estimated jobs – 2007 (06)
France and Japan are by far the greatest sources of investment into Africa, notably transport equipment investment into North Africa. Inter-African investment activity is also taking place, with Egypt being the fourth largest source of jobs from foreign investment into African countries. While much attention has been paid to the increasing role of Chinese investors in Africa, our findings suggest that Chinese companies have not set up many (large) greenfield operations yet in the continent, and most investment is in infrastructure works or acquisitions and privatizations.
Functionally, more than ¾ of the jobs created through foreign investment in Africa is in production activities. The services investment that does go to the continent is focused almost exclusively on South Africa, Morocco and Egypt.
0 2,000 4,000 6,000 8,000 10,000 12,000 14,000 16,000 18,000 20,000
Morocco
Egypt
South Africa
Mozambique
Algeria
Tunisia
Uganda
Kenya
Nigeria
Zambia
1 (1)
2 (2)
3 (3)
4 ( -)
5 (7)
6 (6)
7 (10)
8 ( -)
9 (9)
10 (8)

IBM Global Business ServicesPage 24
Conclusions: Innovating your global footprint - Locating beyond bordersWhile tempered by the decline in overall activity, the findings of this year’s Global Location Trends report confirm that the global economy, of which foreign direct investment is a pillar, is continuing to widen its reach as companies extend their search for markets, talents, and cost efficiency to new corners of the world. While 2006 saw a combined widening and deepening of the global economy, 2007 was characterized more by the former rather than the latter. Globalization is thus becoming truly global in its reach, bringing jobs, growth, and opportunities to new parts of the world.
These trends have brought unprecedented levels of investment to the African continent, with North African countries emerging as some of the new preferred locations for investment. These are particularly encouraging findings, as Africa has often been seen as the neglected continent with respect to foreign investment and other global economic activity, receiving only a negligible share of the world’s overall foreign investment activity. Furthermore, within continents, new countries are emerging as preferred locations, with, for example, Serbia among the major recipient countries in Europe.
In addition, while the economy is indeed becoming more global, we are in some respects also experiencing a regionalization of the global economy, with production and services activities being concentrated in different countries within each continent. This is because many activities require a degree of proximity to the market they serve, creating regional rather than global hubs for different types of activity. Hence, the functional specialization is far more pronounced at country level within continents rather than between continents. For example, within Europe, the UK is the main location for services, with some Eastern European countries, such as Bulgaria, Hungary, and Romania, also seeing increasing amounts of services investment, while the Czech Republic and France see far more investment in production activities. Similarly, Costa Rica has a greater concentration on services than the US and Mexico in the Americas market. Interestingly, these findings also indicate that the simplistic view of manufacturing moving to low cost countries while more developed economies focus on services is incorrect. Rather, our analysis calls for a more nuanced view of what types of investment goes where.
For companies, the emergence of more countries as potential locations for investment brings unprecedented opportunities for availing resources across the globe in order to enhance competitiveness. However, these developments also result in greater pressure to review and adapt the global footprint of activities such as to take advantage of new opportunities. In other words, companies will have to innovate constantly in their global footprint, in the same way that companies innovate in other areas of their operation.

IBM Global Business ServicesPage 25
These findings accord with the conclusion of IBM’s CEO Study 2008 that the enterprise of the future will have to innovate and anticipate change in ways previously unheard of, with the added twist that a company’s innovative activity must extend beyond traditional technological and operational issues to include the manner in which the company structures and exploits its global activities. Thus, just as companies will have to reconsider and adapt their technical and procedural mode of operation, they will have to think and locate beyond existing geographical boundaries if they wish to strengthen their position in the increasingly competitive market place for talent, resources, and markets.
This results in radically and constantly altered corporate global footprints, with accompanying challenges of successful integration and coordination. Shying away from unusual or “remote” investments in your global footprint will result in a weakened competitive position, as competitors are exploiting their first-mover advantage in new locations. Crossing the ‘mental borders’ about what constitutes a potential location is thus as important as crossing physical borders when setting out your company’s location strategy, in order to take full advantage of the opportunities offered by the global economy.
However, location selection is too often a strategic blind-spot for many corporations, resulting in a selection of locations based on perceptions generated from the press or current hype about certain ‘hot-spots,’ rather than on a carefully considered location strategy. Indeed, location selection is often seen as a secondary issue, to be dealt with once other more “important” operational issues have been considered. In contrast, our findings suggest that location issues should be at the forefront of a company’s strategic considerations if it wants to exploit the competitive advantages offered by different locations around the world.
As companies extend their scope of international activities, it means that competition between locations becomes more intense. In particular, locations that used to be seen as prime low-cost locations are now facing competition from a range of emerging lower cost locations that were previously off the map for investors. For the previous recipients of investment, this means that they have to enhance their qualitative offer to investors, as their cost advantage is gradually disappearing. Indeed, the more competitive market place for foreign investment requires all countries to continually improve their offer to investors. A primary task for policy makers operating in this environment is thus to ensure that their business environments are competitive in every way and attractive to foreign investors.

IBM Global Business ServicesPage 26
About IBM Global Business ServicesWith business experts in more than 160 countries, IBM Global Business Services provides clients with deep business process and industry expertise across 17 industries, using innovation to identify, create and deliver value faster. We draw on the full breadth of IBM capabilities, standing behind our advice to help clients implement solutions designed to deliver business outcomes with far-reaching impact and sustainable results.
IBM Global Business Services offers one of the largest Strategy & Change practices in the world. Strategy & Change fuses business strategy with technology insight to help organizations develop and align their business vision across four strategic dimensions – business strategy, operations strategy, organization change strategy and technology strategy – to drive innovation and growth.
About Plant Location InternationalPlant Location International (PLI) is a global service of IBM Global Business Services’ Strategy & Change practice, specialized in corporate location and economic development services. Operating as a fully globally integrated service - with a global center of excellence in Brussels, Belgium, supported by dedicated Global Delivery resources, and satellite teams in key markets – IBM-PLI provides expert services to corporate clients for analyzing international business locations for expanding or consolidating companies to select the optimal location (country/region/community) against best shareholder value, as well as works with economic development organizations and investment promotion agencies in their efforts to improve and market their locations as attractive business environments for present and new investors.

IBM Global Business ServicesPage 27
Further informationTo find out more about this study or to speak with experts of IBM-Plant Location International, please contact:
Roel SpeePhone: +32 475 915 832Office: +32 2 416 5928E-mail: [email protected]
ibm.com/gbs/pli

© Copyright IBM Corporation 2008
IBM Global Services Route 100 Somers, NY 10589 U.S.A.
Produced in the United States of America 10-08 All Rights Reserved
IBM, the IBM logo, and ibm.com, are trademarks or registered trademarks of International Business Machines Corporation in the United States, other countries, or both. If these and other IBM trademarked terms are marked on their first occurrence in this information with a trademark symbol (® or ™), these symbols indicate U.S. registered or common law trademarks owned by IBM at the time this information was published. Such trademarks may also be registered or common law trademarks in other countries. A current list of IBM trademarks is available on the Web at “Copyright and trademark information” at ibm.com/legal/copytrade.shtml. Other company, product, or service names may be trademarks or service marks of others.
GBL03005-USEN-00