ibm high performance computing toolkit
TRANSCRIPT

© 2002 IBM Corporation
Pidad D'Souza ([email protected])IBM, India Software Labs
IBM High Performance Computing Toolkit

© 2002 IBM Corporation2
Top 500 : Application areas (November 2011)
Systems Performance
Source : http://www.top500.org/charts/list/34/apparea
2

© 2002 IBM Corporation3
Eclipse Parallel Tools Paltform (PTP)
Compute hardware
Operating Systems
Compilers / NetworkingMessage Passing Interface
(MPI)
Power x86 BG GPU
AIXLinuxRHELSLES
XL/VACGNUIntelIB / HFI
IBM HPC Toolkit – Integrated Picture and dimensions
IBM PEMPICHOpenMPI
Prorgramming Languages / ModelsC/C++FortranPAMI
PGASUPCOpenCL
32 bit64 bitApplications
ProfileTraceVisualizePerformance analysis - HPC Tools
Automated Performance Tuning - HPCS
3

© 2002 IBM Corporation4
IBM HPC Toolkit
4
• An integrated framework to assist application performance tuning

© 2002 IBM Corporation5
The Performance Pie
Performance Performance DimensionsDimensions
CPU Performance
MPI Performance
Threading Performance
I/O Performance
5

© 2002 IBM Corporation6
IBM HPC Toolkit – usability and features
• IBM System p, Blue Gene L/P, System x, Hybrid• AIX and Linux
• Operates on the application binary and generate results in terms of source level symbols, with full source code traceback capability
• Presents the results in an easy to use and intuitive GUI
• Can be used as: • A collection of command line,
visualization utilities• A plug-in into the Eclipse IDE
As a collection of libraries which are used with the application
6

© 2002 IBM Corporation7
IBM HPC Toolkit Components
Hardware Hardware Performance Performance MonitoringMonitoring
HPM
Profiling MPI calls
openMP
Profiling openMP
directives
I/O analysis and
optimization
Eclipse Plug-in, Eclipse Plug-in, PeekPerf,PeekPerf,
XprofXprof
Visualization
MPI MIO
7

© 2002 IBM Corporation8
HPM, OpenMP, MPI, HPM, OpenMP, MPI, MIOMIO
Binary Binary Instrumentation or Instrumentation or Profile Library callsProfile Library calls
EclipseEclipse Plug-In, Plug-In, PeekPerf, XprofPeekPerf, Xprof
One or more performance metrics can be chosen for a
desired region of code
Running the instrumented binary produces profiling
results
Rendering runtime state within a visualization of the workflow control flow
Using the IBM HPC Toolkit
8

© 2002 IBM Corporation9
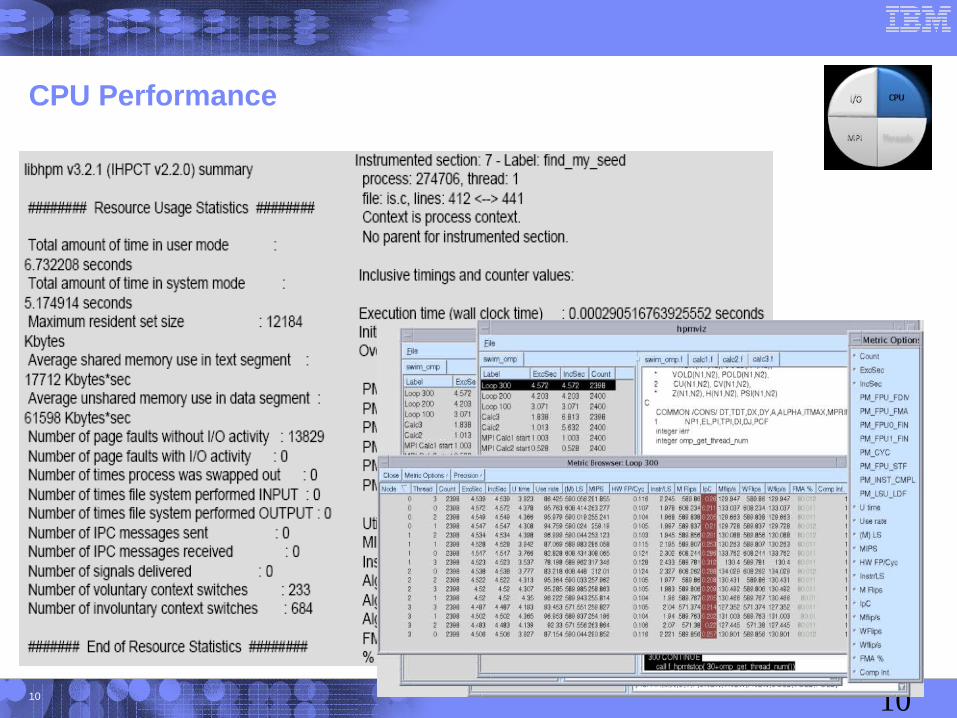
CPU Performance – HPM module
Utilizes Performance Counters – (special purpose registers built into the processor to store the counts of hardware-related activities)
Facilitates low-level performance analysis and tuning
Updated at each cycle and low overhead
9
© 2002 IBM Corporation10
CPU Performance
10
© 2002 IBM Corporation11
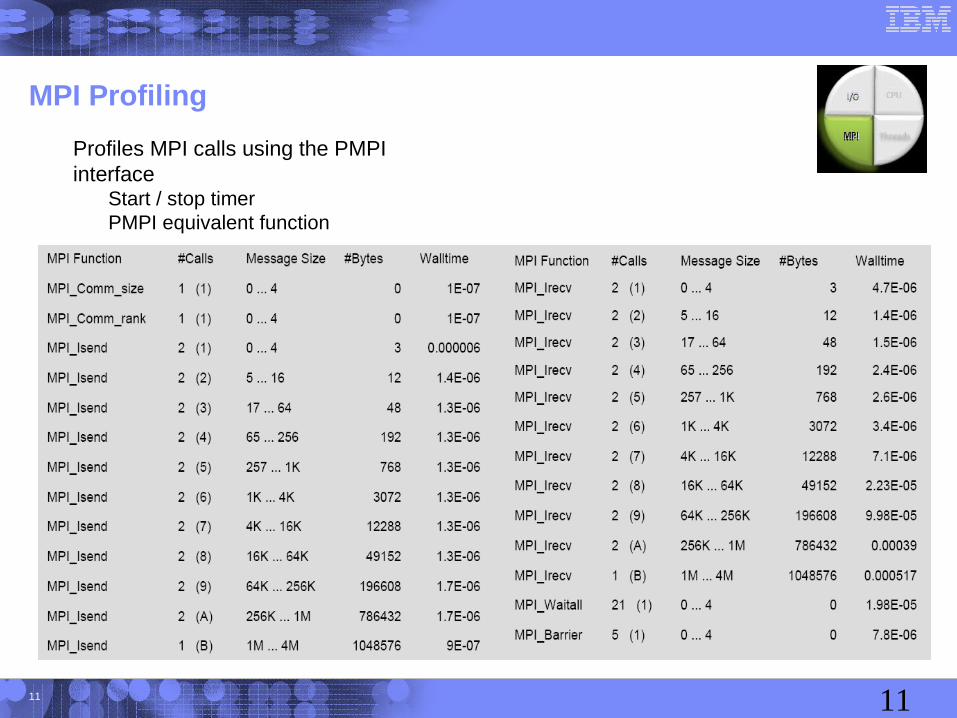
MPI Profiling
Profiles MPI calls using the PMPI interface
– Start / stop timer– PMPI equivalent function
11

© 2002 IBM Corporation12
MPI Profiling
12

© 2002 IBM Corporation13
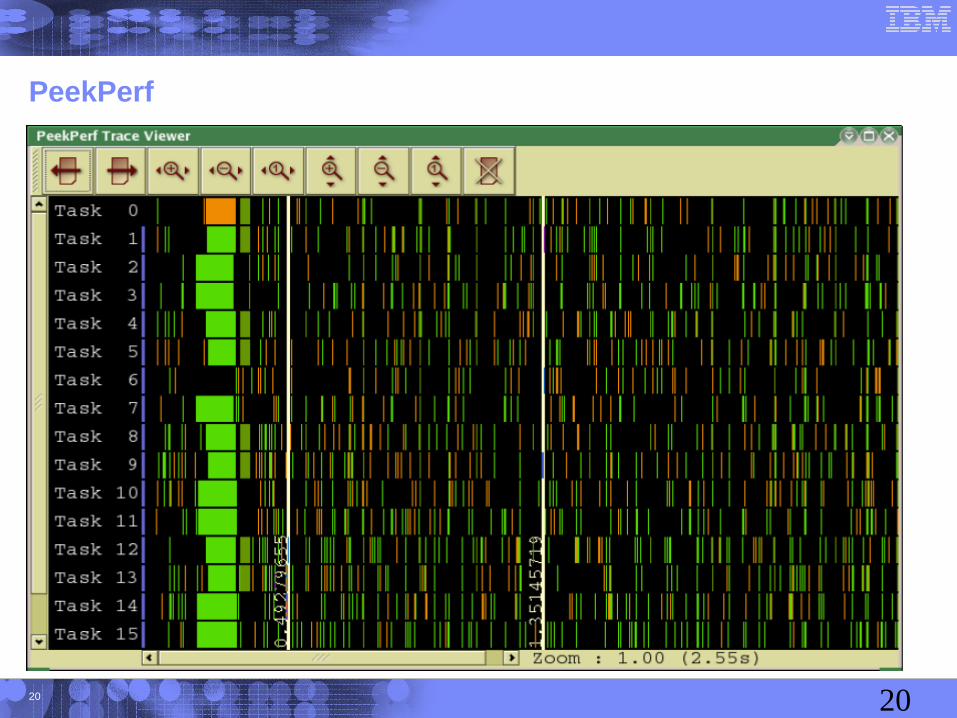
MPI Trace
Captures timestamped data for MPI calls
Provides a colour-coded trace of execution
Provides source traceback
Useful in identifying load-balancing issues
13

© 2002 IBM Corporation14
OpenMP profiling
Uses the POMP OpenMP Monitoring Interface
Groups of events identified for profiling:
– OpenMP constructs and directives/pragmas– OpenMP API calls– User functions and regions
Generates profile describing overheads and time spent by each thread in:
– Parallel regions– OpenMP loops inside a parallel region– User defined functions
Profile data is presented in the form of an XML file => can be visualized with visualization utilities
14

© 2002 IBM Corporation15
OpenMP profiling
15

© 2002 IBM Corporation16
Modular I/O
Application level optimization for I/O
Facilitates analysis and tuning of the I/O at the application level
When an application exhibits the I/O pattern of sequential reading of large files, MIO
–Detects the behavior
Provides source code traceback
16

© 2002 IBM Corporation17
IBM HPC Toolkit – Work flow
HPMHPM MPIMPI OpenMPOpenMP MIOMIO
GUI(Eclipse/ Peekperf
Xprofiler)
GUI(Eclipse/ Peekperf
Xprofiler)
C / C++ /FortranBinary
C / C++ /FortranBinary
C / C++ / FortranInstrumented
binary
C / C++ / FortranInstrumented
binary
VisualizationVisualization

© 2002 IBM Corporation18
Visualization
PeekPerfXprofiler
Eclipse Plug-in
18

© 2002 IBM Corporation19
PeekPerf
Control centre of the HPC Toolkit
Standalone executable
19
© 2002 IBM Corporation20
PeekPerf
20

© 2002 IBM Corporation21
Xprofiler
CPU time profiling data
Visualization of profiled data
Profile description : – Flat Profile– Call Graph– Profile Function– Index Function– Call Summary – Library
Statistics
21

© 2002 IBM Corporation22
Xprofiler Disassembler View
Source code window displays source code with time profile (in ticks=0.01 sec)
22

© 2002 IBM Corporation23
IBM HPC Toolkit Eclipse plug-in
Binary instrumentation with the Eclipse Plug-in23

© 2002 IBM Corporation24
IBM HPC Toolkit Eclipse plug-in
Source level traceback of performance information24

© 2002 IBM Corporation25
IBM HPC Toolkit Eclipse plug-in
25

© 2002 IBM Corporation26
IBM HPC Toolkit Eclipse plug-in
26
Visualization of IBM HPCT in Eclipse Plug-in

© 2002 IBM Corporation27
IBM HPC Toolkit in a nutshell
27
© 2002 IBM Corporation28
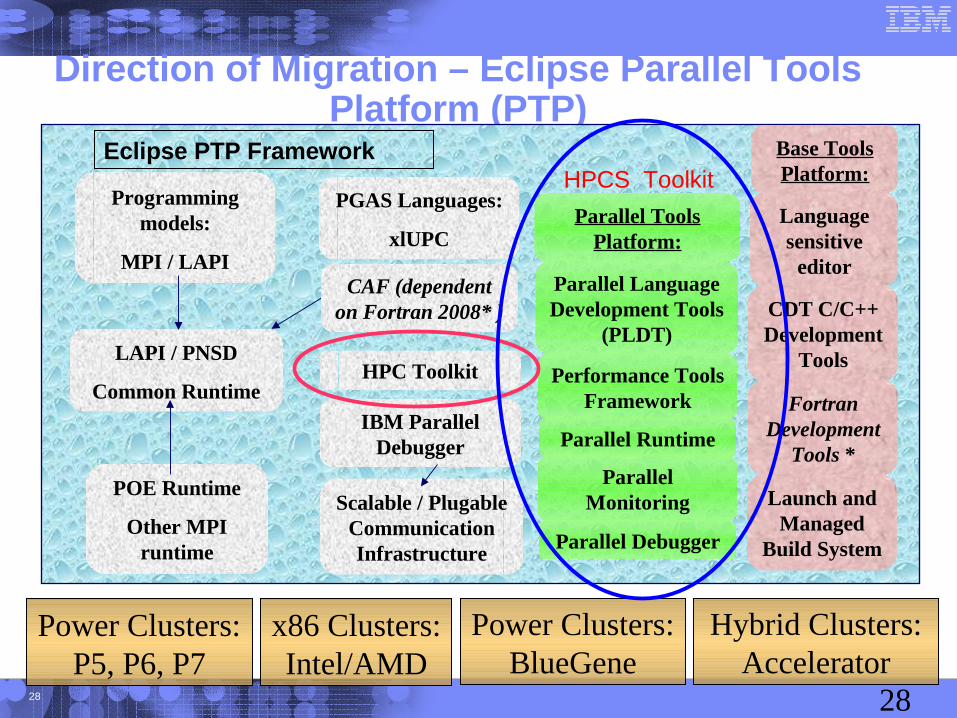
Direction of Migration – Eclipse Parallel Tools Platform (PTP)
Power Clusters: P5, P6, P7
Eclipse PTP Framework Base Tools Platform:
Language sensitive
editor
CDT C/C++ Development
Tools
Fortran Development
Tools *
Launch and Managed
Build System
Parallel Tools Platform:
Parallel Language Development Tools
(PLDT)
Performance Tools Framework
Parallel Runtime
Parallel Monitoring
Parallel Debugger
x86 Clusters: Intel/AMD
Power Clusters: BlueGene
Hybrid Clusters: Accelerator
POE Runtime
Other MPI runtime
Programming models:
MPI / LAPI
LAPI / PNSD
Common Runtime
Scalable / Plugable Communication Infrastructure
PGAS Languages:
xlUPC
CAF (dependent on Fortran 2008* )
HPC Toolkit
IBM Parallel Debugger
HPCS Toolkit
28

© 2002 IBM Corporation29
Summary• The IBM HPC Toolkit provides an integrated framework for performance analysis
• Support iterative analysis and automation of the performance tuning process
• The standardized software layers make it easy to plug in new performance analysis tools
• Operates on the binary and yet provide reports in terms of source-level symbols
• Provides multiple layers that the user can exploit (from low-level instrumentations to high-level performance analysis) – for beginners to black-belts
• Full source code traceback capability• Dynamically activate/deactivate data collection and change what information to collect
29

© 2002 IBM Corporation3031/01/12
Thank You