ibm smartcloud monitoring -application insight version 1 · 2013-12-13 · v configure your cloud...
TRANSCRIPT

IBM SmartCloud Monitoring - Application InsightVersion 1.1
Installation and Setup Guide
SC27-5618-00
���

IBM SmartCloud Monitoring - Application InsightVersion 1.1
Installation and Setup Guide
SC27-5618-00
���

NoteBefore using this information and the product it supports, read the information in “Notices” on page 31.
This edition applies to version 1, release 1 of IBM SmartCloud Monitoring - Application Insight (product number5725-J97) and to all subsequent releases and modifications until otherwise indicated in new editions.
© Copyright IBM Corporation 2013.US Government Users Restricted Rights – Use, duplication or disclosure restricted by GSA ADP Schedule Contractwith IBM Corp.

Contents
Figures . . . . . . . . . . . . . . . v
Tables . . . . . . . . . . . . . . . vii
Chapter 1. Overview . . . . . . . . . 1
Chapter 2. Installing . . . . . . . . . 3Software dependencies and limitations . . . . . 3Configuring the firewall for incoming requests . . . 5Installing on SmartCloud Provisioning - DOCTAR . . 5
Installing the fabric node in SmartCloudProvisioning . . . . . . . . . . . . . 6Configuring the fabric node for SmartCloudProvisioning . . . . . . . . . . . . . 9Installing a consumer VM in SmartCloudProvisioning . . . . . . . . . . . . . 11
Advanced Configuration . . . . . . . . . . 13
Chapter 3. Monitoring . . . . . . . . 19Starting the Application Insight console . . . . . 19
Data sources . . . . . . . . . . . . . . 20Linux OS data source . . . . . . . . . . 21Response Time data source . . . . . . . . 22Unsupported data sources . . . . . . . . 23
Chapter 4. Troubleshooting . . . . . . 25Empty dashboard after login on Internet Explorer 25Dashboards show no events or event status . . . 25Monitoring agents restart repeatedly after thresholdcreation. . . . . . . . . . . . . . . . 25Log files . . . . . . . . . . . . . . . 26
Privacy policy considerations . . . . . 27
Accessibility . . . . . . . . . . . . 29
Notices . . . . . . . . . . . . . . 31Trademarks . . . . . . . . . . . . . . 33
Index . . . . . . . . . . . . . . . 35
© Copyright IBM Corp. 2013 iii

iv IBM SmartCloud Monitoring - Application Insight: Installation and Setup Guide

Figures
1. IBM SmartCloud Monitoring - ApplicationInsight users and cloud provider users . . . . 2
2. Group Dashboard before groups andthresholds have been created. . . . . . . 20
© Copyright IBM Corp. 2013 v

vi IBM SmartCloud Monitoring - Application Insight: Installation and Setup Guide

Tables
1. RPMs shipped with IBM SmartCloudMonitoring - Application Insight . . . . . . 3
2. RPMs bundled with IBM SmartCloudMonitoring - Application Insight . . . . . . 3
3. RPM requirements on Red Hat Enterprise Linuxfor Application Insight components . . . . . 4
4. Error messages while installing IBMSmartCloud Monitoring - Application Insightand possible resolution RPM . . . . . . . 4
© Copyright IBM Corp. 2013 vii

viii IBM SmartCloud Monitoring - Application Insight: Installation and Setup Guide

Chapter 1. Overview
Enterprises are increasingly moving to the cloud to accelerate time to market,improve serviceability, and to reduce costs. Cloud computing consumers need tomonitor their applications and workloads and quickly recognize problems.
IBM SmartCloud® Monitoring - Application Insight is a lightweight monitoringsolution designed for short-term performance and availability analysis,independent of the management infrastructure, yet providing for scalability.
Application Insight is able to scale up or down elastically in keeping with theability to grow and shrink, and providing multi-tenant monitoring for mostworkload deployments. The monitoring technology can be embedded in virtualmachine base images and initiated automatically when new workloads aredeployed based on those images.
Installation is done in minutes and you can immediately open dashboards to checkthe status of the types of monitored applications on your virtual machines. Thedashboards are hierarchical in nature, giving a status overview of the VMs thatyou own or have permission to see. Clicking a link in a higher level dashboardopens a dashboard with more details about the monitored application or event.
Consider, for example, that your application has slow response time. The issue isbrought to light in the Application Insight dashboards. Starting from the top, youcan follow the problem down to the source by clicking links within eachdashboard to discover the culprit: high CPU utilization on the VM due to anout-of-control process.
The Application Insight infrastructure is installed on a management VM called thefabric node. The application monitoring software is installed on consumer VMs. Afteryou install the monitoring software on the VMs that you want to use as baselibrary images, you can instantiate VMs that have the monitoring softwareinstalled and ready to run. You can install more than one instance of the fabricnode across your enterprise, and each instance is local to the user within the scopeof the cloud deployment mechanism. The monitoring agents are autonomous andhave no infrastructure other than what is provided by the fabric node for datasharing. Both the performance and size footprint on individual nodes is small.Data retention is local and short term.
Visit us on Service Management Connect to get usage tips and insightfulinformation from our subject matter experts and to see video demonstrations: IBMSmartCloud Monitoring - Application Insight (https://www.ibm.com/developerworks/servicemanagement/apm/sim/index.html)
© Copyright IBM Corp. 2013 1

Figure 1. IBM SmartCloud Monitoring - Application Insight users and cloud provider users. In this conceptualillustration, the cloud consumers are operations, development operations, and line of business personnel. They mightcreate their own VM instances or request them. They can monitor their own workloads with the Application Insightdashboards.
2 IBM SmartCloud Monitoring - Application Insight: Installation and Setup Guide

Chapter 2. Installing
Install and configure your Application Insight environment through your AmazonEC2, IBM® SmartCloud Provisioning, or VMware cloud service provider.
Software dependencies and limitationsIBM SmartCloud Monitoring - Application Insight is installed on VMs that wereinstantiated from a Linux image. Review the dependencies and limitations toensure a successful installation.
Dependencies
IBM SmartCloud Monitoring - Application Insight and the monitoring agents itsupports use Red Hat Package Manager (RPM) files to install the software. Thetables list the dependencies that the RPMs have for a successful install. Without therequired libraries and other software, the RPM installation fails.
A Red Hat Enterprise Linux 6.2 or 6.3 x86_64 client that is correctly configured touse the yum (Yellowdog Updater, Modified) package manager should be able toresolve and install any missing dependencies that are required. The alternative isto locate and install each of the missing dependencies manually.
Table 1. RPMs shipped with IBM SmartCloud Monitoring - Application Insight
RPM Requirements
smai-1.1-1.el6.x86_64.rpm (fabric node) ibm-java-x86_64-jre-7.0smai-sma
smai-sma-6.30.00.00-1.el6.x86_64.rpm(Linux monitoring agent)
compat-libstdc++-33kshlibc.so.6libc.so.6()(64bit)libc.so.6(GLIBC_2.0)libc.so.6(GLIBC_2.1)libc.so.6(GLIBC_2.2.5)(64bit)
smai-wrt-7.30.01.12-1.el6.x86_64.rpm(Response Time monitoring agent)
kshcompat-libstdc++-33(x86-32)compat-libstdc++-33(x86-64)
Table 2. RPMs bundled with IBM SmartCloud Monitoring - Application Insight
RPM RequirementsCommands to install missingdependencies
ibm-java-x86_64-jre-7.0-4.0.x86_64.rpm
glibc2.3 (or later)libstdc++.so.6
yum install libstdc++ (If you arenot able to use yum, you can searchthe Internet for and download therequired rpms individually, andinstall them manually with rpm-Uhvrpm_filename.)
The next table gives a list of the recommended rpm files to apply on your VMinstances to support Application Insight.
© Copyright IBM Corp. 2013 3

Table 3. RPM requirements on Red Hat Enterprise Linux for Application Insight components
Operating system version Requirements
Red Hat Enterprise Linux 6.2 x86_64 compat-libstdc++-33-3.2.3-69.e16.i686.rpm
ksh-20100621-16.e16.x86_64.rpmlibgcc-4.4.6-3.e16.i686.rpmlibstdc++-4.4.6-4.e16.i686.rpm
Red Hat Enterprise Linux 6.3 x86_64 compat-libstdc++-33-3.2.3-69.el6.i686.rpmlibgcc-4.4.6-4.e16.i686.rpmlibgcc-4.4.6-4.e16.x86_64.rpm
Tips for resolving unmet dependencies
Table 4. Error messages while installing IBM SmartCloud Monitoring - Application Insightand possible resolution RPM
Error message while installing Possible resolution
error: Failed dependencies:libstdc++.so.6 is needed by...
rpm -Uhv libstdc++-4.4.6-4.el6.i686.rpm
error: Failed dependencies:libgcc_s.so.1 is needed by
libstdc++-4.4.6-4.el6.i686libgcc_s.so.1(GCC_3.0) is needed bylibstdc++-4.4.6-4.el6.i686libgcc_s.so.1(GCC_3.3) is needed bylibstdc++-4.4.6-4.el6.i686libgcc_s.so.1(GCC_4.2.0) is needed bylibstdc++-4.4.6-4.el6.i686libgcc_s.so.1(GLIBC_2.0) is needed bylibstdc++-4.4.6-4.el6.i686
rpm -Uhv libgcc-4.4.6-4.el6.i686.rpm
error: Failed dependencies:compat-libstdc++-33(i686) is neededby...
rpm -Uhv compat-libstdc++-33-3.2-69.el6.i686.rpm
Limitations
Active usersUp to five users can log onto the fabric node with the smadmin user ID atthe same time. If a sixth person tries to log on, their attempt is rejected.
Monitoring agentsThe fabric node can manage up to 300 monitoring agents. Thereafter,performance noticeably degrades.
The IBM Tivoli® Monitoring Linux OS monitoring agent and ITCAM forTransactions Response Time monitoring agent are supported. If you havemonitoring agents installed on the VMs in your environment that are notsupported in the current release of IBM SmartCloud Monitoring -Application Insight, you can still see monitoring metrics in the dashboards.See also “Unsupported data sources” on page 23.
Software Product Compatibility Reports
For up-to-date information about supported cloud service providers, supportedoperating system and browser platforms, and prerequisites, review the SoftwareProduct Compatibility Reports for the Application Insight components:
4 IBM SmartCloud Monitoring - Application Insight: Installation and Setup Guide

v Software Product Compatibility Reports > IBM SmartCloud Monitoring -Application Insight V1.1 > Fabric Node (https://pic.dhe.ibm.com/infocenter/prodguid/v1r0/clarity-reports/report/html/softwareReqsForProductByComponent?deliverableId=1350257850933&duComponent=Server_9EBF0BF076CD11E2A013C0C10925FE1B)
v Software Product Compatibility Reports > IBM SmartCloud Monitoring -Application Insight V1.1 > Consumer VM (https://pic.dhe.ibm.com/infocenter/prodguid/v1r0/clarity-reports/report/html/softwareReqsForProductByComponent?deliverableId=1350257850933&duComponent=Miscellaneous_9EC378C076CD11E2A013C0C10925FE1B)
Configuring the firewall for incoming requestsBefore installing IBM SmartCloud Monitoring - Application Insight in your cloudenvironment, either temporarily disable your firewall or configure it for incomingrequests.
Before you begin
For more information about firewall configuration, see the documentation for yourcloud service provider:
SmartCloud Provisioning 2.1 - Managing the firewall (http://pic.dhe.ibm.com/infocenter/tivihelp/v48r1/topic/com.ibm.scp.doc_2.1.0/ICON/topics/cicn_firewallports.html)Amazon EC2 Security Groups (http://docs.aws.amazon.com/AWSEC2/latest/UserGuide/using-network-security.html)VMware documentation (http://www.vmware.com/support/pubs/)
About this task
Take one of the following steps:
Procedurev Configure your cloud firewall for incoming requests on Application Insight
ports.v Disable your cloud firewall and run the following Red Hat Linux commands:
service iptables stopchkconfig iptables off
If IPv6 (Internet Protocol Version 6) is enabled, also run the followingcommands:service ip6tables stopchkconfig ip6tables off
What to do next
Install a fabric node and consumer VMs.
Installing on SmartCloud Provisioning - DOCTARAfter registering with IBM SmartCloud Provisioning and creating a user ID for theDOCTAR cloud service region, install IBM SmartCloud Monitoring - ApplicationInsight in your environment to monitor your virtual machines .
Chapter 2. Installing 5

Installing the fabric node in SmartCloud ProvisioningThe fabric node provides the management infrastructure for IBM SmartCloudMonitoring - Application Insight.
To install a fabric node, you first must have a VM image instantiated inSmartCloud Provisioning. Then you can log into the deployed VM and install theApplication Insight fabric node for managing the consumer VMs.
Before you begin
The name of the fabric node installation file might be different fromSmartCloudMonitoring-ApplicationInsightFabricNode.tar, depending on fromwhere and when you obtained the file. Replace the name of the fabric nodeinstallation file shown in the instructions with the name of the file that youdownloaded.
If you are using Windows, you must start a Linux secure shell (SSH) session orremotely access a Linux VM.
About this task
Take the following steps to instantiate a fabric node VM in SmartCloudProvisioning and install the fabric node software on the deployed VM. Theinstallation step involves downloading the fabric node tar file, unpacking the tarfile on the VM, and running the installation script.
Procedure1. If you haven't already authenticated through the Tivoli RTP firewall, do so
now: http://tivlab.raleigh.ibm.com.2. Instantiate a fabric node VM from a Red Hat Enterprise Linux 6.2 or 6.3 x86_64
on Intel/AMD VM image.a. If you are not already logged in to the DOCTAR Cloud service region of the
RTP SmartCloud Provisioning host, open the following web page and signin with your registered DOCTAR login ID, which is the same as your IBMintranet ID: http://9.37.33.12:8080/welcome.html
b. Click the Resources tab to see the available VM images.c. Select the img_60009 image and click Launch (use the Search field to quickly
find the image).d. In the dialog box that opens, accept the default settings other than the
following changes:1) In the Deployed VM Tag field, enter an identifying name such as
“fabric node”.2) Select the Persistent Deployed VM check box. Making the fabric node
persistent keeps it on the system after it has been stopped.
6 IBM SmartCloud Monitoring - Application Insight: Installation and Setup Guide

e. Click Submit. The fabric node VM is created and the Deployed VMs tab isdisplayed.
f. In the Deployed VMs tab, click Refresh to see the new VM.
The IP address is used to log in to the VM for installing the fabric nodesoftware (step 3 on page 8) and to start the Application Insight console. In theDeployed VMs tab, make a note of the IP address of the fabric node. You mightalso want to keep signed in to SmartCloud Provisioning if you are ready toconfigure the fabric node after installing it.
Chapter 2. Installing 7

3. Install the fabric node software on the deployed VM:a. Download the SmartCloudMonitoring-ApplicationInsightFabricNode.tar
(the actual name might be different) from the following location to a stagingdirectory of your choosing: IBM SmartCloud Monitoring - ApplicationInsight trial version (https://www14.software.ibm.com/webapp/iwm/web/preLogin.do?source=SCMAI)
b. Start an SSH (secure shell) connection and log in to the VM that youinstantiated in step 2 on page 6.v For example, enter ssh root@FabricIPAddress where FabricIPAddress is
the IP address of the VM (SmartCloud Provisioning Resources page,Deployed VMs tab, in the Private Address column).
v If you are using an SSH client or remote access software, log in with thefabric node VM IP address.
v The default user name is root, with password passw0rd (type a “0” zeroin place of the letter “o”)
c. Copy the SmartCloudMonitoring-ApplicationInsightFabricNode.tar filefrom the staging area to the VM with the following command (all on oneline):scp [email protected]:/gsa/rtpgsa/home/j/b/jbloggs/downloads/smai-fabric.tar .
wherejbloggs is your GSA user ID,rtp is the GSA site, andrtpgsa/home/j/b/jbloggs/downloads/ is the path to the download location.
d. Answer the “Are you sure you want to continue connecting (yes/no)?”question:yes
8 IBM SmartCloud Monitoring - Application Insight: Installation and Setup Guide
e. Extract the fabric node installation files:tar -xf SmartCloudMonitoring-ApplicationInsightFabricNode.tar
f. Run the installation script to install the fabric node software on the VM:./install.sh
If you get any messages about dependencies, such as compat-libstdc++-33(i686) is needed by smai-wrt-7.30.01.12-1.el6.x86_64, the fabric nodemust have the specified dependency resolved before you can complete theinstallation. For more information, see “Software dependencies andlimitations” on page 3.
g. After installation is complete and the command prompt is available, youcan close the SSH session or disconnect from the remote system.
Results
The fabric node is installed on the deployed VM.
What to do nextv You can log in to the IBM SmartCloud Monitoring - Application Insight console
to complete the configuration, as described in “Configuring the fabric node forSmartCloud Provisioning.”
v You can also install consumer VMs, as described in “Installing a consumer VMin SmartCloud Provisioning” on page 11.
Configuring the fabric node for SmartCloud ProvisioningAfter installing the fabric node on your deployed VM, you must configure thefabric node file for communication with the SmartCloud Provisioning servicedelivery platform.
The configuration wizard starts automatically the first time you log on to the IBMSmartCloud Monitoring - Application Insight console after installation. Thereafter,you can start the wizard whenever you have configuration changes.
Before you beginv Initial configuration of the fabric node involves establishing key credentials with
the web service host, starting the database, and initializing the configurationdatabase. Most of the configuration is automatic after the private key has beenestablished.
v Have at hand the information that is required from SmartCloud Provisioning forconfiguring the fabric node: the SmartCloud Provisioning web host IP address,your access ID, and the private key that is associated with your ID.
Procedure1. If you haven't already authenticated through the Tivoli RTP firewall, do so
now: http://tivlab.raleigh.ibm.com.2. If you are not already logged in to the IBM SmartCloud Monitoring -
Application Insight console, enter the following URL where fabricIPaddress isthe IP address of the fabric node management VM:http://fabricIPaddress/smai
The default user ID and password are smadmin and passw0rd (zero).
Chapter 2. Installing 9
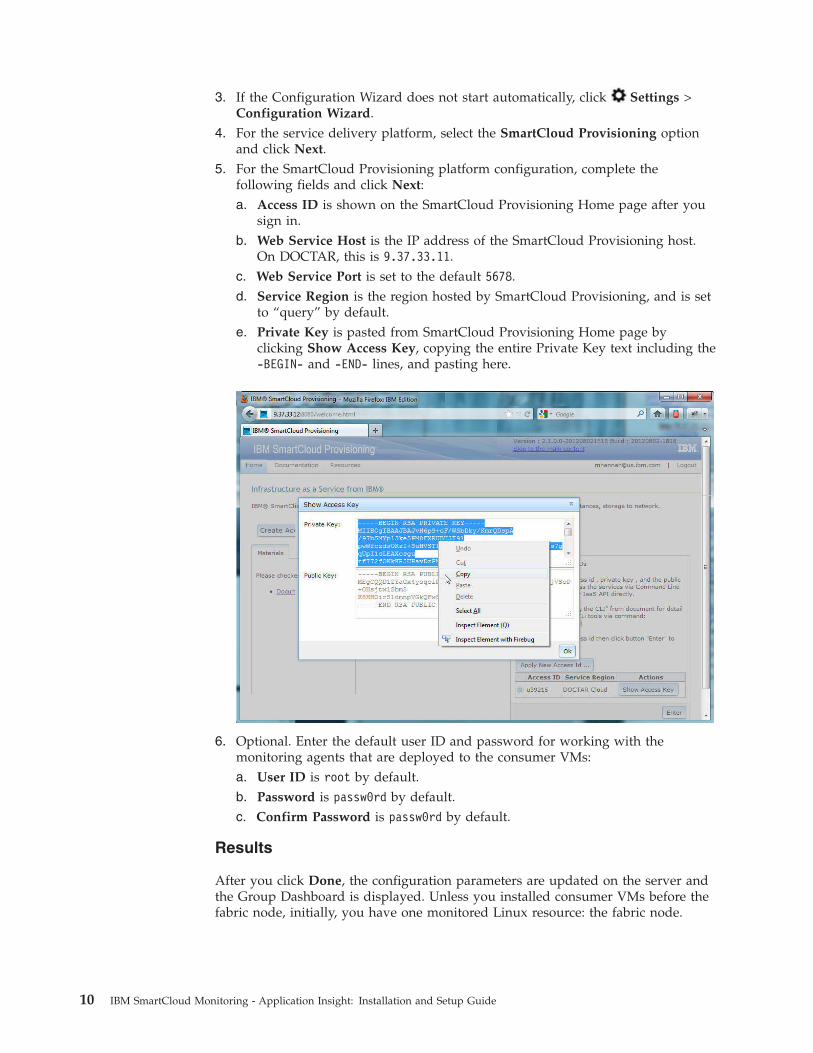
3. If the Configuration Wizard does not start automatically, click Settings >Configuration Wizard.
4. For the service delivery platform, select the SmartCloud Provisioning optionand click Next.
5. For the SmartCloud Provisioning platform configuration, complete thefollowing fields and click Next:a. Access ID is shown on the SmartCloud Provisioning Home page after you
sign in.b. Web Service Host is the IP address of the SmartCloud Provisioning host.
On DOCTAR, this is 9.37.33.11.c. Web Service Port is set to the default 5678.d. Service Region is the region hosted by SmartCloud Provisioning, and is set
to “query” by default.e. Private Key is pasted from SmartCloud Provisioning Home page by
clicking Show Access Key, copying the entire Private Key text including the-BEGIN- and -END- lines, and pasting here.
6. Optional. Enter the default user ID and password for working with themonitoring agents that are deployed to the consumer VMs:a. User ID is root by default.b. Password is passw0rd by default.c. Confirm Password is passw0rd by default.
Results
After you click Done, the configuration parameters are updated on the server andthe Group Dashboard is displayed. Unless you installed consumer VMs before thefabric node, initially, you have one monitored Linux resource: the fabric node.
10 IBM SmartCloud Monitoring - Application Insight: Installation and Setup Guide

What to do nextv Install consumer VMs, as described in “Installing a consumer VM in SmartCloud
Provisioning.”
v Click Settings > Group Configuration and create logical groupings of yourmonitored data sources, as described in the Learn more... link topic.
v Click Settings > Threshold Manager and create thresholds for testing keyperformance indicators, as described in the Learn more... link topic.
v Click the Learn more... link in any dashboard to learn more about the dashboardand what you can do.
Related reference:“Advanced Configuration” on page 13
Installing a consumer VM in SmartCloud ProvisioningInstantiate a Red Hat Enterprise Linux 6.2 or 6.3 x86_64 VM and install theconsumer VM software on it for each data source that you want to monitor.
You can create a consumer VM at any time before or after the fabric node VM iscreated.
Before you begin
The name of the consumer VM installation file might be different fromSmartCloudMonitoring-ApplicationInsightAgentConsumerVM.tar, depending onfrom where and when you obtained the file. Replace the name of the consumerVM installation file shown in the instructions with the name of the file that youdownloaded.
If you are using Windows, you must start a Linux secure shell (SSH) session orremotely access a Linux VM.
About this task
Take the following steps to instantiate a consumer VM in SmartCloud Provisioningand install the consumer VM software on the newly deployed VM. The installationstep involves copying the installation file to the consumer VM, unpacking the file,and running the installation script.
Procedure1. If you haven't already authenticated through the Tivoli RTP firewall, do so
now: http://tivlab.raleigh.ibm.com.2. Instantiate a Red Hat Enterprise Linux 6.2 or 6.3 x86_64 VM.
a. If you are not already logged in to the DOCTAR Cloud service region, openthe following web page: http://9.37.33.12:8080/welcome.html and sign inwith your registered DOCTAR login ID, which is the same as your IBMintranet ID.
b. Click the Resources tab to see the available VM images.c. Select the img-60009 image and click Launch (use the Search field to quickly
find the image).d. In the dialog box that opens, accept the default settings with the following
exceptions:1) In the Deployed VM Tag field, enter an identifying name such as
“Linux OS” or “consumer WRT”.
Chapter 2. Installing 11

2) Select the Persistent Deployed VM check box. Making the consumerVM persistent keeps it on the system after it has been stopped.
images/scp_launchdialog_consumer.jpg3. Install the consumer monitoring agent on the deployed VM:
a. Download the SmartCloudMonitoring-ApplicationInsightAgentConsumerVM.tar (the actual name might bedifferent) from the following location to a staging directory of yourchoosing: IBM SmartCloud Monitoring - Application Insight trial version(https://www14.software.ibm.com/webapp/iwm/web/preLogin.do?source=SCMAI).
b. Start an SSH (secure shell) connection and log in to the VM that youinstantiated in step 2 on page 11.v For example, enter ssh root@ConsumerIPAddress where
ConsumerIPAddress is the IP address of the VM.v If you are using an SSH client or remote access software, log in with the
consumer VM IP address.v The default user name is root, with password passw0rd (type a “0” zero
in place of the letter “o”)c. Change to the directory where you want to install the consumer VM
software.d. Copy the smai-consumer.tar from the staging area to the VM with the
following command (all on one line):scp [email protected]:/gsa/rtpgsa/home/j/b/jbloggs/downloads/smai-consumer.tar .
where jbloggs is your GSA user ID, rtp is the GSA site, andrtpgsa/home/j/b/jbloggs/downloads is the path to the download location.
12 IBM SmartCloud Monitoring - Application Insight: Installation and Setup Guide

e. Answer the “Are you sure you want to continue connecting (yes/no)?”question:yes
f. Extract the consumer VM installation files:tar -xf SmartCloudMonitoring-ApplicationInsightAgentConsumerVM.tar
g. To install the consumer monitoring software on the VM, enter one or bothof the following commands:
Tivoli Monitoring agent for Linux OS: rpm -Uhv smai-sma-6.30.00.00-1.el6.x86_64.rpm
ITCAM for Web Response Time: rpm -Uhv smai-wrt-7.30.01.12-1.el6.x86_64.rpm
If you get any messages about dependencies, such as compat-libstdc++-33(i686) is needed by smai-wrt-7.30.01.12-1.el6.x86_64, the consumerVM must have the specified dependency resolved before you can completethe installation of the monitoring agent. For more information, see“Software dependencies and limitations” on page 3.
Tip: You can verify that the monitoring agent is running with the followingcommand where pc is the two-character product code (lz for Linux OS; t5for Web Response Time): ps -ef | grep kpcagent The response contains aline similar to this: root 26630 1 0 Aug13 ? 00:01:49/opt/IBM/ITM/li6263/pc/bin/kpcagent
h. After installation is complete and the command prompt is available, youcan close the SSH session or disconnect from the remote system.
Results
If you are viewing the Application Insight Group Dashboard, you can see theagents as they come online. For a description, click the Learn more... hypertextlink.
What to do nextv If you want to have other consumer VM types, such as one with the Response
Time agent and Linux OS agent and another with just the Response Time agent,you can repeat these steps.
v If you are not logged on to the Application Insight console, start it by enteringhttp://FabricIPAddress/smai in your browser URL address box whereFabricIPAddress is the IP address of the deployed fabric node VM.
v Initially, the Application Insight Group Dashboard has one group called “AllResources” and shows events if any of the predefined thresholds are breached.
v Click Settings > Group Configuration and create logical groupings of yourmonitored data sources, as described in the Learn more... link topic.
v Click Settings > Threshold Manager and create thresholds for testing keyperformance indicators, as described in the Learn more... link topic.
Advanced ConfigurationInitial fabric node configuration is done in the Configuration Wizard.
Use the Advanced Configuration page to control communications settings andadvanced features such as event forwarding.
Chapter 2. Installing 13

Agent Service InterfaceThe settings here are required information used by the fabric node toconfigure communications with the monitoring agents (data sources).
Refresh Interval (minute)The frequency, in minutes, that the data sources use to queryconfiguration details from the fabric node. Default: 5 minutes.
Port The HTTP port that is used to communicate with data sources.Default: 51920.
Secure PortThe HTTPS port that is used to communicate with data sources.Default: 53661.
Polling Interval (minutes)The frequency, in minutes, for checking that a data source is active.Default: 1 minute.
Trace The trace log component that is used to gather data about the performanceof the IBM SmartCloud Monitoring - Application Insight system.
Maximum File SizeThe maximum size of each log file in bytes. Default: 5000000 bytes(5 MB).
Maximum Log FilesThe maximum number of log files that will be used beforewrapping the log entries. After the maximum number of log files isreached, the oldest log file is replaced by the newest. Default: 5files.
Trace LevelThe level of detail for logging trace entries. The possible values areERROR, DEBUG_MIN, DEBUG_MID and DEBUG_MAX. Higherlevels give you more detailed information, which is useful forinvestigating any problems or errors that occur. Default: ERROR.
Package Level Trace StringA regular expression string describing the classes to trace at aspecified JLog level. Default: /com/ibm/tivoli/ccm/config\\.*:ERROR.
Event ManagerThe Event Manager controls the flow through (forwarding toNetcool/OMNIbus Probe for Tivoli EIF and Simple Mail Transfer Protocol)and the storage of received events.
Event Cache TimeThe number of hours that events are retained in the local cache, upto 96 hours. Default: 24 hours.
If the Event list is very long, consider reducing the number ofhours that are kept. Or, if you want to see events over a weekendperiod, increase the number of hours.
EIF PortThe port to use for Event Integration Facility operations. Default:5151.
EIF Event Target(s)The list of host names or IP addresses to which all received EventIntegration Facility events are forwarded. For example, if you are
14 IBM SmartCloud Monitoring - Application Insight: Installation and Setup Guide

forwarding events to the Netcool/OMNIbus Probe for Tivoli EIF,enter the fully qualified host name or IP address of the computerwhere the probe is installed. Separate each host name with acomma (,), such as9.87.65.111,9.12.34.115,myhostname.en.ibm.com.
SMTP PortThe port number to use for sending SMTP (Simple Mail TransferProtocol) email. Default: 25.
Sending Email AccountThe account to use when sending an SMTP email event.
Sending Email Account PasswordThe password associated with the sending email account.
SMTP Server AddressThe host name of the SMTP server that is used for sending eventsas emails, such as smtp.gmail.com.
SSL SMTP PortThe port number to use for sending SMTP email using the SSLprotocol. Default: 465.
Email Subject LineThe subject line text that will be applied to every forwarded SMTPemail event. Default: CCM Event.
Target Email AddressesThe list of one or more email addresses to which events areforwarded. Separate each address with a comma (,), such [email protected],[email protected],[email protected].
Use SSLWhether to use SSL as the SMTP transport mechanism. Default:False.
HTTP InterfaceThe HTTP interface is used with the Agent Service Interface tocommunicate with the data sources. The time out values that govern thedisplay of the indicator in the Group Dashboard and Group Detailsdashboard are controlled here. If the indicator is frequently displayed andthen not displayed, you might consider increasing the time out and retryvalues.
Connection TimeoutThe amount of time, in seconds, before an HTTP connectionattempt fails. Default: 2 seconds.
Read TimeoutThe amount of time, in seconds, before an HTTP read attempt fails.Default: 4 seconds.
Fabric Node TransportSetup information for the proper operation of the communications usedbetween fabric nodes.
Port The IP Port used for communications between fabric nodes. Thefabric node must be restarted if the port is changed. Default: 32105.
Chapter 2. Installing 15
SDP AdapterThe Socket Direct Protocol (SDP) adapter is responsible for providing theinterface between IBM SmartCloud Monitoring - Application Insight andthe underlying cloud platform.
Discovery IntervalThe time to wait, in seconds, between discovery cycles. Default: 30seconds.
Discovery Plug-insThe list of discovery plug-ins to be started. Valid values are: SCP,VMWARE and AMAZON. Default: VMWARE.
SDP Adapter - Amazon Plug-inAn SDP adapter specifically to support integration with the Amazon EC2environment.
Amazon Access KeyThe access key that is associated with the Amazon Web Serviceaccount.
Amazon Regional End-pointThe URL that represents the entry point for the Amazon WebService.
Amazon Secret KeyThe secret key that is associated with the Amazon Web Serviceaccount.
SDP Adapter - SCP Plug-inAn SmartCloud ProvisioningSCP plug-in that provides support for the IBMSmartCloud Provisioning environment.
Access IDThe ID used for SmartCloud Provisioning authentication.
Private KeyThe text form of the private key.
SCP Service RegionThe region that defines the SmartCloud Provisioning service type.Default: query
SCP Requests TimeoutThe amount of time, in seconds, until a request to SmartCloudProvisioning times out. Default: 30 seconds.
SCP Web Service HostThe SmartCloud Provisioning Web Service host name.
SCP Web Service PortThe SmartCloud Provisioning Web Service port. Default: 5678.
SDP Adapter - VMware Plug-inAn SDP adapter that provides support for the VMware environment.
Virtual Center PasswordThe password for the Virtual Center User Name.
Use SSLWhether to use an SSL connection to the Virtual Center. Default:false.
16 IBM SmartCloud Monitoring - Application Insight: Installation and Setup Guide

Virtual Center User NameA user ID that has sufficient privileges to collect monitoring data.
Validate CertificatesA flag that indicates whether certificate host names must bevalidated. Default: False.
Virtual Center HostThe Virtual Center host name.
Virtual Center PortThe Virtual Center port. Default: 80 when SSL is disabled; 443when SSL is enabled.
TruststoreInternal security key repository.
Java™ Keystore FileThe fully-qualified path of the keystore file containing thecollection of certificates trusted by this client. Default:/opt/ibm/ccm/CCM-Certs/ccm.truststore.
Java Keystore File PasswordThe password to access the keystore file that contains the collectionof certificates trusted by this client.
Managed Virtual Machines Agent CredentialsDefault User ID and Password to be tried for all data sources that are usedto collect data.
Default PasswordThe Default Password to be tried for all data sources that are usedto collect data.
Default User IDThe Default User ID to be tried for all data sources that are used tocollect data.
Related tasks:“Configuring the fabric node for SmartCloud Provisioning” on page 9Configuring the fabric node for Amazon EC2Configuring the fabric node for VMware
Chapter 2. Installing 17

18 IBM SmartCloud Monitoring - Application Insight: Installation and Setup Guide

Chapter 3. Monitoring
Use IBM SmartCloud Monitoring - Application Insight dashboards to monitor thehealth and efficiency of your cloud VMs.
The Application Insight infrastructure is installed on a management VM called thefabric node. After you log on to the fabric node, the Application Insight homedashboard is displayed.
Starting the Application Insight consoleLog in to the IBM SmartCloud Monitoring - Application Insight console from yourbrowser to review the health status of your deployments in dashboards.
Before you begin
The URL for the console is the IP address of the fabric node management VM. Ifyou don't know what the IP address is, find it by taking one of these steps:v Log on to SmartCloud Provisioning DOCTAR service region and look on the
Resources page in the Deployed VMs tab. The fabric node IP address is in thePrivate Address column.
v Log in to your AMAZON AWS account and navigate to the EC2 Instances page.On the top right corner, select to open the Show/Hide Columns window.Select the Public DNS and Private DNS check boxes and click Apply. Back onthe Amazon EC2 Instances tab, locate the VM that you want to collect IP datafrom and read the IP data from the columns you enabled in the previous step(such as VM Fabric BLD - Public IP = 54.242.164.133 - Private IP = 10.111.34.44).
v Start the VMware vSphere client, and go to View > Inventory > VMs andTemplates. Locate the VM that you want to collect the IP data from, select theVM, and go to the Summary tab to see the IP Addresses.
Procedure1. If you haven't already authenticated through the Tivoli RTP firewall, do so
now: http://tivlab.raleigh.ibm.com.2. Open a browser window and the enter the following URL to log on to the
Application Insight console where fabricIPaddress is the IP address of thefabric node management VM:http://fabricIPaddress/smai
3. After being prompted for your logon ID, enter the following credentials for thedefault user or enter the credentials that were assigned by your cloudadministrator:a. User name smadmin
b. Password passw0rd (type a “0” zero in place of the letter “o”)
Results
After you log in, the Application Insight Group Dashboard is displayed.
© Copyright IBM Corp. 2013 19

If no resource groups have been created, one group is displayed named “AllResources”. If, instead of the Group Dashboard, you get the Configuration Wizard,it means that the fabric node has not been configured. For instructions, see thetopic for your Cloud host: Configuring the fabric node for Amazon EC2,“Configuring the fabric node for SmartCloud Provisioning” on page 9, orConfiguring the fabric node for VMware .
What to do nextv Click the Learn more... link in any dashboard to learn more about the dashboard
and what you can do.
v Click Settings > Group Configuration and create logical groupings of yourmonitored data sources, as described in the Learn more... link topic.
v Click Settings > Threshold Manager and create thresholds for testing keyperformance indicators, as described in the Learn more... link topic.
v If no metrics are displayed for a data source, review the topics in Chapter 4,“Troubleshooting,” on page 25 to learn more about the possible causes andresolutions.
Data sourcesThe types of applications that you can monitor in IBM SmartCloud Monitoring -Application Insight are your data sources.
Figure 2. Group Dashboard before groups and thresholds have been created
20 IBM SmartCloud Monitoring - Application Insight: Installation and Setup Guide

The dashboards display metrics from both supported (such as the Linux OSmonitoring agent) and unsupported (such as the DB2 monitoring agent) datasources. The supported data sources have predefined thresholds and historical datacollections to help you get started with monitoring your consumer VM instances assoon as you log on to the Application Insight console.
Linux OS data sourceThe Linux OS data source has a set of predefined thresholds and historical datacollections to help you get started with monitoring your Linux OS data sources.
GroupsThe home dashboard initially displays one group called All Resources.Expand All Resources to see a collapsed row of all the data sources in yourmonitored environment, including Linux OS. Expand Linux OS to see allthe Linux OS data sources, named for their VM instance name and thetwo-character product code of the Linux OS monitoring agent: LZ.
Click Settings > Group Configuration to create and edit groups thatinclude one or more Linux OS data sources, as described in the “GroupConfiguration” help topic on the IBM SmartCloud Monitoring -Application Insight console.
ThresholdsThe Linux OS data source has two predefined thresholds:
Linux_CPU_Utilization_High This threshold is written for the KLZCPU data set. An event is opened if the aggregate CPU usage is at 80%or more.Linux_Memory_Utilization_High This threshold is written for the KLZVM Stats data set. An event is opened if the memory swap space usedis more than forty percent.
You can define additional thresholds using these and other Linux OS data
sets. Click Settings > Threshold Manager to see the existing Linux OSthresholds and to create and edit thresholds, as described in the“Threshold Manager” help topic on the Application Insight console. Allthresholds for the Linux OS data source are applied to all data sources ofthe same type.
To learn more about the Linux OS data sets and the metrics that comprisethem, see the “Linux OS Attributes” (pic.dhe.ibm.com/infocenter/tivihelp/v61r1/topic/com.ibm.itm.doc_6.3/oslinux/attr_lz_overview.htm) in theIBM Tivoli Monitoring: Linux OS Agent User's Guide.
Historical data collection configurationThe Linux OS data source has predefined historical data collections for thefollowing data sets:v KLZ_CPUv KLZ_CPU_Averagesv KLZ_Diskv KLZ_Disk_IOv KLZ_Disk_Usage_Trendsv KLZ_Networkv KLZ_System_Statisticsv KLZ_User_Logonv KLZ_VM_Stats
Chapter 3. Monitoring 21

v Linux_Group
Historical data samples are saved for each of these data sets every fiveminutes at the data source for three days (72 hours) before the oldestsamples are deleted to make room for the new data samples. The Linux OSDetails: DataSource:LZ dashboard shows historical data for the selected datasource.
Click Settings > Historical Data Configuration to see and configureLinux OS historical data collections, as described in the “Historical DataConfiguration” help topic on the Application Insight console.
Response Time data sourceThe Response Time data source has a set of predefined thresholds and historicaldata collections to help you get started with monitoring your Response Time datasources.
GroupsThe home dashboard initially displays one group called All Resources.Expand All Resources to see a collapsed row of all the data sources in yourmonitored environment, including Response Time. Expand Response Time tosee all the Response Time data sources, named for their VM instance nameand the two-character product code of the Response Time monitoringagent: T5.
Click Settings > Group Configuration to create and edit groups thatinclude one or more Response Time data sources, as described in the“Group Configuration” help topic on the Application Insight console.
ThresholdsThe Response Time data source has predefined thresholds, all of which arewritten for the WRT Transaction Status data set:
Response_Time_Warning A moderate percentage of the webtransactions have a slow response time. The threshold evaluates to trueif Percent_Slow is between 1% and 5% and the Percent_Available is100%.Response_Time_Availability_Warn tests for a failure rate of under10%, which indicates that a moderately high percentage of webtransactions have failed.Response_Time_Availability_Crit tests for a failure rate of over 10%,which indicates that a high percentage of web transactions have failed.
You can define additional thresholds using these and other Response Time
data sets. Click Settings > Threshold Manager to see the existingResponse Time thresholds and to create and edit thresholds, as describedin the “Threshold Manager” help topic on the Application Insight console.All Response Time thresholds are applied to all data sources of the sametype.
To learn more about the Response Time data sets and the metrics thatcomprise them, see “Response Time - Attributes listed alphabetically”(pic.dhe.ibm.com/infocenter/tivihelp/v63r1/topic/com.ibm.itcamt.doc_7.3/rt/Attributes/all_alpha.html) in the IBM TivoliComposite Application Manager for Transactions User's Guide.
Historical data collection configurationThe Response Time data source has historical configuration defined and
22 IBM SmartCloud Monitoring - Application Insight: Installation and Setup Guide

ready to begin data collection as soon as the monitoring agent on the datasource is started. There are predefined historical data collections for thefollowing data sets:v WRT_Application_Statusv WRT_Application_Summaryv WRT_Transaction_Statusv WRT_Transaction_Summary
Historical data samples are saved for each of these data sets every fiveminutes at the data source for three days (72 hours) before the oldestsamples are deleted to make room for the new data samples. The ResponseTime Details: DataSource:T5 dashboard shows historical data for theselected data source.
Click Settings > Historical Data Configuration to see and configureLinux OS historical data collections, as described in the “Historical DataConfiguration” help topic on the Application Insight console.
Unsupported data sourcesIf you have monitoring agents installed on the VMs in your environment that arenot supported in the current release of IBM SmartCloud Monitoring - ApplicationInsight, you can still see monitoring metrics in the dashboards.
You can also create and edit groups, thresholds, and historical data collections forunsupported agents.
Be aware that, because the monitoring agents are not supported, communicationsmight be unreliable and the dashboard displays are limited. If you see theindicator in the Group Dashboard and Group Details dashboard, it means thatthere is a loss of communication with the monitoring agent. You might need tostop and restart the monitoring agent on the VM instance before communicationscan succeed.
Likewise, if you attempt to create or edit a group, threshold, or historical datacollection and see no data sources of that type or get an error message, stop andrestart the monitoring agent on the indicated VM instance, then try again.
Chapter 3. Monitoring 23

24 IBM SmartCloud Monitoring - Application Insight: Installation and Setup Guide

Chapter 4. Troubleshooting
Review the troubleshooting topics for problems you might experience withinstalling and configuring or using IBM SmartCloud Monitoring - ApplicationInsight.
Empty dashboard after login on Internet ExplorerOn Internet Explorer V8, after successfully logging to Application Insight, you seean empty screen instead of the Group Dashboard.
The navigation bar might be displayed, but with no tools.
DiagnosisThe blank window is a symptom of a rejection by Internet Explorer basedon the security settings.
ResolutionAdd the fabric node IP address to the list of Trusted sites in InternetExplorer:1. In Internet Explorer V8, open Tools > Internet Options and select the
Security tab.2. Select the Trusted sites zone and click the Sites button.3. In the Trusted sites dialog box, enter the URL for the fabric node, such
as http://9.87.65.123/smai.4. Click Add to add the URL to the Websites list, and click Close.5. Click OK to close the Internet Options dialog box.6. Refresh the browser (View > Refresh or press F5) to see the Group
Dashboard.
Dashboards show no events or event statusIf you can see metrics from a data source but no severity indicator is displayed inthe Status column or no threshold events are being reported, you might need torestart the monitoring agent.
Diagnosis and ResolutionThe data sources for IBM SmartCloud Monitoring - Application Insightinclude the IBM Tivoli Monitoring Linux OS monitoring agent V6.3 FixPack 1 (or later) and ITCAM for Transactions Response Time monitoringagent V7.3 (or later). If you have an earlier version of the monitoring agentinstalled or you have another type of monitoring agent besides the LinuxOS and Web Response Time agents, you must stop and restart the agentbefore it can send events to the fabric node. You must also restart the agentafter updating the thresholds or historical data collection before you cansee the effect of the changes.
Monitoring agents restart repeatedly after threshold creationAfter a new threshold was created for a data source in the Threshold Editor, theassociated monitoring agents restart continuously.
© Copyright IBM Corp. 2013 25

SymptomAfter you create a new threshold, the monitoring agents that the thresholdwas created for enter on a repeated sequence of restarts and eventuallybecome unresponsive and disappear from the group dashboard page.
DiagnosisThe problem occurs when the fabric node clock and the monitoring agentclocks are not synchronized. The agents are not able to identify that theyalready downloaded the latest configuration from the fabric node and keepretrying.
ResolutionUse NTP (Network Time Protocol) or the hypervisor for timesynchronization. The fabric node is dependent on the times of the servers.The VMs must be set correctly for the time zone they are in, such as UTC-3 for Brasilia and UTC +9 for Seoul.
Log filesGather the log files when requested by IBM Support to help diagnose issues withIBM SmartCloud Monitoring - Application Insight.
Run the following script on the fabric node to collect the log files./opt/ibm/ccm/collectLogs.sh
26 IBM SmartCloud Monitoring - Application Insight: Installation and Setup Guide

Privacy policy considerations
IBM Software products, including software as a service solutions, (“SoftwareOfferings”) may use cookies or other technologies to collect product usageinformation, to help improve the end user experience, to tailor interactions withthe end user or for other purposes. In many cases no personally identifiableinformation is collected by the Software Offerings. Some of our Software Offeringscan help enable you to collect personally identifiable information. If this SoftwareOffering uses cookies to collect personally identifiable information, specificinformation about this offering’s use of cookies is set forth below.
This Software Offering does not use cookies or other technologies to collectpersonally identifiable information.
If the configurations deployed for this Software Offering provide you as acustomer the ability to collect personally identifiable information from end usersvia cookies and other technologies, you should seek your own legal advice aboutany laws applicable to such data collection, including any requirements for noticeand consent.
For more information about the use of various technologies, including cookies, forthese purposes, see IBM’s Privacy Policy at http://www.ibm.com/privacy andIBM’s Online Privacy Statement at http://www.ibm.com/privacy/details thesection entitled “Cookies, Web Beacons and Other Technologies” and the “IBMSoftware Products and Software-as-a-Service Privacy Statement” athttp://www.ibm.com/software/info/product-privacy.
© Copyright IBM Corp. 2013 27

28 IBM SmartCloud Monitoring - Application Insight: Installation and Setup Guide

Accessibility
Accessibility features help users with physical disabilities, such as restrictedmobility or limited vision, to use software products successfully. IBM SmartCloudMonitoring - Application Insight supports a command prompt interface forinstallation and a web-based interface for configuration and usage. Productfunctionality and accessibility features vary according to the interface.
The major accessibility features in this product enable users in the following ways:v Use assistive technologies, such as screen-reader software and digital speech
synthesizer, to hear what is displayed on the screen. Consult the productdocumentation of the assistive technology for details on using those technologieswith this product.
v Operate specific or equivalent features using only the keyboard.v Magnify what is displayed on the screen.
In addition, the product documentation was modified to include the followingfeatures to aid accessibility:v All documentation is available in both HTML and convertible PDF formats to
give the maximum opportunity for users to apply screen-reader software.v All images in the documentation are provided with alternative text so that users
with vision impairments can understand the contents of the images.
IBM SmartCloud Monitoring - Application Insight and its related publications, areaccessibility-enabled. For more information about the accessibility features of theinformation center, see Accessibility and keyboard shortcuts in the informationcenter.
Interface information
The interface offers the greatest range of functionality, but is not entirely accessible.
Navigating the interface using the keyboard
Standard shortcut and accelerator keys are used by the product and aredocumented by the operating system. See the documentation provided by youroperating system for more information.
Magnifying what is displayed on the screen
You can enlarge information on the product windows using facilities provided bythe operating systems on which the product is run. For example, in a MicrosoftWindows environment, you can lower the resolution of the screen to enlarge thefont sizes of the text on the screen. See the documentation provided by youroperating system for more information.
IBM and accessibility
See the IBM Human Ability and Accessibility Center for more information aboutthe commitment that IBM has to accessibility.
© Copyright IBM Corp. 2013 29

30 IBM SmartCloud Monitoring - Application Insight: Installation and Setup Guide

Notices
This information was developed for products and services offered in the U.S.A.IBM may not offer the products, services, or features discussed in this document inother countries. Consult your local IBM representative for information on theproducts and services currently available in your area. Any reference to an IBMproduct, program, or service is not intended to state or imply that only that IBMproduct, program, or service may be used. Any functionally equivalent product,program, or service that does not infringe any IBM intellectual property right maybe used instead. However, it is the user's responsibility to evaluate and verify theoperation of any non-IBM product, program, or service.
IBM may have patents or pending patent applications covering subject matterdescribed in this document. The furnishing of this document does not give youany license to these patents. You can send license inquiries, in writing, to:
IBM Director of LicensingIBM CorporationNorth Castle DriveArmonk, NY 10504-1785 U.S.A.
For license inquiries regarding double-byte (DBCS) information, contact the IBMIntellectual Property Department in your country or send inquiries, in writing, to:
Intellectual Property LicensingLegal and Intellectual Property LawIBM Japan, Ltd.19-21, Nihonbashi-Hakozakicho, Chuo-kuTokyo 103-8510, Japan
The following paragraph does not apply to the United Kingdom or any othercountry where such provisions are inconsistent with local law :
INTERNATIONAL BUSINESS MACHINES CORPORATION PROVIDES THISPUBLICATION "AS IS" WITHOUT WARRANTY OF ANY KIND, EITHEREXPRESS OR IMPLIED, INCLUDING, BUT NOT LIMITED TO, THE IMPLIEDWARRANTIES OF NON-INFRINGEMENT, MERCHANTABILITY OR FITNESSFOR A PARTICULAR PURPOSE.
Some states do not allow disclaimer of express or implied warranties in certaintransactions, therefore, this statement might not apply to you.
This information could include technical inaccuracies or typographical errors.Changes are periodically made to the information herein; these changes will beincorporated in new editions of the publication. IBM may make improvementsand/or changes in the product(s) and/or the program(s) described in thispublication at any time without notice.
Any references in this information to non-IBM Web sites are provided forconvenience only and do not in any manner serve as an endorsement of those Websites. The materials at those Web sites are not part of the materials for this IBMproduct and use of those Web sites is at your own risk.
© Copyright IBM Corp. 2013 31

IBM may use or distribute any of the information you supply in any way itbelieves appropriate without incurring any obligation to you.
Licensees of this program who wish to have information about it for the purposeof enabling: (i) the exchange of information between independently createdprograms and other programs (including this one) and (ii) the mutual use of theinformation which has been exchanged, should contact:
IBM Corporation2Z4A/10111400 Burnet RoadAustin, TX 78758 U.S.A.
Such information may be available, subject to appropriate terms and conditions,including in some cases payment of a fee.
The licensed program described in this document and all licensed materialavailable for it are provided by IBM under terms of the IBM Customer Agreement,IBM International Program License Agreement or any equivalent agreementbetween us.
Any performance data contained herein was determined in a controlledenvironment. Therefore, the results obtained in other operating environments mayvary significantly. Some measurements may have been made on development-levelsystems and there is no guarantee that these measurements will be the same ongenerally available systems. Furthermore, some measurement may have beenestimated through extrapolation. Actual results may vary. Users of this documentshould verify the applicable data for their specific environment.
Information concerning non-IBM products was obtained from the suppliers ofthose products, their published announcements or other publicly available sources.IBM has not tested those products and cannot confirm the accuracy ofperformance, compatibility or any other claims related to non-IBM products.Questions on the capabilities of non-IBM products should be addressed to thesuppliers of those products.
All statements regarding IBM's future direction or intent are subject to change orwithdrawal without notice, and represent goals and objectives only.
This information is for planning purposes only. The information herein is subject tochange before the products described become available.
This information contains examples of data and reports used in daily businessoperations. To illustrate them as completely as possible, the examples include thenames of individuals, companies, brands, and products. All of these names arefictitious and any similarity to the names and addresses used by an actual businessenterprise is entirely coincidental.
COPYRIGHT LICENSE:
32 IBM SmartCloud Monitoring - Application Insight: Installation and Setup Guide

TrademarksIBM, the IBM logo, and ibm.com are trademarks or registered trademarks ofInternational Business Machines Corp., registered in many jurisdictions worldwide.Other product and service names might be trademarks of IBM or other companies.A current list of IBM trademarks is available on the web at “Copyright andtrademark information” at www.ibm.com/legal/copytrade.shtml.
Adobe, Acrobat, PostScript and all Adobe-based trademarks are either registeredtrademarks or trademarks of Adobe Systems Incorporated in the United States,other countries, or both.
IT Infrastructure Library is a registered trademark of the Central Computer andTelecommunications Agency which is now part of the Office of GovernmentCommerce.
Intel, Intel logo, Intel Inside, Intel Inside logo, Intel Centrino, Intel Centrino logo,Celeron, Intel Xeon, Intel SpeedStep, Itanium, and Pentium are trademarks orregistered trademarks of Intel Corporation or its subsidiaries in the United Statesand other countries.
Linux is a trademark of Linus Torvalds in the United States, other countries, orboth.
Microsoft, Windows, Windows NT, and the Windows logo are trademarks ofMicrosoft Corporation in the United States, other countries, or both.
ITIL is a registered trademark, and a registered community trademark of TheMinister for the Cabinet Office, and is registered in the U.S. Patent and TrademarkOffice.
UNIX is a registered trademark of The Open Group in the United States and othercountries.
Java and all Java-based trademarks and logos are trademarks or registeredtrademarks of Oracle and/or its affiliates.
Cell Broadband Engine is a trademark of Sony Computer Entertainment, Inc. in theUnited States, other countries, or both and is used under license therefrom.
Linear Tape-Open, LTO, the LTO Logo, Ultrium, and the Ultrium logo aretrademarks of HP, IBM Corp. and Quantum in the U.S. and other countries.
Notices 33

34 IBM SmartCloud Monitoring - Application Insight: Installation and Setup Guide
Index
Numerics64-bit Intel/AMD64 3
Aaccessibility features 29advanced configuration 14agent service interface 14Amazon EC2
SDP adapter 16
Cconfiguration
advanced 14consumer VM
installing SmartCloudProvisioning 11
Red Hat Enterprise Linux 3copyright 31
Ddashboards
empty window 25no events displayed 25
data sources 21default user 17port 14troubleshooting restarts 26
dependencies 3
Eemail configuration 14error log
See trace logevent integration facility 14event manager 14
Ffabric node
configuring SmartCloudProvisioning 9
installing SmartCloud Provisioning 6IP port 15Red Hat Enterprise Linux 3
firewallaccess key ID 5Amazon Web Services 5
HHTTP interface 15
Iinstalling 3
SmartCloud Provisioning 6SmartCloud Provisioning consumer
VM 11Internet Explorer 25
Kkorn shell 3
Llibstdc++.so.5 3Linux
Red Hat Enterprise 3log files 26logon 19
Mmonitoring agents
See also data sourcestroubleshooting restarts 26
Nnotices 31
Ooverview 1
Pplatform
operating system 3polling interval 14port
25 1432105 15443 16465 145151 1451920 1453661 145678 1680 16
portSmartCloud Provisioning5678 9
Rrefresh interval 14
SSDP adapter 16security
Java keystore 17truststore 17
SmartCloud Provisioningconfiguring 9installing 6installing consumer VM 11SDP adapter 16
SMTP 14SSL 14starting Application Insight 19
TTivoli monitoring agents
See data sourcestrace log 14trademarks 33troubleshooting 25
Uuser ID 17
VVMware
SDP adapter 16
© Copyright IBM Corp. 2013 35

36 IBM SmartCloud Monitoring - Application Insight: Installation and Setup Guide


����
Printed in USA
SC27-5618-00