icap aerosol multi-model ensemble
TRANSCRIPT

ICAP Aerosol Multi-Model Ensemble
1
Current State of the global operational aerosol multi-model ensemble: an update from the International Cooperative for Aerosol Prediction
(ICAP)
Peng Xian, a* Jeffrey S. Reid, a Edward J. Hyer,a Charles R. Sampson,a Juli I. Rubin,b Melanie
Ades,c Nicole Asencio,d Sara Basart,e Angela Benedetti, c Partha Bhattacharjee,f Malcolm E.
Brooks,g Peter R. Colarco, h Arlindo Da Silva,h Tom F. Eck,h Jonathan Guth,d Oriol Jorba,e
Rostislav Kouznetsov,i,m Zak Kipling,c Sofiev Mikhail,i Carlos Perez Carcia-Pando,e Yaswant
Pradhan,g Taichu Tanaka,j Jun Wang,f Douglas L. Westphal,a Keiya Yumimoto,j,k and Jianglong
Zhangl
aMarine Meteorology Division, Naval Research Laboratory, Monterey, CA, USA
bRemote Sensing Division, Naval Research Laboratory, Washington DC, USA
cEuropean Centre for Medium-Range Weather Forecasts, Reading, UK
dMétéo-France, UMR3589, Toulouse, France
eEarth Sciences Department, Barcelona Supercomputing Center-Centro Nacional de
Supercomputación, Barcelona, Spain
fI.M. System Group at NOAA/NCEP/EMC, College Park, MD, USA
fNOAA NCEP, College Park, MD, USA
gMet Office, Exeter, UK
hNASA Goddard Space Flight Center, Greenbelt, MD, USA
iAtmospheric composition unit, Finnish Meteorological Institute, Helsinki, Finland
jAtmospheric Environment and Applied Meteorology Research Department, Meteorological
Research Institute, Japan Meteorological Agency, Tsukuba Japan

ICAP Aerosol Multi-Model Ensemble
2
kResearch Institute for Applied Mechanics, Kyushu University, Kasuga, Fukuoka, Japan
lDept. of Atmospheric Sciences, University of North Dakota, Grand Forks, ND, USA
mObukhov Institute for Atmospheric Physics, Moscow, Russia
* Correspondence to: P. Xian, Marine Meteorology Division, Naval Research Laboratory, 7
Grace Hopper Ave, Stop 2, Monterey, CA 93943.
Email: [email protected]
Abstract
Since the first International Cooperative for Aerosol Prediction (ICAP) multi-model ensemble
(MME) study, the number of ICAP global operational aerosol models has increased from five to
nine. An update of the current ICAP status is provided, along with an evaluation of the
performance of the ICAP-MME over 2012-2017, with a focus on the June 2016-May 2017 time
period. Evaluated with ground based Aerosol Robotic Network (AERONET) aerosol optical
depth (AOD) and data assimilation quality Moderate Resolution Imaging Spectroradiometer
(MODIS) retrieval products, the ICAP-MME AOD consensus remains the overall top scoring
and most consistent performer among all models in terms of root mean square error (RMSE),
bias and correlation for total, fine and coarse mode AODs as well as dust AOD; this is similar to
the first ICAP-MME study. Further, over the years, the performance of ICAP-MME is relatively
stable and reliable compared to more variability in the individual models. The extent to which
the AOD forecast error of the ICAP-MME can be predicted is also examined. Leading predictors
are found to be the consensus mean and spread. Regression models of absolute forecast errors

ICAP Aerosol Multi-Model Ensemble
3
were built for AOD forecasts of different lengths for potential applications. ICAP-MME
performance in terms of modal AOD RMSEs of the 21 regionally representative sites over 2012-
2017 suggests a general tendency for model improvements in fine-mode AOD, especially over
Asia. No significant improvement in coarse-mode AOD is found overall for this time period.
Key words: aerosol, ensemble, aerosol forecast, multi model ensemble, global aerosol model,
probabilistic forecast, operational aerosol forecast, aerosol modeling

ICAP Aerosol Multi-Model Ensemble
4
1. Introduction
Over the past decade, global aerosol modeling has grown from a largely climate and geophysical
science activity to include operational forecasting and decision support systems. Weather, air
quality, and health communities are increasingly relying on aerosol analysis and forecast
products. For example, near-real-time (NRT) aerosol forecasts are used to provide situational
awareness for civilian aviation, military operations, and air-quality alerts. Operationally, aerosol
particles can also interfere with many aspects of modern-day Earth system observing systems,
including retrievals of sea surface temperature (e.g., May et al., 1992, Reynolds, 1989,
Bogdanoff et al., 2015), ocean color (e.g., Gordon, 1997), and land use systems (Song et al.
2001), as well as atmospheric retrievals of temperature, water vapor and other gases, which are
used to constrain atmospheric states in numerical weather prediction (NWP) models (Houweling,
et al., 2005). Indeed, progress has been made in accounting for aerosol impacts on radiances in
satellite retrievals through atmospheric corrections (Weaver et al., 2007; Wang and Niu, 2013)
and aerosol direct and indirect impact on NWP forecasts (e.g., Mulcahy et al., 2014; Toll et al.,
2016).
With the rapid increase in the number of operational and quasi-operational global aerosol
models, the International Cooperative for Aerosol Prediction (ICAP) was founded in 2010 (Reid
et al., 2011; Benedetti et al., 2011; Colarco et al., 2014a) with one of its goals being the
development of a global multi-model aerosol forecasting ensemble (ICAP-MME) for basic
research and eventual operational use. The ICAP community, which consists of developers from
forecasting centers and remote-sensing data providers, has met yearly since its inception to
discuss issues pertaining to operational aerosol forecasting with topics ranging from aerosol

ICAP Aerosol Multi-Model Ensemble
5
observability (Reid et al., 2011), model validation and verification (Benedetti et al. 2011),
aerosol processes, and aerosol data assimilation (http://icap.atmos.und.edu/).
As a relatively new community compared to NWP, ICAP has positioned itself to take advantage
of best practices from the NWP community, including methodologies for data assimilation,
single-model ensembles (Molteni et al., 1996; Toth and Kalnay, 1997), multi-model ensembles
(Park et al., 2008), and consensus products (Sampson et al., 2008). In particular, the motivation
for developing the ICAP global multi-model ensemble AOD consensus is based on NWP studies
that have shown the usefulness of ensemble-based predictions in understanding systematic errors
that arise from the imperfect nature of models and the sensitivity of models to initial conditions.
For example, multi-model consensuses are found on average to produce more accurate forecasts
of cyclone track and intensity than the individual model members (e.g., Goerss, 2000; Sampson
et al., 2008). Likewise, the ICAP-MME aerosol forecast consensus generally performed better
than the individual models in the first ICAP-MME global assessment (Sessions et al., 2015).
The first ICAP-MME, as described in Sessions et al. (2015), included four complete aerosol
forecast models (European Center for Medium-Range Weather Forecasts-Monitoring
Atmospheric Composition and Climate Model (ECMWF-MACC), now under the Copernicus
Atmosphere Monitoring Service (CAMS); Fleet Numerical Meteorology and Oceanography
Center (FNMOC)/Naval Research Laboratory (NRL)-Navy Aerosol Analysis and Prediction
System (NAAPS); Japan Meteorological Agency (JMA)-Model of Aerosol Species in the Global
Atmosphere (MASINGAR); and NASA Global Modeling and Assimilation Office (GMAO)
Goddard Earth Observing System, Version 5 (GEOS-5); and one dust-only model, (NOAA
NCEP NOAA Environmental Modeling System (NEMS) Global Forecast System (GFS) Aerosol
Component (NGAC)). Since then, forecast contributions from other forecasting centers have

ICAP Aerosol Multi-Model Ensemble
6
been added to the ICAP-MME, including dust aerosol forecasts from the Barcelona
Supercomputing Center (BSC) and the UK Met Office (UKMO) dust models, and full-species
aerosol forecasts from Météo France Modèle de Chimie Atmospherique à Grande Echelle
(MOCAGE) and Finnish Meteorological Institute (FMI) System for Integrated modeling of
Atmospheric coMposition (SILAM). Additionally, numerous updates were made to improve the
quality of predictions from the individual forecast models (e.g. better representation of aerosol
processes, more aerosol species, finer spatial and temporal resolution, from offline to inline
modeling, etc.), the initial conditions (e.g. new observation types, improved methods for
processing and screening observations, and improved data assimilation techniques), and
improvements in the driving meteorological model data. As a result of these many updates, a
new performance evaluation of the ICAP-MME was deemed necessary for the aerosol
forecasting community, as well as joining the larger ensemble community in celebrating 25-
years of ensemble prediction at ECMWF (Buizza and Richardson, 2017).
The individual aerosol models that contribute to the ICAP-MME are independent in their
underlying meteorology and often in their aerosol sources, sinks, microphysics and chemistry.
The diversity of aerosol representation across the aerosol forecast models, similar to that found
in aerosol climate models (Kinne et al., 2006), results in differences in predicted aerosol
properties and spatial/temporal distributions. In order to increase the accuracy of aerosol
forecasts, several centers have employed data assimilation of satellite-and/or-ground-based
observations of aerosol optical depth (AOD)-the most widely available and evaluated aerosol
parameter. For these models, the diversity in assimilation methods, and the assimilated AOD
observations, including the treatments of the observations prior to assimilation (quality control,
bias correction, aggregation and sampling, etc.), also leads to differences in the AOD analyses

ICAP Aerosol Multi-Model Ensemble
7
and forecasts. In this paper, AOD at 550nm from all models are evaluated regionally by
representative Aerosol Robotic Network (AERONET) sites and globally using a data
assimilation grade satellite aerosol product. We present the basic verification characteristics of
the ICAP-MME and their evolution with time, and identify regions of diversity in model
analyses and forecasts across the ensemble members. We also evaluate the usefulness of ICAP
model ensemble mean and spread for absolute forecast error estimate. Finally, we use this
knowledge to build forecast error regression models for potential applications towards
probabilistic forecasts.
2. Methodology
In this section, a brief description is provided of the models that are included in the ICAP-MME
and an outline is given of the fundamental metrics for model performance in AOD prediction.
Drawing from the members of the ICAP-MME’s latest generation of quasi-operational aerosol
models, AOD analyses and four day AOD forecasts are analyzed from four multi-species models
with AOD data assimilation (core members), ECMWF/CAMS, JMA, NASA GSFC/GMAO, and
NRL/FNMOC. For the evaluation of dust analyses and forecasts, the UKMO dust model with
dust AOD assimilation is included. For dust forecast evaluation only, dust products are included
from NOAA NGAC and the BSC CTM, which exclude data assimilation, leading to a total of 7
dust models. As per the ICAP agreement, individual models and their associated metrics are not
specified. Instead, the metrics are provided for the ensemble as a whole, as was done in the first
ICAP-MME paper (Sessions et al., 2015) with an emphasis on the relative spread of performance
for both analyses and forecasts at different sites and regions. The main analysis is conducted over

ICAP Aerosol Multi-Model Ensemble
8
a one year time period, June 2016 to May 2017, when the most recent validation data from both
AERONET and DA-quality satellite products is most abundant. Additionally, the start date of the
analysis time, June 2016, coincides with the operational transition of AOD data assimilation for
one of the core members, giving a total of four multi-species aerosol models with data
assimilation for evaluation.
2.1 Input models
The current ICAP-MME operation includes seven comprehensive global aerosol models: the
ECMWF Copernicus Atmosphere Monitoring Service (CAMS, former MACC), GEOS-5,
NAAPS, MASINGAR, NGAC, MOCAGE, SILAM, and two dust only global models: BSC
Multiscale Online Nonhydrostatic AtmospheReCHemistry model (MONARCH, former BSC-
CTM) and UKMO Unified Model. The basic properties and configurations of these participating
models are outlined in Table 1 and detailed descriptions of individual models are given in
Appendix A. During the study period, there were insufficient data to fully evaluate the
MOCAGE, SILAM, and NGAC full-species models with the exception of the NGAC dust
component. Therefore, while descriptions are included of these models, MOCAGE, SILAM and
the non-dust species of NGAC are not used in the evaluation presented here.
The ICAP models are mostly driven by independent operational/quasi-operational
meteorological models that are developed at each NWP/research center, and aerosol variables are
either calculated dynamically and concurrently with the meteorological fields (“inline”) or run in
a separate calculation forced by stored NWP fields (“offline”). Depending on the resolution of
the underlying meteorology, the aerosol models have different horizontal and vertical
resolutions, ranging from 0.25°x0.31° latitude/longitude and 72 vertical layers to 1.4ox1o and 24

ICAP Aerosol Multi-Model Ensemble
9
layers. All of the models include dust aerosol, although with different size bins. The
comprehensive models carry a full set of aerosol species, including dust, sea salt, biomass
burning smoke (combined black carbon and organic carbon from some models) and varying
forms of pollution aerosols (sulfate and possible nitrates). The aerosol sources (e.g., biomass
burning emissions), sinks, microphysics, and chemistry are also quite different across the
models, with the exception of NOAA NGAC and GEOS-5 which use a similar aerosol module.
For the models that have aerosol data assimilation, aerosol forecasts are initialized with analysis
fields from their respective DA systems, ranging from 2-dimensional variational (2DVar),
3DVar, and 4DVar to ensemble systems. One consistency across these data assimilation systems
is the use of data from the Moderate Resolution Imaging Spectroradiometer (MODIS) with its
daily global spatial coverage. However, the treatments applied to the MODIS observations are
different among the members. For example, FNMOC/NRL applies strict quality assurance and
quality control processes to convert MODIS level 2 data into filtered, corrected and aggregated
AOD observations with associated uncertainty estimates. This processing is described for
MODIS Collection 5 over-ocean Dark Target AOD by Shi et al. (2011), and over-land by Hyer
et al. (2011). For MODIS Collection 6 data, all correction and filtering coefficients were
recalculated, and the method used to screen and correct Dark Target over-land retrievals was
applied to Deep Blue retrievals also. NASA GMAO also uses MODIS, but adapts a neural
network retrieval trained using AERONET data to translate observed MODIS radiances into
ground-based calibrated AOD (Randles et al., 2017). The UK Met Office develops their own
dust AOD product derived from MODIS retrieved aerosol properties (Pradhan, 2017).
Furthermore, since satellite retrieved AOD is a column integrated observation, aerosol speciation
and vertical distribution are not constrained by assimilation of AOD. The operations used to
ICAP Aerosol Multi-Model Ensemble
10
convert AOD into 3-D speciated aerosol fields and vice versa constitute another layer of
diversity across models that include data assimilation.
2.2 ICAP-MME
The ICAP-MME is a consensus-style multi-model ensemble where all members are equally
weighted. The ensemble of model AODs is generated daily with 1°x1° resolution at 00Z for 6-
hourly forecasts out to 120 hours with a 1-day latency. The l-day latency allows aerosol forecasts
from all centers, including centers that generate their aerosol predictions on a delayed cycle, to
be collected and aggregated into the ICAP-MME. Daily products include AOD distribution
maps, mean-spread plots, verification plots, and threat scores as well as the ICAP-MME data
itself. Currently, the ensemble is limited to speciated AOD at a standard 550 nm wavelength. It is
anticipated, by the end of 2018, that surface mass concentrations of speciated aerosols will also
be included in the ICAP-MME. Due to differences in data policy for participating members,
plots and data products of each individual member are only available to participating centers.
However, plots of ICAP-MME consensus and spread are available on the NRL webpage
(http://www.nrlmry.navy.mil/aerosol/) and NetCDF data files including the 550 nm dust, fine-
mode (mostly from pollution and biomass burning smoke aerosol), coarse-mode (mostly from
dust and sea salt aerosols) and total AOD (from all aerosol species) are available on the US
Global Oceans Data Assimilation Experiment (GODAE) website at http://usgodae.org/cgi-
bin/datalist.pl?dset=nrl_icap_mme&summary=Go, both last accessed on 31 October 2018.
The data stream for the individual ICAP models and the MME over time is shown in Fig. 1.
Because of the operational nature of these models, data stream outages sometimes occur due to

ICAP Aerosol Multi-Model Ensemble
11
network issues or hardware/software issues, for example. The ICAP-MME is generated daily for
the previous 3 days to minimize outages. Most members have data availability greater than 90%,
with 6 out of 8 members greater than 95% and the ICAP-MME data is produced with 99.8%
availability.
The ICAP MME evaluation results presented in this paper are based on the unweighted
arithmetic mean of the ensemble members (“ensemble mean”), and the standard deviation of the
ensemble members (“ensemble spread”). We also tested using the ensemble median for the June
2016 to May 2017 study period and our evaluation results and conclusions were unchanged.
2.3 Verification
The AErosol RObotic NETwork (AERONET, http://aeronet.gsfc.nasa.gov) is a ground-based
and global-scale sun photometer network, which has been providing high-accuracy
measurements of aerosol properties since the 1990s (Holben et al., 1998). AERONET
instruments measure sun and sky radiance at several wavelengths, ranging from the near
ultraviolet to near infrared during daytime. It is often used as the primary standard for validating
satellite products and model simulations (e.g., Levy et al., 2010; Colarco et al., 2010). For this
study, we use the quality-assured AERONET Version 3 Level-1.5 product, which has better
cloud-screening and better preservation of high AOD values that were often discarded in
previous versions. The complete set of Version 3 cloud screening and quality assurance
algorithms and comparisons of the Version 3 product to Version 2 are provided in Eck et al.
(2018). While final quality assured Version 3 level 2 data is preferable, complete datasets are
posted with delays as long as 18 months, after instruments have been brought back from the field
for laboratory recalibration. However, as data is converted to level 2, calibration constants are

ICAP Aerosol Multi-Model Ensemble
12
back applied to level 1.5 data ensuring the best possible available data while completing
timeliness requirements. The Version 3 AERONET data from sites with post-deployment
calibration re-processing have AOD uncertainty very similar to AERONET Version 2 Level 2 of
~0.01 in the visible and near-infrared (Eck et al., 1999), since calibration is the dominant source
of the measured AOD uncertainty. Other data with only pre-deployment calibration applied
(since these instruments are still operating in the field) may have AOD uncertainties that are
somewhat higher depending on the magnitude of calibration drift, but will typically be ~0.02 or
less since Level 1.5 data have passed the Version 3 cloud-screening and QA filtering. The ICAP
DA models have a capability of assimilating AERONET AOD in their research mode (e.g.,
Rubin et al., 2017), but none of the operational runs apply AERONET AOD assimilation. So the
AERONET data serves as an independent dataset for validation purpose.
For this analysis, 21 AERONET sites are selected (Table 2) based on regional
representativeness, and the availability of contiguous data records covering June 2016 to May
2017 , the main study period, as well as the longer 2012-2017 period to allow for evaluation of
model performance over time. Additionally, sites were selected to maintain as much consistency
as possible with the original ICAP-MME evaluation (Sessions et al., 2015), to enable
comparisons between previous and current evaluations. Of the original 21 sites, 18 were
retained, including 10 sites dominated by dust influence. The 3 sites that were replaced for this
analysis due to large data gaps or site decommissioning include the remote oceanic site Crozet
Island, which is replaced with Amsterdam Island, the Arabian Peninsula dust site Solar Village
replaced with Mezaira, and the South Korea site Baengnyeong replaced with Yonsei University
site following the regional representativeness requirement.

ICAP Aerosol Multi-Model Ensemble
13
Since AERONET instruments do not directly measure at 550nm, measurements from multiple
wavelengths (380nm to 1020nm) were used to estimate both fine and coarse mode AODs at
550nm, based on the Spectral Deconvolution Method (SDA) of O’Neill et al. (2001, 2003). The
SDA product is capable of capturing the full modal characteristics of fine and coarse particles,
based on verifications using in situ measurements (Kaku et al., 2014). SDA derived fine and
coarse mode AERONET AODs are then compared to model-predicted fine mode, represented as
pollution plus biomass-burning smoke, and coarse mode, represented as sea salt plus dust. To
facilitate comparison between ground-based AERONET observations and gridded model output,
the 1°x1° degree ICAP model grids in which the AERONET V3 Level 1.5 data fall within are
first identified and model AOD is sampled from the identified grid. To account for temporal
differences, AERONET data are binned into 6-hour intervals centered at the model synoptic
output times of 00, 06, 12 and 18 UTC and then averaged within the bins. AERONET coarse-
mode AOD is used for dust AOD validations at sites dominated by dust influence (Table 3) for
all models. Fine and total AOD validations only apply to the full-species models.
While AERONET serves as a useful verification dataset due to the small measurement error,
sites are only present over land, and are sparse in many regions, limiting the evaluation of global
model output. In order to generate a global-scale assessment of model performance, the ICAP-
MME analyses and forecasts are also evaluated against the data assimilation quality MODIS C6
AOD product. The methodology to develop the DA-quality MODIS C6 AOD product is similar
to that of MODIS C5 AOD product (Shi et al., 2011; Hyer et al., 2011), however, the DA-quality
C6 product includes combined AOD retrievals from the Dark-Target and Deep-Blue algorithms,
providing more data coverage (compared to Dark-Target only) over desert/bright surfaces
(screened using the same methods as the Dark Target over-land retrievals). This DA-quality

ICAP Aerosol Multi-Model Ensemble
14
MODIS C6 AOD data is a Level 3 product that is produced at the same spatial and temporal
resolution as the ICAP-MME products (1ox1o spatial/6-hr temporal resolution). Since the C6 data
product includes total AOD only, not speciated or size-resolved AODs, verification against this
product is limited to the four full-species aerosol models.
The DA-quality MODIS C6 AOD was derived from MODIS products, which all the ICAP DA
model’s assimilation systems use to various extents. Thus the verification here is not fully
independent. The MODIS C6 AOD used as a verification dataset is not identical to the data
assimilated in real time by any of the ICAP models. The MODIS C6 product used for
verification was not widely used by ICAP models until early 2017, so what the DA models
assimilated during the study period (July 2016-June 2017) were mostly based on the MODIS C5
products. Second, as mentioned in section 2.1 the treatments applied to the MODIS observations
before AOD data assimilation are different among the members.
Verification with AOD products from other sensors was not included in this study because
available products either have much smaller daily global coverage, (for example, the Cloud-
Aerosol Lidar with Orthogonal Polarization (CALIOP) and the Multi-angle Imaging
SpectroRadiometer (MISR)), or are insufficiently characterized (e.g., Polar Multi-sensor Aerosol
Product (PMAp)). The verification using the DA-quality MODIS product provides
complementary spatial context to the AERONET comparison which is limited by the selective
placement of the AERONET sites (Shi et al. 2011b).
Root mean square error (RMSE) incorporates both bias and variance information, and was used
as a major metric for model validation in the first ICAP-MME paper (Sessions, et al., 2015). We
continue to use this metric in this updated study, but with more recent model data and with two

ICAP Aerosol Multi-Model Ensemble
15
more dust members. Other core verification metrics include mean error, mean absolute error, and
coefficient of determination (r2). Definitions of terms used in this paper are provided in
Appendix B.
Since the ICAP-MME is run daily at 00Z for forecast out to 5 days, validations of the so-called
“6-hr” or “72-hr forecasts” in this paper would be based on the forecast runs initialized at 00Z.
This notation is also used in forecast error estimates for forecasts with different forecast lengths.
Given AERONET and MODIS data are only available during local day-time, this corresponds to
6-24 hr of forecast time for any data day moving from the American continents, Atlantic, Europe
and Africa, to Asia and Pacific in sequence. This gives American continents a beneficial regional
verification bias, but we do not think this will impact any of our key results. This limitation is the
same as in Sessions et al. (2015). Also for historical technical reasons, ECMWF did not report an
analysis field of AOD at 00Z prior to January 2017. Thus, the 6-hr forecast valid at 00Z from all
models with AOD data assimilation is used to approximate their analysis AODs.
3. ICAP-MME performance for June 2016-May 2017
3.1 Verification with AERONET AOD
Tables 2 and 3 provide total AOD and dust RMSE of all models (individual models and MME)
from their 6-hr and 72-hr forecasts respectively at each AERONET site. Fig. 2 presents these
RMSEs and additionally RMSEs for the fine and coarse AODs against each site’s mean AOD.
RMSE values for the fine and coarse AODs can be found in the Table S1 and S2 respectively.
Similar to the earlier evaluation findings (Sessions et al., 2015) for total and coarse AODs, the
ICAP-MME RMSE is either the leader or the second best in RMSE in nearly all cases. For fine-
mode AOD, the ICAP-MME sometimes ranks third, however, the RMSE difference is less than

ICAP Aerosol Multi-Model Ensemble
16
0.02 for both the 6-hr and 72-hr forecasts compared to the top ranked models, except for the
Monterey site.
The MME dust forecast based on 7 dust members is not as skillful regarding ranking as in the
previous evaluation, where the 5 member dust ensemble ranked the 1st for almost all dust sites
and forecast hours in RMSE. But MME still ranks the 1st and 2nd for 6 out of 10 sites, and its
RMSE is very close to the top ranked models for sites where it ranks the 3rd or 4th place over the
other 4 sites (RMSE difference less than 0.02 for the 6-hr forecast and less than 0.04 for the 72-
hr forecast).
Based on the slope of the RMSE versus AOD value linear regression for each site in Fig. 2, the
RMSEs of ICAP-MME 6-hr forecast are approximately 50% of the yearly mean AOD value.
Dust AOD forecasting is better than the individual fine and coarse mode AOD components, with
its RMSE about one-third of the mean AOD. The RMSEs of the 72-hr forecast are about 10%
larger for the AODs in each size mode compared to the 6-hr forecast. These results are similar to
the previous findings for total, fine and coarse AODs (Sessions et al. 2015).
Overall, the models have reasonable correlation and consistency across the AERONET sites.
Capo Verde, a very widely used benchmark site for African dust, consistently has RMSE
approximately one-third of its annual mean for total and coarse-mode AOD, below the average
of 50% for all sites for the 6-hr forecasts. Sea salt aerosol particles can be a contributor to coarse-
mode AOD at this site, but dust is the dominant coarse-mode species. To allow for all ICAP
models to be verified, model dust AOD instead of coarse-mode AOD (only available from 4
models) is verified again AERONET coarse-mode AOD. There is generally good agreement on
dust and total AOD time series between observations and models (Fig. 3). Overall, the ICAP-

ICAP Aerosol Multi-Model Ensemble
17
MME has a relatively better combined RMSE, correlation and dynamic range of data (95, 90, 75,
50, 25, 10 and 5th percentiles of data) in dust, fine-mode and total AOD in both the 6-hr and 72-
hr forecasts compared to the individual models. Most background sites performed equally well,
except Monterey on the central coast of California, with RMSE values approximately twice the
mean AOD. Monterey, in normal years, is quite clean and has some of the best air quality in the
United States. However, the local Soberanes wild fire that occurred in July-October 2016 makes
2016 an unusual year. The biomass burning smoke inventories used by models may not provide
correct smoke fluxes, with large errors in both amplitude and pattern (e.g. Goodrick et al. 2013).
Also the site is influenced by the sea-breeze and other meso-scale systems, which may not be
well represented in the global models. As a result, the high smoke aerosol level and its large
spatial and temporal variability was a big challenge for all global aerosol models. As an outlier,
this site is excluded in the linear regression of RMSE against AOD in Fig. 2.
Different from the last evaluation, the remote oceanic site Crozet Island located in the “Roaring
Forties” (high wind area) of the Southern Ocean, is now replaced with Amsterdam Island, which
is just off the strong climatological wind belt in the Southern Indian Ocean. The performance of
the ICAP models over Amsterdam Island is similar to other background sites with no indication
of the significant overestimation of sea salt production that was found for Crozet Island in
Sessions et al. (2015). However, the ICAP MME mean sea salt AOD values over the Southern
Ocean between the recent years and earlier years (including 2012 when Sessions (2015)’s
evaluation was based) are comparable from the daily AOD distribution maps shown online.
These indicate that the ICAP models have problems specific to the high-wind, high sea-salt
production areas of the Southern Ocean, and suggest a requirement for better sea salt

ICAP Aerosol Multi-Model Ensemble
18
parameterizations and potential problems with the widely used exponential relationship between
surface wind and sea salt production in current aerosol models.
Also of note is the Beijing site for which the models continue to demonstrate poor forecasting
skill, with RMSE values for total AOD similar to the mean AOD. This is owing to the strong
inversions and complex secondary production processes that result in thick haze that frequent the
area (e.g., Guo et al., 2014; Zhang et al., 2014). However, the RMSE values at this site are
smaller than during the 2012 time period used in the first ICAP-MME paper (also see section 4).
The relatively poorer skill at fine-mode AOD compared to dust/coarse mode is the main
contributor to the overall large RMSE (Fig. 4). Fine mode AOD from AERONET exhibits great
temporal variability on day-to-week time scales. All the individual core models and the MME
have difficulty in capturing this large variability in fine-mode AOD. They tend to overestimate in
clean conditions and underestimate in highly polluted conditions. It is very common for global
aerosol models to yield a smaller range of AOD values compared to observations and fail to
capture the magnitude of big events (Kinne et al., 2006; Sessions et al., 2015). This may be due
to emissions or aerosol processes that are not fully understood or characterized. This behavior is
also expected mathematically based on the spatial scales of models and observations, but is
enhanced by other properties of models, for example, representations of surface gustiness,
orographic flows and other boundary layer processes relevant to aerosol sources and sinks. This
behavior can also be seen in global aerosol reanalysis products (Lynch et al., 2016; Randles et
al., 2017; Yumimoto et al., 2017).
All of the four core multi-species models have AOD data assimilation. However, even with DA
models did not appear to reproduce the high AODs above the 90th percentiles for Beijing. This is
because a) satellite retrievals are also challenged by the complicated aerosol and land
ICAP Aerosol Multi-Model Ensemble
19
environment over East Asia often flagging thick haze events as cloud, and b) variational data
assimilation can have difficulty spreading what little observational data is available, and
specifically reproducing strong gradients found near surface sources (Rubin et al., 2017). There
can be coexistence of dust and pollution particles of different sizes, sometimes the AOD is too
high for valid retrievals (Shi et al., 2015), and sometimes interaction and transport of aerosols
with cloud and/or fog prevents retrievals (Eck et al., 2018). A severe haze event that occurred on
October 13, 2016 is an example for which all the ICAP models failed to predict the high AOD.
As shown in the Terra MODIS true color image (Fig. 4i), heavy haze is covering northeast China
where Beijing is located. The haze was so thick that no valid AOD retrievals were available (Fig.
4j), possibly due to a combination of the low cloud masks, the upper limit of AOD retrieval at 5
and the inland water mask in the regular MODIS retrieval algorithm. A modified MODIS
retrieval algorithm targeting high AOD situations, is being developed and tested, shedding light
for improvement of satellite AOD product for cases like this (Shi et al., 2018). However it may
take time for the research algorithm to mature and be incorporated into the operational retrieval
algorithms for modeling purposes. Regardless, with current available retrieval products, the
nearest quality observations no doubt have lower AODs than the peak regions. Since total AOD
is the common variable being assimilated, there are no constraints on fine/coarse aerosol
partitioning or aerosol speciation. Even if the total AOD product is perfect in quality, the
resulting speciated AODs and modal AODs can be very different.
The bias of coarse-mode AOD or dust AOD is much smaller compared to the bias of fine-mode
AOD, and the range of dust AOD in MME is comparable to that of the observations. However,
correlations for dust AOD are low, suggesting the models have difficulty producing the timing of
dust events. Those factors combined result in poor verification scores for ICAP-MME over

ICAP Aerosol Multi-Model Ensemble
20
Beijing, although it still ranks the top among all models with respect to RMSE, correlations and
dynamic range of AODs. Improvements in data assimilation systems currently under
development (e.g., Rubin et al., 2017) show significant promise for improving aerosol prediction
in these conditions.
3.2 Verification with DA-quality MODIS AOD
In order to globally evaluate the performance of the ICAP models, total AOD at 550 nm from the
individual ICAP models and the MME are compared with the DA-quality MODIS C6 product.
The geographic distribution of MODIS DA-quality AOD averaged over the one year study
period is presented in Fig. 5, as well as the pairwise total AOD from the ICAP-MME. The global
distribution of the total number of 6-hourly 1°x1° MODIS observations is also shown. The DA-
quality product includes albedo filtering based on MODIS 16-day surface albedo/Bidirectional
Reflectance distribution function (BRDF) product (MCD43C3; Schaaf et al., 2002), excluding
areas with low signal-to-noise as diagnosed using a 10+ year dataset comparing AERONET and
MODIS (Hyer et al., 2011). Coverage over bright areas is improved by using MODIS Deep Blue
retrievals, but many bright surfaces are still excluded in the DA-quality product. Areas with high
cloud coverage, including the ITCZ, the Maritime Continent and the subtropical stratus cloud
deck regions, have relatively less data. Cloudy conditions, problems retrieving over snow, and
polar night limit retrievals of AOD at high northern latitudes. Over the Southern Ocean, MODIS
AOD retrievals exhibit an anomaly which has been shown to be partially but not entirely
attributable to undetected cloud (Toth et al., 2013; Christensen et al., 2015); because of this,
retrievals south of 40°S are excluded from this analysis.

ICAP Aerosol Multi-Model Ensemble
21
The global distribution of mean total AOD from the ICAP-MME looks similar to that of the DA-
quality MODIS AOD. Prominent high AOD features exist over dust-influenced regions,
including north Africa, Sahel, Arabian Peninsula and central Asia; biomass-burning-dominated
central and South Africa, South America, Peninsular Southeast Asia and Siberia; and East Asia
and India, which are impacted year round by pollution and seasonally by dust and biomass
burning. There are also areas of significant disagreement between the MODIS C6 DA-quality
dataset and the ICAP-MME. For example, ICAP-MME total AOD is lower over East Asia, India
and Siberia, and higher over central Asia, Arabian Peninsula, indicating biases relative to
MODIS C6 (also Fig. 7). ICAP-MME is also relatively high over the western U.S., which may
reflect differences between MODIS Collection 5 AOD assimilated into the ICAP models and
Collection 6 MODIS AOD used for this comparison (see e.g. Levy et al. 2013; Sayer et al.,
2014). The Collection 6 MODIS Deep Blue products also have a documented problem with
elevated terrain that can be seen as a low bias in MODIS AOD over Iran and other elevated areas
in Asia and North America. This problem is corrected in the newer Collection 6.1 version
(https://modis-
atmosphere.gsfc.nasa.gov/sites/default/files/ModAtmo/modis_deep_blue_c61_changes2.pdf),
but the newer data were not available in time to use in this study.
Fig. 6 shows global distributions of interquartile values (median, 25th and 75th percentiles) of
the MODIS DA-quality AOD for the one year study period, and ratios of the same quantities
from the 6-hr and 72-hr forecasts of the ICAP-MME to the MODIS AOD. “Analysis mode” and
“forecast mode” refer to the 6-hr forecasts and 72-hr forecasts from now on. The median of
MODIS AOD is very similar to the mean (Fig. 5b) except over Siberia, where the mean is much
higher than the median, likely because the sample size is relatively small (less than 60) and the

ICAP Aerosol Multi-Model Ensemble
22
mean is dominated by some high AOD observations associated with large biomass burning
events. Similarly, the ICAP-MME median looks very much like the mean except over Siberia
(not shown). Consistent with the aforementioned bias analysis, the ICAP-MME median AOD is
higher than MODIS over central Asia and the western U.S., and lower over East Asia, India and
Siberia. There is a very clear tendency for the ICAP-MME to be lower than MODIS in the 75th
percentile AOD over the globe, except for the high-biased regions. The higher AOD in these
regions could be a result of differences between the satellite data assimilated into the model and
the verification dataset, as discussed above. In the 25th percentile AOD, the ICAP-MME is
generally higher than MODIS except in low-biased regions. These results are approximately true
for both the analysis and the forecast modes, except that the biased regions tend to be slightly
more biased in the forecast mode. Similar patterns are seen for all of the individual models (Fig.
S3). This means that, in general, the ICAP-MME and all the contributing global models tend to
overestimate in clean conditions and underestimate in severe aerosol conditions. This result is
consistent with the validation with AERONET in Section 3.1 and other global aerosol modeling
studies (e.g., Kinne et al., 2006; Sessions et al., 2015; Lynch et al., 2016). Fig. 7 shows global
distributions of biases, RMSEs, and the coefficients of determination of the four core models and
ICAP-MME for their analysis mode (from 6-hr forecast). The validation patterns for the forecast
mode (72-hr forecast) look similar; except that biases and RMSEs are slightly larger and the
correlations are slightly lower (Fig. S2). There are consistent low biases across the models over
Siberia and India, especially the southern foothill of the Himalayas, most likely resulting from
under-prediction of smoke over Siberia and anthropogenic and biogenic aerosols over India in
the models. Consistent high biases are found over central and East Asia dust-dominant regions.
Other regions tend to have mixed results. It is also noted that Model 1 has a slight high bias over

ICAP Aerosol Multi-Model Ensemble
23
the entire globe, much of which disappears over water in the forecast mode (Fig. S2). This
implies that the AOD observations assimilated into Model 1 were slightly higher than the DA-
quality MODIS C6 product used here.
RMSEs are commonly higher over the biased regions, which are often the climatologically high
AOD regions. Correlations are high over the oceanic areas where large-scale transport of dust,
smoke and pollutions occur downwind of its continental sources. Over land, r2 is relatively lower
overall because land is the main source of aerosols studied here except sea salt, and there are
much larger uncertainties and stronger gradients due to local aerosol sources than large-scale
transport events in aerosol modeling. AOD data assimilation helps improve r2 over land, but it
helps more over ocean, because of longer transport times as well as the higher signal/noise ratio
of AOD retrieval over ocean (e.g., Levy, et al., 2005). High overland r2 occurs over the pure (not
mixed with other aerosol species) biomass-burning dominant regions, including South Africa,
South America, Southeast Asia and the boreal burning regions, resulting from the fact that all
ICAP models (see Table 1) use smoke emission inventories based on satellite observations which
are updated in near real time. Other sources, including dust and sea salt emissions, are generally
parameterized based on limited field measurements. Emissions for anthropogenic and biogenic
sources have even more degrees of freedom for uncertainty given their complex chemistry and
interactions with meteorology. Thus correlations are low in these source regions. Because of
small dynamic ranges of AOD in the most remote regions, correlations are also low in areas far
from aerosol sources or transport paths, e.g., subtropical Pacific and Indian oceans,.
Consistent with the validation result against AERONET, the ICAP-MME performs the best
among all the ICAP full-species models verified with the DA-quality MODIS total AOD. The
ICAP-MME global mean absolute error and RMSE are the smallest, with similar magnitude to

ICAP Aerosol Multi-Model Ensemble
24
these of the individual models. Correlation of ICAP-MME is significantly higher than individual
models, with global mean r2 higher than individual models for both the analysis and forecast
modes. The r2 increases from 0.42 on average for individual models to 0.53 for the MME in the
analysis mode. In the forecast mode, the single-model r2 averages 0.26 versus 0.35 for the MME.
This can be related to situations in which the MME captures events missed in some models but
captured by other models. As expected, the performance of all models is worse in their forecast
modes (Fig. S2) as they move away from the time of data assimilation. Overall, with some
exceptions, the ICAP core models have similar performance regionally and globally, with small
divergence among the models for both the analysis and the forecast modes, despite great
diversity among systems. The consistently challenging regions across the ICAP models are dusty
regions over land and regions with two or more dominant species. These include India and East
Asia, influenced by pollution and dust, and the Sahel, influenced by dust and biomass burning
smoke.
4. Ensemble mean and spread of ICAP models and potential for probabilistic prediction
One of the goals of ICAP is to advance probabilistic aerosol forecasting, which provides aerosol
forecasts with associated uncertainties. This is an advantage over deterministic forecasts,
especially for severe events, in that the predictions have an associated confidence level. It is
analogous to NWP and TC ensemble predictions, where severe precipitation or temperature
events or TCs are predicted with certain possibility levels of hit or miss for a location. If
predictions from all individual models converge, this indicates a prediction with high confidence
or high possibility. This probabilistic prediction facilitates better decisions in preparation for
such severe weather events. Similarly, probabilistic predictions for severe aerosol events, e.g.,
pollution, dust and biomass burning smoke events, are desired, motivating both single and multi-

ICAP Aerosol Multi-Model Ensemble
25
model aerosol ensembles. The utility of the ensemble systems for such a purpose will be
evaluated. AOD verification against observations in Section 3 shows the ICAP-MME consensus
and diversity of model performance in analysis and forecast modes. In order to make use of the
information for probabilistic prediction, it is necessary to quantify the mean and spread of the
models and evaluate the usefulness of these variables for forecast uncertainty estimates. As
defined above, ensemble mean is the unweighted arithmetic mean of ensemble members, and
ensemble spread is estimated using the standard deviation of ensemble members.
4.1 Ensemble mean and spread of the ICAP models in analysis and forecast modes
Fig. 8 presents the global distributions of yearly average ICAP ensemble mean and ensemble
spread of total, fine and coarse-mode AODs for the analysis mode and the differences between
the forecast and analysis modes. As expected, ensemble spread tends to be large over high AOD
regions and small over low AOD regions. This is true for both the fine and coarse modes and the
total AOD. However, different behavior is observed in India, where the mean fine and total
AODs are comparable to those over East Asia and southern Africa, but the ensemble spreads are
much smaller. This could be a result of consistent low bias (as shown in Fig. 6 and 7) and less
variability over India across the ICAP models. The impact on the capability of ICAP-MME for
regional probabilistic predictions will be discussed in section 4.2. Compared to the analysis
mode, the total AOD ensemble mean for the forecast mode is smaller overall, mainly attributed
to smaller fine-mode AOD (about 10% decrease). The observed ensemble mean decrease in the
forecast mode occurs over biomass-burning impacted regions including South America, Sahel,
South Africa, the Maritime Continent, Siberia, and the heavily polluted North India, suggesting
insufficient emissions in the forecast mode. There are slight increases over North Africa,
Australia and Arabian Peninsula, and slight decrease over subtropical north Atlantic in coarse-

ICAP Aerosol Multi-Model Ensemble
26
mode AOD in the forecast mode, suggesting possible overestimation of dust emission overall
and excessive removal over water.
The ensemble spread is generally larger for the forecast modes compared to the analysis modes,
in which AOD is constrained by data assimilation in varying degrees in these models. Some
deviations include the western United States, the Andes of South America and the Maritime
continent for total and fine-mode AODs, where ensemble spread is smaller in the forecast mode
than the analysis mode. This could be attributed to the diversities of the AOD data and/or the
pre-treatment of these data that were assimilated into these models in the analysis mode. After
all, large differences are found in satellite AOD products over these mountainous regions
because of different capabilities of dealing with high-reflective and varying surface conditions in
retrieval algorithms (Shi et al., 2011; Loria-Salazar et al., 2016). An additional contributor could
be divergence in model meteorological variables that impact aerosol processes. For example,
precipitation, controlling aerosol wet removal, can be more divergent in the analysis mode than
the forecast mode in the NWP models, given the differences between satellite precipitation
products assimilated and NWP models (Ebert et al., 2007). By using satellite derived versus
model precipitation in an aerosol modeling study, Xian et al. (2009) found significant difference
in AOD levels over many regions, including Andes and Maritime continent. The ensemble
spread of fine-mode AOD is also smaller in the forecast mode than the analysis mode over
remote oceanic areas, which is associated with slightly smaller ensemble mean total/fine AOD.
This is because one of the four data assimilation models has slightly higher background AOD
over ocean in its analysis mode, but similar background AOD in the forecast mode when
compared to the other models. This is consistent with the comparison to the MODIS DA-quality
product shown in Section. 3.2 (Fig. 7 and S3).

ICAP Aerosol Multi-Model Ensemble
27
Fig. 9 shows global distributions of yearly average ICAP ensemble mean and ensemble spread of
dust AOD from the DA models at their analysis mode and the differences from their forecast
mode, and the differences from all models at the analysis and forecast modes. Error growth from
analysis to forecast mode is a function of NWP forecast errors, errors in prediction of sources
and sinks, and relaxation from aerosol analysis state (for models with aerosol data assimilation).
Models without aerosol data assimilation are evaluated here together with the DA models at 6-hr
forecasts for probabilistic forecast purposes. The dust AOD ensemble mean based on the 5 DA
models at the analysis mode (Fig. 9a), shows the main dust active regions including North
Africa, Arabian Peninsula, central Asia, south Asia, Australia, western U.S.A., and southwest
South America and their downwind regions. As expected, high dust AOD regions also exhibit
high ensemble spread. The general tendency for all models at both their analysis and forecast
modes and the DA models at their forecast mode to have higher dust AOD over North Africa and
Arabian Peninsula, and lower dust AOD over South Asia, suggest possible excessive emission
over North Africa and Arabian Peninsula, and insufficient emission over South Asia. There is
also a tendency of lower dust AOD in the forecast modes over the subtropical Atlantic, which is
the long-range transport region of African dust, indicating excessive removal of dust over water
in the models.
Since AOD is constrained with satellite retrieved AOD at the analysis time in DA models,
ensemble spread of the DA models in the analysis mode is reduced overall compared to all
models and their forecast modes (Fig. 9d,f,h). The spread of the DA models is discernably
reduced more over water than over land in the analysis mode. This is because satellite AOD
products have much larger uncertainties over land than over water (e.g., Levy et al., 2013; Zhang
et al., 2008; Hyer et al., 2011). Moreover, there is much less DA-quality AOD data over bright

ICAP Aerosol Multi-Model Ensemble
28
desert for models to assimilate (e.g., Fig. 5c). Although some models assimilate satellite AOD
products with coverage over desert, others using different AOD products or with very strict
QA/QC processes may not have much data to assimilate over some desert areas. Also notable is
the small difference in ensemble spread over East and South Asia dust areas for the DA and all
models, and for analysis and forecast modes. This reflects the challenge of dust modeling and
AOD retrieval in this complicated aerosol environment, in which dust and various kinds of
pollutions are mixed, and complex chemistry of precursors and secondary organic aerosols
convolve with meteorology (e.g., Zhang et al., 2014).
4.2 Estimation of ICAP-MME absolute forecast error
In order to evaluate the usefulness of ICAP-MME for probabilistic forecasts, we first explore the
relationships between the possible predictors and the ICAP-MME absolute AOD forecast errors.
The predictors examined include ensemble mean, ensemble spread and forecast AOD change
(defined as the forecasted change of AOD in 24 hours). Linear correlations between ensemble
mean and error, ensemble spread and error, and forecast AOD change and error are calculated
for modal AODs and dust AOD respectively. Some statistically significant correlations for the
dominant aerosol modes are found over most of the selected 21 AERONET sites for the 6-hr and
the 72-hr forecasts (coefficients of determination for the 72-hr forecasts are shown in Table S2,
and those for the 6-hr forecasts are similar). In general, correlations between ensemble mean and
forecast error are slightly higher than correlations between ensemble spread and forecast error.
However, weak or insignificant correlations are found between forecast AOD change and
absolute forecast error for the 6-hr and 72-hr forecasts (not shown).

ICAP Aerosol Multi-Model Ensemble
29
For dust AOD, ensemble mean and spread show statistically significant correlations with
consensus forecast error over most of the dust sites for both the 6-hr and the 72-hr forecasts
(Table 4). No correlation or low correlation is found over Gandhi College, Kanpur and Yonsei
University sites, indicating ensemble mean and spread have little or limited skill in ensemble
mean error estimates for these sites. However, it is also noted that for Gandhi College, most
available AERONET observations coincide with periods of calm winds and minimal dust
production, and strong dust events reflected in the ICAP-MME cannot be verified with
AERONET (not shown). Similarly, there is no correlation between ensemble mean/spread and
forecast error over Gandhi College and Kanpur for total and fine-mode AODs (Table S3), mostly
due to the consistent low biases and small ensemble spread among the models.
It is also found that, for all sites, coefficient of determinations (r2) between the ensemble mean
and spread are high, on the order of r2=0.4 -0.9 for total, fine and coarse AOD forecasts (Table
S1) and on the similar order for dust AOD forecasts. This is consistent with Fig. 8 and 9.
Our analysis shows that forecast error is correlated slightly more with ensemble mean than
ensemble spread in the ICAP MME aerosol forecasts. This indicates large room for improvement
in global aerosol modelling, and before these models reach maturity other factors may also play a
role in ensemble error estimates. We expect that with continuous development of individual
models, the ensemble spread will carry more weight in the error forecast model, as is seen in the
evolution of error forecast model for tropical cyclone (TC) track and intensity ensemble forecasts
for the past decade.
Following the studies on prediction of consensus TC track and intensity forecast errors (Georss,
2006; Georss and Sampson, 2013), we regress absolute AOD forecast error on the related

ICAP Aerosol Multi-Model Ensemble
30
predictors, including ensemble mean and ensemble spread, and derive regression models for
ICAP consensus forecast error based on all available model and AERONET data from the 21
representative sites for total AOD (Table 5) and the 10 dusty sites for dust AOD (Table 6). For
the total AOD forecast, ensemble mean is found to be the leading predictor, with r2 ranging from
0.27 to 0.22 monotonically corresponding to forecast lengths of 6-hr, 24-hr, 48-hr, 76-hr and 96-
hr. Ensemble spread is the second predictor, with r2 varying between 0.16 and 0.22 for forecasts
with the same forecast lengths. The forecast error prediction based on multivariate linear
regressions of both ensemble mean and spread yields the best correlation with forecast error. The
addition of ensemble spread adds only a small skill improvement on top of the ensemble mean to
the forecast error estimate though.
Similar regression result is found for dust AOD forecast error, in which ensemble mean is the
leading predictor. The forecast error prediction based on multivariate regressions of both the
ensemble mean and spread again yields the best correlations for 6-hr to 96-hr forecasts although
linear regression based on solely ensemble mean yield the same correlations for some forecast
lengths. Comparisons of predicted total/dust AOD errors using the multivariate regression
models and the ICAP-MME forecast error for the 72-hr forecasts are shown in Fig. 10 as an
example. Time series of error estimates of dust AOD at a relatively skillful site, Capo Verde, and
total AOD at a less skillful site, Beijing, are given in Fig. 11. There are times that absolute errors
are much larger than those predicted. These points correspond to the cases that all models are
consistently low biased and with small spreads. These common issues warrant model
improvements, but the results here demonstrate the potentials of such error regression models for
applications in probabilistic AOD forecasts.

ICAP Aerosol Multi-Model Ensemble
31
The correlation relation between AOD absolute forecast error and ensemble mean/spread shows
strong regional differences, which might be relevant to model skill in resolving different
dominant species (e.g., dust, smoke and pollution haze) and/or regional meteorology that impacts
aerosol processes. Similar error forecast models can also be developed for individual regionally-
representative sites or regions and for different size-modes (fine vs coarse) for potential
applications in the future. Each individual model’s contribution to the ICAP-MME is evaluated
by removing one model from the MME and quantifying changes in the one-year mean absolute
forecast error. The results are mixed for different models and different sites for dust AOD
forecasts (Table 7). The percentage changes for all sites are averaged in order to give an overall
evaluation. For dust AOD forecasts, the mean absolute forecast errors (AFE) increase about 5%
with removal of Model 5 and 7 (slight more error increase), and about 2-3% with removal of
Model 2 for the 6-hr and 72-hr forecasts, suggesting that these three models are contributing
positively to the consensus mean. However the mean AFE decreases 6%/2% for the 6-hr/72-hr
forecast, with removal of Model 6, suggesting the model is contributing slightly negatively to the
consensus mean. The other three models have mixed result: AFE slightly increases for one
(analysis or forecast) mode and slightly decreases for the other mode, or with AFE unchanged,
indicating their contributions to the MME are approximately neutral. Similar evaluations are
done for the total, fine-mode and coarse-mode AOD forecasts with removal of one of the four
full-species models. It is found that all the four core models contribute positively to the ICAP-
MME total AOD forecasts, with a 2%-3% average (of all 21 AERONET sites) reduction in
RMSE from removing each of the four models in the 6-hr and 72-hr forecasts (Table S4).
However, for the MME fine-mode AOD forecasts, Model 1 contributes negatively most likely
due to its slightly high bias over relatively clean regions (see also Fig. 7), while the other three

ICAP Aerosol Multi-Model Ensemble
32
models contribute positively (Table S5). For the MME coarse-mode AOD forecasts,
contributions are positive from Model 2 and Model 3, neutral from Model 1 and slightly negative
from Model 4 (Table S6). These results suggest that the full-species models perform similarly in
terms of total AOD in general, but their performances in terms of fine- and coarse-mode AODs
are different. This also reflects the fact that data assimilation of total AOD can help constrain
total AOD, but it does not constrain contributions from different aerosol species. We
acknowledge that this evaluation of each individual model’s contribution to the MME is quite
arbitrary, yet it reflects the complex impact on the MME performance of adding more
independent ensemble members. With rapid evolution in the individual member models these
numbers are expected to change.
5. Evolution of ICAP-MME performance over 2012-2017
Since its initial operation in 2011, ICAP-MME has incorporated a few more deterministic global
aerosol models (Fig. 1), and numerous updates have been implemented on individual models by
the contributing centers. Those updates include adding new species, e.g., organic aerosols and
nitrate aerosols, and expanding from a single dust species to a multi-bin dust representation, as
well as updates of aerosol processes, e.g., inventories for emissions and parameterizations for
removals. Regarding aerosol data assimilation, updates include new and improved AOD
products for DA and/or changes in their treatments prior to DA, or even major changes from no
DA to DA. Furthermore, the underlying NWP models from all of these centers have also seen
updates, ranging from finer spatial and temporal resolution, better physics and dynamics, to
additional observational data and advanced methodologies for DA. Whether these updates
improved the ICAP-MME performance over the years is examined here.

ICAP Aerosol Multi-Model Ensemble
33
Fig. 12 illustrates the evolution of ICAP-MME performance in terms of 550 nm total AOD
RMSE at all the selected AERONET sites for the 6-hr forecasts. The evolution of ICAP-MME
performance in terms of fine-mode and coarse-mode AOD RMSEs are provided in Figures S3
and S4, respectively. Interannual variability in the performance of MME is noted for many sites,
Singapore and Monterey being the most obvious two with extremely large variability within the
2012 to 2017 study period. Consistent with the result of Sessions et al., (2015) and Fig. 2, the
RMSE generally increases with AOD. The anomalously high RMSEs in 2015 and 2016 for the
two sites, respectively, are associated with high fine-mode AODs and high variability resulting
from severe wild fire conditions. Singapore was impacted by the particularly strong and wide-
spread biomass burning events across the Maritime Continent in 2015 due to a strong El Nino
(Fanin and van der Werf, 2017; Huijnen et al., 2016; Tacconi, 2016). Whereas Monterey,
California, which is typically pristinely clean, was influenced from time to time by smoke from
wild fires lasting over two months in the nearby area in its dry season in 2016. As mentioned
earlier and in other studies (Kinne et al., 2006), global models tend to underestimate extremely
high AOD events, which leads to anomalously high RMSE in unusual years. A similar
performance pattern is found for 72-hr forecasts, except for slightly higher RMSEs (not shown).
A significant decreasing trend in RMSE is present for Beijing, where ICAP-MME RMSE is
reduced by half from 2012 to 2017 (from 0.64 to 0.30). This RMSE decrease is associated with
decreases in the yearly means of total AOD observed by AERONET over Beijing for the study
period. The decrease in total AOD is consistent with reported negative trends found in other
studies using satellite AOD retrievals over East Asia (Zhang et al., 2017). The main contributor
to the total AOD decrease is the decrease in fine-mode AOD with similar magnitude, with only a
very slight decrease in dust levels over the years (Fig. 13 and Fig. S3, S4). Time evolution of the
ICAP Aerosol Multi-Model Ensemble
34
fine-mode AOD RMSEs from the four core models and the ICAP-MME show that all the ICAP
models have decreasing trends of varying magnitude in fine-mode AOD RMSE over Beijing
(Fig. 13).
There are no significant changes in mean dust levels and variance over Beijing. However,
performance of all the individual models in terms of dust forecast is more divergent among the
models and over the years. ICAP-MME dust AOD RMSE is not always the lowest, but is
relatively stable compared to individual models over the years. This is one of the benefits of
multi-model ensembles. A similar conclusion can also be made with respect to regional
performances. Individual models perform differently regionally. One model may perform better
in some regions, but worse in other regions compared to other models. But ICAP-MME has
more stable performance across all regions.
There is a tendency for smaller RMSE, especially in fine-mode AOD, over other Asian sites as
well. Small decreasing trends in RMSE of total and fine-mode AOD are discernable for Kanpur
and Gandhi College, the two Indian sites (Fig. 12 and Fig. S4). Different from Beijing, there is
no clear trend in the yearly mean total and fine AODs and their standard deviations, suggesting
the decreasing trend is a result of model improvements, especially in fine-mode AOD forecasts,
over the region from 2012 to 2017 (Fig. 13). Yonsei University, Korea, and Chiang Mai Met
Station, Thai, also show decreased fine-mode AOD RMSEs without significant decreases in their
annual mean fine-mode AODs (Fig. S4), indicating model improvements in fine-mode AOD
forecasts over the years. It is known that some models incorporated organic aerosols and/or
nitrate aerosols in the fine-mode, and updated emission inventories, which would improve the
low bias over India, East and Southeast Asia, where severe anthropogenic pollutions often occur.
Additionally, one of the four core models (other three had DA since ICAP inception)

ICAP Aerosol Multi-Model Ensemble
35
incorporated AOD data assimilation in the middle of 2016, which may have also contributed to
the RMSE improvement in the recent two years.
No significant trends in ICAP-MME performance in terms of total AOD RMSE are found for
other sites. Biomass burning and dust impacted sites tend to have large interannual variabilities
in terms of AOD RMSE, mean and standard deviation because of the nature of these events. This
may have blocked weak signals of model improvement if there are any. It is difficult to detect
RMSE trends at background sites due to a small average and range of AOD.
Finally, the rankings of ICAP-MME among all the models in terms of total AOD RMSE of the
6-hr and the 72-hr forecasts for all the sites over 2012-2017 is shown in Fig. 14. As expected,
ICAP-MME is either the 1st or 2nd place for most sites and years for both the analysis and
forecast modes, indicating MME performance is good and stable over the years. Individual
models could rank 1st for some sites/regions and years, but none of the individual models have
high and stable rankings like the MME over time (Fig. S6). This is understandable as global
operational aerosol models evolve quickly and the dynamic nature of significant aerosol events,
such as related to large wildfire outbreaks or heavy dust seasons. When there is a model upgrade,
there is usually abrupt performance change associated with it. An upgrade can impact some
regions more than other regions or some aerosol species more than other species. Sometimes it
may not be model upgrade, but just model physics that can result in a good simulation for one
scenario but bad simulation on another. In the long run, the MME wins due to its averaging
nature. Similar behavior of multi-model ensembles is also observed in the Tropical cyclone track
and intensity forecasts where consensus prediction wins over individual models over a longer
time span (e.g., DeMaria et al., 2014). This is also why a consensus mean, i.e., even-weighting
for all the participating models, is adopted in the ICAP-MME.
ICAP Aerosol Multi-Model Ensemble
36
6. Discussions and conclusions
This paper provides an update on the International Cooperative for Aerosol Prediction (ICAP)
global operational aerosol multi-model ensemble (MME) AOD consensus product. Compared to
the first ICAP-MME analysis (Sessions et al., 2015), the multi-species models are still the four
models: ECMWF CAMS, JMA MASINGAR, NASA GEOS-5, NRL NAAPS, while the dust
models have expanded from the original five (aforementioned four, plus NOAA NGAC) to
include additional BSC MONARCH and UKMO unified dust model, making seven dust models
in total in this study. The newer ICAP members, namely NOAA full-species NGAC, Meteo
France MOCAGE and FMI SILAM, are not included in this study because of shorter data
records. A recent full year of data, from 1 June 2016 to 31 May 2017, is used for detailed ICAP-
MME performance statistics compared to observations and to evaluate the usefulness of ICAP-
MME for probabilistic forecasts. The evolution of the ICAP-MME performance during 2012-
2017 is also examined. We expect rapid evolution in the individual member models based on the
results shown here and similar exercises with ICAP-MME products. So the error metrics may be
out of date for the better by the time this article is published. The current state of the ICAP-
MME, and the similarities and differences between these findings and the initial ICAP-MME
evaluation made with the first year of ICAP data, which was five years older (Sessions et al.,
2015), are documented by our results, along with the usefulness of the ICAP-MME for aerosol
probabilistic forecast. The main conclusions from this analysis are listed here as follows:
1. ICAP-MME ranks 1st overall among all individual models in terms of overall RMSE,
coefficient of determination (r2), and bias for both analysis and forecast modes for total,
fine and coarse and dust AOD based on verifications against AERONET Version 3 L1.5

ICAP Aerosol Multi-Model Ensemble
37
observational data and DA quality MODIS C6 product. This result is similar to the first
ICAP-MME evaluation by Sessions et al. (2015).
2. In general, the AOD spread of models with data assimilation at their analysis mode is
smaller than the AOD spread of all models at their analysis mode, which is smaller than
the spread of all models at their forecast mode. This is true for total, fine, coarse and dust
AODs over the globe, except over India and dusty East Asia region, where global models
have common low biases and small spread for cases of heavy regional pollution and
sometimes mixed dust. These regions remain a challenge for global models, although
model skills at AOD forecasts for these regions have been improved in the past five years
(see conclusion #4).
3. ICAP-MME ensemble mean and spread have skills for predicting absolute AOD forecast
error globally, except for over India, where they have little correlation with forecast error.
Multivariate regression models of absolute forecast error are derived based on both
ensemble mean and spread for total and dust AOD forecasts at different forecast lengths.
These regression models can potentially be applied for probabilistic AOD forecasts.
4. ICAP-MME performance in terms of modal AOD RMSEs of the investigated 21 regional
representative sites over 2012-2017 shows a general tendency for model improvements in
fine-mode AOD, especially over Asia. No significant improvement in coarse-mode AOD
was found overall. Interannual variability in regions influenced by biomass burning
smoke and dust may obscure small signals of potential model improvement.
5. ICAP-MME performance is stable and reliable over the years compared to individual
models. AOD RMSE of the ICAP-MME is not always the lowest for a given species, site
or year, but it is relatively low and stable. Individual models may perform better in some

ICAP Aerosol Multi-Model Ensemble
38
regions/years/scenarios and worse in others and may experience abrupt performance
changes associated with upgrades. Consensus MME wins in the long run because of its
averaging nature of independent models.
Individual contributing centers have their own plans for future aerosol model developments, with
the development focus depending on their customer needs and current model status. These plans
may include addition of aerosol species, update of emission inventories, addition/update of
aerosol data assimilation, increased model resolution, improved parameterization of physical,
chemical and/or optical properties and processes. These future plans also stress requirements for
aerosol observations in the context of the operational activities carried out at various centers
(Benedetti et al., 2017).
Currently the ICAP-MME products and the evaluations of ICAP-MME performance are based
on speciated or modal AODs because AOD has the most abundant observations and global
coverage and it provides a big picture of column total amount of aerosols. The next big move for
the ICAP MME is towards surface PM2.5 (Particulate Matter with aerodynamic diameter less
than 2.5 µm) and PM10 (Particulate Matter with aerodynamic diameter less than 10 µm)
ensembles. Data collected from global observational networks for these properties will be used
for evaluations. The evaluations of these new ensemble properties would help the operational
aerosol communities to identify issues relevant to surface/lower boundary layer properties and
lead to potential improvements. In the future, aerosol vertical distributions can also be
investigated through the ICAP-MME framework.
Data Availability:
The ICAP-MME modal and dust AOD product is available

ICAP Aerosol Multi-Model Ensemble
39
http://usgodae.org/cgi-bin/datalist.pl?dset=nrl_icap_mme&summary=Go
The MODIS data-assimilation quality gridded AOD product, used for global-scale verification of
ICAP-MME, is available in near real-time from NASA
LANCE: http://dx.doi.org/10.5067/MODIS/MCDAODHD.NRT.006.
Acknowledgement:
The authors are greatly indebted to their individual programs for supporting ICAP and the
development of the multi-model ensemble. We recognize and appreciate the countless
researchers and computer engineers whose work supports the development and distribution of
aerosol forecasts. As data assimilation is key to model performance, we are grateful to NASA
LANCE-MODIS for providing MODIS near-real-time data used in nearly all of the models here.
We also acknowledge the effort of the NASA GSFC AERONET team (project leader Brent
Holben) and the various site principal investigators and site managers of the numerous
AERONET sites utilized in this study. Funding for the development of the construction of ICAP-
MME was provided by the Office of Naval Research, Code 322. ECMWF/CAMS contributions
were provided by the Copernicus Atmosphere Monitoring Service, operated by ECMWF on
behalf of the European Commission (EC) based on the work of the EC-funded MACC projects.
MASINGAR is developed in the Meteorological Research Institute of Japan Meteorological
Agency, and a part of the development was funded by the Environmental Research and
Technology Development Fund (B-1202) of the Ministry of the Environment (MOE) of Japan.
NAAPS development is supported by the Office of Naval Research Code 322. GEOS-5
development is supported by the NASA Modeling, Analysis, and Prediction program, and
simulations are carried out at the NASA Center for Climate Simulation (NCCS). NGAC

ICAP Aerosol Multi-Model Ensemble
40
development has been supported by Joint Center for Satellite Data Assimilation, NOAA
Modeling, Analysis, Prediction, and Projections program and National Weather Service.
MONARCH development is supported by the Spanish Government. Development of the Met
Office Unified Model is funded by a combination of the UK Public Weather Service and the
Hadley Centre Climate Program supported by the Department of Business, Energy and Industrial
Strategy (BEIS) and the Department for Environment, Food and Rural Affairs (Defra).
MOCAGE development is supported by Centre National de Recherches Météorologiques
(CNRM-GAME) of Météo-France and Centre National de la Recherche Scientifique (CNRS).
Global SILAM version was developed under ASTREX, APTA, and GLORIA projects of
Academy of Finland; the fire emission system was developed within the Academy IS4FIRES
project.
Appendix A: Member model descriptions
A1. BSC MONARCH
The Multiscale Online Nonhydrostatic AtmospheRe CHemistry model (NMMB-MONARCH
v1.0; Pérez et al., 2011; Haustein et al. 2012; Jorba et al., 2012; Spada et al., 2013; Badia et al.,
2017), formerly known as NMMB/BSC-CTM, is a fully online integrated system for meso- to
global-scale applications developed at the Barcelona Supercomputing Center (BSC). The model
provides operational regional mineral dust forecasts for the World Meteorological Organization
(WMO; https://dust.aemet.es/), and participates to the WMO Sand and Dust Storm Warning
Advisory and Assessment System for Northern Africa-Middle East-Europe (http://sds-
was.aemet.es/). Since 2012, the system contributes with global mineral dust and sea salt aerosol
forecast to the multi model ensemble of ICAP at a resolution of 1.4º x 1º on 24 hybrid sigma-

ICAP Aerosol Multi-Model Ensemble
41
pressure levels. NMMB-MONARCH v1.0 has been enhanced with a new hybrid sectional-bulk
multicomponent mass-based aerosol module (Spada, 2015). The aerosol module is designed to
provide short and medium range forecast of the atmospheric aerosols for a wide range of scales,
with the option to adjust the complexity of the chemistry scheme as desired. The module
describes the lifetime of dust, sea-salt, black carbon, organic matter (both primary and
secondary), sulfate and nitrate aerosols. While a sectional approach is used for dust and sea-salt,
a bulk description of the other aerosol species is adopted. The CB05 chemical mechanism
(Yarwood, 2005) can be selected to solve the gas-phase chemistry or, alternatively, climatologies
of the most important oxidants are used for simplified global aerosol runs and forecast. A
simplified gas-aqueous-aerosol mechanism has been introduced in the module to account for the
sulfur chemistry and a two-product scheme is used for the formation of secondary organic
aerosols (Spada, 2015). An upgrade of the NMMB-MONARCH v1.0 ICAP aerosol forecast is
planned for mid-2018. The system will provide forecast of mineral dust, sea salt, carbonaceous
aerosols and sulfate at a resolution of 0.7º x 0.5º on 48 hybrid sigma-pressure levels. Global
anthropogenic emissions from the AEROCOM-HTAP v2 dataset (Janssens-Maenhour et al.,
2015) together with online MEGAN biogenic emissions (Guenther et al., 2016), and GFAS v1.2
biomass-burning analysis (Kaiser et al., 2012) will be used. Additionally, an aerosol data
assimilation capability has been recently implemented in NMMB-MONARCH v1.0 (Di Tomaso
et al., 2017). An ensemble-based data assimilation scheme (namely the local ensemble transform
Kalman filter – LETKF) will be utilized in the near future to optimally combine model ensemble
forecasts and observations, using a perturbed physics ensemble of NMMB-MONARCH v1.0.
Results assimilating mineral dust optical depth derived from satellite retrievals (MODIS AOD
Dark Target and Deep Blue) show a significant improvement of the forecast of mineral dust.
ICAP Aerosol Multi-Model Ensemble
42
A2. Copernicus/ECMWF CAMS IFS
Starting in 2008, ECMWF has been providing daily aerosol forecasts including dust as part of
the EU-funded projects GEMS, MACC and MACC-II and continuing operationally as part of the
Copernicus Atmosphere Monitoring Service (CAMS), which provides predictions of global
atmospheric composition and regional European air pollution. All data are publicly available
online at http://www.copernicus-atmosphere.eu. The current model resolution is ∼ 40 km with
60 vertical levels. A detailed description of the ECMWF forecast and analysis model including
aerosol processes is given in Morcrette et al. (2009) and Benedetti et al. (2009). The initial
package of ECMWF physical parameterizations dedicated to aerosol processes mainly follows
the aerosol treatment in the LOA/LMD-Z (Laboratoire d’Optique Atmospherique/Laboratoire de
Météorologie Dynamique) model (Boucher et al., 2002; Reddy et al., 2005). Five types of
tropospheric aerosols are considered: sea salt, dust, organic and black carbon and sulfate
aerosols. Prognostic aerosols of natural origin, such as mineral dust and sea salt are described
using three size bins. For dust, bin limits are at 0.03, 0.55, 0.9 and 20 microns, while for sea salt
bin limits are at 0.03, 0.5, 5 and 20 microns. Emissions of dust depend on the 10 m wind, soil
moisture, the UV–visible component of the surface albedo and the fraction of land covered by
vegetation when the surface is snow free. A correction to the 10 m wind to account for gustiness
is also included (Morcrette et al., 2008). Sea salt emissions are diagnosed using a source function
based on work by Guelle et al. (2001) and Schulz et al. (2004). In this formulation, wet sea salt
mass fluxes at 80% relative humidity are integrated for the three size bins, merging work by
Monahan et al. (1986) and Smith and Harrison (1998) between 2 and 4 mm. Sources for the
other aerosol types, which are linked to emissions from domestic, industrial, power generation,

ICAP Aerosol Multi-Model Ensemble
43
transport and shipping activities, are taken from the MACCity monthly mean climatology
(Granier et al., 2011). Emissions of OM (organic matter), BC and SO2 linked to fire emissions
are obtained using the Global Fire Assimilation System (GFAS) v1.2 based on MODIS satellite
observations of fire radiative power, as described in Kaiser et al. (2012). In the absence of a
chemical model of secondary organic aerosol production from anthropogenic VOCs, an
additional source of OM proportional to anthropogenic CO emissions (as a proxy) is included.
Several types of removal processes are considered: dry deposition including the turbulent
transfer to the surface, gravitational settling, and wet deposition including rainout by large-scale
and convective precipitation and washout of aerosol particles in and below the clouds. The wet
and dry deposition schemes are standard, whereas the sedimentation of aerosols follows closely
what was introduced by Tompkins (2005) for the sedimentation of ice particles. Hygroscopic
effects are also considered for organic matter and black carbon aerosols.
MODIS AOD data at 550 nm are routinely assimilated in a 4-D Var framework which has been
extended to include aerosol total mixing ratio as extra control variable (Benedetti et al., 2009). A
variational bias correction for MODIS AOD is implemented based on the operational setup for
assimilated radiances following the developments by Dee and Uppala (2009). The bias model for
the MODIS data consists of a global constant that is adjusted variationally in the minimization
based on the first-guess departures. Although simple, this bias correction works well in the sense
that the MACC analysis matches well the de-biased MODIS observations. The observation error
covariance matrix is assumed to be diagonal, to simplify the problem. The errors have been
chosen based on the departure statistics and are prescribed as
fixed values over land and ocean for the assimilated observations. The aerosol background error
covariance matrix used for aerosol analysis was derived using the Parrish and Derber method
ICAP Aerosol Multi-Model Ensemble
44
(also known as NMC (National Meteorological Center, now National Centers for Environmental
Prediction) method; Parrish and Derber, 1992) as detailed by Benedetti and Fisher (2007). This
method was long used for the definition of the background error statistics for the meteorological
variables and is based on the assumption that the forecast differences between the 48 h and the
24 h forecasts are a good statistical proxy to estimate the model background errors. Since 2017,
the METOP PMAp 550nm AOD product
(https://navigator.eumetsat.int/product/EO:EUM:DAT:METOP:PMAP) has also been included
in the assimilation in a similar way, except that errors provided with the product are used
directly.
A3. JMA MASINGAR
The Model of Aerosol Species in the Global Atmosphere (MASINGAR) is an aerosol transport
model developed at Meteorological Research Institute (MRI) of Japan Meteorological Agency
(JMA) (Tanaka and Ogi, 2018; Tanaka et al., 2003). The aerosol model considers major
tropospheric aerosol species including sulfate (and its precursors), black carbon (BC), organic
aerosols (OA), sea salt, and mineral dust. Dust and sea salt aerosols are logarithmically divided
into 10 discrete size bins from 0.1 to 10 μm in radius, while sulfate, BC and OA are assumed to
have a lognormal size distribution and treated with total mixing ratio. The transport of aerosol is
calculated with 3-dimensional semi-Lagrangian advection, subgrid vertical diffusion, convective
transport, and gravitational settling. Removal processes of aerosol include rainout, washout, and
dry deposition. The chemistry of sulfate production includes oxidation processes of dimethyl
sulfide (DMS), sulfur dioxide (SO2), sulfur trioxide (SO3), and carbonyl sulfide (OCS) with
oxidants (OH, H2O2, HO2, and NO3). The mixing ratios of the oxidants are taken from
simulated monthly averaged fields from the output of MRI-CCM2 (Deushi and Shibata, 2011),

ICAP Aerosol Multi-Model Ensemble
45
as described in Tanaka et al. (2003) and Tanaka and Ogi (2018). BC and OA include
hydrophobic and hydrophilic components. It is assumed that the hydrophobic BC and OA gain
hydrophilicity with an e-folding time of 1.2 days by aging processes, following Cooke et al.
(1999). The secondary organic aerosol is assumed to be formed from 10% of monoterpene and
1.2% of isoprene emission calculated by MEGAN v2 used in the Chemistry-Climate Model
Initiative (CCMI) project. (Sindelarova et al., 2014). Emission flux of sea salt aerosol is
estimated by the formulation of Gong (2003) as a function of surface wind speed at 10 m
altitude. Emission flux of dust is calculated as a function of the friction velocity, soil moisture,
soil type, snow cover and vegetation cover described in Tanaka and Chiba (2005), which is
based on the saltation-bombardment dust emission (Shao et al., 1996). Anthropogenic emissions
of SO2, BC, and OA (organic aerosols) are specified by the monthly MACCity emission
inventory (Granier et al., 2011). Daily emissions of SO2, BC, and OA from biomass burning are
incorporated from the GFAS inventory obtained from ECMWF (Kaiser et al., 2012).
MASINGAR runs coupled (“inline”) with an atmospheric general circulation model, MRI-
AGCM3 (Yukimoto et al., 2012), which provides meteorological variables (horizontal winds and
air temperature) and ground properties (surface temperature, soil moisture, snow cover, etc.).
The meteorological variables (horizontal winds and air temperature) are constrained by JMA’s
operational global analysis (GANAL) (Japan Meteorological Agency, 2002) and global forecast
at 6-hour interval by Newtonian nudging. The JMA Global Merged SST analysis is used for the
sea surface temperature. MASINGAR has been employed by JMA for operational dust
prediction since 2004, and is also used for climate research (e.g., CMIP6 and CCMI) as a part of
the climate projection model MRI-CGCM3 (Meteorological Research Institute coupled general
circulation model version 3) (Yukimoto et al., 2012). The model also contributes to the WMO

ICAP Aerosol Multi-Model Ensemble
46
Sand and Dust Storm Warning Advisory and Assessment System for Asia
(http://eng.nmc.cn/sds_was.asian_rc/).
Two types of aerosol data assimilation systems are available in MASINGAR. The variational-
based system (MASINGAR/2D-Var; Yumimoto et al. 2018) was used in the development of the
JRAero aerosol reanalysis product (Yumimoto et al. 2017) and scheduled for operational use for
dust prediction using the AOT from the geostationary satellite Himawari-8. The ensemble-based
system (MASINGAR/LETKF; Sekiyama et al., 2016; Yumimoto et al., 2016a) was developed as
a research version and applied to assimilation experiments with both a space-based Lidar and
Himawari-8 inputs (Sekiyama et al., 2010; Yumimoto et al., 2016b).
For the ICAP-MME, the model resolution was upgraded from T106L30 Gaussian grid
(approximately 110 km with 30 vertical layers in the hybrid sigma-pressure levels from the
surface to 0.4 hPa) to TL319L40 grid (approx. 60 km with 40 vertical layers from the surface to
0.4 hPa) in 2013. The horizontal grid resolution was further enhanced to T479 (approx. 40 km)
in February 2017. A quality controlled AOT from MODIS NRT L3 product (MCDAODHD)
(Zhang and Reid, 2006) has been assimilated every 6 hours in the variational-based system since
August 2016.
A4. FMI SILAM
The System for Integrated modeLling of Atmopspheric composition (SILAM)
(http://silam.fmi.fi) has been developed in FMI for operational (since 2001) and research
calculations of atmospheric composition at regional to global scale. SILAM has two transport
cores -- Lagrangian particle model (Sofiev et al., 2006) and Eulerian (Sofiev et al., 2015). The
Eulerian transport scheme used in all atmospheric composition simulations is combined with an

ICAP Aerosol Multi-Model Ensemble
47
adaptive vertical diffusion algorithm (Sofiev, 2002). A detailed aerosol dry deposition scheme of
(Kouznetsov and Sofiev, 2012) is accompanied with the gaseous surface uptake scheme based on
the resistance analogy approach. For secondary inorganic aerosol formation, the chemistry
scheme of the DMAT model (Sofiev, 2000) is extended with the coarse-nitrate formation in
marine boundary layer. Dynamic emission schemes have been developed for sea-salt (Sofiev et
al., 2011), wild-land fires IS4FIRES system v.2, (Soares et al., 2015; Sofiev et al., 2009), wind-
blown dust following the modified saltation approach (Marticorena and Bergametti, 1995;
Zender, 2003), and biogenic VOC emission after (Poupkou et al., 2010).
Being an offline model SILAM has an interface to widely used sources of meteorological
information, such as ECMWF, HIRLAM, HARMONIE and WRF models, as well as to the
GCM systems, such as ECHAM and NorESM. The model includes a meteorological pre-
processor for ensuring the solenoidal wind flow and for diagnosing the basic features of the
boundary layer and the free troposphere (such as diffusivities, similarity scales, and latent and
sensible heat fluxes) from the input meteorological fields (Sofiev et al., 2010).
SILAM implements several data assimilation techniques for 3D-var, 4D-var, ensemble Kalman
filter and ensemble Kalman smoother data-assimilation techniques (Vira et al., 2017; J Vira and
Sofiev, 2012; J. Vira and Sofiev, 2012). The model is also capable of stand-alone adjoint
simulations for, e.g., sensitivity analysis.
Scales of the SILAM applications vary from gamma-mesoscale up to global with characteristic
resolution of 0.1-0.5 degree (Lehtomäki et al., 2018; Sofiev et al., 2018). SILAM is a part of
Copernicus Atmospheric Service CAMS-50 (Marécal et al., 2015). The model has been
evaluated against air quality observations in Europe and worldwide via both dedicated studies

ICAP Aerosol Multi-Model Ensemble
48
and within the operational quality assurance procedures (Huijnen et al., 2010), http://www.gmes-
atmoshpere.eu, http://www.myair.eu (Solazzo et al., 2012a, 2012b).
A5. Météo-France MOCAGE
MOCAGE (Modèle de Chimie Atmospherique à Grande Echelle) is an off-line chemistry
transport model used for research at Météo-France in a wide range of scientific studies on
tropospheric and stratospheric chemistry at various spatial and temporal scales. It was used for
example for studying the impact of climate on chemistry (Teyssèdre et al., 2007; Lacressonnière
et al., 2012; Lamarque et al., 2013) or tropospheric–stratospheric exchanges using data
assimilation (El Amraoui et al., 2010;Barré et al., 2013). MOCAGE is also used for daily
operational air quality forecasts in the framework of French platform Prev’Air (Rouil et al.,
2009, http://www2.prevair.org/) and in the European CAMS (Copernicus Atmospheric
Monitoring Services) project by being one of the models contributing to the regional ensemble
forecasting system over Europe (Marécal et al., 2015, http://macc-raq-op.meteo.fr/index.php).
MOCAGE uses the semi-lagrangian advection scheme from for the grid-scale transport, while
the convective transport and the turbulent diffusion are parameterized. Required meteorological
fields are taken from operational analysis from the ARPEGE model (Action de Recherche Petite
Echelle Grande Echelle) operated at Météo-France (Courtier et al., 1991). MOCAGE includes
the RACM scheme for tropospheric chemistry and the REPROBUS scheme for stratospheric
chemistry (Stockwell et al., 1997). MOCAGE allows representation of desert dust, sea salt, black
carbon, primary organic carbon and secondary inorganic aerosols (sulfate, nitrate ammonium). It
uses a sectional representation with 6 bins for each aerosol, ranging from 2nm to 50microns (Sic
et al, 2015; Guth et al, 2016).

ICAP Aerosol Multi-Model Ensemble
49
A6. NASA GEOS-5
The Goddard Earth Observing System model, version 5 (GEOS-5), is a global Earth system
model developed at the NASA Global Modeling and Assimilation Office (GMAO, Rienecker et
al., 2008, Molod et al. 2015). GEOS-5 serves NASA (1) as a state-of-the-art modeling tool to
study climate variability and change, (2) as a provider of research quality reanalyses for use by
NASA instrument teams and the scientific community at large, and (3) as a source of near-real
time forecasts of aerosol and atmospheric constituents in support of NASA aircraft campaigns
(e.g., KORUS-AQ, ORACLES). GEOS-5 includes components for atmospheric circulation and
composition (including atmospheric data assimilation), ocean circulation and biogeochemistry,
and land surface processes. Components and individual parameterizations within components are
coupled under the Earth System Modeling Framework (ESMF, Hill et al., 2004). GEOS-5 has a
mature atmospheric data assimilation system that builds upon the Grid-point Statistical
Interpolation (GSI) algorithm jointly developed with NCEP (Rienecker et al., 2008) and is
currently evolving into a hybrid ensemble-variational assimilation system. The version of GEOS-
5 documented here is run in near-real time on a cubed-sphere grid at a nominal 25 km horizontal
resolution (output is saved on a 0.25ox0.3125o latitude x longitude grid) with 72 vertical hybrid
sigma levels from the surface to approximately 85 km.
In addition to traditional meteorological parameters (winds, temperatures, etc.), GEOS-5
includes modules to represent aerosols and tropospheric–stratospheric chemical constituents, and
their respective radiative feedback. Aerosols are handled through a version of the GOCART
(Chin et al., 2002; Colarco et al., 2010) run online and radiatively coupled in GEOS-5. GOCART

ICAP Aerosol Multi-Model Ensemble
50
treats the sources, sinks and chemistry of dust, sulfate, sea salt and black and organic carbon
aerosols. Aerosol species are assumed to be external mixtures. Aerosol and precursor emissions
in the near-real time system are similar to those in the recent GEOS-5 produced Modern-era
Retrospective analysis for Research and Analysis, Version 2 (MERRA-2, Randles et al. 2017).
Dust and sea salt have wind speed-dependent emissions and discretize the particle size
distribution across five size bins apiece. Total mass of sulfate and hydrophobic and hydrophilic
modes of carbonaceous aerosols are tracked. Biomass burning emissions of sulfur dioxide and
carbonaceous aerosols are from the Quick Fire Emission Data set (QFED, Darmenov and da
Silva, 2013). Aerosol optical property assumptions are as in Randles et al. (2017), including a
treatment for non-spherical dust particles (Colarco et al., 2014b). In January 2017 the near-real
time GEOS-5 system was updated to include a series of tracers for nitrate aerosols (including
three size bins of nitrate) following the methodology in Bian et al. (2017).
The aerosol data assimilation methodology also follows from the description in Randles et al.
(2017). In near-real time, GEOS-5 includes assimilation of AOD observations from the MODIS
sensors on both Terra and Aqua satellites. Based on the work of Zhang and Reid (2006) and Lary
et al. (2010), we originally developed a back-propagation neural network to correct observational
biases related to cloud contamination, surface parameterization and aerosol microphysics. This
empirical algorithm has been adapted to retrieve AOD directly from cloud-cleared MODIS
reflectance. Online quality control is performed with the adaptive buddy check of Dee et al.
(2001), with observation and background errors estimated using the maximum likelihood
approach of Dee and da Silva (1999). Following a multi-channel AOD analysis, three-
dimensional analysis increments are produced exploring the Lagrangian characteristics of the

ICAP Aerosol Multi-Model Ensemble
51
problem, generating local displacement ensembles intended to represent misplacements of the
aerosol plumes.
A7. NOAA NGAC
In March, 2017, NCEP implemented the NEMS GFS Aerosol Component (NGAC) version 2
(NGACv2) multi-species aerosol forecast into operation. The aerosol species include organic
carbon aerosols, black carbon aerosols, sea salt and sulfate aerosols and dust. NGACv2 uses an
updated atmosphere model Global Forecast System (GFS) implemented in May 2016. The
convection scheme is changed to the Relaxed Arakawa–Schubert scheme (the RAS scheme,
Moorthi and Suarez, 1992, 1999) due to the need of vertical aerosol transport. The aerosol model
is NASA/GSFC’s GOCART aerosol module (Colarco et al. 2010). Black carbon and organic
carbon aerosols are tracked separately. The organic carbon is presented as particulate organic
matter. The chemical processing of carbonaceous aerosols as a conversion from a hydrophobic to
hydrophilic mode follows Cooke et al. (1999) and Chin et al. (2002) with an e-folding timescale
of 2.5 days (Maria et al. 2004). Following Colarco (2014), five size bins of sea salt aerosol
particles with a dry radius range of 0.03-10mm are considered for an indirect production
mechanism from bursting bubbles (Monahan et al. 1986), and later modified by Gong (2003).
Four sulfate tracers dimethyl sulfide (DMS), sulfur dioxide (SO2), sulfate (SO4), and methane
sulfonic acid (MSA) are tracked. Sulfate chemistry includes the DMS oxidation by hydroxyl
radical (OH) during the day and by nitrate radical (NO3) at night to form SO2, and SO2
oxidation by OH in the gas phase and by hydrogen peroxide (H2O2)in the aqueous phase to form
sulfate, as described in Chin et al. (2002). The AOD is computed from the complex refractive
indices, size distributions, and the hygroscopic properties of aerosols following Chin et al. A

ICAP Aerosol Multi-Model Ensemble
52
computational error on dust AOD calculation is fixed, and the removal process has been tuned to
improve dust performance.
NGACv2 runs at T126 L64 resolution and provides 5-day multi-species forecasts, twice per day
for the 00:00UTC and 12:00UTC cycles. The aerosol initial conditions are taken from the 12
hour NGAC forecast from the previous cycle while meteorological initial conditions are from the
down-scaled high-resolution Global Data Assimilation System (GDAS) analysis. NGACv2
provides products in addition to those from NGACv1 dust-related products. Total Aerosol
Optical Depth (AOD) and AOD from each species are produced to support global and regional
multi-model ensemble aerosol forecasts. Single scattering albedo and asymmetric factor for total
aerosols at 340nm are produced to support UV index forecast are available. Besides these fields,
the three-dimensional mixing ratios for each aerosol species at model levels are also produced.
The data are publicly available
at: http://www.nomads.ncep.noaa.gov/pub/data/nccf/com/ngac/prod
A8. UKMO Unified Model
The dust forecasts from the UK Met Office are produced by the global NWP configuration of the
Met Office Unified Model (MetUM). The dust scheme is essentially that of Woodward (2001)
with modifications as described in Woodward (2011) and Collins et al. (2011). The dust
emission scheme is based on Marticorena and Bergametti (1995) and represents an initial
horizontal/saltation flux in a number of size bins with subsequent vertical flux of bare soil
particles from the surface into the atmosphere. The global NWP model transports only 2 bins
(0.1–2 microns and 2–10 microns radii), calculated from the emissions with the original 9 bins
using a prescribed size distribution broadly consistent with Kok et al. (2011). The magnitude of

ICAP Aerosol Multi-Model Ensemble
53
the emission is a cubic function of the exceedance of the friction velocity over bare soil with
respect to a threshold value, where this friction velocity is determined from the model wind field
and boundary layer structure, and the threshold friction velocity is increased by the presence of
soil moisture according to Fécan (1999). The conversion from the horizontal flux to the vertical
flux is first limited using the clay fraction in the soil texture data set, according to Gillette
(1978), and then partitioned into the new bins by prescribing the emitted size distribution. Once
the dust is lifted into the atmosphere it is transported as a set of tracers by the model 3-D wind
field. Johnson et al. (2011) gave in-depth description and evaluation of the Met Office dust
forecasts, in a local area model over North Africa. Dust is assimilated in a 4-D Var framework
following Benedetti et al. (2009), using aerosol observations from MODIS on-board NASA’s
Aqua platform. Initially, MODIS (Collection 5.1) observations (best quality, dust filtered) were
assimilated only over the land based on MODIS Dark Target (Kaufman et al., 1997a, b; Levy et
al., 2007, 2009) and Deep Blue (Hsu et al., 2004, 2006) retrievals. Incremental updates to the
operational system includes MODIS observation over ocean in Feb 2015, and an updated version
of MODIS AOD (Collection 6.0) in Dec 2017.
A9. US NAVY NAAPS
The Navy Aerosol Analysis and Prediction System (NAAPS) is the US Navy’s global
aerosol forecast model, which produced the world’s first operational global aerosol forecasts and
then was the first with aerosol data assimilation. In its current operational configuration, NAAPS
makes 6-day forecasts, 4 times a day at 1080x540 global (1/3 degree) spatial resolution and 35
vertical levels driven by the Navy Global Environmental Model (NAVGEM) meteorology
(Hogan et al., 2014). It has multiple research versions, including the NAAPS reanalysis (Lynch

ICAP Aerosol Multi-Model Ensemble
54
et al., 2016) and ensemble NAAPS (Rubin et al, 2016). Quality controlled retrievals of AOD
from the Moderate Resolution Imaging Spectroradiometer (MODIS) (Zhang et al., 2006; Hyer et
al., 2011; Shi et al., 2014) are assimilated through the Navy Atmospheric Variational Data
Assimilation System (NAVDAS) for AOD (NAVDAS-AOD; Zhang et al., 2008) in the
operational run, while the model has capabilities of assimilating other quality controlled
observations, including lidar back scatter vertical profiles and AOD products from other
platforms through either variational or ensemble methods (Zhang et al., 2011; Rubin et al., 2017;
Hyer et al., 2018).
NAAPS characterizes anthropogenic and biogenic fine (ABF, including sulfate, and
primary and secondary organic aerosols), dust, biomass burning smoke and sea salt aerosols. A
1st order approximation of secondary organic aerosol (SOA) processes is adopted in which
production of SOA from its precursors is assumed to be instantaneous and included with the
sulfate species to form a combined anthropogenic and biogenic fine (ABF) species (Lynch et al,
2016). Smoke from biomass burning is derived from near-real time satellite based thermal
anomaly data used to construct smoke source functions with regional corrections (Reid et al.,
2009). Dust is emitted dynamically and is a function of modeled friction velocity to the fourth
power, surface wetness and surface erodibility (Westphal et al., 1988). Sea salt emission is
driven dynamically by sea surface wind, according to the parameterization described by Witek et
al. (2007).
Appendix B: Definition of terminologies
Root Mean Square Error (RMSE):

ICAP Aerosol Multi-Model Ensemble
55
RMSE = �1𝑛𝑛�(𝜏𝜏𝑚𝑚𝑚𝑚𝑚𝑚𝑚𝑚𝑚𝑚 − 𝜏𝜏𝑚𝑚𝑜𝑜𝑜𝑜)𝑖𝑖2𝑛𝑛
𝑖𝑖=0
where τ represents AOD, and n is the total number of observational or model data.
Bias: 𝜏𝜏𝑚𝑚𝑚𝑚𝑚𝑚𝑚𝑚𝑚𝑚 − 𝜏𝜏𝑚𝑚𝑜𝑜𝑜𝑜
Mean error: 1𝑛𝑛∑ (𝜏𝜏𝑚𝑚𝑚𝑚𝑚𝑚𝑚𝑚𝑚𝑚 − 𝜏𝜏𝑚𝑚𝑜𝑜𝑜𝑜)𝑖𝑖𝑛𝑛𝑖𝑖=1
Mean absolute error: 1𝑛𝑛∑ |𝜏𝜏𝑚𝑚𝑚𝑚𝑚𝑚𝑚𝑚𝑚𝑚 − 𝜏𝜏𝑚𝑚𝑜𝑜𝑜𝑜|𝑖𝑖𝑛𝑛𝑖𝑖=1
Coefficient of determination: 𝑟𝑟2 = �∑ (𝑥𝑥𝑖𝑖−𝑥𝑥)(𝑦𝑦𝑖𝑖−𝑦𝑦)𝑛𝑛𝑖𝑖=1 �2
∑ (𝑥𝑥𝑖𝑖−𝑥𝑥)(𝑦𝑦𝑖𝑖−𝑦𝑦)∑ (𝑥𝑥𝑖𝑖−𝑥𝑥)(𝑦𝑦𝑖𝑖−𝑦𝑦)𝑛𝑛𝑖𝑖=1
𝑛𝑛𝑖𝑖=1
where 𝑥𝑥 and 𝑦𝑦 are the mean values of variable x and y.
Absolute Forecast Error (AFE): |𝜏𝜏𝑚𝑚𝑚𝑚𝑚𝑚𝑚𝑚𝑚𝑚 − 𝜏𝜏𝑚𝑚𝑜𝑜𝑜𝑜| for forecast mode.
Ensemble mean: 1𝑚𝑚∑ 𝑥𝑥𝑖𝑖𝑚𝑚𝑖𝑖=1 where m is the total number of the individual models.
Ensemble spread is defined as the standard deviation of all the individual models, ie.,
𝜎𝜎 = �1𝑚𝑚�(𝑥𝑥𝑖𝑖 − 𝑥𝑥)2𝑚𝑚
𝑖𝑖=1
References
Badia, A., Jorba, O., Voulgarakis, A., Dabdub, D., Pérez García-Pando, C., Hilboll, A.,
Gonçalves, M., and Janjic, Z. (2017) Description and evaluation of the Multiscale Online
Nonhydrostatic AtmospheRe CHemistry model (NMMB-MONARCH) version 1.0: gas-phase
chemistry at global scale, Geosci. Model Dev., 10, 609-638, https://doi.org/10.5194/gmd-10-
609-2017.
ICAP Aerosol Multi-Model Ensemble
56
Benedetti, A. and Fisher, M. (2007) Background error statistics for aerosols, Q. J. Roy. Meteorol.
Soc., 133, 391–405, doi:10.1002/qj.37.
Benedetti, A., Morcrette, J.-J., Boucher, O., Dethof, A., Engelen, R. J., Fisher, M., Flentje, H.,
Huneeus, N., Jones, L., Kaiser, J. W., Kinne, S., Mangold, A., Razinger, M., Simmons, A. J., and
Suttie, M. (2009) Aerosol analysis and forecast in the European Centre for Medium-
RangeWeather Forecasts Integrated Forecast System: 2. Data assimilation, J. Geophys. Res.,
114, D13205, doi:10.1029/2008JD011115.
Benedetti, A., Reid, J. S. and Colarco P. R. (2011) International cooperative for aerosol
prediction workshop on aerosol forecast verification, Bull. Amer. Meteorol. Soc., 92, ES48–
ES53. doi: http://dx.doi.org/10.1175/BAMS-D-11-00105.1
Benedetti, A., Reid, J. S., Knippertz, P., Marsham, J. H., Di Giuseppe, F., Rémy, S., Basart, S.,
Boucher, O., Brooks, I. M., Menut, L., Mona, L., Laj, P., Pappalardo, G., Wiedensohler, A.,
Baklanov, A., Brooks, M., Colarco, P. R., Cuevas, E., da Silva, A., Escribano, J., Flemming, J.,
Huneeus, N., Jorba, O., Kazadzis, S., Kinne, S., Popp, T., Quinn, P. K., Sekiyama, T. T., Tanaka,
T., and Terradellas, E. (2018) Status and future of numerical atmospheric aerosol prediction with
a focus on data requirements, Atmos. Chem. Phys., 18, 10615-10643,
https://doi.org/10.5194/acp-18-10615-2018.
Bhattacharjee P. et al. (2018) The implementation of NEMS GFS Aerosol Component (NGAC)
Version 2.0 for global multispecies forecasting at NOAA/NCEP: Part II Evaluation of Aerosol
Optical Thickness, Geosci. Model Dev. under review.

ICAP Aerosol Multi-Model Ensemble
57
Bian, H., Chin, M., Hauglustaine, D. A., Schulz, M., Myhre, G., Bauer, S. E., Lund, M. T.,
Karydis, V. A., Kucsera, T. L., Pan, X., Pozzer, A., Skeie, R. B., Steenrod, S. D., Sudo, K.,
Tsigaridis, K., Tsimpidi, A. P. and Tsyro, S. G. (2017) Investigation of global particulate nitrate
from the AeroCom phase III experiment, Atmos. Chem. Phys., 17(21), 12911–12940,
doi:10.5194/acp-17-12911-2017.
Bogdanoff, A. S., D. L. Westphal, J. R. Campbell, J. A. Cummings, E. J. Hyer, J. S. Reid, and C.
A. Clayson (2015) Sensitivity of infrared sea surface temperature retrievals to the vertical
distribution of airborne dust aerosol, Remote Sens. Environ., 159, 1-13,
doi:10.1016/j.rse.2014.12.002.
Boucher, O., Pham, M., and Venkataraman, C. (2002) Simulation of the atmospheric sulfur
cycle in the LMD GCM: Model description, model evaluation, and global and European
budgets, Note 23, 26 pp., Inst. Pierre-Simon Laplace, Paris, France, available
at: http://icmc.ipsl.fr/images/publications/scientific_notes/note23.pdf (last access: 6 June 2014).
Buizza, R. and Richardson, D. (2017) 25 years of ensemble forecasting at ECMWF. ECMWF
Newsletter No. 153. 20-31. Doi:10.2195/bv418o.
Chin, M., Ginoux, P., Kinne, S., Torres, O., Holben, B. N., Duncan, B. N., Martin, R. V., Logan,
J. A., Higurashi, A., and Nakajima, T. (2002) Tropospheric aerosol optical thickness from the
GOCART model and comparisons with satellite and sun photometer measurements, J. Atmos.
Sci., 59, 461–483.
Christensen, M., Zhang, J., Reid, J. S., Zhang, X., Hyer, E. J., and Smirnov, A. (2015) A
theoretical study of the effect of subsurface oceanic bubbles on the enhanced aerosol optical

ICAP Aerosol Multi-Model Ensemble
58
depth band over the southern oceans as detected from MODIS, Atmos. Meas. Tech., 8, 2149-
2160, doi:10.5194/amt-8-2149-2015.
Colarco, P., da Silva, A., Chin, M., and Diehl, T. (2010) Online simulations of global aerosol
distributions in the NASA GEOS-4 model and comparisons to satellite and ground-based aerosol
optical depth, J. Geophys. Res., 115, D14207, doi:10.1029/2009JD012820.
Colarco, P., Benedetti, A., J. Reid, J. and Tanaka T. (2014a) Using EOS data to improve aerosol
forecasting: the International Cooperative for Aerosol Research (ICAP), The Earth Observer, 26,
14-19.
Colarco, P. R., Nowottnick, E. P., Randles, C. A., Yi, B., Yang, P., Kim, K.-M., Smith, J. A. and
Bardeen, C. G. (2014b) Impact of radiatively interactive dust aerosols in the NASA GEOS‐5
climate model: Sensitivity to dust particle shape and refractive index, J Geophys Res-Atmos,
119(2), 753–786, doi:10.1002/2013JD020046.
Collins, W. J., Bellouin, N., Doutriaux-Boucher, M., Gedney, N., Halloran, P., Hinton, T.,
Hughes, J., Jones, C. D., Joshi, M., Liddicoat, S., Martin, G., O’Connor, F., Rae, J., Senior, C.,
Sitch, S., Totterdell, I., Wiltshire, A., and Woodward, S. (2011) Development and evaluation of
an Earth-System model – HadGEM2, Geosci. Model Dev., 4, 1051–1075, doi:10.5194/gmd-4-
1051-2011.
Cooke, W. F., C. Liousse, H. Cachier and J. Feichter (1999) Contruction of a 1º X 1º fossil fuel
emission data set for carbonaceous aerosol and implementation and radiative impact in the
ECHAM4 model, J. Geophys. Res. 104, 22 137-22162.

ICAP Aerosol Multi-Model Ensemble
59
Darmenov, A. and da Silva, A. (2013) The Quick Fire Emissions Dataset (QFED) –
Documentation of versions 2.1, 2.2 and 2.4. NASA Technical Report Series on Global Modeling
and Data Assimila- tion, NASA TM-2013-104606, Vol. 32, 183 pp.
Dee, D. P., and A. M. da Silva, Maximum-likelihood estimation of forecast and observation error
covariance parameters (1999) Part I: Methodology. Mon. Wea. Rev., 127, 1811–1834,
doi:10.1175/ 1520-0493(1999)127,1822:MLEOFA.2.0.CO;2.
Dee, D.P, L. Rukhovets, R. Todling, A. M. da Silva, and J. W. Lawson (2001) An adaptive
buddy check for observational quality control. Quart. J. Roy. Meteor. Soc., 127, 2451–2471,
doi:10.1002/qj.49712757714.
Dee, D. P. and Uppala, S. (2009) Variational bias correction of satellite radiance data in the
ERA-Interim reanalysis, Q. J. Roy. Meteor.Soc., 135, 1830–1841.
DeMaria, M., Sampson C. R., Knaff, J. A., and Musgrave, K. D. (2014) Is tropical cyclone
intensity guidance improving? Bull. Amer. Meteor. Soc., 95, 387-398.
Deushi, M., and Shibata, K. (2011) Development of a Meteorological Research Institute
Chemistry-Climate Model version 2 for the Study of Tropospheric and Stratospheric Chemistry,
Pap. Meteorol. Geophys., 62, 1-46, doi:10.2467/mripapers.62.1.
Di Tomaso, E., Schutgens, N. A. J., Jorba, O., and Pérez García-Pando, C. (2017) Assimilation
of MODIS Dark Target and Deep Blue observations in the dust aerosol component of NMMB-
MONARCH version 1.0, Geosci. Model Dev., 10, 1107-1129, https://doi.org/10.5194/gmd-10-
1107-2017.

ICAP Aerosol Multi-Model Ensemble
60
Ebert, E. E., J. E. Janowiak, and C. Kidd (2007) Comparison of nearreal-time precipitation
estimates from satellite observations and numerical models, Bull. Am. Meteorol. Soc., 88, 47–
64, doi:10.1175/BAMS-88-1-47.
Eck, T. F, B. N. Holben, J. S. Reid, P. Xian, D. M. Giles, A. Sinyuk, A. Smirnov, J. S. Schafer, I.
Slutsker, J. Kim, J-H. Koo, M. Choi, Y. J. Kim, I. Sano, A. Arola, A. M. Sayer, R. C. Levy, L.
A. Munchak, N. T. O’Neill, A. Lyapustin, N. C. Hsu, C. A. Randles, A. M. Da Silva, V.
Buchard, R. C. Govindaraju, E. Hyer, K. E. Pickering, J. H. Crawford, P. Wang, and X. Xia
(2018) Observations of the Interaction and Transport of Fine Mode Aerosols with Cloud and/or
Fog in Northeast Asia from Aerosol Robotic Network and Satellite Remote Sensing, J. Geophy.
Res.: Atmospheres, 123, 5560-5587. https://doi.org/10.1029/2018JD028313
Fanin, T., and G. R. van der Werf (2017) Precipitation-fire linkages in Indonesia (1997-2015),
Biogeosciences, 14(18), 3995-4008, doi:10.5194/bg-14-3995-2017.
Fécan, F., Marticorena, B. and Bergametti, G. (2000) Parametrization of the increase of the
aeolian erosion threshold wind friction velocity due to soil moisture for arid and semi-arid areas
Annales Geophysicae, Copernicus GmbH, 1999, 17, 149–157, doi:10.1007/s00585-999-0149-7
Goerss, J. S. (2000) Tropical cyclone track forecasts using an ensemble of dynamical models,
Mon. Weather Rev., 128, 1187–1193.
Gong, S. L. (2003) A parameterization of sea-salt aerosol source function for sub and super-
micron particles, Global Biogeochem. Cycles, 17(4), 1097, doi:10.1029/2003GB002079.
Goodrick, S. L., G. L. Achtemeier, N. K. Larkin, Y. Q. Liu, and T. M. Strand (2013) Modelling
smoke transport from wildland fires: a review, Int. J. Wildland Fire, 22(1), 83-94,

ICAP Aerosol Multi-Model Ensemble
61
doi:10.1071/wf11116.Gordon, H. R. (1997) Atmospheric correction of ocean color imagery in
the Earth Observing System era, J. Geophys. Res., 102(D14), 17081–17106.
Granier, C., Bessagnet, B., Bond, T., D’Angiola, A., Denier van der Gon, H., Frost, G. J., Heil,
A., Kaiser, J. W., Kinne, S., Klimont, Z., Kloster, S., Lamarque, J.-F., Liousse, C., Masui, T.,
Meleux, F., Mieville, A., Ohara, T., Raut, J.-C., Riahi, K., Schultz, M. G., Smith, S. J.,
Thompson, A., van Aardenne, J., van der Werf, G. R., and van Vuuren, D. P. (2011) Evolution of
anthropogenic and biomass burning emissions of air pollutants at global and regional scales
during the 1980–2010 period, Climatic Change, 109, 163-190, doi:10.1007/s10584-011-0154-1.
Guelle, W., Schulz, M., Balkanski, Y., and Dentener, F. (2001) Influence of the source
formulation on modeling the atmospheric global distribution of the sea salt aerosol, J. Geophys.
Res., 106, 27509–27524.
Guenther, A., Karl, T., Harley, P., Wiedinmyer, C., Palmer, P. I., and Geron, C. (2006) Estimates
of global terrestrial isoprene emissions using MEGAN (Model of Emissions of Gases and
Aerosols from Nature), Atmospheric Chemistry and Physics, 6, 3181–3210, doi:10.5194/acp-6-
3181-2006.
Guo, S., M. Hu, M. L. Zamora, J. F. Peng, D. J. Sahng, et al., (2014) Elucidating severe urban
haze formation in China, Proceed. Nation. Academy of Sci, 111, 17373-17378, doi:
10.1073/pnas.1419604111.
Guth, J., B. Josse, V. Marécal, M. Joly, and P. D. Hamer (2016) First implementation of
secondary inorganic aerosols in the MOCAGE version R2.15.0 chemistry transport model,
Geosci. Mod. Dev., 9, 137-160.

ICAP Aerosol Multi-Model Ensemble
62
Haustein, K., Pérez, C., Baldasano, J. M., Jorba, O., Basart, S., Miller, R. L., Janjic, Z., Black,
T., Nickovic, S., Todd, M. C., Washington, R., Müller, D., Tesche, M., Weinzierl, B., Esselborn,
M., and Schladitz, A. (2012) Atmospheric dust modeling from meso to global scales with the
online NMMB/BSC-Dust model – Part 2: Experimental campaigns in Northern Africa, Atmos.
Chem. Phys., 12, 2933-2958, https://doi.org/10.5194/acp-12-2933-2012.
Holben, B. N., Eck, T. F., Slutsker, I., Tanre, D., Buis, J. P., Setzer, A., Vermote, E., Reagan, J.
A., Kaufman, Y. J., Nakajima, T., Lavenu, F., Jankowiak, I., and Smirnov, A. (1998) AERONET
- A federated instrument network and data archive for aerosol characterization, Remote Sens.
Environ., 66, 1-16.
Houweling, S., W. Hartmann, I. Aben, H. Schrijver, J. Skidmore, G.-J. Roelofs, and F.-M. Breon
(2005) Evidence of systematic errors in SCIAMACHY-observed CO2 due to aerosols, Atmos.
Chem. Phys., 5, 3003–3013.
Hsu, N., Tsay, S. C., King, M. D., and Herman, J. R. (2004) Aerosol properties over bright-
reflecting source regions, IEEE T. Geosci. Remote, 43, 557–569.
Hsu, N., Tsay, S. C., and King, M. (2006) Deep blue retrievals of Asian aerosol properties during
ACE-Asia, IEEE T. Geosci. Remote, 44, 3180–3195.
Huijnen V., et al (2016) Fire carbon emissions over maritime Southeast Asia in 2015 largest
since 1997 Sci. Rep. 6 26886.
Hyer, E. J., Reid, J. S., and Zhang, J. (2011) An over-land aerosol optical depth data set for data
assimilation by filtering, correction, and aggregation of MODIS Collection 5 optical depth
retrievals, Atmos. Meas. Tech., 4, 379–408.

ICAP Aerosol Multi-Model Ensemble
63
Janssens-Maenhout, G., Crippa, M., Guizzardi, D., Dentener, F., Muntean, M., Pouliot, G.,
Keating, T., Zhang, Q., Kurokawa, J., Wankmüller, R., Denier van der Gon, H., Kuenen, J. J. P.,
Klimont, Z., Frost, G., Darras, S., Koffi, B., and Li, M. (2015) HTAP_v2.2: a mosaic of regional
and global emission grid maps for 2008 and 2010 to study hemispheric transport of air pollution,
Atmos. Chem. Phys., 15, 11411-11432, doi:10.5194/acp-15-11411-2015.
Johnson, B. T., Brooks, M. E., Walters, D., Christopher, S., and Schepanski, K. (2011)
Assessment of the Met Office dust forecast model using observations from the GERBILS
campaign, Q. J. Roy. Meteor. Soc., 137, 1131–1148, doi:10.1002/qj.736.
Jorba, O., D. Dabdub, C. Blaszczak-Boxe, C. Pérez, Z. Janjic, J. M. Baldasano, M. Spada, A.
Badia, M. Goncalves (2012) J. Geophys. Res., 117, D13301
Kaku, K. C., J. S. Reid, N. T. O'Neill, P. K. Quinn, D. J. Coffman, and T. F. Eck (2014)
Verification and application of the extended spectral deconvolution algorithm (SDA+)
methodology to estimate aerosol fine and coarse mode extinction coefficients in the marine
boundary layer, Atmos. Meas. Tech., 7, 3399-3412.
Kaiser, J.W., Heil, A., Andreae, M.O., Benedetti, A., Chubarova, N., Jones, L., Morcrette, J.-J.,
Razinger, M., Schultz, M.G., Suttie, M., and van der Werf, G. R. (2012) Biomass burning
emissions estimated with a global fire assimilation system based on observed fire radiative
power, Biogeosciences, 9, 527–554, doi:10.5194/bg-9-527-2012.
Kaufman, Y. J.; Tanré, D.; Remer, L. A.; Vermote, E. F.; Chu, A. and Holben, B. N (1997)
Operational remote sensing of tropospheric aerosol over land from EOS moderate resolution

ICAP Aerosol Multi-Model Ensemble
64
imaging spectroradiometer Journal of Geophysical Research: Atmospheres, 102, 17051-17067,
doi:10.1029/96JD03988
Kinne, S., Schulz, M., Textor, C., Guibert, S., Balkanski, Y., Bauer, S. E., Berntsen, T., Berglen,
T. F., Boucher, O., Chin, M., Collins, W., Dentener, F., Diehl, T., Easter, R., Feichter, J.,
Fillmore, D., Ghan, S., Ginoux, P., Gong, S., Grini, A., Hendricks, J., Herzog, M., Horowitz, L.,
Isaksen, I., Iversen, T., Kirkevåg, A., Kloster, S., Koch, D., Kristjansson, J. E., Krol, M., Lauer,
A., Lamarque, J. F., Lesins, G., Liu, X., Lohmann, U., Montanaro, V., Myhre, G., Penner, J.,
Pitari, G., Reddy, S., Seland, O., Stier, P., Takemura, T., and Tie, X. (2006) An AeroCom initial
assessment – optical properties in aerosol component modules of global models, Atmos. Chem.
Phys., 6, 1815–1834, doi:10.5194/acp-6-1815-2006.
Kok, J. F. (2011) Does the size distribution of mineral dust aerosols depend on the wind speed at
emission? Atmospheric Chemistry and Physics, Copernicus GmbH, 11, 10149–10156,
doi:10.5194/acp-11-10149-2011
Lary, D., L. A. Remer, D. MacNeil, B. Roscoe, and S. Paradise (2009) Machine learning and
bias correction of MODIS aerosol optical depth. IEEE Geosci. Remote Sens. Lett., 6, 694–698,
doi:10.1109/LGRS.2009.2023605.
Levy, R. C., S. Mattoo, L. A. Munchak, L. A. Remer, A. M. Sayer, F. Patadia, and N. C. Hsu
(2013) The Collection 6 MODIS aerosol products over land and ocean, Atmospheric
Measurement Techniques, 6(11), 2989-3034, doi:10.5194/amt-6-2989-2013.
Levy, R. C., et al. (2005) Evaluation of the MODIS aerosol retrievals over ocean and land during
CLAMS, J. Atmos. Sci., 62(4), 974–992.

ICAP Aerosol Multi-Model Ensemble
65
Levy, R., Remer, L., Mattoo, S., Vermote, E., and Kaufman, Y. J. (2007) Second-generation
operational algorithm: Retrieval of aerosol properties over land from inversion of Moderate
Resolution Imaging Spectroradiometer spectral reflectance, J. Geophys. Res.-Atmos., 112,
D13211, doi:10.1029/2006JD007811.
Levy, R., Remer, L., Tanre, D., Mattoo, S., and Kaufman, Y. (2009) Algorithm for remote
sensing of tropospheric aerosol over dark targets from MODIS: Collections 005 and 051:
Revision 2, February 2009, MODIS Algorithm Theoretical Basis Document, available
at: http://modis-atmos.gsfc.nasa.gov/_docs/ATBD_MOD04_C005_rev2.pdf
Loria-Salazar, S. M., H. A. Holmes, W. P. Arnott, J. C. Barnard, and H. Moosmuller (2016)
Evaluation of MODIS columnar aerosol retrievals using AERONET in semi-arid Nevada and
California, USA, during the summer of 2012, Atmos. Environ., 144, 345-360,
doi:10.1016/j.atmosenv.2016.08.070.
Lu, C.-H. et al. (2016) The implementation of NEMS GFS Aerosol Component (NGAC) version
1.0 for global dust forecasting at NOAA/NCEP, Geosci. Model Dev., 9, 1905-19
Lynch, P., Reid, J. S., Westphal, D. L., Zhang, J., Hogan, T. F., Hyer, E. J., Curtis, C. A., Hegg,
D. A., Shi, Y., Campbell, J. R., Rubin, J. I., Sessions, W. R., Turk, F. J., and Walker, A. L.
(2016) An 11-year global gridded aerosol optical thickness reanalysis (v1.0) for atmospheric and
climate sciences, Geosci. Model Dev., 9, 1489-1522, https://doi.org/10.5194/gmd-9-1489-2016.
Marticorena, B. and Bergametti, G. (1995) Modeling the atmospheric dust cycle 1. design of a
soil-derived dust emission scheme, J. Geophys. Res., 100, 16415–16430,
doi:10.1029/95JD00690.

ICAP Aerosol Multi-Model Ensemble
66
May, D. A., Stowe, L. L., Hawkins, J. D., McClain, E. P. (1992) A correction for Saharan dust
effects on satellite sea-surface temperature-measurements, J. Geophys. Res., 97, 3611-3619.
Molod, A., Takacs, L., Suarez, M. and Bacmeister, J. (2015) Development of the GEOS-5
atmospheric general circulation model: evolution from MERRA to MERRA2, Geosci Model
Dev, 8(5), 1339–1356, doi:10.5194/gmd-8-1339-2015.
Molteni, F., Buizza, R., Palmer, T. N. and Petroliagis, T., (1996) The ECMWF ensemble
prediction system: methodology and validation. Q. J. R. Meteorol., Soc., 122, 73-119.
Monahan, E.C., Spiel, D.E., and Davidson, K.L. (1986) A Model of Marine Aerosol Generation
Via Whitecaps and Wave Disruption, in: Oceanic Whitecaps, edited by: Monahan, E. C. and
Niocaill, G., 167–174, Springer, the Netherlands.
Moorthi, S., and M. J. Suarez: Relaxed Arakawa-Schubert (1992) A parameterization of moist
convection for general circulation models, Mon. Wea. Rev., 120, 978-1002.
Moorthi, S. and M. J. Suarez (1999) Documentation of version 2 of Relaxed Arakawa-Schubert
cumulus parameterization with convective downdrafts, NOAA Tech. Report NWS/NCEP 99-01,
44pp.
Morcrette, J.-J., Beljaars, A., Benedetti, A., Jones, L., and Boucher,O. (2008) Sea-salt and dust
aerosols in the ECMWF IFS mode, Geophys. Res. Lett., 35, L24813,
doi:10.1029/2008GL036041.
Morcrette, J.-J., Boucher, O., Jones, L., Salmond, D., Bechtold, P., Beljaars, A., Benedetti, A.,
Bonet, A., Kaiser, J. W., Razinger, M., Schulz, M., Serrar, S., Simmons, A. J., Sofiev, M., Suttie,

ICAP Aerosol Multi-Model Ensemble
67
M., Tompkins, A. M., and Untch, A. (2009) Aerosol analysis and forecast in the European
Centre for Medium-RangeWeather Forecasts Integrated Forecast System: Forward modeling, J.
Geophys. Res., 114, D06206, doi:10.1029/2008JD011235.
Mulcahy, J. P., Walters, D. N., Bellouin, N., and Milton, S. F. (2014) Impacts of increasing the
aerosol complexity in the Met Office global numerical weather prediction model, Atmos. Chem.
Phys., 14, 4749–4778, doi:10.5194/acp-14-4749-2014.
O'Neill, N.T., T.F.Eck, B.N.Holben, A.Smirnov, O.Dubovik, and A.Royer (2001) Bimodal size
distribution influences on the variation of Angstrom derivatives in spectral and optical depth
space, J. Geophys. Res., 106, 9787-9806.
O'Neill, N. T., Eck, T. F., Smirnov, A., Holben, B. N., and Thulasiraman S. (2003) Spectral
discrimination of coarse and fine mode optical depth. J. Geophys. Res., 108, D05212,
doi:10.1029/2002JD002975.
Park, Y.-Y., R. Buizza, and M. Leutbecher (2008) TIGGE: preliminary results on comparing and
combining ensembles. Q. J. R. Meteorol. Soc., 134, 2029-2050
Parrish, D.F. and Derber, J.C. (1992) The National Meteorological Center’s spectral statistical-
interpolation analysis system, Mon. Weather Rev., 120, 1747–1763.
Pérez, C., Haustein, K., Janjic, Z., Jorba, O., Huneeus, N., Baldasano, J. M., Black, T., Basart, S.,
Nickovic, S., Miller, R. L., Perlwitz, J. P., Schulz, M., and Thomson, M. (2011) Atmospheric
dust modeling from meso to global scales with the online NMMB/BSC-Dust model – Part 1:
Model description, annual simulations and evaluation, Atmos. Chem. Phys., 11, 13001–13027,
doi:10.5194/acp-11-13001-2011.

ICAP Aerosol Multi-Model Ensemble
68
Pradhan, Y. (2017) UK Met Office Satellite Applications Technical Memo 63.1.
Randles, C. A., da Silva, A. M., Buchard, V., Colarco, P. R., Darmenov, A., Govindaraju, R.,
Smirnov, A., Holben, B., Ferrare, R., Hair, J., Shinozuka, Y. and Flynn, C. J. (2017) The
MERRA-2 Aerosol Reanalysis, 1980–onward, Part I: System Description and Data Assimilation
Evaluation,, doi:10.1175/JCLI-D-16-0609.s1.
Reddy, M.S., Boucher, O., Bellouin, N., Schulz, M., Balkanski, Y., Dufresne J.-L., and Pham,
M. (2005) Estimates of global multi-comonent aerosol optical depth and direct radiative
perturbation in the Laboratoire de Météorologie Dynamique general circulation model, J.
Geophys. Res., 110, D10S16, doi:10.1029/2004JD004757.
Reid, J. S., Benedetti, A., Colarco, P. R., and Hansen J. A. (2011) International operational
aerosol observability workshop, Bull. Amer. Meteorol. Soc., 92, ES21–ES24,
doi:10.1175/2010BAMS3183.1.
Reid, J. S., Hyer, E. J., Prins, E. M., Westphal, D. L., Zhang, J., Wang, J., Christopher, S. A.,
Curtis, C. A., Schmidt, C. C., Eleuterio, D. P., Richardson, K. A., and Hoffman, J. P. (2009)
Global monitoring and forecasting of biomass-burning smoke: Description and lessons from the
Fire Locating and Modeling of Burning Emissions (FLAMBE) program, IEEE J. Sel. Top.
Appl., 2, 144–162.
Reynolds, R. W., Folland, C. K., and Parker, D. E. (1989) Biases in satellite-derived sea-surface-
temperature data, Nature, 341, 728-731.
Rienecker, M. M., Suarez, M. J., Todling, R., Bacmeister, J., Takacs, L., Liu, H.-C., Gu, W.,
Sienkiewicz, M., Koster, R. D., Gelaro, R., Stajner, I., and Nielsen, E. (2008) The GEOS-5 data

ICAP Aerosol Multi-Model Ensemble
69
assimilation system – Documentation of versions 5.0.1, 5.1.0, and 5.2.0., edited by: Suarez, M.
J., NASA Tech. Memo. 2007-104606, Vol. 27, available at:
http://gmao.gsfc.nasa.gov/pubs/docs/Rienecker369.pdf.
Rubin, J. I., Reid, J. S., Hansen J. A., Anderson, J. L., Holben, B. N., Xian, P., Westphal, D.
L., and Zhang J, (2017) , Assimilation of AERONET and MODIS AOT observations using
variational and ensemble data assimilation methods and its impact on aerosol forecasting skill, J.
Geophys. Res. Atmos., 122, doi:10.1002/2016JD026067.
Sampson, C. R., Franklin, J. L., Knaff, J. A., and DeMaria, M. (2008) Experiments with a Simple
Tropical Cyclone Intensity Consensus, Weather Forecast, 23, 304–312.
Sayer, A. M., L. A. Munchak, N. C. Hsu, R. C. Levy, C. Bettenhausen, and M.-J. Jeong (2014)
MODIS Collection 6 aerosol products: Comparison between Aqua’s e-Deep Blue, Dark Target,
and “merged” data sets, and usage recommendations, J. Geophys. Res. Atmos., 119, 13,965–
13,989, doi:10.1002/2014JD022453.
Schaaf, C. B., et al. (2002) First operational BRDF, albedo nadir reflectance products from
MODIS, Remote Sens. Environ., 83(1-2), 135-148.
Schulz, M., de Leeuw, G., and Balkanski, Y. (2004) Sea-salt aerosol source functions and
emissions, in: Emission of Atmospheric Trace Compounds, edited by: Granier, C., Artaxo, P.,
and Reeves, C.E., Kluwer Acad., Norwell, Mass., 333–354.
Sekiyama, T. T., Tanaka, T. Y., Shimizu, A., and Miyoshi, T. (2010) Data assimilation of
CALIPSO aerosol observations, Atmos. Chem. Phys., 10, 39-49, doi:10.5194/acp-10-39-2010.
Sekiyama, T. T., Yumimoto, K., Tanaka, T. Y., Nagao, T., Kikuchi, M., and Murakami, H. (2016)

ICAP Aerosol Multi-Model Ensemble
70
Data Assimilation of Himawari-8 Aerosol Observations: Asian Dust Forecast in June 2015,
SOLA, 12, 86-90, doi:10.2151/sola.2016-020.
Sessions, W. R., Reid, J. S., Benedetti, A., Colarco, P. R., da Silva, A., Lu, S., Sekiyama, T.,
Tanaka, T. Y., Baldasano, J. M., Basart, S., Brooks, M. E., Eck, T. F., Iredell, M., Hansen, J. A.,
Jorba, O. C., Juang, H.-M. H., Lynch, P., Morcrette, J.-J., Moorthi, S., Mulcahy, J., Pradhan, Y.,
Razinger, M., Sampson, C. B., Wang, J., and Westphal, D. L. (2015) Development towards a
global operational aerosol consensus: basic climatological characteristics of the International
Cooperative for Aerosol Prediction Multi-Model Ensemble (ICAP-MME), Atmos. Chem. Phys.,
15, 335-362.
Shao, Y., Raupach, M., Leys, J. (1996) A model for predicting aeolian sand drift and dust
entrainment on scales from paddock to region. Soil Res. 34, 309-342, doi:10.1071/SR9960309.
Shi, Y., Zhang, J., Reid, J. S., Holben, B., Hyer, E. J., and Curtis, C. (2011a) An analysis of the
collection 5 MODIS over-ocean aerosol optical depth product for its implication in aerosol
assimilation, Atmos. Chem. Phys., 11, 557–565.
Shi, Y., Zhang, J., Reid, J. S., Hyer, E. J., Eck, T. F., Holben, B. N., and Kahn, R. A. (2011b) A
critical examination of spatial biases between MODIS and MISR aerosol products – application
for potential AERONET deployment, Atmos. Meas. Tech., 4, 2823–2836.
Shi, Y. R., Levy, R. C., Eck, T. F., Fisher, B., Mattoo, S., Remer, L. A., Slutsker, I., and Zhang,
J. (2018) Characterizing the 2015 Indonesia Fire Event Using Modified MODIS Aerosol
Retrievals, Atmos. Chem. Phys. Discuss., https://doi.org/10.5194/acp-2018-468, in review.

ICAP Aerosol Multi-Model Ensemble
71
Shi, Y. (2015) Critical evaluations of MODIS and MISR satellite aerosol products for aerosol
modeling applications, Dissertation, University of North Dakota.
Sič, B., L. El Amraoui, A. Piacentini, V. Marécal, E. Emili, D. Cariolle, M. Prather, and J.-L.
Attié (2016) Aerosol data assimilation in the chemical-transport model MOCAGE during the
TRAQA/ChArMEx campaign: Aerosol optical depth, Atmos. Meas. Tech., 5535-5554.
Sindelarova, K., Granier, C., Bouarar, I., Guenther, A., Tilmes, S., Stavrakou, T., Müller, J.-F.,
Kuhn, U., Stefani, P., and Knorr, W. (2014) Global data set of biogenic VOC emissions
calculated by the MEGAN model over the last 30 years, Atmos. Chem. Phys., 14, 9317-9341,
doi:10.5194/acp-14-9317-2014.Smith, M. H. and Harrison, N. M. (1998) The sea spray
generation function, J. Aerosol Sci., 29, S189–S190.
Song C., Woodcock, C. E., Seto, K. C., Lenny, M. P., Macomber, S. A. (2001) Classification and
change detection using Landsat TM data: When and how to correct atmospheric effects? Remote
Sens. of Environ., 75, 230-244.
Spada, M. (2015) Development and evaluation of an atmospheric aerosol module implemented
within the NMMB/BSC-CTM, PhD Thesis, BarcelonaTech, Barcelona,
Spain, http://hdl.handle.net/10803/327593.Spada, M., Jorba, O., Pérez García-Pando, C., Janjic,
Z., and Baldasano, J. M. (2013) Modeling and evaluation of the global sea-salt aerosol
distribution: sensitivity to size-resolved and sea-surface temperature dependent emission
schemes, Atmos. Chem. Phys., 13, 11735-11755, https://doi.org/10.5194/acp-13-11735-2013.

ICAP Aerosol Multi-Model Ensemble
72
Stockwell, W. R., Kirchner, F., and Kuhn, M.(1997) A new mechanism for regional atmospheric
chemistry modeling. J. Geophys. Res. Atmos. 102, 25847-25879.
https://doi.org/10.1029/97JD00849
Tacconi, L. (2016) Preventing fires and haze in Southeast Asia. Nat. Clim. Change, 6 640–3.
Tanaka, T. Y., Orito, K., Sekiyama, T. T., Shibata, K., Chiba, M., and Tanaka, H. (2003)
MASINGAR, a global tropospheric aerosol chemical transport model coupled with MRI/JMA98
GCM: Model description, Pap. Meteorol. Geophys., 53, 119–138.
Tanaka, T. Y., and Chiba, M. (2005) Global Simulation of Dust Aerosol with a Chemical
Transport Model, MASINGAR, Journal of the Meteorological Society of Japan. Ser. II, 83A,
255-278, doi: 10.2151/jmsj.83A.255.
Tanaka, T. Y., and Ogi, A. (2018) On the upgrade of the JMA's global aeolian dust forecasting
model, Sokko Jiho, 84, 109 - 128 (in Japanese).
Toll, V., Gleeson, E., Nielsen, K.P., Männik, A., Mas̆ek, J., Rontu, L., Post, P. (2016) Impacts of
the direct radiative effect of aerosols in numerical weather prediction over Europe using the
ALADIN-HIRLAM NWP system, Atmos. Res., 172–173, 163–173,
doi:10.1016/j.atmosres.2016.01.003.
Tompkins, A. M. (2005) A revised cloud scheme to reduce the sensitivity to vertical resolution,
Tech. Memo. 0599, 25 pp., Res. Dep., Eur. Cent. for Medium-Range Weather Forecasts,
Reading, UK.
Toth, Z. and Kalnay E. (1997) Ensemble forecasting at NCEP and the breeding method. Mon.
Wea. Rev., 125, 3297-3319.

ICAP Aerosol Multi-Model Ensemble
73
Toth, T. D., J. L. Zhang, J. R. Campbell, J. S. Reid, Y. X. Shi, R. S. Johnson, A. Smirnov, M. A.
Vaughan, and D. M. Winker (2013) Investigating enhanced Aqua MODIS aerosol optical depth
retrievals over the mid-to-high latitude Southern Oceans through intercomparison with co-
located CALIOP, MAN, and AERONET data sets, J. Geophys. Res.-Atmos., 118(10), 4700-
4714, doi:10.1002/jgrd.50311.
Wang, J. et. al. (2018) The implementation of NEMS GFS Aerosol Component (NGAC) Version
2.0 for global multispecies forecasting at NOAA/NCEP: Part I Model Descriptions, Geosci.
Model Dev. Under review.
Wang, H. and Niu, T. (2013) Sensitivity studies of aerosol data assimilation and direct radiative
feedbacks in modeling dust aerosols, Atmos. Environ., 64, 208–218.
Weaver, C., da Silva, A., Chin, M., Ginoux, P., Dubovik, O., Flittner, D., Zia, A., Remer, L.,
Holben, B., and Gregg, W. (2007) Direct insertion of MODIS radiances in a global aerosol
transport model, J. Atmos. Sci., 64, 808–827.
Westphal, D. L., O. B. Toon, and T. N. Carlson (1988) A case study of mobilization and
transport of Saharan dust. J. Atmos. Sci., 45, 2145-2175.
Woodward, S. (2001) Modeling the atmospheric life cycle and radiative impact of mineral dust
in the Hadley Centre climate model, J. Geophys. Res., 106, 18155–18166,
doi:10.1029/2000JD900795.
Woodward, S. (2011) Mineral dust in HadGEM2. Technical Report 87, Met Office Hadley
Centre for Climate Change, Exeter, UK, available at: http://sds-was.aemet.es/forecast-
products/dust-forecasts/Woodward_2011_HadGEM2.pdf .

ICAP Aerosol Multi-Model Ensemble
74
Xian, P., Reid, J. S., Turk, J. F., Hyer, E. J., and Westphal, D. L. (2009) Impact of modeled
versus satellite measured tropical precipitation on regional smoke optical thickness in an aerosol
transport model, Geophys. Res. Lett., 36, L16805, doi:10.1029/2009GL038823, 2009.
Yarwood, G., Rao, S., Yocke, M., and Whitten, G. (2005) Updates to the Carbon Bond Chemical
Mechanism: CB05. Final Report to the US EPA, RT-0400675,
http://www.camx.com/publ/pdfs/CB05_Final_Report_120805.pdf.
Yukimoto, S., Adachi, Y., Hosaka, M., Sakami, T., Yoshimura, H., Hirabara, M., Tanaka, T. Y.,
Shindo, E., Tsujino, H., Deushi, M., Mizuta, R., Yabu, S., Obata, A., Nakano, H., Koshiro, T.,
Ose, T., and Kitoh, A. (2012) A New Global Climate Model of the Meteorological Research
Institute: MRI-CGCM3 —Model Description and Basic Performance—, Journal of the
Meteorological Society of Japan. Ser. II, 90A, 23-64, doi:10.2151/jmsj.2012-A02.
Yumimoto, K., Murakami, H., Tanaka, T. Y., Sekiyama, T. T., Ogi, A., and Maki, T. (2016a)
Forecasting of Asian dust storm that occurred on May 10–13, 2011, using an ensemble-based
data assimilation system, Particuology, 28, 121-130, doi:10.1016/j.partic.2015.09.001.
Yumimoto, K., Nagao, T. M., Kikuchi, M., Sekiyama, T. T., Murakami, H., Tanaka, T. Y., Ogi,
A., Irie, H., Khatri, P., Okumura, H., Arai, K., Morino, I., Uchino, O., and Maki, T. (2016b)
Aerosol data assimilation using data from Himawari-8, a next-generation geostationary
meteorological satellite, Geophysical Research Letters, 43, 5886-5894,
doi:10.1002/2016GL069298.
Yumimoto, K., Tanaka, T. Y., Oshima, N., and Maki, T. (2017) JRAero: the Japanese Reanalysis
for Aerosol v1.0, Geosci. Model Dev., 10, 3225-3253, doi:10.5194/gmd-10-3225-2017.
Yumimoto, K., Tanaka, T., Yoshida, M., Kikuchi, M., Nagao, T., Murakami, H., and Maki, T.

ICAP Aerosol Multi-Model Ensemble
75
(2018) Assimilation and Forecasting Experiment for Heavy Siberian Wildfire Smoke in May
2016 with Himawari-8 Aerosol Optical Thickness, Journal of the Meteorological Society of
Japan, 96B, 133-149, doi:10.2151/jmsj.2018-035.
Zhang, J. and Reid, J. S. (2006) MODIS Aerosol Product Analysis for Data Assimilation:
Assessment of Level 2 Aerosol Optical Thickness Retrievals, J. Geophys. Res.-Atmos., 111,
22207, doi:10.1029/2005JD006898.
Zhang, J., Reid, J. S., Alfaro-Contreras, R., Xian P. (2017) Has China been exporting less
particulate air pollution over the past decade?, Geophys. Res. Lett, 44,
doi:10.1002/2017GL072617.
Zhang, J., Reid, J. S., Westphal, D. L., Baker, N. L., and Hyer, E. J. (2008) A system for
operational aerosol optical depth data assimilation over global oceans, J. Geophys. Res., 113,
D10208, doi:10.1029/2007JD009065.
Zhang, J. K.,Y. Sun, Z. R. Liu, D. S. Ji, B. Hu, Q. Liu and Y. S. Wang (2014) Characterization
of submicron aerosols during a month of serious pollution in Beijing, 2013, Atmos. Chem. Phys.,
14, 2887-2903.

ICAP Aerosol Multi-Model Ensemble
76
Table 1. Basic properties and configurations of ICAP input models as of June 2017.
Model MONARCH (former BSC-CTM)
CAMS /IFS
MASINGAR SILAM MOCAGE GEOS-5 NGAC MetUM NAAPS
Organization BSC ECMWF/ CAMS (former MACC)
JMA FMI Meteo France
NASA NOAA UKMO US NAVY
Status QO O QO O O QO O O O Meteorology Inline
NMMB Inline IFS Inline AGCM Offline
IFS Offline ARPEGE
Inline GEOS-5
Inline GFS
Inline UM Offline NAVGEM
Resolution (deg lat x lon)
1.4x1 (0.7x0.5)p
0.35x0.35 0.38x0.38 0.5x05 1x1 0.25x0.31 1x1 0.35x0.23 0.35x0.35
Levels 24 (48) p 60 40 60 47 72 64 70 35 DA LETKFp 4DVar 2DVar
LETKFp 3Dvarp, 4Dvarp, EnKFp
NA 2DVar+LDE
NA 4DVar 2DVar 3DVarp, EnKFp
Assimilated Aerosol Observation
(DAQ MODIS DT+DB)p
DAQ MODIS DT+DB PMAp
MODIS L3 AHIp CALIOPp
NA NA for this release
Neural Net MODIS
NA MODIS Dust AOD
DAQ MODIS L3, VIIRSp
CALIOPp
Species Dust, SS, (BC, OC, Sulfate)p
BC, Dust, OC, SS, Sulfate
BC, Dust, OC, SS, Sulfate
BC, Dust, OC, SS, Sulfate, Nitrate, B. Burning Smoke
BC, Dust, OC, SS, Sulfate, Nitrate, Ammon.
BC, Dust, OC, SS, Sulfate, Nitrate*
BC, Dust, OC, SS, Sulfate
Dust Anthro+Bio. Fine, B. Burn. Smoke, Dust, SS
Size Bins 8 (dust, SS), bulk for othersp
3 (dust, SS), bulk for others
10 (dust, SS), bulk for others
4 (dust), 5 (SS), 3 (B. Burning smoke), 2 (sulfate), bulk for others
6 5 (dust, SS), 2 (BC, OC), 3 (NI*), bulk sulfate
5 (dust, SS), 2(BC, OC), bulk sulfate
2 Bulk
Anthro. and biogenic Emissions
NA MACCity (anthro), MEGAN (biogenic)
MACCity MACCity, STEAM, MEGANE, HTAP (Coarse PM)
MACCity (anthro.) MEGAN-MACC (biogenic)
EDGAR V4.1/4.2, AeroCom Phase II, GEIA
EDGAR V4.1, AeroCom Phase II, GEIA
NA MACCity, BOND, POET
Bio. Burn. Emissions
NA (GFAS)p
GFAS GFAS GFAS, IS4FIRES
MACCity QFED GBBEPx NA FLAMBE
Note: “p” means prototype, and not in operational mode. “O” stands for operational and “QO”
for quasi-operational. Species “SS” presents sea salt. *Nitrate aerosols were added to GEOS-5
near-real time system as of January 24, 2017.

ICAP Aerosol Multi-Model Ensemble
77
Table 2. For each of the 21 AERONET sites used in this study, AERONET Version3 Level1.5
mean total AOD at 550nm and root mean square error (RMSE) for 6-hr and 72-hr forecasts from
the four core ICAP models and the ICAP-MME for June 2016-May 2017. RMSE values are
listed in order from low to high, and ICAP-MME results are shown in boldface. Sample size
refers to the number of valid 6-hour average AERONET AOD observations over this 12-month
time period.
Alta Floresta Brazil, 9S, 56W smoke 0.21 0.11 0.13 0.13 0.14 0.21 0.12 0.14 0.14 0.15 0.16 248
Amsterdam Island Southern Indian Ocean, 38S, 78E
Sea salt 0.07 0.04 0.04 0.05 0.07 0.08 0.04 0.04 0.05 0.06 0.09 273Banizoumbou Sahel, 13N, 2E Dust 0.49 0.21 0.22 0.23 0.29 0.29 0.24 0.24 0.27 0.30 0.33 641Beijing China, 39N, 116E ABF, dust 0.54 0.41 0.41 0.42 0.47 0.48 0.46 0.46 0.49 0.52 0.56 451
Cape Verde Sub-tro. Atlantic, 16N, 22W
Dust 0.42 0.14 0.14 0.16 0.19 0.22 0.18 0.19 0.21 0.25 0.26 393
Cart Site Great Plains, 36N, 97W
Clean 0.09 0.05 0.06 0.06 0.07 0.09 0.05 0.06 0.06 0.08 0.10 612Chapais Quebec, 49N, 74W Clean 0.07 0.03 0.04 0.04 0.04 0.07 0.04 0.04 0.05 0.05 0.06 245Chiang Mai Thailand, 18N, 98E smoke 0.42 0.20 0.22 0.22 0.26 0.29 0.23 0.24 0.25 0.29 0.31 295
Gandhi College Rural India, 25N, 84E Dust, pollution 0.62 0.23 0.23 0.24 0.25 0.29 0.27 0.27 0.28 0.31 0.33 308
GSFC E. CONUS, 38N, 76W Pollution 0.10 0.05 0.05 0.06 0.07 0.09 0.07 0.07 0.07 0.09 0.11 614Ilorin Sahel, 8E, 4E Smoke, dust 0.73 0.33 0.33 0.34 0.37 0.43 0.32 0.39 0.39 0.47 0.51 407
Kanpur Urban India, 26N, 80E Pollution, dust 0.62 0.29 0.30 0.31 0.32 0.32 0.37 0.39 0.39 0.44 0.45 655
Minsk Western Asia, 53N, 27E
Pollution, smoke 0.13 0.06 0.07 0.07 0.08 0.10 0.07 0.09 0.11 0.11 0.14 397
Moldova Eastern Europe, 47N, 28E
Pollution 0.17 0.09 0.11 0.11 0.11 0.12 0.10 0.11 0.13 0.13 0.15 383
Monterey W. CONUS, 36N, 121W
Clean 0.27 0.27 0.46 0.46 0.56 1.01 0.28 0.56 0.58 0.59 1.01 148
Palma de Mallorca Mediterranean, 39N, 2E
Dust, ABF 0.12 0.05 0.05 0.05 0.07 0.08 0.08 0.08 0.08 0.08 0.12 767Ragged Point Caribbean, 13N, 59W African dust 0.17 0.06 0.06 0.07 0.08 0.10 0.08 0.08 0.09 0.10 0.12 416Rio Branco Brazil, 9S, 67W smoke 0.23 0.15 0.15 0.19 0.20 0.21 0.18 0.20 0.20 0.22 0.25 232
Singapore Maritime Cont., 1N, 103E
ABF, smoke 0.28 0.19 0.20 0.22 0.22 0.22 0.22 0.23 0.23 0.25 0.25 410
Mezaira Southwest Asia, 23N, 54E
Dust 0.36 0.15 0.16 0.18 0.21 0.24 0.18 0.19 0.23 0.24 0.43 641
Yonsei University South Korea, 38N, 127E
Dust, Pollution 0.45 0.25 0.26 0.26 0.28 0.30 0.30 0.30 0.32 0.33 0.33 523
sample size
Mean Aeronet total
AOD72-hr forecast RMSE6-hr forecast RMSEsite Location
Main Aerosol type

ICAP Aerosol Multi-Model Ensemble
78
Table 3. AERONET Version3 Level1.5 mean coarse-mode AOD at 550 nm, and ICAP models
root mean square error (RMSE) from their 6-hr and 72-hr forecasts for June 2016-May 2017 for
dust-influenced sites. The RMSEs for the 8 ICAP members and ICAP-MME (bold) are listed
sequentially from low to high for each site.
site
Mean AERONET coarse AOD
Banizoumbou 0.37 0.18 0.18 0.19 0.22 0.23 0.27 0.29 0.45 0.21 0.22 0.22 0.22 0.26 0.28 0.34 0.47Beijing 0.15 0.12 0.12 0.13 0.15 0.15 0.15 0.20 0.29 0.12 0.13 0.13 0.15 0.16 0.17 0.22 0.36Capo Verde 0.33 0.13 0.13 0.14 0.14 0.17 0.21 0.21 0.22 0.16 0.16 0.18 0.19 0.22 0.23 0.23 0.25Gandhi College 0.22 0.11 0.11 0.11 0.13 0.14 0.14 0.17 0.21 0.10 0.10 0.11 0.13 0.15 0.15 0.17 0.22Ilorin 0.42 0.17 0.20 0.20 0.21 0.24 0.24 0.26 0.30 0.17 0.20 0.20 0.24 0.24 0.29 0.30 0.34Kanpur 0.22 0.11 0.12 0.12 0.13 0.13 0.15 0.16 0.19 0.10 0.13 0.14 0.14 0.14 0.15 0.16 0.20Palma de Mallorca 0.06 0.04 0.04 0.05 0.05 0.06 0.06 0.06 0.09 0.06 0.06 0.07 0.07 0.07 0.07 0.10 0.10Ragged Point 0.14 0.07 0.08 0.08 0.08 0.10 0.10 0.11 0.11 0.07 0.09 0.10 0.10 0.10 0.10 0.12 0.12Mezaira 0.22 0.11 0.13 0.13 0.14 0.15 0.21 0.25 0.31 0.12 0.15 0.15 0.16 0.22 0.23 0.36 0.42Yonsei University 0.12 0.07 0.08 0.08 0.10 0.10 0.11 0.11 0.12 0.07 0.07 0.08 0.10 0.11 0.12 0.12 0.15
6-hr dust forecast RMSE 72-hr dust forecast RMSE

ICAP Aerosol Multi-Model Ensemble
79
Table 4. Coefficient of determination (r2) between 2 out of 3 variables: ensemble mean,
ensemble spread and absolute forecast error (AFE) of the ICAP MME for dust AOD 6-hr and 72-
hr forecasts at the dusty AERONET sites. All calculations are based on model and AERONET
V3 Level1.5 data during Jun 2016-May 2017. Value less than 0.04 means the correlation is not
statistically significant at 95% level by Student-t test.
6-hr dust fcst 72-hr dust fcst
site
ensemble mean & AFE
ensemble spread & AFE
ensemble mean & spread
ensemble mean & AFE
ensemble spread & AFE
ensemble mean & spread
sample size
Banizoumbou 0.13 0.08 0.52 0.10 0.06 0.60 647 Beijing 0.13 0.12 0.86 0.16 0.14 0.83 451 Capo Verde 0.19 0.15 0.47 0.12 0.07 0.61 401 Gandhi College 0.05 0.03 0.88 0.06 0.04 0.87 315 Ilorin 0.17 0.09 0.70 0.24 0.16 0.82 409 Kanpur 0.04 0.01 0.59 0.01 0.00 0.68 663 Palma de Mallorca 0.27 0.20 0.83 0.48 0.38 0.79 776 Ragged Point 0.11 0.11 0.83 0.13 0.10 0.80 420 Mezaira 0.54 0.46 0.70 0.57 0.45 0.59 649 Yonsei University 0.03 0.02 0.79 0.03 0.02 0.83 530

ICAP Aerosol Multi-Model Ensemble
80
Table 5. Estimated forecast error for total AOD based on linear regressions of absolute forecast
errors (AFE) on ensemble mean, ensemble spread and both respectively for forecasts with
different forecast hours. Coefficient of determination (r2) between the predicted forecast errors
using the equations below and forecast error of the ICAP MME consensus is also listed. All the
r2 values here are statistically significant at 95% level by student-t test (criteria of 0.04).
forecast hour Total AOD forecast error estimate r2 6-hr AFE=0.00+0.36(+-0.01)*mean 0.27 AFE=0.06+0.59(+-0.01)*spread 0.17 AFE=0.00+0.31(+-0.01)*mean+0.14(+-0.02)*spread 0.27 24-hr AFE=0.01+0.43(+-0.01)*mean 0.26 AFE=0.07+0.79(+-0.02)*spread 0.22 AFE=0.02+0.30(+-0.01)*mean+0.36(+-0.02)*spread 0.28 48-hr AFE=0.02+0.47(+-0.01)*mean 0.25 AFE=0.09+0.74(+-0.02)*spread 0.20 AFE=0.03+0.35(+-0.01)*mean+0.28(+-0.02)*spread 0.26 72-hr AFE=0.01+0.43(+-0.01)*mean 0.23 AFE=0.07+0.61(+-0.01*spread 0.16 AFE=0.01+0.37(+-0.01)*mean+0.12(+-0.02)*spread 0.23 96-hr AFE=0.01+0.45(+-0.01)*mean 0.22 AFE=0.07+0.63(+-0.02)*spread 0.16 AFE=0.02+0.38(+-0.01)*mean+0.16(+-0.02)*spread 0.23
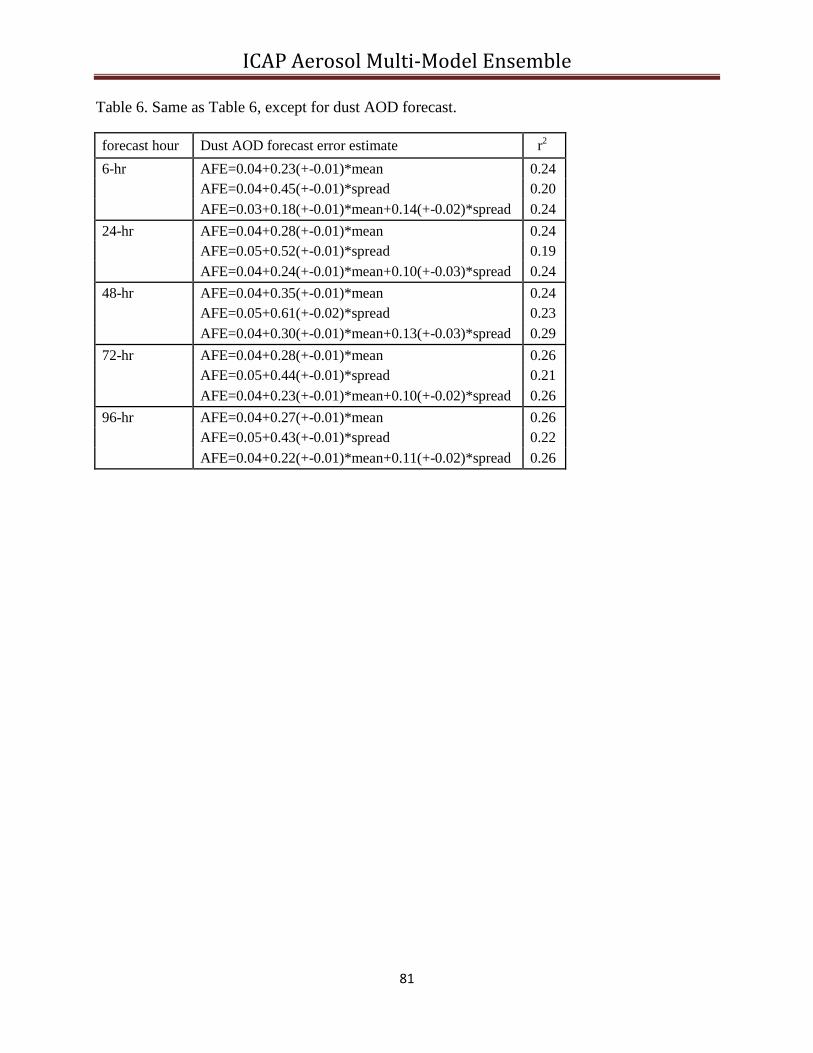
ICAP Aerosol Multi-Model Ensemble
81
Table 6. Same as Table 6, except for dust AOD forecast.
forecast hour Dust AOD forecast error estimate r2 6-hr AFE=0.04+0.23(+-0.01)*mean 0.24 AFE=0.04+0.45(+-0.01)*spread 0.20 AFE=0.03+0.18(+-0.01)*mean+0.14(+-0.02)*spread 0.24 24-hr AFE=0.04+0.28(+-0.01)*mean 0.24 AFE=0.05+0.52(+-0.01)*spread 0.19 AFE=0.04+0.24(+-0.01)*mean+0.10(+-0.03)*spread 0.24 48-hr AFE=0.04+0.35(+-0.01)*mean 0.24 AFE=0.05+0.61(+-0.02)*spread 0.23 AFE=0.04+0.30(+-0.01)*mean+0.13(+-0.03)*spread 0.29 72-hr AFE=0.04+0.28(+-0.01)*mean 0.26 AFE=0.05+0.44(+-0.01)*spread 0.21 AFE=0.04+0.23(+-0.01)*mean+0.10(+-0.02)*spread 0.26 96-hr AFE=0.04+0.27(+-0.01)*mean 0.26 AFE=0.05+0.43(+-0.01)*spread 0.22 AFE=0.04+0.22(+-0.01)*mean+0.11(+-0.02)*spread 0.26

ICAP Aerosol Multi-Model Ensemble
82
Table 7. Contribution of each individual model to the ICAP MME in the 6-hr and 72-hr forecasts
for dust AOD at 550 nm. One year mean (June 2016-July 2017) absolute forecast errors from
the ICAP MME are listed, as well as those from ensembles based on 6 of 7 dust models with
Model 1 (M1), Model 2 (M2), Model 3 (M3), Model 4 (M4), Model 5 (M5), Model 6 (M6) and
Model 7 (M7) removed from the ensembles respectively. Percent change of mean absolute
forecast error resulting from the removal of each individual model at each site and the average
change of all sites are also shown.
siteDust 6hr fcst error
Banizoumbou 0.14 0.16 8% 0.15 5% 0.15 1% 0.15 6% 0.14 -1% 0.12 -15% 0.15 4%Beijing 0.08 0.07 -3% 0.08 1% 0.07 -4% 0.07 0% 0.08 5% 0.08 1% 0.08 10%Capo Verde 0.08 0.09 4% 0.09 7% 0.09 4% 0.09 2% 0.08 1% 0.08 -7% 0.09 3%Gandhi College 0.11 0.11 -1% 0.11 4% 0.11 -1% 0.10 -5% 0.11 3% 0.10 -8% 0.12 12%Ilorin 0.10 0.10 2% 0.10 4% 0.10 -1% 0.10 0% 0.10 3% 0.10 2% 0.10 6%Kanpur 0.09 0.09 1% 0.09 2% 0.09 -2% 0.08 -5% 0.09 1% 0.08 -9% 0.10 18%Palma de Mallorca 0.03 0.03 -2% 0.03 3% 0.03 3% 0.03 -1% 0.03 5% 0.03 0% 0.03 10%Ragged Point 0.05 0.05 0% 0.05 2% 0.05 -3% 0.05 -4% 0.05 0% 0.05 -3% 0.06 15%Mezaira 0.09 0.09 1% 0.10 4% 0.09 0% 0.09 1% 0.10 12% 0.08 -13% 0.09 2%Yonsei University 0.06 0.06 -2% 0.06 -3% 0.06 0% 0.06 -4% 0.07 10% 0.06 -5% 0.07 10%average Dust 6hr-fcst 1% 3% 0% -1% 4% -6% 9%average Dust 72hr-fcst -1% 2% 0% 2% 6% -2% 5%
w/out M6 w/out M7w/out M1 w/out M2 w/out M3 w/out M4 w/out M5

ICAP Aerosol Multi-Model Ensemble
83
Figure 1. Data availability of ICAP models and ICAP-MME between December 2011 and
January 2018. FMI/SILAM model is not shown here because it is a relatively new member and is
currently being incorporated into ICAP.

ICAP Aerosol Multi-Model Ensemble
84
Figure 2. ICAP model 550 nm total, fine, coarse, and dust AOD RMSE versus corresponding
mean AODs for AERONET sites listed in Table 2. Verification of the 6-hr forecasts are on the

ICAP Aerosol Multi-Model Ensemble
85
left, and the 72-hr forecasts on the right. Large black dots are ICAP-MME consensus means.
Individual models are in small colored dots. Validation of dust AOD is based on AERONET
coarse-mode AOD at dusty sites listed in Table 3. Monterey site is excluded in the total and fine
AOD validation/regression as it is an outlier with its anomalously high and variant biomass-
burning smoke levels that resulted from a months-long local wildfire event in the Fall of 2016.

ICAP Aerosol Multi-Model Ensemble
86
Figure 3. Comparison of ICAP models and AERONET V3 L1.5 550nm AODs at 550 nm for
Capo Verde, an African-dust-influenced site off the west coast of Africa. Included are (a) dust
AOD from the 6-hr forecasts of ICAP models (individual members in colors and ICAP-MME in

ICAP Aerosol Multi-Model Ensemble
87
black) and the coarse-mode AERONET AOD; b) same as a) except for total AOD. c-d-e)
percentiles (95, 90, 75, 50, 25, 10 and 5th) of Dust/Fine/Total AODs of the ICAP model 6-hr
forecasts and the paired AERONET data (paired with ICAP-MME, in red). Also shown are the
mean model/AERONET AOD values (black plus), RMSE of each model (green triangles) and
the coefficient of determination (r2, red dots) against AERONET observations. f-g-h) same as c-
d-e) except for the 72-hr forecasts. All available model data is used in the time series plots, and
only paired (paired with AERONET) data is used in the histograms.

ICAP Aerosol Multi-Model Ensemble
88

ICAP Aerosol Multi-Model Ensemble
89
Figure 4. Comparison of ICAP models and AERONET V3 L1.5 AODs at 550 nm for Beijing.
Included are (a) dust AOD from the 6-hr forecasts of ICAP models (individual members in
colors and ICAP-MME in black) and the coarse-mode AERONET AOD; b) same as a) except
for fine-mode AOD. c-d-e) percentiles (95, 90, 75, 50, 25, 10 and 5%) of Dust/Fine/Total AODs
of the ICAP model 6-hr forecasts and the AERONET data (paired with ICAP-MME, in red).
Also shown are the model mean AOD (black plus), RMSE of each model (green triangles) and
the coefficient of determination (r2, red dots) against AERONET observations. f-g-h) same as c-
d-e) except for the 72-hr forecasts. i, j) Terra true color image and AOD respectively for October
13, 2016, with “B” marking the location of Beijing.

ICAP Aerosol Multi-Model Ensemble
90
Figure 5. Mean total AOD at 550 nm averaged between Jun 2016 and May 2017 for (a) ICAP-
MME 6-hr forecast (spatially and temporally sampled to match MODIS DA-quality data), and
(b) DA-quality MODIS C6, and (c) the total number of 6-hrly DA-quality MODIS AOD data. In
(a) and (b), only area with DA-quality MODIS data count greater than 15 is shown.

ICAP Aerosol Multi-Model Ensemble
91
Figure 6. DA-quality MODIS C6 median, 25th and 75th percentiles of total AOD at 550 nm for
Jun 2016 – May 2017 time period, and ratios of these quantities from the ICAP-MME 6-hr and
72-hr forecasts to MODIS. ICAP-MME data is spatially and temporally sampled to match
MODIS C6 data. Same as Fig. 5, only area with DA-quality MODIS data count greater than 15 is
shown.

ICAP Aerosol Multi-Model Ensemble
92
Figure 7. 550 nm mean AOD bias, RMSE and coefficient of determination (r2) of the 6-hr
forecasts (initialized with 00Z analysis) from the four ICAP core models and the ICAP-MME
verified against the DA-quality MODIS C6 data for Jun 2016 – May 2017 time period. The
numbers inside AOD bias, RMSE and r2 plots are global mean absolute error (AE), RMSE and
r2. Same as Fig. 5 and 6, statistics are only calculated for grids with DA-quality MODIS data
count greater than 15.

ICAP Aerosol Multi-Model Ensemble
93
Figure 8. Average ensemble mean and spread of total, fine and coarse-mode AODs at 550 nm
among the four core ICAP models for their analysis (approximated with the 6-hr forecasts) mode
and the difference relative to the forecast mode (using the 72-hr forecasts) for June 2016-May
2017. The two columns on the left are ICAP-MME mean and spread of total/fine/coarse AODs
for the analysis mode. The two columns on the right are the difference between the forecast
mode and the analysis mode. Global mean values of the ensemble mean/spread and the
differences are also shown for each size mode and forecast mode.

ICAP Aerosol Multi-Model Ensemble
94
Figure 9. Average ensemble mean and spread of dust AOD at 550 nm of the ICAP DA models at
their analysis mode, and the differences from their forecast mode, and from all models at their
analysis and forecast modes for Jun 2016-May 2017. a, b) ensemble mean and spread of the 6-hr
forecasts of the DA models; c, d) difference from the 72-hr forecast of the DA models; e, f)
difference from the 6-hr forecasts of all 7 dust models. g, h) difference from the 72-hr forecasts
of all 7 dust models.

ICAP Aerosol Multi-Model Ensemble
95
Figure 10. ICAP MME absolute AOD forecast error (AFE) of the 72-hr forecasts versus
predicted error using the multivariate regression equations listed in Table 5 and 6. a) Total AOD,
b) Dust AOD. “M” stands for ensemble mean and “S” for ensemble spread in the regression
relations inside of the plotting area.

ICAP Aerosol Multi-Model Ensemble
96
Figure 11. Time series of AERONET AOD and ICAP-MME consensus mean AOD with forecast
error estimate derived from the multivariate regression models for the 72-hr forecasts of a) Dust
AOD at Capo Verde, b) Total AOD at Beijing. Magenta crosses indicate AERONET AOD
observations.

ICAP Aerosol Multi-Model Ensemble
97
Figure 12. Evolution of ICAP-MME performance in terms of RMSE of total AOD at 550 nm of
the 6-hr forecasts for the 21 AERONET sites shown in Table 1, over 2012-2017 time period. The
number inside of each grid represents yearly mean AERONET V3L1.5 total AOD at 550 nm for
the site and year. RMSE is shown in color. “NaN” means not enough data points (at least 100)
for evaluation.

ICAP Aerosol Multi-Model Ensemble
98
Figure 13. Evolution of ICAP individual models and MME fine-mode and dust 550 nm AOD
RMSE of the 72-hr forecasts at Beijing and Kanpur over 2012-2017. Individual models are in
color bars and ICAP-MME in black bars. Models 1 to 7 are in red, green, blue, orange, light
blue, scarlet and dark green, respectively, which are also in sequence in the dust AOD

ICAP Aerosol Multi-Model Ensemble
99
histograms. Also shown are AERONET yearly mean fine-mode and coarse-mode AOD in purple
pluses and standard deviation in purple stars.

ICAP Aerosol Multi-Model Ensemble
100
Figure 14. Ranking of ICAP-MME among all the models in terms of total AOD RMSE over
2012-2017 for a) the 6-hr forecasts and b) the 72-hr forecasts. The number inside of each grid
represents total number of paired 6-hrly AERONET and ICAP-MME data for the site and year.
Ranking of ICAP-MME is shown in color. This is basically what is shown in Table 2, except for
consecutive years.