iceland’s financial crisis and level of...
TRANSCRIPT

1
Iceland’s Financial Crisis and Level of Living Consequences
by
Stefán Ólafsson
Working Paper no. 3:2011
Þjóðmálastofnun Social Research Centre,
University of Iceland December 2011

2
Summary The financial crisis in Iceland came as a major collapse of the country’s financial system in October 2008. It happened in the wake of a build-up of what has been described as the world’s largest bubble economy, in relation the size of the national economy. Given the enormity of these developments the consequences for level of living were expected to be very serious indeed.
Now three years after the collapse we are in a position to assess the extent of the consequences and how governmental and other policies have mediated the crisis effects on the population. The government that came to power in February 2009, after protests in the streets of Reykjavik drove the previous government from power, pledged its goal of being a Nordic welfare government, which would aim to shelter the lower and middle-income groups against the worst consequences of the crisis. In a way these were big promises since the governmental finances were in ruins, with the budget deficit being almost 14% at the end of 2008.
The government went into a standby program with the IMF that ended in the autumn of 2011, with most of the goals relating to resurrection of the financial system and containment of public finances having been achieved. The IMF declared Iceland as a graduate with flying colours. Growth of 3-4% is expected in 2011 and some growth for the next years, while the extent of government debt seems set to be reduced from 2013 onwards. The government had also declared that it aimed to safe the welfare state against cuts as far as possible. In effect that meant less expenditure cuts for welfare issues than for other fields. That has in effect been the case. The public budget situation was mended with a mixed way of expenditure cuts and tax increases, in similar proportions, with taxes raised particularly on higher income groups.
We profile the level of living consequences of the crisis up to 2011 and the policy responses. The report ends with an overall assessment of how policy has affected the level of living of various income groups.
On the whole the indicators and policy descriptions indicate that the main goals have been achieved to date. The more vulnerable groups and lower income groups in general have had less extensive cuts in real living standards than the higher income groups. While the whole nation has suffered a setback in living standards that take it on average back to the state it was at around 2003-4, the lower income groups have not gone as far back as that and higher income groups are closer to the level they were at around 2000. This was achieved by raising specifically minimum pensions for old age and disability pensioners, the minimum wage was also increased a little while general wages remained little changed, the social assistance allowance was raised significantly and the universal flat rate unemployment benefit was increased a little in 2009-10. Pensions for higher earning pensioners were however cut somewhat. Subsidies for interest costs of housing mortgages were greatly increased, so that it is not uncommon that about a third of the interest cost for lower income households is now paid by government.
Direct tax rates on lower incomes were in effect cut a little both in 2009 and 2010 while they were raised on higher incomes. That was done by introducing higher tax rates for higher income groups and also by raising the tax on financial earnings as well as by introducing a new wealth tax aimed at those who had accumulated great fortunes during the preceding decades.
The government introduced various debt relief programs, in cooperation with financial institutions, pension funds and the labour market partners. These were generally targeted at households in greater need rather than flat rate across the board. Some interest groups and politicians had called for a flat rate cut but that was estimated to be both too costly for taxpayers and inefficient in alleviating the greatest problems. About 15% of households are still in great difficulty in making ends meet. The government continues to review results of the debt relief programs with the aim of making them more efficient. Various programs of activation amongst the unemployed have been introduced and previous ones strengthened. These have been useful, but there is disappointment over lack of investments in new jobs to date. Policy additions in 2011 have generally been ones of fine-tuning and reinforcing previously introduced measures.

ICELAND
3
Content
Part 1. The Collapse and its Consequences
Executive summary
1. General characteristics of the crisis
2. Level of living consequences
2.1 Economic and financial aspects 2.2 Real wages and disposable earnings developments 2.3 Debt accumulations of households
Part 2. The Policy Responses in 2010-2011
3. Statistics of policy reactions
4. Policy profiles – What was and is being done? 4.1 Political and social environment 4.2 Debt relief for households 4.3 Reducing unemployment 4.4 Result of policies – Were the goals achieved? 4.4.1. Sheltering the lower income groups: Outcomes 4.4.2. Reducing inequality: Outcomes
Appendix I: Poverty developments 2003-2010 Appendix II: Iceland’s Economic Fundamentals References and notes

ICELAND
4
Part 1. The Collapse and its Consequences
1. General Characteristics of the Crisis
Iceland’s crisis that set in after the spectacular collapse of the country’s banking system in October 2008 was indeed a deep and difficult crisis. It came in the wake of a build-up of what has been described as the largest bubble economy in history, in relation to the size of the national economy. The financial collapse was accordingly also of historical proportions, given the size of the three main banks that were at the centre of the whole saga. The fall of the stock market index from its height was steeper and faster than the collapse on Wall Street in 1929-32 and the debt accumulation associated to the bubble was exceptionally large (Ólafsson 2011b). The crisis was at the same time a banking crisis, a currency crisis (the value of the Icelandic Krona came down by about a half), an economic recession and a crisis of politics and societal trust. So it was a very serious setback for the economy and society. In the period from 1995 and up to the collapse neoliberal policy emphasis had been predominant in Iceland, with growing strength during the 2000s. This involved a very strong confidence in the power of markets, including financial markets, to self-regulate their operations and deliver growth. A part of the prevailing ethos was a strong dose of laissez faire and the private sector was increasingly seen as having advantages over the public sector as a provider and caretaker of services and to some extent governance. Tax cuts, privatization and business competitiveness became priority goals. That orientation increased the power and freedom of finance and needless to say is now associated to the build-up of the extreme bubble economy. These were rather extreme developments for a Nordic welfare state. Iceland’s entry into the European Economic Area Zone (EEA) in 1995 introduced the four freedoms of the European Union into the Icelandic political economy, with full freedom for the flow of capital across borders being the most novel and consequential aspect. That was an important change of political economy environment. The privatization of the main state banks, which was started in 1998, proved to be a major turning point in terms of financial operations in Iceland. When the banks were fully privatized, at the beginning of 2003, the new owners turned them on the spot into aggressive investment banks. They greatly increased their participation in leveraged mergers and acquisitions, first within Iceland but then to a greater extent in the neighbouring countries. External debt escalated and excessive risk behaviour became predominant in the Icelandic financial and business environment, driven by the quest for accumulation of assets, profits and bonuses (PIC - Parliamentary Investigation Committee into the Collapse of the Banks, 2010). With the easy flow of borrowed foreign capital, at low interest rates, the economy had ample resources for rapid growth, which soon turned into an excessive speculation bubble (cf. Kindleberger and Aliber 2005; Minsky 2008/1986). Already by end of 2004 Iceland had become the world’s most heavily indebted economy, measured as gross external debt in % of GDP. Before the collapse of the banks in October 2008 the foreign debt had grown to about eight times the size of the country’s GDP, a high-risk situation and totally unsustainable once the growth was slowed down (Buiter and Sibert 2008; Ólafsson 2008; Daníelsson and Zoega 2009; PIC 2010). IMF and others have claimed that Iceland’s financial crisis is the most costly one in history, in relation to GDP (IMF 2010). Furthermore, if the collapse of the three commercial banks were

ICELAND
5
taken as one entity the banks would count as the third largest bankruptcy in the US history of bankruptcies. Given that Iceland has a population of only 0.1% of the US population the proportional size of the collapse is clearly enormous (Halldórsson and Zoega 2010). This policy environment was rather negative towards public social protection. In the field of pensions, for example, the goal was aired that the funded occupational pensions (in care of the labour market partners) should replace the public social security, as were ideas of increased public-private partnerships in the field of welfare. Increasing self-sufficiency was also preached and exemplified in the emphasis on establishing individual pension accounts, which became effective with tax exemption incentives from 1997 (law no. 129/1997). While this was a welcomed broadening of pension savings the atmosphere towards the public role in pensions eroded somewhat, it was for example reflected in the lagging of social security minimum pensions behind pay developments from 1995 to 2003. The attitude towards inequality became much more lenient than before, especially amongst the ruling politicians on the right and in business and finance quarters. The new government that came to power after the financial collapse, i.e. in February 2009, was a social-democratic led government, pledging to change policies and aim more than before towards the Nordic welfare model. Hence it characterized itself as “Nordic Welfare Government”. Previously the reigning powers had been looking more towards the USA as a model, taking significant steps towards a more of unrestrained capitalism. The new governmental policy emphasis was seen as involving the need for a more confident public sector able to regulate and restrain the tendencies of the private sector (business and finance) towards inequality and disruption. Thus egalitarian and security goals should be strengthened and the lower and middle incomes groups sheltered against the worst consequences of the crisis. That policy goal has been prominent for the last three years and shaped some of the measures undertaken in the field of social protection, taxes, welfare monitoring and services. Seriously strained public finances were though obviously a limit on possibilities for deliveries, given the great need to balance the budget. At the start of the crisis the government budget had a deficit of about 13,5% of GDP. That is now expected to have evened out by 2013 (the previous plan was to reach that position in 2012). The deficit is expected to be in the region of 4% this year (Central Bank of Iceland 2011). Given the enormity of the crisis it is of considerable interest to assess the level of living consequences and how government and society has succeeded in combating the multiple challenges that were involved. Now three years after the collapse we can say that the consequences seem to have been not as deep and serious as originally expected and predicted. We hope to show that in this report. We can also assess the effectiveness of the policy reactions and the choices made through the depths of the crisis, particularly in the fields of level of living and social inclusion. It now appears that the strategy of using the social protection system to shelter the most vulnerable social groups has at least partly succeeded. The distribution of income which had become much more unequal from 1995 to 2007 has reversed towards less inequality in 2008 through 2010, even though it is not likely to have turned fully towards the level of equality that prevailed before the policy shift from 1995. (Kristjánsson and Ólafsson 2010) Iceland’s cooperation with the IMF defined the main features of the financial resurrection of the banking and monetary system along with mending the public finances, which collapsed with the extra cost of refinancing the banks (including the Central Bank which became literally bankrupt) and the general slowdown of economic activity following the crash. The IMF program ended in the autumn of this year and has been deemed very successful (http://www.imf.org/ external/country/ISL/index.htm.).

ICELAND
6
Hence the tone now in the autumn of 2011 is that Iceland’s financial and economic fundamentals are mowing forwards in a positive way. The net debt level of government is now expected to be in the region of 75% of GDP and estimated to go down to 43% by 2013, a significantly lower level than presently found in many European countries, many of whom will have even higher debt levels in 2013-2015 (OECD, Economic Survey of Iceland 2011). In fact it seems that while Iceland will have started to pay down its public debts in 2013-2015 many other nations in Europe and the USA will still most likely be collecting further public debts at that time (Ministry of Finance 2011). In the following sections we will describe the level of living consequences of the crisis further with statistics, before turning to more direct surveying of policy reactions up to the present.
2. Level of living consequences
2.1 Economic and employment aspects In figure 1 we show the total contraction of GDP due to the crisis. The figures in the graph are accumulated growth rates for 2008, 2009 and 2010 in the EU countries, the USA and Japan.
Figure 1: Accumulated change of GDP from 2008 through 2010 (%). Source: Eurostat As is evident from the graph Iceland’s overall contraction from 2008 through 2010 was indeed quite high, close to 10% (there was growth of about 1% in 2008 so the overall contraction in 2009 and 2010 was close to 11%). Iceland experienced the fifth greatest contraction of its economy, after Latvia, Estonia, Lithuania and Ireland. Following Iceland are Croatia, Greece, Italy and Hungary. It is also interesting that Finland and Denmark are next in line after Hungary. It is also interesting that the countries that went perhaps in the biggest way in for neoliberal financial policies are the ones hardest hit, i.e. the Baltic states and Ireland, along with Iceland. But given that Iceland’s speculation indicators (rise and fall in the stock market index and debt accumulation) were the most extreme ones one might have expected that Iceland should top this
!

ICELAND
7
list of GDP contractions. Perhaps the decline of the Icelandic currency has a role in this, since that has helped export industries, albeit at the cost of reducing real purchasing power of the general public. Stronger exports and a record number of foreign tourists in 2009 and 2010 have also helped. Hence unemployment has not become as big a problem as might have been expected given the size of the collapse and the depth of the contraction. Some countries that have had more contraction than Iceland have significantly higher unemployment rates. This applies for example to Greece, Hungary, USA, Italy, Denmark, Finland and Sweden, as can be seen in figure 2.
Figure 2: Unemployment level at the end of 2010 (Source: Eurostat and Statistics Iceland) Source: Eurostat
Iceland has in fact remained at an unemployment rate blow the EU average throughout the whole of the recession period. Figure 2 refers to the last quarter of 2010. New figures for quarter 3 in 2011 show Iceland with 5.9% unemployment.
Figure 3: Changing employment volumes (employment population rate on left and weekly working-hours on the right hand side). Source: Statistics Iceland
Hence the unemployment problem has not been excessive by international standards. Iceland however has generally had a very good employment position through the post-war decades and this is the highest rate experienced during that period. Figure 3 shows that the employment participation rate has come down, but more so for males than females. The weekly working hours have also come down a bit for those still in employment (average for both full time and part-time
!
!"#
!$#
!%#
!&#
!'#
'"#
'$#
'%#
'&#
''#
("#
$"")# $""%# $""*# $""&# $""!# $""'# $""(# $"+"#
,-.#
/01-.#
!"#$%
!&#&% !!#$%
&'#$% &!% &!#"%
(%
'%
$(%
$'%
)(%
)'%
&(%
&'%
!(%
!'%
'(%
)((&% )((!% )(('% )((*% )(("% )((+% )((,% )($(% )($$%
-./01%
203./01%

ICELAND
8
individuals). So the overall volume of work has come down. Table 1 further outlines changing employment patterns, referring to youth and long-term unemployment.
Table 1: Changing patterns of working volumes (figures are for Q3 in all years)
2007 2008 2009 2010 2011
Total unemployment 2.1 2.5 6 6.4 5.9
Youth unemployment (16-24) 5.2 4.8 12.3 11.1 9.5
Long-term unemployment:
6 to 11 months (%) 3 1.4 29.1 22.6 13.4
One year or more (%) 5.6 4.2 7.8 23.1 29.1
Overall weekly working hours (M+F)
43.3 43.6 40.9 40.4 41.3
Source: Statistics Iceland
As in other European countries youth unemployment has increased during the crisis. This however reached its top in 2009 and has come down a bit since then. Long-term unemployment has however increased up to the present, in the sense that the group that has been unemployed for 12 months or more has grown in size up to 3rd quarter of this year (2011). So that is an important task to deal with for government and the labour market.
Figure 4: Employment population rate by end of 2010 (Source: Eurostat). Source: Eurostat
Despite this increase in unemployment and generally reduced volumes of work Iceland still has a high level of work volumes. It has indeed fallen, but that fall is from the highest levels of employment participation in the West. As figure 4 shows Iceland’s employment population rate (% of people at working ages in employment) was the second highest at 78% in 2010, closely following Switzerland. Before the crisis Iceland was hovering around 85% and the very latest labour force survey (3rd quarter of 2011) show an increase from 78% to 81%. So that is already a significant improvement during 2011.
With the EU average being at 64% in 2010 Iceland is indeed in a good position and well above the EU 2020 goals. The main reasons for Iceland’s high employment participation rate are late
!

ICELAND
9
retirement of the elderly, high female participation rate and a tradition of double earner households supported by ample pre-school facilities for young children, even from the age of 1 years. People with disabilities also have a high employment participation rate (Hannesdóttir et.al. 2010).
2.2 Real wages and disposable earnings developments
In a way the most visible effect of the crisis for the general public is the cut in living standard effected by the fall of the Icelandic Krona, which while helping the export industries increased inflation greatly and thus reducing the purchasing power of wages which generally remained little changed during 2009 and 2010. That led to a great reduction of the real wage level as figure 5 shows, perhaps the largest real wage cut in Europe and North America (ILO 2011).
Figure 5: Change in the real wage index, 12 months % change from September to September, 1990-2011 Source: Statistis Iceland
The total cut in real wages amounted to just over 12%. While that is large and difficult to implement in any modern society it should be looked at in the context of the rather high rises in the years preceding the collapse. The collapse came in the wake of the bubble economy during which demand for labour increased greatly, thus facilitating rather high wage rises. Hence the net outcome of the cut is that the real wage level moves back to about the year 2003-4, before the build-up of the extreme bubble economy. During 2010 there was already some increase in the real wage level and that has continued up to September of 2011. So almost a third of the cut seems already to have been regained, but that recovery continues to be sensitive to inflation developments.
So this reflects the development of real wages amongst those that kept their jobs in the labour market. The crisis has been felt more deeply in the household sector as a whole. That is due to reduced work volumes (less overtime, more unemployment), reduced extra benefits, higher taxes and increased debt burden. When all of these factors are taken into account along with the real wage cuts, in an assessment of the real disposable earnings of the household sector, the cuts in living standard are indeed significantly higher. This is reflected in figure 6, which shows the total cut in per capita disposable earnings of the household sector in historical context, i.e. compared to the period from 1955.

ICELAND
10
Figure 6: Cuts in real purchasing power of per capita disposable earnings in historical context, 1955-2010. Source: National Economic Institute and Statistics Iceland
One of the significant characteristics of this graph is the large degree of variation. While most of the years show a favourable increase in overall economic living standards there are also significant downsides, in recession years. Icelandic governments have in the most of the post-war period relied heavily on devaluations of the currency to combat recessions and these have generally produced steep cuts in real disposable earnings by way of steep price rises. The overall cut in real per capita disposable earnings during the present crisis is in the region of 29%, which is very large by all comparative accounts. But in the historical context a few periods have approached this extreme experience. Hence the period of economic stagnation and recession between 1988 and 1994 saw an overall cut of just over 23%.
As with the real wages we can note that the big cuts in 2009 and 2010 came in the wake of great rises of living standards and in fact when we subtract the cuts from the increases of the previous years we find that the Icelandic living standard has on average been set back to 2003-4, as was the case with the real wages in figure 5.
But note that this is the average for the whole household sector. As we show in a later section of this report the cuts as well as the rises affected different income groups very differently (Kristjánsson and Ólafsson 2010). The cuts in real disposable earnings during the crisis were by far the greatest amongst the top income groups but the lower groups were sheltered and got smaller reductions than the middle groups. The cuts in disposable earnings for the median income group is hence significantly lower than the average shown in figure 6.
We return to this in a later section and show the distributional aspect of the policies that were implemented to combat the crisis consequences. 2.3. Debt accumulation of households As already indicated debt burden of households has increased greatly during the crisis and in many ways that has been the key concern of the public as well as politicians. While we turn to the policies of debt relief in a later section we here give first an account of the debt situation of households and how that changed in the advent of the crisis as well as during the recession.
-7.7
10
.5
-5.2
11
.2
2 0.
4 1.6
11 11
.8
10.3
11
.9
5 -2
.7
-8.4
-6.1
17
.1
15.1
8.
4 7.
3 11
.6
-15.
1 2.
3 15
.5
8.5
2 1.
1 5.
5 2.
2 -1
2.5
-2.5
10
.8
9.5
25.8
-2
.7
-9.4
-4
.6
2.5
-3.3
-6
.8
0 3.
8 3.
9 5.
9 7 4.
7 5.2
-1.2
0.
2 4.
2 5.3
7.7
6.3 7.
6 -0
.6
-16.
4 -1
2.6
-20
-15
-10
-5
0
5
10
15
20
25
30
1955
19
56
1957
19
58
1959
19
60
1961
19
62
1963
19
64
1965
19
66
1967
19
68
1969
19
70
1971
19
72
1973
19
74
1975
19
76
1977
19
78
1979
19
80
1981
19
82
1983
19
84
1985
19
86
1987
19
88
1989
19
90
1991
19
92
1993
19
94
1995
19
96
1997
19
98
1999
20
00
2001
20
02
2003
20
04
2005
20
06
2007
20
08
2009
20
10
% c
hang
e fro
m p
revi
ous
year

ICELAND
11
As indicated at the beginning of this report debt accumulation of the economy was one of the key risk factors that both fed the extreme bubble economy development and led to the fall of the banks when they could no longer feed on increasing asset prices and further borrowing in the international financial market. While most of the increased debt levels were in firms and businesses, as well as in the banks, the households also increased their debt levels significantly, even if only a fraction of the increase of businesses’ debts. The debt level of businesses went up from about 60% of GDP in 2002 up to about 330% of GDP in 2008, or more than five fold. The banks themselves owed about 7-8 times the GDP abroad on the eve of their collapse (Ólafsson 2011b).
Household debts had been in the region of 80% of GDP in 2000-2001. It started to increase at a fast rate from about 2004 after the banks entered the housing mortgage market and offered debt conversions with longer periods for payback and increased loans with the added value of the housing assets which went up with the bubble. Hence households were offered possibilities for accumulating more debts than had previously been the norm. With housing prices rising rapidly from 2004 young people entering the housing market had to buy more expensive properties and hence started their housing ownership career with higher debts than previously prevailed. The debt levels of households accordingly went up from about 80% to about 127% of GDP by 2008. The level has since come down to about 110% of GDP by early 2011 (Central Bank of Iceland 2011b). A part of this debt level is also consumer loans, such as for purchases of cars, which were often financed with loans in foreign denominated currencies that increased by about 50% with the collapse of the Krona.
In a nationally representative survey amongst the public (18 years and older), undertaken for the Federation of Labour in June 2009, about 19% said they need special measures to be able to handle their debts servicing. The survey was repeated in December 2009 and then about 17% said the same, indicating a slightly improved situation. About 87% said in December that they have made use of some of the measures offered, whereas about 70% had done so in June. Between June and December the new general measures for rescheduling the debt burden had been implemented (see www.asi.is and www.island.is).
The Central Bank of Iceland did a major survey of the debt position of all households in Iceland at the beginning of 2009. This survey covered all debts (mortgages, car loans, consumer loans) and related them to the values of the family’s assets and later added the family income to the picture. In June 2009 the bank’s conclusion was that about 22% of households had difficult or unsustainable debts, whereas about 78% should be able to deal with their problems (data available on www.sedlabanki.is).
In March 2010 the bank updated its survey and still found about 20-25% of households with a very difficult debt or financial position. The assessment of the bank at the time was that the government measures to date had helped about a quarter to a fifth out of unsustainable problems. So it appeared that the measures had only stopped the problem from getting worse at the time, instead of reducing it significantly. This result is somewhat at a variance with the results from the Gallup survey of December 2009, done for the Federation of Labour. The message seemed to be that further measures were needed to alleviate the problem, but problems of financing were bound to restrain the options of government.
The most recent estimate of the Central Bank is that defaults of household debts have continued to increase during the crisis, but about two thirds of those on the default registry were there already before the collapse. Hence one can assume that the banks had allowed many households to go too deep into debt during the bubble economy period. The debt position seems to be improving slightly during 2011 (Central Bank of Iceland 2011b, pp. 38-40).

ICELAND
12
Part 2. The Policy Responses in 2010-2011 In general the government that came to power in February 2009 declared its intentions of using the welfare state or the social protection system to shelter households, especially average and lower income households, from the consequences of the crisis, as far as possible. While the government budget had to be cut due to the devastating conditions of public finances immediately after the collapse in autumn of 2008, the aim was still to go softly on welfare expenditure cuts and also redirect those expenditures so that they might help reaching the government goals of sheltering lower income groups, while at the same time raising taxes on those with higher earnings as well as those who gained the most during the bubble period. Here we assess to what extent these goals have been achieved. First we profile the outcome developments with statistics and then we go into more detailed descriptions of policy developments. 3. The statistics of policy responses Figure 7 shows transfers and total public social protection expenditures as a proportion of GDP, from 2007 to 2010. Both series show a significant increase. While the GDP came down of course the message is that welfare expenditures were either cut less or simply increased. In a way both are right. There were significant cuts in welfare expenditures in real values, especially in services and administration costs. Benefits to the disabled and the elderly increased in real terms and of course expenditures on unemployment benefits increased greatly with the increased number of unemployed individuals. Sickness benefits were though cut and expenditures on hospital services. Otherwise there were significant redirecting measures, often in the form of increased expenditures to lower income groups but cuts to the higher income groups, such as amongst pensioners and also with child benefits. Those benefits were targeted towards the lower income groups to a greater extent than before.
Figure 7: Public welfare expenditures through the crisis, direct transfers and total public expenditures as % of GDP, 2007-2010. Source: Statistics Iceland
!
ICELAND
13
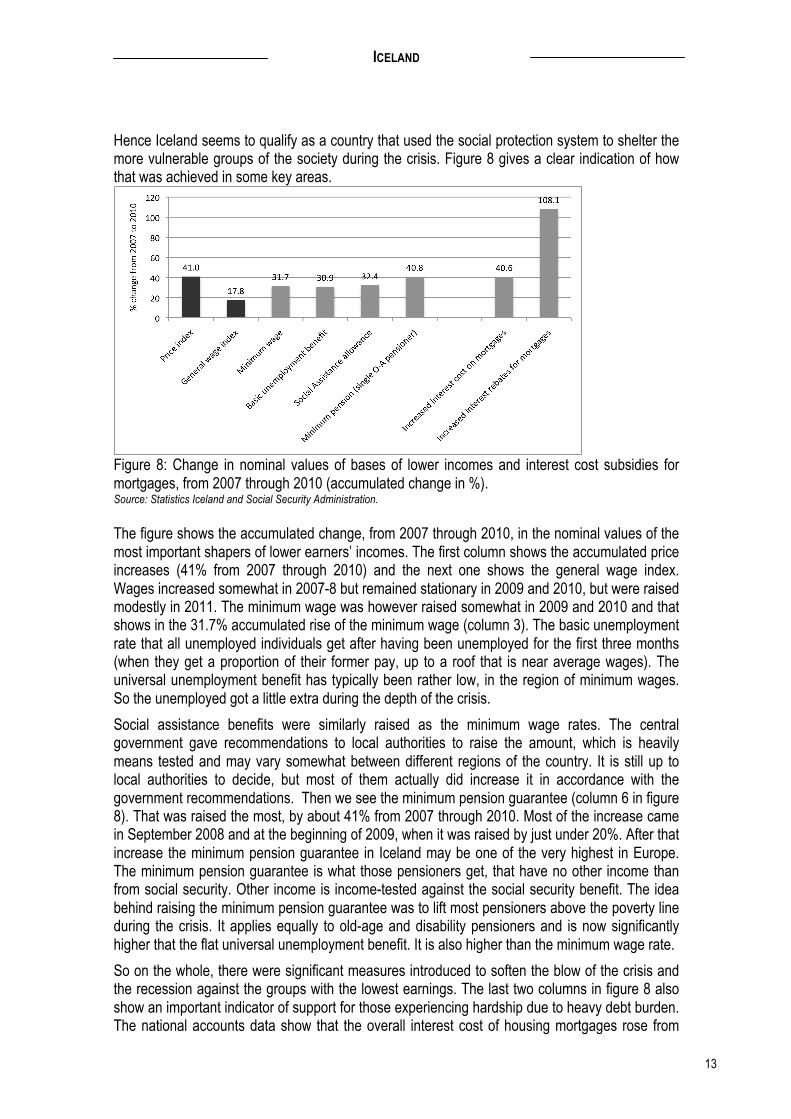
Hence Iceland seems to qualify as a country that used the social protection system to shelter the more vulnerable groups of the society during the crisis. Figure 8 gives a clear indication of how that was achieved in some key areas.
Figure 8: Change in nominal values of bases of lower incomes and interest cost subsidies for mortgages, from 2007 through 2010 (accumulated change in %). Source: Statistics Iceland and Social Security Administration. The figure shows the accumulated change, from 2007 through 2010, in the nominal values of the most important shapers of lower earners’ incomes. The first column shows the accumulated price increases (41% from 2007 through 2010) and the next one shows the general wage index. Wages increased somewhat in 2007-8 but remained stationary in 2009 and 2010, but were raised modestly in 2011. The minimum wage was however raised somewhat in 2009 and 2010 and that shows in the 31.7% accumulated rise of the minimum wage (column 3). The basic unemployment rate that all unemployed individuals get after having been unemployed for the first three months (when they get a proportion of their former pay, up to a roof that is near average wages). The universal unemployment benefit has typically been rather low, in the region of minimum wages. So the unemployed got a little extra during the depth of the crisis.
Social assistance benefits were similarly raised as the minimum wage rates. The central government gave recommendations to local authorities to raise the amount, which is heavily means tested and may vary somewhat between different regions of the country. It is still up to local authorities to decide, but most of them actually did increase it in accordance with the government recommendations. Then we see the minimum pension guarantee (column 6 in figure 8). That was raised the most, by about 41% from 2007 through 2010. Most of the increase came in September 2008 and at the beginning of 2009, when it was raised by just under 20%. After that increase the minimum pension guarantee in Iceland may be one of the very highest in Europe. The minimum pension guarantee is what those pensioners get, that have no other income than from social security. Other income is income-tested against the social security benefit. The idea behind raising the minimum pension guarantee was to lift most pensioners above the poverty line during the crisis. It applies equally to old-age and disability pensioners and is now significantly higher that the flat universal unemployment benefit. It is also higher than the minimum wage rate.
So on the whole, there were significant measures introduced to soften the blow of the crisis and the recession against the groups with the lowest earnings. The last two columns in figure 8 also show an important indicator of support for those experiencing hardship due to heavy debt burden. The national accounts data show that the overall interest cost of housing mortgages rose from

ICELAND
14
2007 through 2010 by 40.6%. The government has however raised the subsidy on the interest cost of mortgages decisively during this period. Thus we see that the value of the interest rebates for mortgages was raised by 108.1%, or almost three times more than the interest cost itself. Hence the average subsidy to households for interest costs on housing loans went from about 13% of the total interest cost to about 20%.
Those are the averages. The interest rebates are however targeted towards those households that are in greater need, i.e. those who have lower earnings, own less equity in their houses and more goes also to those who have more children. So high-income earners who have more equity in their assets get nothing. Thus we can safely conclude that about a third of the interest cost of lower and average income households was paid by government in 2010. This subsidy was further significantly raised in 2011, as we show in the last section (Statistics Iceland 2011-Ráðstöfunartekjur heimilageirans).
Figure 9 shows the relationship between the unemployment rate and the number of households receiving income support (Social Assistance) from local authorities, from 1997 to 2010. Generally there has been a close relationship between the unemployment level and the number of SA receivers for longer periods. When the unemployment rate went up at an unprecedented rate from 2008 to 2010 the number of households receiving income support from Social Assistance did indeed increase rapidly, but not proportionally as much as the unemployment rate. Interestingly the rate was not much higher than it had been in 2003.
Figure 9: Households receiving income support and unemployment levels, 1997 through 2010 Source: Statistics Iceland
Given the enormity of the crisis this seems less than might have been expected. The reason could be that the other measures to relief the burden of lower income households may have softened the need for the means-tested Social Assistance. Alternatively it could be that local authorities have applied more stringent entitlement criteria in providing the Social Assistance benefits. There is however no indication of such a change of policy. A further analysis of the composition of Social Assistance income support receivers may throw a light on the reasons (see figure 10).
ICELAND
15
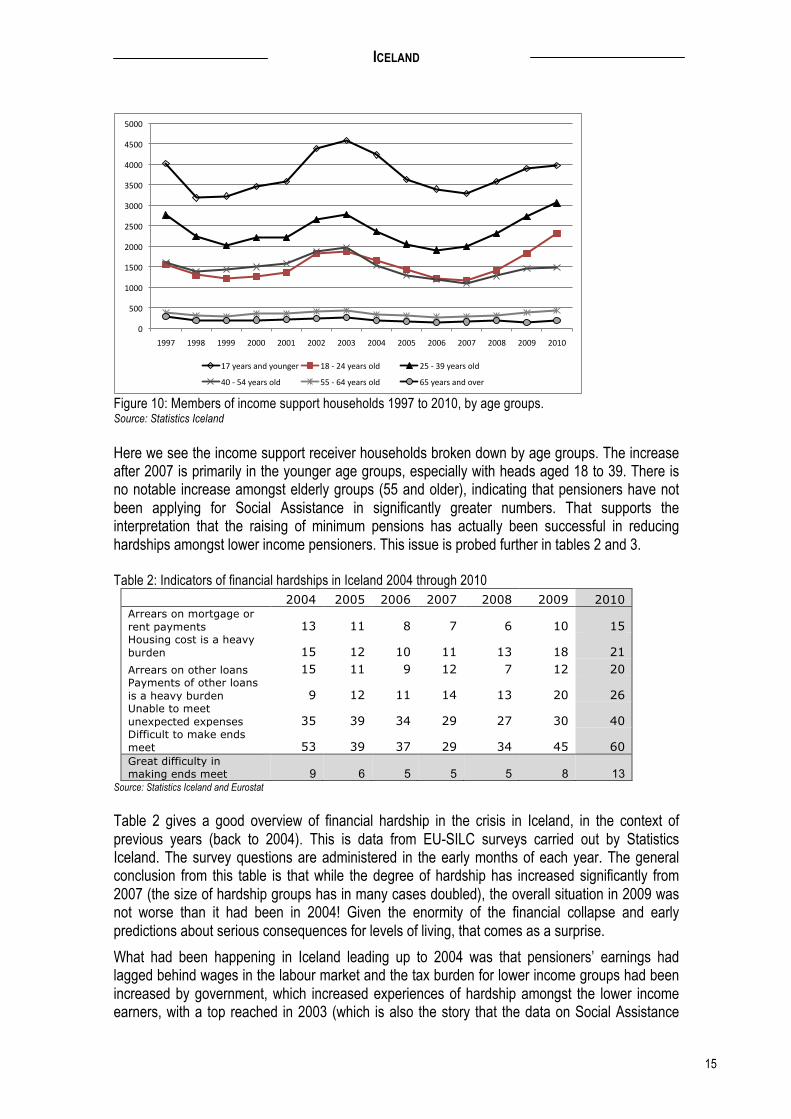
Figure 10: Members of income support households 1997 to 2010, by age groups. Source: Statistics Iceland Here we see the income support receiver households broken down by age groups. The increase after 2007 is primarily in the younger age groups, especially with heads aged 18 to 39. There is no notable increase amongst elderly groups (55 and older), indicating that pensioners have not been applying for Social Assistance in significantly greater numbers. That supports the interpretation that the raising of minimum pensions has actually been successful in reducing hardships amongst lower income pensioners. This issue is probed further in tables 2 and 3. Table 2: Indicators of financial hardships in Iceland 2004 through 2010
2004 2005 2006 2007 2008 2009 2010 Arrears on mortgage or rent payments 13 11 8 7 6 10 15 Housing cost is a heavy burden 15 12 10 11 13 18 21 Arrears on other loans 15 11 9 12 7 12 20 Payments of other loans is a heavy burden 9 12 11 14 13 20 26 Unable to meet unexpected expenses 35 39 34 29 27 30 40 Difficult to make ends meet 53 39 37 29 34 45 60 Great difficulty in making ends meet 9 6 5 5 5 8 13
Source: Statistics Iceland and Eurostat Table 2 gives a good overview of financial hardship in the crisis in Iceland, in the context of previous years (back to 2004). This is data from EU-SILC surveys carried out by Statistics Iceland. The survey questions are administered in the early months of each year. The general conclusion from this table is that while the degree of hardship has increased significantly from 2007 (the size of hardship groups has in many cases doubled), the overall situation in 2009 was not worse than it had been in 2004! Given the enormity of the financial collapse and early predictions about serious consequences for levels of living, that comes as a surprise.
What had been happening in Iceland leading up to 2004 was that pensioners’ earnings had lagged behind wages in the labour market and the tax burden for lower income groups had been increased by government, which increased experiences of hardship amongst the lower income earners, with a top reached in 2003 (which is also the story that the data on Social Assistance
!"
#!!"
$!!!"
$#!!"
%!!!"
%#!!"
&!!!"
&#!!"
'!!!"
'#!!"
#!!!"
$(()" $((*" $(((" %!!!" %!!$" %!!%" %!!&" %!!'" %!!#" %!!+" %!!)" %!!*" %!!(" %!$!"
$)",-./0".12",3415-/" $*"6"%'",-./0"372" %#"6"&(",-./0"372"
'!"6"#'",-./0"372" ##"6"+'",-./0"372" +#",-./0".12"38-/"

ICELAND
16
receivers in Figure 9 tells). So the hardship caused by the financial collapse and a 10% cut in GDP seems clearly to have been softened by government policies.
Note also though that the size of hardship groups had again increased in 2010, even though the level reached then was not much above the 2004 level. About 15% of households had arrears on mortgage or rent and 21% said that housing cost is a heavy burden. But a larger group says that payment of other loans is a heavy burden and those who have arrears of such other loans are also more numerous. About 60% say that it is difficult to make ends meet whereas it was 53% who had said the same in 2004. Lastly, about 13% of households say they have great difficulty in making ends meet. That was up from 5% in 2007 but had been at 9% in 2004. So the increased hardship due to the crisis is not at all drastically greater than had been experienced in 2004, which was in the midst of the feast of the bubble. Table 3 probes this further by social groups to establish better the characteristics of financial hardships. Table 3: Difficulty to make ends meet by social groups, Iceland 2004 through 2010
2004 2005 2006 2007 2008 2009 2010 Total 46 37 35 28 30 39 49 Households without children 41 35 33 28 28 35 43 Households with children 53 39 37 29 34 45 60 Single adult with a child or children 78 63 61 58 58 56 77 Two adults, one child 46 28 28 24 27 39 49 Two adults, two children 47 34 33 23 31 45 52 Two adults, more than two children 57 43 39 27 36 45 68 60 to 69 years 40 32 33 28 20 27 36 70 years and over 38 33 36 27 21 22 29
Source: Statistics Iceland and Eurostat Here we see the age factor coming out stronger again. Particularly interesting is the bottom line of the table which shows the degree of hardship amongst people 70 years of age and older, i.e. the part of the population that is surviving mainly on pensions. Those from that group who say it is difficult to make ends meet are 29% in 2010, up from 21% in 2007 and down from 38% in 2004. So the policy of raising the minimum pension clearly seems to have had an important impact for relieving financial hardship amongst pensioners.
Those who on the other hand have faired worse are young families with children. Many of those bought flats or houses at higher prices and took on larger debt levels than previously seen. They have been particularly hardly hit. Even though the increased rebate and subsidies of cost of interests of housing mortgages have helped the question still remains if enough has been done to help this group out. An interesting feature though is the fact that single parents are not saying in greater numbers in 2010 that they have difficulty making ends meet than they did in 2004, the percentage was 78 in 2004 and 77 in 2010.
Lastly in this section we compare Iceland’s financial hardship indicators (Great difficulty in making ends meet) to those of the EU member countries for the year 2009. Iceland’s figures for 2010 are also included in the graph (see figure 11).
In 2009 Iceland was well below the EU average, in seat 20, with only 12 countries having a lower proportion of households saying they are having great difficulty in making ends meet. Again, given the enormity of Iceland’s financial collapse the outcome has to be considered somewhat surprising. True, Iceland’s figures for 2010 are higher and somewhat above the EU average for 2009. But the roughly half of EU countries that already have figures for 2010 indicate that some of them are also having a higher rate in 2010 than in 2009, so the EU average for 2010 will be higher than for 2009.

ICELAND
17
Figure 11: Great difficulty in making ends meet: Iceland and EU countries compared 2009 (Iceland 2009 and 2010). Source: Eurostat Iceland clearly went badly off track and pays a high price for that. Still the consequences for levels of living seem on the whole to involve a setback that equals the economic position that prevailed around 2003-4. That is significantly less dramatic than was expected at the outset of the crisis.
During 2011 growth has resumed and is expected to average between 2 and 3% which is higher that the EU average and also higher than the USA prediction. So Iceland seems set to climb slightly up the international prosperity ladder, if only slowly (Central Bank of Iceland 2011b and IMF 2011). 4 Policy profiles – What is being done 4.1 Political and social environment On the whole the political and social environment has been difficult through the crisis. The financial collapse came as a surprising shock to the population and the rapid deterioration of living conditions that followed led many households into difficulties. Continuing revelations about excessive greed amongst the business and financial elite, reckless behaviour of bankers, clear immorality and apparent illegality of some undertakings, weak monitoring and regulatory powers, along with shady links of money powers to political parties have all, along with the new burdens placed on the shoulders of the general public, produced a deep sense of injustice. Trust in public institutions, business and finance, the media and politicians is at an all time low.
The social-democratic government that came to power in February 2009 had a large support at the beginning but now two years later it has lost a lot of support, since many have a lot to complain about and they typically blame the government. The opposition parties who ruled consecutively from 1995 through 2006 and introduced the policies that allowed the build-up of the extreme bubble economy have played a hardball against the present government and directed all their monetary and media power to make life difficult for the government. A large dose of demagogy is typically offered, including unrealistic “offers” of further debt relief and increased purchasing power, when weak economic and financial fundamentals call for restraint.

ICELAND
18
The labour movement and employers’ organizations typically join together to call for more job creation, including increased investment in industries. This is easier said than done when the big majority of firms are way too heavily indebted and can not take on more loans to invest in expansion, which would in any case not be sustainable since the general public has lost significant purchasing power, leading to insufficient demand from consumers. So in a way it is a deadlock and government only has very limited possibilities to go for large investment projects itself. Still there are such programs that have been implemented, such as in roadworks, maintenance and new construction of nursing homes for the elderly.
There is a new organization that emerged during the crisis, the Households’ Interest Group (Hagsmunasamtök heimilanna). They have continually called for more support and increased debt write-off. The opposition parties have played on the same theme. While the government is favourable to the goals of this organization, and has the stated policy goal of sheltering the homes against the vagaries of the crisis, the financial means of the government are obviously restricted. Still the policy development during the last two and a half years has been characterized by gradualism in support for indebted households, as we show below. Protests are organized every now and then and have tended to be particularly strong during the start of the last two parliaments. Government typically responds by implementing new assessments of possibilities for more action and presently there is such a review being carried out. One year ago the protests against the parliament were particularly fierce and produced a significant increase in the support measures this year. We can now expect more in the way of fine-tuning than any major additional new measures. The primary goal now is reducing unemployment and increasing growth, in an environment of restrained finances for everybody: government, businesses and homes.
Now we proceed and survey the most important policy areas and their progress to date. We start with the biggest issue, debt relief. 4.2 Debt Relief for Households
Increased debt burden is, along with higher unemployment and cuts in real earnings, one of the main dismal consequences of the financial crisis. Many still feel that not enough has been done to relief households of debt burden that most feel was unjustly raised for no fault of their own.
The government promised from the beginning to try to shelter households, particularly lower income earners. From early on there were loud calls for a flat rate cut of all household debts, by 25%. This was rationalized as necessary and fair since the basis of most peoples’ loans had been eroded in the financial collapse, making them very difficult to handle or even unsustainable for many. Some of the opposition political parties joined in on the request for a 25% flat rate cut of household debts. Such a measure was though likely to hit taxpayers themselves the hardest, since the majority of mortgages came from the public Housing Loans Fund (Íbúðalánasjóður) and secondly from the occupational pension funds (both directly and indirectly). The pension funds are of course owned by all presently and previously employed Icelanders, since membership is mandatory for employed people and has been since 1980 (Ólafsson 1999). So a flat rate cut of these debts would have required massive injections of cash into the Housing Loans Fund and would also have greatly harmed the occupational pension funds. The government thus rejected this approach and opted early for a targeted debt relief program.
These debt relief measures started in a piecemeal fashion, evolving in steps as the crisis progressed. The continuous protests kept the government on its toes throughout and various measures were added through 2009 and early 2010 in a stepwise manner. Then in the autumn of

ICELAND
19
2010 the government commissioned a major review of the measures already in place and their effectiveness as well as a review of the cost of various additions and other ways of dealing with the problem (Snævarr et.al. 2010). The Central bank of Iceland had previously, from early 2009, done a major survey of the debt burden of households and firms, which had guided the early governmental measures (Central bank 2009 and 2010).
The new survey of autumn 2010 established what had already been indicated, that the big majority of households should be able to handle their debts, even though the debt burden had increased decisively. Some 15% of households were in great difficulty in dealing with their debt burden and another 10% or so were hard pressed. Over 30% owed more on their houses than their current value (which had come down in the crisis). So the survey undertaken by the Prime Minister’s task force (Snævarr et.al. 2010) strengthened the previous conclusion about the viable way of dealing with the debt problem of households (the new resurrected banks had the main task of dealing with the debt problems of firms). The targeted approach was shown to work reasonably in the sense of concentrating on those households that were in a low income position, had high debt levels on a reasonably sized home (more to those with high negative equity) and the measures also better favoured families with children. In a way the younger families with children who had bought homes in the period from 2004 through 2008 were hit the hardest, since they bought their homes at elevated prices in the bubble economy and thus went deeper in debt than traditionally had been normal in Iceland. These oversized debts then escalated in the financial crisis and the following recession. Those who lost their jobs as well were of course particularly hardly hit.
Another conclusion of the new review of autumn 2010 was that still the measures were lacking and the government implemented at the beginning of 2011 an increased effort to speed up the measures already in place and to streamline the approach, as well as by raising further the tax relief on interest payments on mortgages and they also raised the child/family benefits significantly, on top of previous rises of these benefits and reliefs. The new measures were done in consultation with major stakeholders, including representatives from the new organization, the Households’ Interest Group (a strong voice in calling for more debt reliefs during the crisis). The banks, pension funds and unions were also parties to the pact.
A new office of Ombudsman for debtors was also established in 2010, with the role of supporting debtor households with financial advice and help in dealing with the banks. The prescription for the new office was to side with the debtors to increase their bargaining power vis a vis the banks, when working with them in the debt relief process. After this package was implemented the voices of protests over debt burden were more silent than before, yet not fully quiet.
The following main features define the debt relief process in Iceland to date:
Ø General debt relief: Debtors in difficulties with negative equity values can get their debts reduced to 110% of the value of their assets, up to the value of a modest home (taking account of family size). There is a limit to the amount that a general relief can offer (24.500 Euros for a single individual and 43.000 Euros for couples and single parents). For those in more serious trouble further debt relief can be obtained, after a more detailed examination of their finances and ability to pay. This can give a reduction of debts by up to 91.500 Euros for a single person and 183.000 Euros for couples and single parents.
Ø Special debt relief: This is a more restricted measure, open to fewer families and only to people in very serious difficulties. These can get a debt write-down to 70% of the value of their asset while the remaining 30% are frozen for up to 3 years, without any interest or repayment during that time. In those cases all debt over 100% of the value of the home will be written off.

ICELAND
20
Ø Increased interest rebates through the tax system: The special targeted tax rebate on interest payments for mortgages was raised at the start of the crisis and this last step in the debt relief process involved further increases in the sums involved. This rebate is income-tested, and also linked to the net value of the home and number of children. Hence it is directed at homeowners in greatest need. Up to 85% of families aged 25 and over are homeowners in Iceland. So households with low and average incomes and a heavy debt burden get most.
Ø New temporary general subsidy on interest cost: This is a new temporary feature, introduced in 2011, directing more aid in the form of direct subsidy payment to homeowners in financial hardships. This is universal in the sense of not being income-tested, but it is instead asset-tested, i.e. once net value of the family asset goes beyond a fixed sum it is reduced and eventually faced out. This can give an indebted family up to 1800 Euros in subsidy of their interest burden in a year. The government bargained with financial institutions and pension funds to finance this measure.
Ø Special effort to aid families in arrears: A special effort is made to reach all families who are in arrears with their mortgages before 1st of June 2011, offering advice and aid in tailoring measures that may help. The goal with this measure is to avoid foreclosures as far as possible.
Ø New social measures in housing provisions: The government organizes a special effort, in cooperation with financial institutions, local authorities and NGOs, to establish more varied options in family housing, including new renting options. Rent rebates were increased at the beginning of the crisis and they are to be kept at a higher rate than they were at before the crisis.
With all these measures the debtors in difficulties are in effect offered to scale their debt situation to the state they were in before the crisis, i.e. to the early part of 2008. Those who overinvested in luxurious or oversized housing will not be helped to retain such assets that they cannot handle in their present situation. A modest family home is the reference for support. This is of course a major effort that has avoided massive personal bankruptcies and foreclosures of homes. Some families had already overreached their capacities before the crisis and nothing can save some of them from being relieved of some or all of their assets.
Those who had borrowed foreign currency loans to buy cars in the years leading up to the crisis have also been awarded a significant debt relief, since most of such loans that were in effect paid out in Icelandic Kronur but tied to foreign denominations were ruled illegal in Icelandic courts last year. That means that debtors can get up to 40% of such loans written down to the value they would have had if they had been in Icelandic denomination. Since such loans are at a maximum to be paid back in eight years, and often in shorter time, the debt burden of those loans is often heavy. This measure obtained through the courts has thus also been important for relief of debt burden of Icelandic households (Velferðarvaktin – Welfare Surveillance task force, June 2011).
Debt relief has thus emerged in this financial crisis as a very important measure of social protection, working against social exclusion. Since the debt relief measures in the Icelandic case were targeted at those in more need (in terms of income level, net asset ownership level and number of children) they have been equalizing for levels of living and avoided risks of exclusion in the field of family housing. That is of major importance and it is interesting to know to what extent similar measures have been undertaken in other countries that were heavily hit by the financial crisis.
Debt relief for households has also been important for countering contraction in the economy, maintaining general consumer demand at a higher level than otherwise possible, in the spirit of

ICELAND
21
classical Keynesian demand management. Is has also proved to be a very important issue for countering a sense of injustice amongst many sections of the population. After such a dramatic experience, as the financial collapse was, that is indeed a very important concern for stability.
The government appointed a surveillance and evaluations committee in 2009 to monitor the way the banks deal with loans to individuals, households and firms in the wake of the financial collapse (law no. 107/2009). The aim is to evaluate what the banks do in these areas and the procedures they use, as well as to assess if their activities comply with rules of equity and fair treatment, as specified in the agreement that the government did with the financial institutions. The last such agreement was signed on December the 15th 2010. So this committee does the authoritative assessment of how the financial institutions are living up to the aims of the agreement.
The committee delivered its third detailed report in September 2011 (Surveillance Committee of Debt Relief Processes 2011). Its main conclusions are that the financial institutions are basically following good work rules and treating comparable cases in comparable ways. Still the committee points to technical restrictions in the work rules, such as regarding cases when households have borrowed collateral (usually from parents). In those cases the 110% debt relief measure does not work as originally planned. Hence the new recommendation that third party collateral should be taken into account in working out the 110% road to debt relief. Similarly the committee complains that the whole process is taking too long and the Special Debt Relief way is criticised for being particularly slow and lacking in flexibility. The committee thus gives recommendations and evaluations that aim to improve the workings of the debt relief processes and to secure proper working rules in the realm of the financial institutions. This seems to be a very useful work so far. 4.3 Reducing unemployment
In the present crisis it emerged that Iceland was previously a laggard as regards active labour market policies, since there had not been felt the great need for that prior to the crisis, even after the unemployment rate was generally raised somewhat during the 1990s (Hannesdóttir et. al. 2010). But after the unemployment rate increased above 5% the awareness of the importance of ALMPs and rehabilitation was greatly raised and major efforts were set in place in the last two years, firstly aimed at younger unemployed individuals and then followed special programs on long-term unemployed and older unemployed workers (50+)(Halldórsdóttir et.al. 2009 and Directorate of Labour 2010). These programs have continued in 2011. Rehabilitation for the sick and disabled has also been stepped up with new varieties of measures and a new rehabilitation fund operated by the labour market partners (unions and employers’ federations) (Andersen et.al. 2011).
Taxes are an important part of conditions for work. While Iceland is a high tax country, yet not reaching the full height of taxation levels of the neighbouring Scandinavian countries, its taxation of personal incomes is lower than in the other Nordic countries while the VAT tax on consumption is now the highest in the Western world. So the EU recommendations in the Annual Growth Survey for shifting taxes from labour to consumption and environmental aspects could be aligned to the Icelandic case. The emphasis of the present government has been to shelter lower income earners against higher taxes during the crisis while the tax burden of average and higher income earners has been raised. This has facilitated consumer demand amongst low-income groups during the crisis and probably softened the contraction effect on GDP.
Even though Iceland’s unemployment rate has remained 1-2 %-points below the EU average throughout the crisis, the present rates in Iceland are historically high, indeed unprecedented (Andersen et.al. 2011; Ólafsson and Stefánsson 2005; Jónsson and Magnússon 1997). So the
ICELAND
22
unemployment problem is taken very seriously and it is in fact one of the main challenges that Iceland now faces, i.e. to reduce its level. The prognosis for the immediate future, i.e. the next 3-5 years, is that the unemployment level will come slowly down despite reasonable economic growth. That is indeed a common experience of countries after such financial crises and that was the experience of Finland after its deep crisis of the early 1990s (Reinhardt and Rogoff 2009). It took them up to 18 years to regain the pre-crisis unemployment level. But their unemployment rate went up to 18%, much higher than Iceland’s present rates (Kalele et.al. 2001).
During the crisis the unemployment benefit was raised slightly. The cost of that and of increased numbers of benefit receivers was financed by increasing the insurance premium that is paid by employers, this was done already in 2009 and has continued to date. The period that the unemployed can remain on benefits was also lengthened in December 2010, from 3 to 4 years. Thus the expenditures of the unemployment benefits fund have increased drastically. The unemployment protection system has indeed reacted to the cyclicality of the economy and intensified its support during the crisis.
On the whole the tax and benefit structure in Iceland is conducive to making work reasonably attractive, even at low earnings. Still the minimum pay is relatively low by Nordic standards but not so low compared to many Continental EU countries (Ólafsson 2010). Still in-work poverty in Iceland is closer to the EU average than other forms of poverty and the risk of the unemployed of falling under the poverty line is at about 30%. Hence conditions for low paid workers are often criticised in Iceland. Still there are incentives for working, both attitudinal in the culture and in the taxation system at present, since the tax burden of low income earners had indeed been lowered in 2009 and 2010, compared to previous years (Kristjánsson and Ólafsson 2011; Kristjánsson 2011; Andersen et.al. 2011).
Unemployment benefits are of course conditioned on continued seeking of jobs amongst recipients and in-work benefits have been raised in the last two years. That should make it reasonably feasible for the unemployed to return to work when job opportunities will be forthcoming. So the problems should primarily be those of creating new jobs rather than restructuring the benefits system and temporary support measures.
Active labour market policies have been greatly intensified in the last two years, firstly aimed at the young unemployed. Special programs have been on offer for summer time jobs for students as well and the ALMPs have been offering the young unemployed various possibilities for returning to secondary schools and to university level education. This seems likely to work for many, but further evaluation assessments are needed to establish the functioning of these efforts. The same applies to special efforts directed at older and longer-term unemployed individuals (Directorate of Labour 2010; Andersen et.al. 2011).
On the whole the prime task of getting the unemployed back to work in Iceland seems mainly to revolve around job creation (see also Andersen 2011). 4.4 Result of policies – Were the goals achieved? Now we come to the final assessment of whether the goals of sheltering the lower income groups and reducing inequality back to Scandinavian levels have been achieved: We first look at how the disposable earnings have developed by income groups, from the lowest through the middle groups and up to the highest income groups (deciles).

ICELAND
23
4.4.1 Sheltering the lower income groups: Outcomes In figure 12 we show how the disposable earnings changed from 2008 through 2010, by income deciles. The lowest 10% of households (couples and cohabiting) is the I-group and the highest income earning decile is the X-group. We also show the average change (column on the far right).
Figure 12: Changes in families’ disposable earnings from 2008 to 2010 in %, by income deciles, from the lowest income group (I) to the highest (X). Source: Statistics Iceland (data from yearly tax returns) The lowest two income groups got an increase of nominal disposable earnings by 7.5-7.8% during the crisis period, while the increase is gradually reduced as we move up the income ladder. The middle groups (groups V and VI) got an increase of 2.0% and 1.8% respectively, while the top 10% of income receivers got a nominal reduction of 26.3%. Given that these are nominal figures and that inflation approached 30% during the period we see that all groups got a reduced level of real disposable earnings, but the reduction was significantly less for the lower income groups than the higher. And the top 10% got by far the largest cut in their earnings.
This outcome reflects the combined effects of government policies, most notably of tax and benefits policies. We have already shown how a special effort was undertaken to improve the income levels of the lowest groups (by raising minimum pensions and wages, as well as the unemployment benefit and the Social Assistance allowance). Child benefits and subsidies of interest cost of mortgages were also raised significantly and they find their way up to middle-income groups, i.e. beyond the very lowest income groups. The reduced disposable earnings for the very highest income group (X) is both due to greatly reduced financial earnings and higher tax burden, the latter being done with higher marginal income tax rates, higher tax rate on financial earnings and a special wealth tax implemented in 2009 and raised further in 2010.
In effect this development of the income distribution development is the reverse of how it was during the bubble economy period from 2003 to 2007. Then the higher income groups were increasing their disposable earnings much faster than everybody else and the lowest income groups were lagging behind the middle and more so behind the higher groups. So the goal of sheltering the lower and middle-income groups from the negative consequences of the crisis seems to have been achieved. This is further supported by the data in figure 13, which shows the development of the net effective direct tax burden from 2008 through 2010.

ICELAND
24
Figure 13: Change in families’ net effective tax burden from 2008 to 2010, change in %-points, broken down by income deciles, from the lowest income group (I) to the highest (X). Source: Statistics Iceland Here it emerges quite clearly that the tax burden of the lower groups was in fact reduced in 2009 and 2010, while it increased in the higher income groups. The reduced tax burden is the greatest for groups II, III and IV. The fact that the tax burden increased a little bit in group I, the very lowest income group, calls for an explanation. The reason is most likely that the very lowest income group is often elderly pensioners who have savings in banks and they got a higher tax rate on interest income. In addition the couples in groups II through group V are the families that most frequently receive child benefits and subsidies on interest costs, they get more the lower their earnings are. The families in group I rarely get such income supplements. The tax burden rose then for the top 40% of families, the more the higher the earnings.
So we can safely conclude that the large average reduction of real per capita disposable earnings that we reported in figure 6 above, was very unevenly shared, with lower income groups getting significantly less reduction and the higher income groups getting more cuts. A disproportional part of the overall average of 29% cut in real disposable earnings was disproportionally carried by the highest income decile and the lower income groups got significantly less than the average reported in figure 6.
The goal of sheltering the lower income groups seems in that sense to have been successful. The burden of taxation has also been significantly shifted to a greater degree on to the shoulders of the higher income families.
4.4.2 Reducing inequality The other goal that the government aimed at in its original plan was to reduce the level of inequality of incomes that had been building up gradually from 1995 and with increasing speed during the bubble economy period from 2003 to 2007. The increased inequality was both due to increased capital earnings and lowered net effective tax burden on higher income groups (both effected with a lowered marginal income tax rate and a lower tax rate on financial earnings, which came disproportionally to the higher income groups). Pensioner earnings and other lower incomes had also lagged behind from 1995 to 2003. Hence the growing inequality was due to a number of things coming together and eventually being exaggerated during the height of the

ICELAND
25
bubble economy. In figure 14 we show the inequality development from 1993 to 2009, with Gini coefficients for two income concepts: disposable earnings with all incomes counted and disposable earnings with capital gains excluded.
Figure 14: Gini inequality coefficients for all taxpayers in Iceland from 1993 to 2009. All disposable incomes (black columns) and disposable incomes excluding capita gains (grey columns). Source: Statistics Iceland and Directorate of Tax Revenues. As the figure shows the inequality level was increasing very fast after 1995 and gained momentum from 2003 (Ólafsson 2011b; Kristjánsson and Ólafsson 2010). This is much more pronounced when all earnings are counted (black columns), since the financial earnings, not least capital gains, went very disproportionally to the highest income groups. But the overall pattern of decisively increased inequality is also evident even if we leave out the capital gains (grey columns). In fact the degree of increase of inequality in Iceland in the advent of the financial collapse was unparalleled in the West in the post-war period (Fritzell et.al 2011; Ólafsson 2006a; Kristjánsson and Ólafson 2009).
The interesting feature is that the inequality development has been reversed during the crisis years of 2008 and 2009, in a quite marked way. Our analysis in tables 12 and 13 also indicates that the trend towards more equality has continued in 2010.
Hence we can conclude that the goal of reducing income inequality has been achieved, primarily with the tax and benefits policy. This has however also been aided by the great reduction of capital income in the aftermath of the collapse. But the role of government policy has clearly made a difference in this respect.

ICELAND
26
Appendix I Poverty development indicators from 2003-2010
Figure A1: Poverty development in Iceland 2003 to 2010 and financial difficulty (% saying very difficult to make ends meet). Source: EU-SILC data.
Appendix II Table 1: Iceland’s Economic fundamentals 2007 to 2010 and predictions 2011-2013
Change from previous year (%)
2007 2008 2009 2010 2011 2012 2013
Private consumption 5.6 -‐7.9 -‐15.6 -‐0.2 2.7 3 3.2 Collective consumption 11.1 15.9 8.1 -‐3.2 -‐4.1 -‐2.8 0.4 Investments -‐11.1 -‐19.7 -‐50.9 -‐4.9 15.8 16.6 8.5
National expenditures -‐0.1 -‐8.5 -‐20.7 -‐2.1 2.9 3.8 3.5 GDP 6.0 1.0 -‐6.8 -‐3.1 2.3 2.9 2.7 Central government fiscal balance 5.4 -‐13.5 -‐10.0 -‐6 -‐3 0.1 2
Real disposable earnings 10.5 0.5 -‐17.7 -‐3.6 0.3 0.6 1.2
Unemployment rate (registered) 1.0 1.6 8.0 8.1 7.7 6.4 5.1
Inflation rate 5.0 12.4 12.0 5.4 2.8 2.7 2.5
General Gmt. net debt (yearly % GDP) 42.1 67.7 75.6 78.6 74.7 64.5 42.1 Source: Central Bank of Iceland, Monetary Bulletin, April 2011 and IMF 2011.
40% 50% 60% 70%
Under 60% poverty line
% very difficult to make ends meet

ICELAND
27
References
ASÍ (Icelandic Federation of Labour), retrieved from: www.asi.is February 2011.
ANDERSEN, TINE, KARSTEN HOUGAARD AND STEFAN ÓLAFSSON, Assessment of the Labour Market in Iceland. Danish Technological Institute (DTI), 2011.
ATKINSON, A. B. AND ERIC MARLIER, Income and Living Conditions in Europe. Brussels: Eurostat and European Commission, 2010.
BUITER, W: AND SIBERT, A.: THE ICELANDIC BANKING CRISIS AND WHAT TO DO ABOUT IT: THE LENDER OF LAST RESORT THEORY OF OPTIMAL CURRENCY AREAS”. CEPR POLICY INSIGHT, NO. 26, (2008)
CENTRAL BANK OF ICELAND, Survey of debt levels 2009, retrieved from www.sedlabanki.is CENTRAL BANK OF ICELAND, Monetary Bulletin, April 2011a, retrieved from www.sedlabanki.is.
CENTRAL BANK OF ICELAND, Financial Stability Report, May 2011:1b, retrieved from www.sedlabanki.is.
DANÍELSON, J. & ZOEGA, G.: THE COLLAPSE OF A COUNTRY”. AVAILABLE ONLINE AT: HTTP://RISKRESEARCH.ORG/. CITED 15TH JANUARY 2011 (2009).
DIRECTORATE OF LABOUR (Vinnumálastofnun), Ársskýrsla, retrieved from: www.vinnumalastofnun.is .
EÐVALDSSON, I. R., 2003. Labour Market Performance in Iceland. Working Paper W03:01, University of Akureyri, Faculty of Business Studies.
EUROPEAN COMMISSION, EUROPE 2020 – A European strategy for smart, sustainable and inclusive growth (available at http://ec.europa.eu/europe2020/index_en.htm ).
EUROSTAT: EU-SILC data, retrieved from: http://epp.eurostat.ec.europa.eu/portal/page/portal/eurostat/home/
FRITZELL, J. BECKMANN, O. and RITAKALLIO, V-M., Income inequality and poverty: do the Nordic countries still constitute a family of their own? Forthcoming 2011.
HALLDÓRSDÓTTIR, S. ET. AL., Ungt fólk án atvinnu – Virkni þess og menntun (Report of a task force for Ministry of Social Affairs, November 2009.
HALLDÓRSSON, O. G. AND ZOEGA, G.: ICELAND’S FINANCIAL CRISIS IN AN INTERNATIONAL PERSPECTIVE. UNIVERSITY OF ICELAND, INSTITUTE OF ECONOMIC STUDIES, WORKING PAPER SERIES NO. W10:02 (2010).
HANNESDÓTTIR, GUÐRÚN, SIGURUR THORLACIUS AND STEFAN ÓLAFSSON, Örorka og virk velferðarstefna (Disability and Active Welfare Policy – A Survey Amongst Disability Pensioners). University of Iceland, Social Research Institute, Report no. 1 2010 (www.ts.hi.is).
ILO (2011), Annual Report on Global Employment Trends (available at http://www.ilo.org/ global/lang--en/index.htm).
IMF, Staff Reports on Iceland, 2010 and 2011.Retrieved from: http://www.imf.org.
JÓNSSON, GUÐMUNDUR AND MAGNÚS S. MAGNÚSSON, Hagskina (Economic history statistics). Reykjavík: Statistics Iceland, 1997.
ICELAND
28
KALELE, JORMA ET.AL., Down from the heavens - Up from the ashes: The Finnish economic crisis of the 1990s in the light of economic and social research. Helsinki: Government Institute for Economic Research, 2001.
KRISTJÁNSSON, ARNALDUR SÖLVI and Stefán Ólafsson (2009). „Heimur hátekjuhópanna – Um þróun tekjuskiptingar á Íslandi 1993-2007“, in Stjórnmál og stjórnsýsla, vol. 5, no. 1.
KRISTJÁNSSON, ARNALDUR SÖLVI and Stefán Ólafsson (2010). „Aukinn ójöfnuður tekna 1995-2007 og umskiptin 2008-9: Greining á þróun tekjuskiptingarinnar” (Increased inequality of incomes 1995-2007 and the conversion 2008-9). Social Research Center, University of Iceland, Neewsletter no. 11:2010.
KRISTJÁNSSON, ARNALDUR SÖLVI and Stefán Ólafsson (2011), Skattbyrðin í kreppunni I; University of Iceland, Social Research Centre, Newsletter no. 1:2011 (available at www.ts.hi.is).
KRISTJÁNSSON, ARNALDUR SÖLVI (2011a). Fjölskyldubætur á Íslandi (Family Benefits in Iceland). University of Iceland, Social Research Centre, Reserch Report (available at www.ts.hi.is).
KRISTJÁNSSON, ARNALDUR SÖLVI (2011b). Áhrif breytinga skattkerfisins á skatttekjur, skattbyrði og tekjuskiptingu 1992-2009. University of Iceland: MSc thesis in Economics (available at www.ts.hi.is).
MARLIER, ERIC AND NATALI, DAVID (eds.)with Rudi Van Dam, Europe 2020 - Towards a More Social EU? Bruxelles, Peter Lang.
MINISTRY OF FINANCE (October 2011), Ríkisbúskapurinn 2012-2015: Skýrsla um áætlun í ríkisfjármálum (Report on Public Finances of Iceland 2012-2015). Available at http://www.fjarmalaraduneyti.is/frettatilkynningar/nr/14666. OECD, Growing Unequal? Paris: OECD, 2008a.
OECD, Economic Survey - Iceland. Paris: OECD, 2008b.
OECD, Education at a Glance. Paris, OECD 2010.
ÓLAFSDÓTTIR, KATRÍN, Does the Wage Structure Depend on the Wage Contract? Cornell University USA, Ph.D. thesis, February 2010.
ÓLAFSSON, STEFAN., Hugarfar og hagvöxtur (Mentalities and Economic Growth). Reykjavík: Social Sciences Research Institute, 1996.
ÓLAFSSON, STEFAN., Íslenska leiðin (The Icelandic Welfare Model). Reykjavík: University Press and Social Science Research Institute, 1999.
ÓLAFSSON, STEFAN., Disability in Iceland. Reykjavík: Social Science Research Institute, 2005. ÓLAFSSON, STEFAN., (2006a). „Aukinn ójöfnuður á Íslandi: Áhrif stjórnmála og markaðar í
fjölþjóðlegum samanburði“, in Stjórnmál og stjórnsýsla, vol. 2, no. 2, pp. 129-156.
ÓLAFSSON, STEFAN., (2006b). „Breytt tekjuskipting Íslendinga: Greining á þróun fjölskyldutekna 1996-2004“, in Rannsóknir í Félagsvísindum VII, ritstj. Úlfar Hauksson (Reykjavík: Félagsvísindastofnun/Social Science Research Institute).
ÓLAFSSON, STEFÁN: Íslenska efnahagsundrið – Frá hagsæld til frjalshyggju og fjármálahruns (The Icelandic Economic Miracle). IN: STJÓRNMÁL OG STJÓRNSÝSLA, VOL. 4, NO. 2, PP. 231-256 (2008)
ÓLAFSSON, STEFAN., “In-Work Poverty and Labour Market Segmentation – Iceland”, Report to EU Network on Social Inclusion, 2010.
ICELAND
29
ÓLAFSSON, S., “Fjárhagsþrengingar heimila í kreppunni” (Financial hardships in the crisis), Socu-ial Researce Centre, University of Iceland, Newsletter no. 2:2011a.
ÓLAFSSON, S., “Icelandic Capitalism – From Statism to Neoliberalism and Financial Collapse”, in Comparative Social Research (ed. L. Mjöset), forthcoming in November issue.
ÓLAFSSON, STEFAN and KOLBEINN STEFÁNSSON, Hnattvæðing og þekkingarþjóðfélag. Reykjavík: University of Iceland Press 2005.
PIC – Parliamentary Investigation Committee into the Collapse of the Icelandic Banks, Volumes 1-8. Alþingi, Reykjavík (2010)
REINHARDT, C. M. and ROGOFF, K. S. (2009), This Time is Different – Eight Centuries of Financial Folly. Princeton: PUP.
SURVEILLANCE COMMITTEE OF DEBT RELIEF PROCESSES (2011), Skýrsla, September 2011. Reykjavík: Ministry of Economy and Trade.
SNÆVARR, SIGURÐUR et.al., Skýrsla sérfræðingahóps um skuldavanda heimilanna (Repoirt of a special task force on household debts problems). Office of the Prime Minister, November 2010.
STATISTICS ICELAND, Lágtekjumörk og tekjudreifing 2003–2006 (Risk of poverty and income distribution 2003–2006), Hagtíðindi nr. 5, 2009. Retrieved from www.hagstofa.is.
STATISTICS ICELAND, Ráðtöfunartekjur heimilageirans 2010, Statistics on www.hagstofa.is). VELFERÐARVAKTIN (Welfare Surveillance / Ministry of Welfare), Stöðuskýrsla vinnuhóps um fjárhagsvanda heimilanna, Júne 2011 (available at www.velferdarraduneyti.is).