icer-3d: a progressive wavelet-based compressor for ... · icer-3d is a progressive, wavelet-based...
TRANSCRIPT

IPN Progress Report 42-164 February 15, 2006
ICER-3D: A Progressive Wavelet-BasedCompressor for Hyperspectral
ImagesA. Kiely,1 M. Klimesh,1 H. Xie,1 and N. Aranki2
ICER-3D is a progressive, wavelet-based compressor for hyperspectral images.ICER-3D is derived from the ICER image compressor. ICER-3D can provide loss-less and lossy compression, and incorporates an error-containment scheme to limitthe effects of data loss during transmission. The three-dimensional wavelet decom-position structure used by ICER-3D exploits correlations in all three dimensionsof hyperspectral data sets, while facilitating elimination of spectral ringing arti-facts. Correlation is further exploited by a context modeler that effectively exploitsspectral dependencies in the wavelet-transformed hyperspectral data. Performanceresults illustrating the benefits of these features are presented.
I. Introduction
Hyperspectral images are three-dimensional (3-D) data sets, where two of the dimensions are spatialand the third is spectral. A hyperspectral image can be regarded as a stack of individual images ofthe same spatial scene, with each such image representing the scene viewed in a narrow portion of theelectromagnetic spectrum. These individual images are referred to as spectral bands. Hyperspectralimages typically consist of more than 200 spectral bands; the voluminous amounts of data comprisinghyperspectral images make them appealing candidates for data compression.
Exploiting dependencies in all three dimensions of hyperspectral data sets promises substantially moreeffective compression than two-dimensional (2-D) approaches such as applying conventional image com-pression to each spectral band independently. With this in mind, we have developed ICER-3D, anextension of the ICER image compressor to hyperspectral images. ICER is a wavelet-based 2-D imagecompressor; see [1] for a description. ICER is being used onboard the Mars Exploration Rovers for com-pression of a large majority of the images returned [2]. ICER-3D uses a 3-D wavelet decomposition toprovide decorrelation in the spectral dimension as well as both spatial dimensions. Other investigationsof 3-D wavelet-based compression of hyperspectral imagery include [3–5].
ICER-3D inherits much of its design, and hence some of its features, from ICER. ICER-3D com-pression is progressive, which means that compressed information is organized so that as more of the
1 Communications Architectures and Research Section.2 Autonomy and Control Section.
The research described in this publication was carried out by the Jet Propulsion Laboratory, California Institute ofTechnology, under a contract with the National Aeronautics and Space Administration.
1

compressed data stream is received, reconstructions with successively higher overall image quality can bereproduced. A bitstream with this property is often referred to as embedded. ICER-3D uses reversiblewavelet transforms, so it can provide lossless or lossy compression. Truncating an embedded data streamby increasing amounts produces a graceful degradation in the reconstructed image quality. Thus, pro-gressive compression provides a simple and effective method of meeting a constraint on compressed datavolume.
To limit the effects of data loss during transmission, the wavelet-transformed data are partitioned intoa user-selectable number of segments, each roughly corresponding to a rectangular spatial region of thescene. Each segment is compressed independently so that if data pertaining to a segment are lost orcorrupted, the other segments are unaffected. Furthermore, because compression is progressive withineach segment, when data loss does occur, any received data for the affected segment that precedes thelost portion will allow a lower fidelity reconstruction of that segment.
In Section II we briefly describe the ICER compressor and give an overview of some of the similaritiesand differences between ICER and ICER-3D. ICER-3D has two key features that distinguish it from astraightforward extension of ICER. First, ICER-3D uses a 3-D wavelet decomposition that includes addi-tional spatial transform stages compared to a 3-D Mallat decomposition; this is described in Section III.Second, ICER-3D uses a bit-plane coding and context modeling procedure that emphasizes spectral(rather than spatial) dependencies in the wavelet-transformed data; this is described in Section IV. InSection V we present performance results that illustrate the benefit to compression effectiveness providedby these two key features. We assume that the reader has a general familiarity with wavelet-based imagecompression for (2-D) images, and we generally omit the details of ICER-3D compression in areas whereit does not differ from ICER.
The examples presented in this article use Airborne Visible/Infrared Imaging Spectrometer (AVIRIS)data [6]. The AVIRIS hyperspectral images referred to in this article have a width of 614 pixels andinclude 224 spectral bands covering wavelengths from 370 nm to 2500 nm. For most of our examples,we use the first 512-line scene of the calibrated 1997 Moffett Field radiance data set.3 In this article, wenumber bands starting from 1 (rather than 0).
II. ICER and ICER-3D
A. ICER Overview
We start with a brief overview of some relevant concepts from the basic (2-D) ICER.
In ICER, multiple stages of a 2-D wavelet transform are applied to the image. The first stage isapplied to the whole image, while subsequent stages are applied only to the (horizontally and vertically)low-pass subband from the previous stage. This results in the pyramidal decomposition first suggested byMallat [7] and currently in common use. The resulting subbands include one small low-pass subband andseveral subbands that are high-pass in at least one dimension. A three-level 2-D wavelet decompositionof an image is shown in Fig. 1.
ICER’s error-containment segments are defined in the transform domain, and each segment approxi-mately corresponds to a rectangular region of the original image. Figure 2 illustrates this correspondence.The partitioning into segments is performed automatically based on the image dimensions and numberof segments requested; this operation has no relation to the concept of segmentation for distinguishingobjects or regions in an image. Segments are analogous to “precincts” in JPEG2000 [8].
3 The Moffett Field data set is available from the AVIRIS web site, http://aviris.jpl.nasa.gov.
2

(a) (b)
Fig. 1. Example of a three-level, 2-D wavelet decomposition: (a) the original image, spectral band 41 (wavelength 740 nm) from the Moffett Field scene and (b) the result of the wavelet decomposition. In (b), in all subbands except the low-pass subband, absolute values are shown, contrast-enhanced by a factor of 3 relative to the low-pass subband.
(a) (b)
Fig. 2. The image of Fig. 1 divided into three error-containment segments, each tinted a different color: (a) the regions with hard boundaries in the transform domain and (b) the resulting regions with soft boundaries in the original image.
To achieve progressive compression, discrete wavelet transform (DWT) coefficients are converted tosign-magnitude form and encoded one bit plane at a time starting with the most-significant magnitudebit plane. (A bit plane is formed by taking the ith most-significant magnitude bit of each coefficientin a subband, for some i.) When the first ‘1’ bit of a coefficient is encoded, the sign bit is encodedimmediately afterward. The wavelet decomposition uses a reversible transform, so lossless compression isachieved when all subband bit planes are coded. Correlation between adjacent coefficients in a subbandis exploited via predictive coding and context modeling.
B. ICER-3D Overview
We now give an overview of ICER-3D, along with some comparisons to ICER.
As previously mentioned, hyperspectral data have three dimensions, and ICER-3D uses a 3-D waveletdecomposition. Rather than using a 3-D Mallat decomposition, which would be analogous to the2-D Mallat decomposition used by ICER, a slightly different decomposition structure is used. Follow-ing this wavelet decomposition, mean values are subtracted from spatial planes of spatially low-pass
3

subbands. These steps are described in Section III, and a detailed discussion of the motivation behindthis approach is given in [9,10].
Error-containment segments in ICER-3D are defined spatially (in the wavelet transform domain). Thewavelet-transformed data are partitioned in much the same way as in ICER, except that in ICER-3Dthe segments extend through all spectral bands. Error-containment segments in ICER and ICER-3D aredefined using the same rectangle partitioning algorithm; it is described in [1, Section V.D].
In ICER-3D, as in ICER, the trade-off between rate and distortion is controlled by two parameters,one that limits the number of compressed bytes produced and another that limits the number of subbandbit planes encoded. The correspondence of this latter parameter to the set of bit planes that can beencoded is described in Sections IV.A and IV.B.
Probability estimates used in the encoding process are derived via context modeling. Under contextmodeling, a bit of a DWT coefficient to be encoded is classified into one of several contexts based onpreviously encoded data. In ICER-3D, contexts are defined based on two neighboring coefficients inthe spectral dimension and no neighboring coefficients in the same spatial plane. This contrasts withthe context modeling scheme used by ICER, which makes use of previously encoded information fromspatially neighboring coefficients. The ICER-3D context modeler is described in Section IV.C.
III. Three-Dimensional Wavelet Decomposition
A. Decomposition Structure
When using 3-D wavelet transforms for hyperspectral image compression, systematic variations insignal level of different spectral bands can cause the mean values of spatial planes of spatially low-passsubbands to vary widely. Failing to account for this phenomenon can have detrimental effects on imagecompression, including reduced effectiveness in compressing spatially low-pass subband data and biasesin some reconstructed spectral bands (“spectral ringing”) [9].
In ICER-3D these effects are mitigated by the choice of the wavelet decomposition structure used, andby subtracting the mean value from each spatial plane of each spatially low-pass subband. This approachvirtually eliminates biases in reconstructed spectral bands and provides an improvement in subjectivereconstructed image quality. These benefits are described in more detail in [9]. Here we describe thedecomposition procedure used in ICER-3D.
In ICER-3D, the subband decomposition is extended from the 3-D Mallat decomposition so thatin stages of decomposition after the first, not only is the low-pass subband further decomposed, butspatially low-pass, spectrally high-pass subbands are also further decomposed spatially. An illustrationof this subband decomposition is provided in Fig. 3. The decomposition can be alternately described asfollows: first, a 2-D Mallat decomposition with the desired number of levels is performed (spatially) onevery spectral band. Then, a single level of spectral decomposition is applied across the first-level spatialsubbands; a two-level one-dimensional Mallat decomposition is applied spectrally across the second-levelspatial subbands; and so on.4
This decomposition structure is motivated by the observation that, in a 3-D wavelet decomposition,the spatially low-pass, spectrally high-pass subbands have spatial planes that look qualitatively simi-lar to spatial planes in the low-pass subband (see [9]). This suggests using additional decompositions ofthe spatially low-pass, spectrally high-pass spatial planes to improve compression effectiveness in the same
4 This alternate description does not produce exactly the same result, because the integer DWT is not quite linear due torounding operations. Another consequence of this nonlinearity is that the decoder should perform the inverse transformoperation in exactly the reverse order in which the corresponding forward transforms were performed.
4

2
0
3
9
48
22
15 10
16
26
1420
52529
1724 7
16
111827
30
23
28
x
λ
y
19
2113
12
SPATIALLYLOW-PASSSUBBANDS
LOW-PASSSUBBAND
Fig. 3. The 3-D wavelet decomposition scheme used by ICER-3D, illustrated here with three levels of decomposition. The x, y, and λ labels identify the horizontal, vertical, and spectral axes, respectively. Each subband is labeled with an index using the subband numbering scheme described in the Appendix.
way that additional decompositions of the low-pass subband in a 2-D Mallat decomposition improvecompression effectiveness.
After the 3-D wavelet decomposition is performed, mean values are computed for and subtractedfrom each spatial plane of each error-containment segment of each spatially low-pass subband,5 thuscompensating for the fact that such spatial planes often have mean values that are far from zero [9]. Theresulting data are converted to sign-magnitude form and compressed (see Section IV). The mean valuesare encoded in the compressed bitstream and added back to the data at the appropriate decompressionstep. The overhead incurred by encoding the mean values is only a few bits per spectral band per segment,which is negligible because of the huge size of hyperspectral data sets.
Note that it is important to subtract the means after all stages of subband decomposition; otherwise,if two adjacent error-containment segments have significantly different means, a sharp edge would appearafter subtracting the means, artificially increasing the high-frequency signal content in further stages ofspatial decomposition.
B. Dynamic Range of Wavelet-Transformed Data
In general, the range of possible output values from a reversible DWT can be larger than the rangeof input values [11]; we refer to such an increase as dynamic range expansion. The amount of dynamicrange expansion can increase with multiple filtering operations. Dynamic range expansion can be an issuebecause storage of wavelet-transformed samples may require binary words that are larger than those usedfor the original samples. In particular, one must pay attention to the degree of dynamic range expansion
5 For simplicity of terminology, we use the term “DWT coefficient” to refer to both the coefficient value as well as the valuefollowing the mean subtraction operation.
5
if the wavelet decomposition is performed in-place, i.e., when memory locations originally used to storeimage samples are subsequently used to store DWT coefficients. Dynamic range expansion is analyzedfor ICER in [1]. Here we extend the results to ICER-3D.
For the filters used in ICER and ICER-3D, low-pass filtering does not expand the dynamic range,but high-pass filtering does. The dynamic range expansion following a single one-dimensional high-passfiltering operation can be described (see [1]) by the approximation
hmax − hmin ≈ (xmax − xmin)γ
Here xmax and xmin denote the maximum and minimum possible values input to the DWT, and hmax
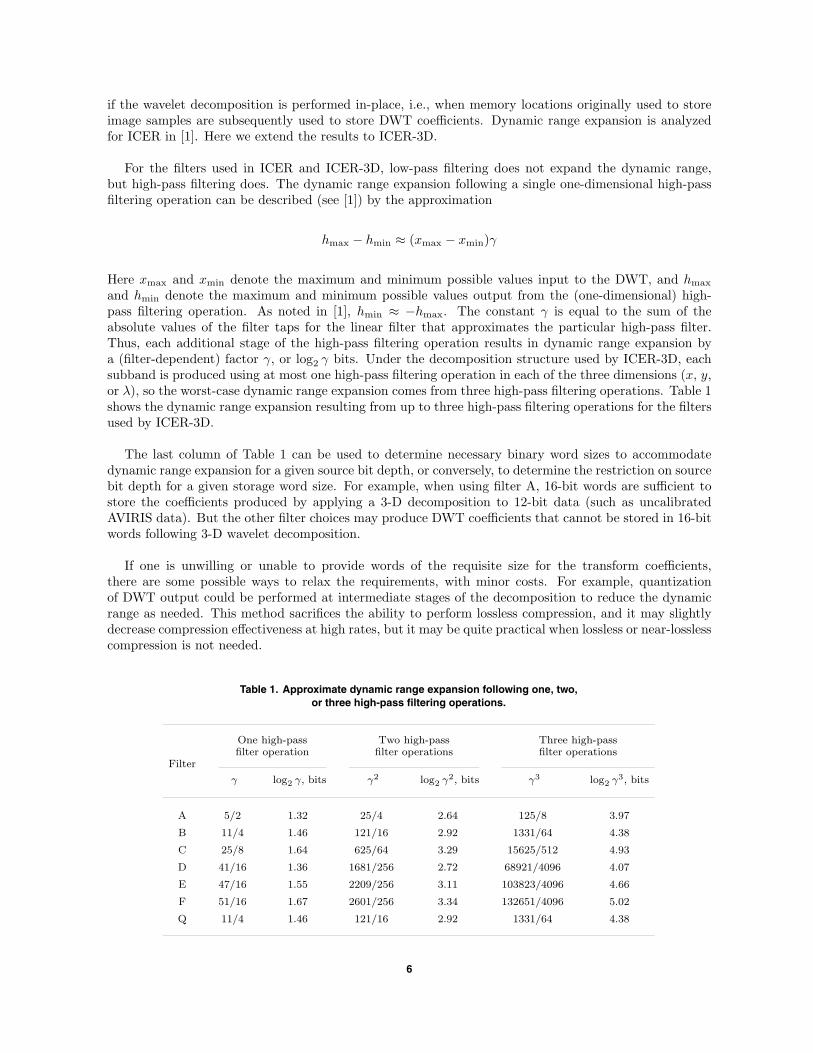
and hmin denote the maximum and minimum possible values output from the (one-dimensional) high-pass filtering operation. As noted in [1], hmin ≈ −hmax. The constant γ is equal to the sum of theabsolute values of the filter taps for the linear filter that approximates the particular high-pass filter.Thus, each additional stage of the high-pass filtering operation results in dynamic range expansion bya (filter-dependent) factor γ, or log2 γ bits. Under the decomposition structure used by ICER-3D, eachsubband is produced using at most one high-pass filtering operation in each of the three dimensions (x, y,or λ), so the worst-case dynamic range expansion comes from three high-pass filtering operations. Table 1shows the dynamic range expansion resulting from up to three high-pass filtering operations for the filtersused by ICER-3D.
The last column of Table 1 can be used to determine necessary binary word sizes to accommodatedynamic range expansion for a given source bit depth, or conversely, to determine the restriction on sourcebit depth for a given storage word size. For example, when using filter A, 16-bit words are sufficient tostore the coefficients produced by applying a 3-D decomposition to 12-bit data (such as uncalibratedAVIRIS data). But the other filter choices may produce DWT coefficients that cannot be stored in 16-bitwords following 3-D wavelet decomposition.
If one is unwilling or unable to provide words of the requisite size for the transform coefficients,there are some possible ways to relax the requirements, with minor costs. For example, quantizationof DWT output could be performed at intermediate stages of the decomposition to reduce the dynamicrange as needed. This method sacrifices the ability to perform lossless compression, and it may slightlydecrease compression effectiveness at high rates, but it may be quite practical when lossless or near-losslesscompression is not needed.
Table 1. Approximate dynamic range expansion following one, two,or three high-pass filtering operations.
One high-pass Two high-pass Three high-passfilter operation filter operations filter operations
Filter
γ log2 γ, bits γ2 log2 γ2, bits γ3 log2 γ3, bits
A 5/2 1.32 25/4 2.64 125/8 3.97
B 11/4 1.46 121/16 2.92 1331/64 4.38
C 25/8 1.64 625/64 3.29 15625/512 4.93
D 41/16 1.36 1681/256 2.72 68921/4096 4.07
E 47/16 1.55 2209/256 3.11 103823/4096 4.66
F 51/16 1.67 2601/256 3.34 132651/4096 5.02
Q 11/4 1.46 121/16 2.92 1331/64 4.38
6

For all examples in this article, wavelet transforms are performed using filter A, which is the integer 2/6DWT filter pair described in [1,12,13].
IV. Bit-Plane Coding
Following the wavelet decomposition and mean subtraction procedure described in Section III.A, eachDWT coefficient is converted to sign-magnitude form. Magnitude bit planes of subbands are compressedone at a time; when the first ‘1’ magnitude bit of a coefficient is encoded, the sign bit is encodedimmediately afterward. Compressed bit planes of different subbands are interleaved so that earlier bitplanes tend to yield larger improvements in reconstructed image quality per compressed bit.
Subband bit planes are compressed in order of decreasing priority value according to the simple priorityassignment scheme described below. Bit planes having the same priority value (which are necessarily fromdifferent subbands) are compressed in order of decreasing subband index, using the index assignmentdescribed in the Appendix.
A. Assigning Priority Values to Subband Bit Planes
For each subband, we can determine a weight that indicates the approximate relative effect, per coeffi-cient of the subband, on mean-squared error (MSE) distortion in the reconstructed image. These weightsdetermine weights of subband bit planes, thereby indicating relative subband bit-plane priorities [1,13].A subband weight can be expressed in terms of the number of stages of high-pass and low-pass filteringoperations, denoted H and L, respectively, used to form a subband. For example, consider subband 21in Fig. 3. To form this subband, three stages of low-pass filtering are applied in the vertical dimension;two stages of low-pass filtering followed by one stage of high-pass filtering are applied in the horizontaldimension; and one stage each of low-pass filtering and high-pass filtering are applied in the spectraldimension. Thus, H = 2 and L = 6 for this subband.
The weight w assigned to bit plane b of a subband depends on H and L:
w = 2b ·(√
2)L−H =
(√2
)2b+L−H (1)
Here, bit planes in a subband are indexed starting with b = 0 for the least-significant bit. This weightscheme amounts to a 3-D extension of the weight scheme described in [1] for the 2-D case.
Any monotonic function of the weight in Eq. (1) can be used to determine the relative importance ofsubband bit planes, so rather than keeping track of real-valued weights given by Eq. (1), we define integer“priority” values p of subband bit planes, given by
p = 3 + log√2(w) = 2b + L − H + 3 (2)
This definition produces a minimum priority value of 0, since H ≤ 3 and L ≥ 0 for all subbands.
As an example, since H = 2 and L = 6 for subband 21, bit plane b of this subband is assigned priorityvalue
p = 2b + 7
Thus, all bit planes of subband 21 have odd priority value, with a minimum value of 7. For subband 3,H = 2 and L = 1, so bit plane b of this subband has priority
7

p = 2b + 2
For this subband, all bit planes have even priority value, with a minimum value of 2.
In general, since L and H are fixed for a given subband, all of the bit planes in a subband haveeven-valued priority, or all have odd-valued priority. As illustrated in Fig. 4, the DWT coefficients witheven-valued bit-plane priorities significantly outnumber those with odd-valued priorities.
Additionally, a consequence of the priority definition in Eq. (2) is that only subband 0 has a bit planewith priority 0, and no subbands have bit planes with priority 1. The histogram of Fig. 5 shows thefraction of DWT coefficients that have bits with a given priority value.
x
λ
y
Fig. 4. Bit planes in the dark subbands have only odd-valued priorities. Bit planes in the light subbands have only even-valued priorities.
0.50
0.00
0.75
0.25
1.00
0 2 4 6 8 10 12
PRIORITY VALUE
FR
AC
TIO
N O
F D
WT
CO
EF
FIC
IEN
TS
Fig. 5. Fraction of DWT coefficients that have a bit plane with a given priority value for three stages of decomposition.
8

B. Controlling Image Quality and Amount of Compression
ICER-3D provides two parameters that together are the primary means of controlling image qualityand amount of compression: a byte quota, indicating a rough maximum number of compressed bytes toproduce, and an integer minimum loss parameter q that tells the compressor to stop when all subbandbit planes having priority value q have been encoded. (Note that a lower value of q corresponds to ahigher quality.) ICER-3D stops producing compressed bytes once the quality goal (as expressed by theminimum loss value) or byte quota is met, whichever comes first. Setting the minimum loss parameterto zero will result in compression limited only by the byte quota, and thus compression is lossless whenthe byte quota is sufficiently large.
This is the same strategy for controlling the compressed data volume and image quality as that used inICER. In both compressors, the minimum loss parameter controls the minimum amount of quantizationperformed on the DWT coefficients. Each unit increment corresponds to a set of subband bit planes withthe next priority value. In general, a minimum loss value of q in ICER is very roughly equivalent to aminimum loss value of 2q in ICER-3D, because successive bit planes of a subband have priority valuesthat differ by 1 in ICER and 2 in ICER-3D. This equivalence is approximate because the coefficientsdo not have corresponding meanings (2-D versus 3-D decomposition) and the proportions of bits withequivalent priority values do not match.
A consequence of the imbalance between the fraction of bits with even-valued and odd-valued priorities,as described in Section IV.A, is that if we plot rate-distortion points obtained by compressing to eachvalue of the minimum loss parameter, the rate-distortion points cluster in pairs, as illustrated in Fig. 6.This phenomenon does not occur in ICER, where the points are more uniformly spaced.
C. Context Modeling
The general strategy used by ICER-3D for encoding subband bit planes is as follows. Before encodinga bit, the encoder calculates an estimate of the probability that the bit is a zero. This probability-of-zeroestimate relies only on previously encoded information from the same segment. The bit and its probability-of-zero estimate are sent to the entropy coder, which compresses the sequence of bits it receives. This
RATE, bits/sample
ME
AN
-SQ
UA
RE
D E
RR
OR
0 21 4 53 6
103
104
102
10
1
10−1
10−2q = 2
q = 6q = 5
q = 4
q = 3
q = 8q = 7
q = 10q = 9
q = 12q = 11q = 14
q = 13
q = 16q = 15
Fig. 6. When compression is limited by the minimum loss parameter q, rate-distortion points cluster in pairs, as illustrated in this example for Moffett Field, scene 1.
9

strategy is the same as that used by ICER. For entropy coding, ICER-3D uses an interleaved entropycoder; it is the same as that used by ICER, as described in [1, Section IV].
Probability estimates are computed using a technique known as context modeling. With this technique,a bit to be encoded is first classified into one of several contexts based on the values of previously encodedbits. The intent is to define contexts that divide bits with different probability-of-zero statistics intodifferent classes for which separate statistics are gathered. The compressor can then estimate theseprobabilities of zero reasonably well from the bits it encounters in the contexts. Within this framework,a simple adaptive procedure, also used by ICER and described in [1, Section III.B], is used to estimateprobabilities.
ICER-3D employs a one-dimensional spectral context model with context definitions that rely on twoneighbors in the spectral direction but no neighbors in the same spatial plane. Note that ICER uses atwo-dimensional context model relying on eight (spatial) neighbors.
Encoding of an error-containment segment of a subband bit plane proceeds one spatial plane at a timeand in raster scan order within a spatial plane. This encoding order means that a given context willoften be assigned many consecutive bits from the same spatial plane, so probability estimation for thecontext can adapt to the dependency appropriate for the spatial plane being encoded without needing tokeep separate statistics for each spatial plane. (For example, when encoding sign bits, the statistics willautomatically adapt to exploit both positive and negative correlations between adjacent spatial planes.)In our experiments, maintaining separate context statistics for each spatial plane in a subband segmentmade little difference in compression effectiveness, but presumably this would not be the case if the codingorder were changed.
During the encoding process, ICER-3D maintains a classification of DWT coefficients into categories.There are four categories, numbered 0–3. A coefficient’s category initially is 0 and remains so as long asthe magnitude bits encoded for the coefficient are all zeros; after the first ‘1’ bit from the coefficient isencoded, the coefficient’s category becomes 1; when the next magnitude bit from the coefficient is encoded,its category becomes 2; and, finally, when one more magnitude bit from the coefficient is encoded, itscategory becomes 3 and remains 3 permanently.
ICER-3D uses 19 contexts to classify bits to be encoded that are likely to be compressible. Each contextis identified by a label; e.g., we use 1-a through 1-c to identify contexts for bits of DWT coefficients incategory 1. Table 2 summarizes the number of contexts used in ICER-3D and ICER for each bit type.The context of a bit is determined using the category of the DWT coefficient containing the bit and thecategory and signs of the two neighboring coefficients in the spectral dimension. Let C− and C+ denotethe categories of the neighbors in the previous spatial plane and the next plane, respectively. If one ofthese coefficients is not available because the coefficient being encoded is in the first or last spatial planeof the subband, the missing coefficients are treated as being in category 0 (i.e., C− = 0 or C+ = 0).
Table 2. Summary of ICER-3D and ICER contexts.
Bit type ICER-3D ICER
Category 0 9 contexts 9 contexts
Category 1 3 contexts 2 contexts
Category 2 2 contexts 1 context
Category 3 No compression No compression
Sign bits 5 contexts 5 contexts
Total 19 contexts 17 contexts
10

A bit to be encoded from a coefficient in category 0 is classified into one of nine contexts according toTable 3. Further partitioning of contexts based on signs of the spectral neighbors provided no improvementin our experiments. In fact, experiments suggest that contexts 0-g to 0-i (i.e., contexts for which C+ ≥ 2)could be sent uncoded without having much impact on compression effectiveness.
Tables 4 and 5 indicate how contexts are assigned to bits of coefficients in categories 1 and 2. We triedfurther splitting the category 2 contexts based on the value of the preceding bit in the current coefficient,but this made little difference. Bits of coefficients in category 3 are empirically nearly incompressible;that is, estimates of these bits’ probabilities of zero tend to be very close to 1/2. Therefore, these bitsare left uncoded in the compressor’s output.
Sign bits are not encoded directly; rather, the context modeler first predicts the sign bit and thenencodes an “agreement” bit that is the exclusive-or of the sign bit and its predicted value. The agreement-bit statistics associated with a sign context are used to estimate a probability of zero for future agreementbits in the context in exactly the same manner as magnitude bits in magnitude contexts.
We use S− and S+ to denote the sign bits of the coefficients in the same spatial location in the previousspatial plane and the next plane, respectively, within the subband. We use the symbols +, −, or 0 toindicate whether the sign bit of the corresponding DWT coefficient is positive, negative, or not yet known.Sign-bit predictions and contexts are assigned according to Table 6.
Table 3. Contexts for bits of DWT coefficientsin category 0.
C+ = 0 C+ = 1 C+ ≥ 2
C− = 0 0-a 0-d 0-g
C− = 1 0-b 0-e 0-h
C− ≥ 2 0-c 0-f 0-i
Table 4. Contexts for bits of DWT coefficientsin category 1.
C+ = 0 C+ = 1 C+ ≥ 2
C− < 2 1-a 1-a 1-a
C− ≥ 2 1-a 1-b 1-c
Table 5. Contexts for bits of DWT coefficientsin category 2.
C+ < 2 C+ ≥ 2
C− < 2 2-a 2-a
C− ≥ 2 2-a 2-b
11

Table 6. Sign predictions and contexts for sign bits.
S+ = + S+ = 0 S+ = −
S− = + +, S-e +, S-d +, S-b
S− = 0 +, S-c +, S-a −, S-c
S− = − −, S-b −, S-d −, S-e
In our experiments, sign bits in contexts S-a and S-b tend to be nearly incompressible. This is perhapsnot surprising; in context S-a the signs of both spectral neighbors are unknown, and in context S-b thesigns of the spectral neighbors have conflicting values. It’s tempting to further partition sign bits inthese contexts based on signs of (spatially) neighboring coefficients, but our experiments along these linesproduced no improvement in compression effectiveness.
Because the contexts for the four types of bits that are compressed (category 0, 1, and 2 bits, andsign bits) do not overlap, the compression of each of these types of bits can be assessed independently.We experimented with using some or all of the spatial context models of ICER in place of the spectralcontext models used by ICER-3D. Figures 7 through 9 illustrate the benefit provided by the spectralmodels.
Figure 7 illustrates the impact on rate-distortion performance of altering the context model used forsign bits while using the spatial context models for bits of coefficients in categories 0–2. The spectral sign-bit context model (b) is noticeably more effective than the spatial sign-bit context model (a). Curves (c)and (d) were obtained by assuming each sign bit is compressed to 1 bit or 0 bits, respectively. That is,curve (c) is obtainable by including sign bits in the bitstream without compression, and curve (d) is whatone would obtain if sign bits could be encoded for free. Thus, curves (c) and (d) are bounds on the rangeof rate-distortion performance results that one might obtain by only varying the method of encoding signbits. We note that the spatial context model for sign bits achieves performance only slightly better than
(b)
(d)
(a)
(c)
RATE, bits/sample
ME
AN
-SQ
UA
RE
D E
RR
OR
0 1 2 3
10
102
103
104
Fig. 7. Rate-distortion results for Moffett Field, scene 1, when sign bits are coded using (a) the spatial context model or (b) the spectral context model. The spatial context models are used for bits of coefficients in categories 0−2. Curves (c) and (d) are bounds obtained by assuming each sign bit is compressed to 1 or 0 bits, respectively.
12
(c)
(b)
(a)
(d)
RATE, bits/sample
ME
AN
-SQ
UA
RE
D E
RR
OR
0 1 2 3
10
102
103
104
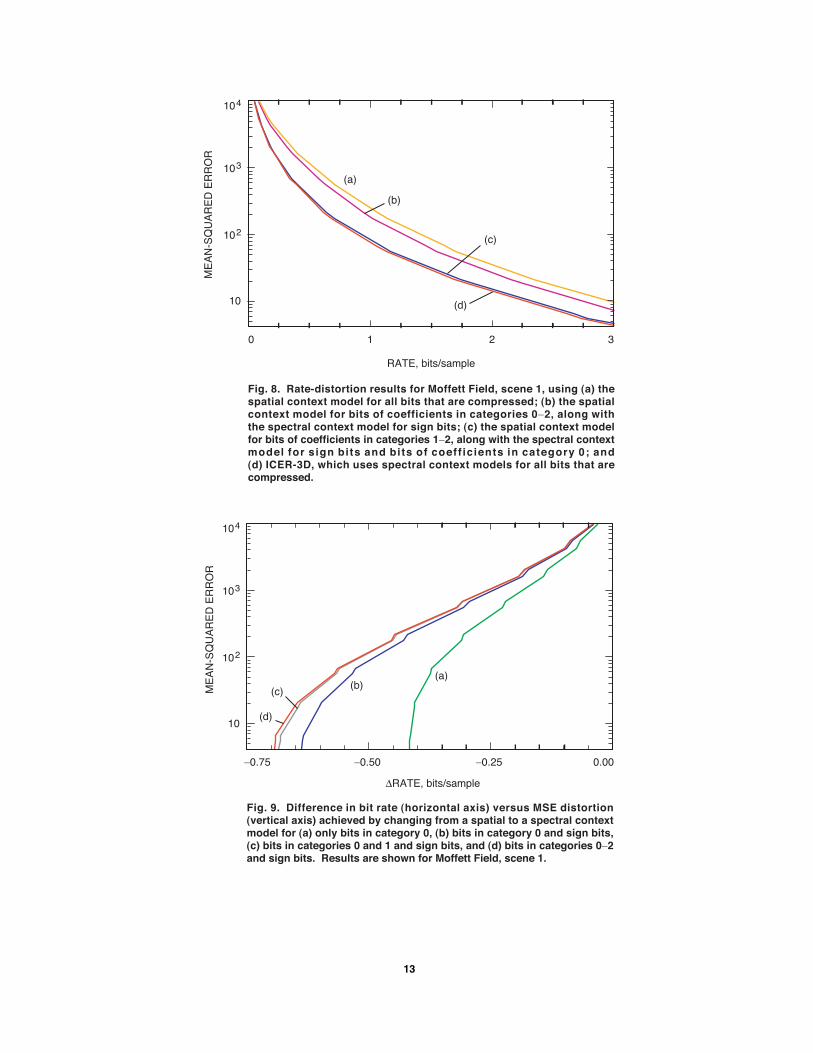
Fig. 8. Rate-distortion results for Moffett Field, scene 1, using (a) the spatial context model for all bits that are compressed; (b) the spatial context model for bits of coefficients in categories 0−2, along with the spectral context model for sign bits; (c) the spatial context model for bits of coefficients in categories 1−2, along with the spectral context model for sign bits and bits of coeff icients in category 0; and (d) ICER-3D, which uses spectral context models for all bits that are compressed.
(c)(b)
(a)
(d)10
102
103
104
∆RATE, bits/sample
−0.75 −0.50 −0.25 0.00
ME
AN
-SQ
UA
RE
D E
RR
OR
Fig. 9. Difference in bit rate (horizontal axis) versus MSE distortion (vertical axis) achieved by changing from a spatial to a spectral context model for (a) only bits in category 0, (b) bits in category 0 and sign bits, (c) bits in categories 0 and 1 and sign bits, and (d) bits in categories 0−2 and sign bits. Results are shown for Moffett Field, scene 1.
13

no compression—i.e., sign bits are not well-predicted under the spatial context model. The performanceimproves noticeably for the spectral context model, suggesting that the spectral context model does areasonably good job of exploiting strong correlations between adjacent spatial planes of subbands. Inour experiments, we observed that the spectral context model for sign bits provides a large improvementover the spatial model for subbands that are spectrally low-pass, and a small improvement in the othersubbands.
Figure 8 illustrates the effect on rate-distortion performance as we incrementally convert from a spatialto a spectral context model for the different types of bits that are compressed. Figure 9 illustrates thissame effect in terms of the difference in rate achieved. The improvement is significant for sign bits andbits in category 0, and small for bits in categories 1 and 2. In fact, there may be some merit to animplementation in which one sends bits in categories 1 and 2 without compression as a complexity-savingmeasure; Fig. 10 illustrates the impact that this would have on compression effectiveness. The relativelypoor compression performance on bits in categories 1 and 2 is consistent with the conventional wisdomthat magnitude bits beyond the first ‘1’ bit in a DWT coefficient are difficult to predict.
V. Results
A. Lossless Compression
Table 7 shows the lossless compression performance of ICER-3D on five 1997 calibrated AVIRISradiance data sets.6 For comparison, the table also shows results for the “fast lossless” compressorfrom [14], the Rice compressor used in the Universal Source Encoder for Space (USES) chip using themultispectral predictor option mentioned in [15], ICER applied independently to individual spatial planesor spatial–spectral planes, and the JPEG-LS image compressor [16] applied independently to individualspatial planes. More extensive lossless hyperspectral compression results for several compressors, includingICER-3D, are available in [14].
(a)(b)
RATE, bits/sample
ME
AN
-SQ
UA
RE
D E
RR
OR
0 1 2 3
10
102
103
104
Fig. 10. Rate-distortion results for Moffett Field, scene 1, using (a) ICER-3D (spectral context model for all bits that are compressed) and (b) the spectral context model for sign bits and category 0, but including bits in categories 1 and 2 without compression.
6 Available from the AVIRIS web site, http://aviris.jpl.nasa.gov.
14

Table 7. Lossless compression results (rate in bits/sample) for calibrated 1997 AVIRIS radiance datasets.Data for JPEG-LS, Rice/USES, and the “fast lossless” compressor are taken from [14].
Fast Rice/USES ICER ICER JPEG-LSDataset ICER-3D
lossless multispectral spatial–spectral spatial (2-D)
Cuprite 5.21 4.95 6.04 6.13 6.95 7.24
Jasper Ridge 5.42 5.04 6.17 6.24 7.60 7.78
Low altitude 5.63 5.34 6.47 6.41 7.36 7.66
Lunar Lake 5.16 4.97 5.99 6.03 6.79 6.97
Moffett Field 5.33 5.07 6.13 6.11 7.22 7.46
Average 5.35 5.07 6.16 6.18 7.19 7.42
The results of Table 7 indicate that ICER-3D gives more effective lossless compression than simpletwo-dimensional approaches or the USES multispectral compressor. But ICER-3D is outperformed bythe much simpler fast lossless compressor of [14], which would seem to be a preferable compressor whenlossless compression is the only concern. However, it could be sensible to use ICER-3D for losslesscompression in an application where it is already required to be present to perform lossy compression.
B. Lossy Compression
Figures 11 and 12 show the rate-distortion performance obtained for two AVIRIS scenes. Details fromfalse-color images produced from the reconstructed scenes after compression to 0.1 and 0.25 bits/sampleare shown in Figs. 13 and 14, respectively. These images were produced by mapping band 139 to red,89 to green, and 18 to blue. For all cases, compression was performed using three stages of waveletdecomposition and four error-containment segments.
In each of these figures, result (a) is obtained by applying ICER independently to individual spectralbands, and result (b) is obtained by a straightforward 3-D extension of ICER, specifically, a compressorthat uses a 3-D Mallat decomposition and spatial context models. Each result (c) and (d) illustrates thebenefit provided by the two key features that distinguish ICER-3D from this straightforward extension:(c) is produced using the modified decomposition and mean subtraction technique combined with thespatial context models, and (d) is obtained when, in addition, the spatial context models are replacedwith the spectral models, so that the compressor used is the full ICER-3D.
As an example of the increase in compression effectiveness that can be obtained by exploiting3-D structure in hyperspectral data, consider the rate-distortion performance shown in Fig. 11 forthe Moffett Field scene. To obtain the MSE distortion produced by ICER-3D at 0.25 bits/sample re-quires about 1.15 bits/sample using ICER applied independently to individual spectral bands, and about0.55 bits/sample using the 3-D Mallat decomposition combined with the spatial context modeler. Thus,at distortion levels achieved near these rates, a straightforward 3-D extension of ICER yields roughly afactor of 2 reduction in bit rate. ICER-3D attains about an additional factor of 2 reduction in bit rateby using the modified decomposition and mean subtraction combined with the spectral context modeler.Similar results hold for the Cuprite scene, as shown in Fig. 12.
15

(c)
(b)
(a)
(d)
RATE, bits/sample
ME
AN
-SQ
UA
RE
D E
RR
OR
0 1 2 3
10
102
103
104
Fig. 11. Rate-distortion results for Moffett Field, scene 1, using (a) ICER applied independently to individual bands, (b) 3-D Mallat decomposition along with the spatial context models, (c) modified decomposition and mean subtraction with spatial context models, and (d) ICER-3D.
(c)
(b)
(a)
(d)
RATE, bits/sample
ME
AN
-SQ
UA
RE
D E
RR
OR
0 1 2 3
10
102
103
104
Fig. 12. Rate-distortion results for Cuprite, scene 1, using (a) ICER applied independently to individual bands, (b) 3-D Mallat decomposition along with the spatial context models, (c) modified decomposition and mean subtraction with spatial context models, and (d) ICER-3D.
16

Fig. 13. Details from false-color images produced from the Moffett Field scene compressed using (a) ICER applied independently to individual bands, (b) a 3-D Mallat decomposition combined with the spatial context models, (c) the modified decompo-sition and mean subtraction technique combined with the spatial context models, and (d) ICER-3D. The original image is shown in (e). In each case, the entire hyperspectral scene was compressed to 0.1 bits/sample.
17
(a) (b)
(c) (d)
(e)

Fig. 14. Details from false-color images produced from the Moffett Field scene compressed using (a) ICER applied independently to individual bands, (b) a 3-D Mallat decomposition combined with the spatial context models, (c) the modified decompo-sition and mean subtraction technique combined with the spatial context models, and (d) ICER-3D. The original image is shown in (e). In each case, the entire hyperspectral scene was compressed to 0.25 bits/sample.
18
(a) (b)
(c) (d)
(e)
VI. Hardware Implementation on a Reconfigurable Platform
Given the high data rates produced by hyperspectral imaging instruments and the huge data volumesgenerated, as well as the fact that ICER-3D is moderately computationally intensive, some missions willfind it impractical to use a software implementation of ICER-3D. To address this issue, a hardware im-plementation has been developed. This effort was led by the fourth author. ICER-3D and the compressorimplemented in hardware have some differences that are a result of some of the hardware developmentpredating ICER-3D as described here; we refer to the version implemented in hardware as ‘ICER-3D*.’
In ICER-3D* the wavelet decomposition is the three-level Mallat 3-D decomposition, but, as inICER-3D, mean values are subtracted from each spatial plane of spatially low-pass subbands. Thewavelet transform is performed using Filter A. Context modeling is performed using the spatial contexts.A high priority for future work is migration of the new spectral context models to the hardware platform.
The ICER-3D* implementation is on a single Xilinx Virtex II Pro (XC2VP70) field programmablegate array (FPGA) using a commercial board from The Dini Group. The implementation is an encoderthat includes efficient implementations of the main modules of ICER-3D*: the 3-D wavelet transform, thecontext modeler, and the entropy coder. It takes advantage of the embedded PowerPC Reduced Instruc-tion Set Computer (RISC) core and the flexible on-chip bus architecture. The implementation featuresefficient utilization of off-chip memory through internal buffering to minimize intensive input/output(I/O) operations. The implementation is scalable in that it allows combining of multiple hardware coresin parallel to provide higher throughput. The reconfigurability of the Xilinx Virtex II Pro FPGA allowsfor the possibility of in situ reprogramming to meet different needs of a single mission without addedhardware.
The current prototype provides a throughput of 4.5 Msamples/s for lossless compression with a singlemodule implementation and a conservative clock speed of 50 MHz. The throughput is higher for lossycompression, and would further increase substantially with a higher clock speed and/or use of parallelmodules. The power consumption of an implementation with two cores of each module used in parallelis 6.5 W; this implementation utilizes about 60 percent of the chip resources. Further details of theICER-3D* hardware implementation will be presented in a future article.7
VII. Conclusion
The tremendous volume of hyperspectral data sets makes effective data compression an importantconsideration for any space mission that includes a hyperspectral imager in its payload. Exploiting the3-D structure of such data sets allows substantially more effective compression than 2-D compressionapproaches.
ICER-3D exploits 3-D data dependencies in part by using a 3-D wavelet decomposition. The particulardecomposition used by ICER-3D includes additional spatial decomposition steps compared to a 3-D Mallatdecomposition. This modified decomposition provides benefits in the form of quantitatively improvedrate-distortion performance and in the elimination of spectral ringing artifacts.
ICER-3D takes advantage of the correlation properties of wavelet-transformed hyperspectral data byusing a context modeling procedure that emphasizes spectral (rather than spatial) dependencies in thewavelet-transformed data. This provides a significant gain over the alternative spatial context modelerconsidered.
ICER-3D also inherits some important features of ICER, including progressive compression, the abilityto perform lossless and lossy compression, and an effective error-containment scheme to limit the effectsof data loss on the deep-space channel.
7 N. Aranki, J. Namkung, and C. Villalpando, “Hyperspectral Data Compression on Reconfigurable Platforms,” in prepa-ration for submittal to The Interplanetary Network Progress Report.
19

References
[1] A. Kiely and M. Klimesh, “The ICER Progressive Wavelet Image Compressor,”The Interplanetary Network Progress Report 42-155, July–September 2003, JetPropulsion Laboratory, Pasadena, California, pp. 1–46, November 15, 2003.http://ipnpr.jpl.nasa.gov/tmo/progress report/42-155/156J.pdf
[2] A. Kiely and M. Klimesh, “Preliminary Image Compression Results from theMars Exploration Rovers,” The Interplanetary Network Progress Report, vol.42-156, Jet Propulsion Laboratory, Pasadena, California, pp. 1–8, February 15,2004.http://ipnpr.jpl.nasa.gov/tmo/progress report/42-156/156I.pdf
[3] X. Tang, S. Cho, and W. A. Pearlman, “3D Set Partitioning Coding Methodsin Hyperspectral Image Compression,” Proc. 2003 International Conference onImage Processing, vol. II, Barcelona, Spain, pp. II-239–II-242, September 14–17,2003.
[4] Y. Wang, J. T. Rucker, and J. E. Fowler, “Three-Dimensional Tarp Codingfor the Compression of Hyperspectral Images,” IEEE Geoscience and RemoteSensing Letters, vol. 1, no. 2, pp. 136–140, April 2004.
[5] S. Lim, K. Sohn, and C. Lee, “Compression for Hyperspectral Images UsingThree Dimensional Wavelet Transform,” Proc. IEEE 2001 International Geo-science and Remote Sensing Symposium (IGARSS ’01), vol. 1, Sydney, Australia,pp. 109–111, July 9–13, 2001.
[6] G. Vane, R. Green, T. Chrien, H. Enmark, E. Hansen, and W. Porter, “TheAirborne Visible/Infrared Imaging Spectrometer (AVIRIS),” Remote Sensing ofEnvironment, vol. 44, pp. 127–143, 1993.
[7] S. G. Mallat, “A Theory for Multiresolution Signal Decomposition: The WaveletRepresentation,” IEEE Transactions on Pattern Analysis and Machine Intelli-gence, vol. 11, no. 7, pp. 674–693, July 1989.
[8] D. Taubman, “High Performance Scalable Image Compression with EBCOT,”IEEE Transactions on Image Processing, vol. 9, no. 7, pp. 1158–1170, July 2000.
[9] M. Klimesh, A. Kiely, H. Xie, and N. Aranki, “Spectral Ringing Artifacts inHyperspectral Image Data Compression,” The Interplanetary Network ProgressReport, vol. 42-160, Jet Propulsion Laboratory, Pasadena, California, pp. 1–17,February 15, 2005.http://ipnpr.jpl.nasa.gov/tmo/progress report/42-160/160C.pdf
[10] M. Klimesh, A. Kiely, H. Xie, and N. Aranki, “Spectral Ringing Artifactsin Hyperspectral Image Data Compression,” Hyperspectral Data Compression,G. Motta, F. Rizzo, and J. Storer, eds., New York: Springer, 2006.
[11] B. Masschelein, B. Vanhoof, L. Nachtergaele, J. Bormans, and I. Bolsens, “Im-plementation Driven Selection of Wavelet Filters for Still Image Coding Basedon Bitrange Expansion,” IEEE International Workshop on Multimedia SignalProcessing, Copenhagen, Denmark, pp. 371–376, September 13–15, 1999.
[12] M. D. Adams and F. Kossentini, “Reversible Integer-to-Integer Wavelet Trans-forms for Image Compression: Performance Evaluation and Analysis,” IEEETransactions on Image Processing, vol. 9, no. 7, pp. 1010–1024, June 2000.
[13] A. Said and W. Pearlman, “A New, Fast, and Efficient Image Codec Based on SetPartitioning in Hierarchical Trees,” IEEE Transactions on Circuits and Systemsfor Video Technology, vol. 6, no. 3, pp. 243–250, June 1993.
20

[14] M. Klimesh, “Low-Complexity Lossless Compression of Hyperspecral Imageryvia Adaptive Filtering,” The Interplanetary Network Progress Report, vol.42-163, Jet Propulsion Laboratory, Pasadena, California, pp. 1–10, November 15,2005. http://ipnpr.jpl.nasa.gov/tmo/progress report/42-163/163H.pdf
[15] J. Venbrux, J. Gambles, D. Wiseman, G. Zweigle, W. H. Miller, and P.-S. Yeh,“A VLSI Chip Set Development for Lossless Data Compression,” Ninth AIAAComputing in Aerospace Conference, San Diego, California, October 19–21, 1993.
[16] M. J. Weinberger, G. Seroussi, and G. Sapiro, “The LOCO-I Lossless ImageCompression Algorithm: Principles and Standardization into JPEG-LS,” IEEETransactions on Image Processing, vol. 9, no. 8, pp. 1309–1324, August 2000.
Appendix
Subband Index Assignment
Each subband produced by the 3-D wavelet decomposition described in Section III.A is assigned anindex, with indices numbered starting from 0. The index assignment is used (along with the bit-planepriority assignment described in Section IV.A) to determine the order in which different subband bit planesare compressed. Figure 3 illustrates the subband indices assigned following three stages of decomposition.In general, indices are assigned by sorting the subbands according to a subband-ordering function, whichwe now describe.
The subband ordering function is defined by the following rules:
(1) A subband with a larger value of L − H has a higher index. This has the effect of givinghigher indices to subbands with higher priority bit planes. (Recall that we denote thenumber of stages of high-pass and low-pass filtering used to form a subband by H and L,respectively.)
(2) For two subbands with the same value of L − H, if one of them has fewer coefficients,then it is given a higher index. (Equivalently, subbands formed through a larger numberof wavelet-filtering operations, i.e., larger value of L + H, are given a higher index.)
(3) If the two subbands are equivalent in the preceding considerations, then a higher index isgiven to a subband that is low-pass in the vertical direction.
(4) If the two subbands are equivalent in the preceding considerations, then a higher index isgiven to a subband that is low-pass in the horizontal direction.
This indexing scheme is somewhat ad hoc, and we have not made much effort to analyze whetheranother ordering would provide better rate-disortion performance. To first order, bit planes that areassigned the same priority value according to Eq. (2) have approximately the same relative effect, percoefficient of the subband, on MSE distortion in the reconstructed image. Thus, changing the subbandindexing scheme isn’t likely to have a large impact on rate-distortion performance.
21