ichigo group holdings co ltd (2337) ichigo group … up 2016 mid-term plan ‒5x eps in 3 years...
TRANSCRIPT
February 2015 H1 (March 2014 – August 2014) Corporate Presentation
April 23, 2014
Ichigo Group Holdings Co Ltd (2337)
October 14, 2014
Ichigo Group Holdings Co., Ltd. (2337)
© 2014 Ichigo Group Holdings Co., Ltd. All rights reserved. www.ichigo-holdings.co.jp/english

© 2014 Ichigo Group Holdings Co., Ltd. All rights reserved.
© 2014 Ichigo Group Holdings Co., Ltd. All rights reserved.
Creating peace of mind through honest and committed managementand committed management.
© 2014 Ichigo Group Holdings Co., Ltd. All rights reserved.
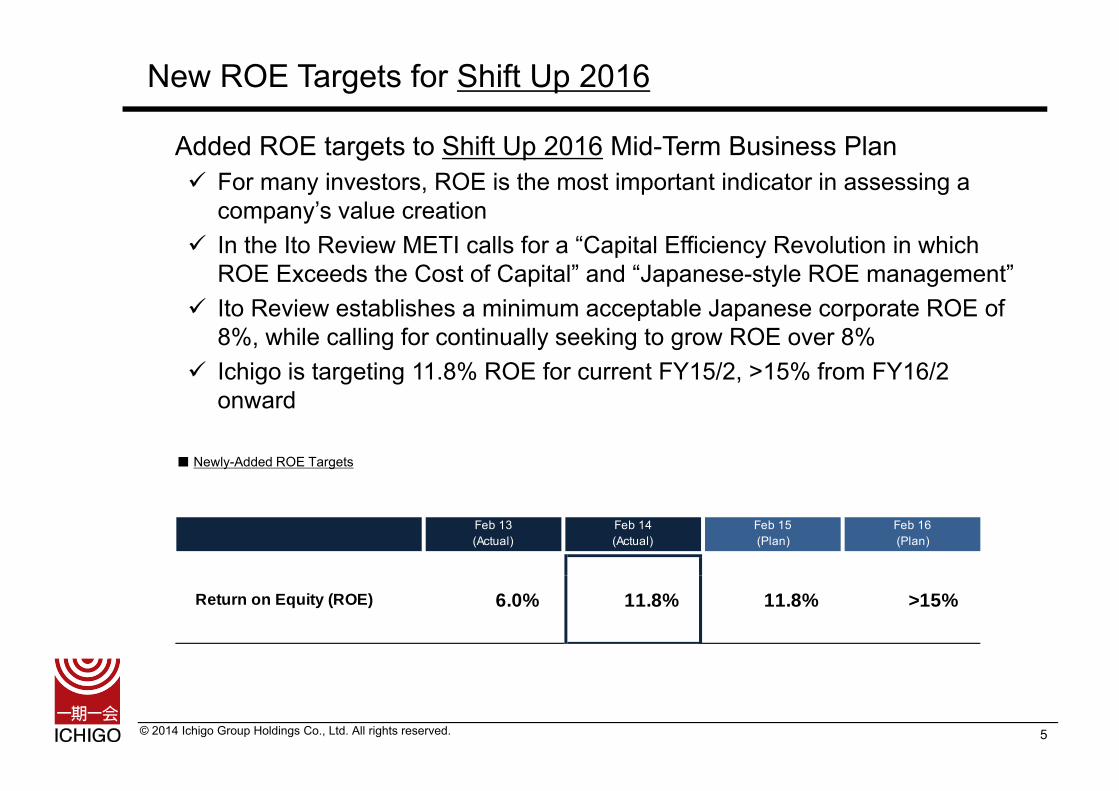
New ROE Targets for Shift Up 2016
Added ROE targets to Shift Up 2016 Mid-Term Business Plan For many investors, ROE is the most important indicator in assessing a
company’s value creationcompany s value creation In the Ito Review METI calls for a “Capital Efficiency Revolution in which
ROE Exceeds the Cost of Capital” and “Japanese-style ROE management” Ito Review establishes a minimum acceptable Japanese corporate ROE of Ito Review establishes a minimum acceptable Japanese corporate ROE of
8%, while calling for continually seeking to grow ROE over 8% Ichigo is targeting 11.8% ROE for current FY15/2, >15% from FY16/2
on ardonward
■ Newly-Added ROE Targets
Feb 13(Actual)
Feb 14(Actual)
Feb 15(Plan)
Feb 16(Plan)
Return on Equity (ROE) 6.0% 11.8% 11.8% >15%
© 2014 Ichigo Group Holdings Co., Ltd. All rights reserved. 5
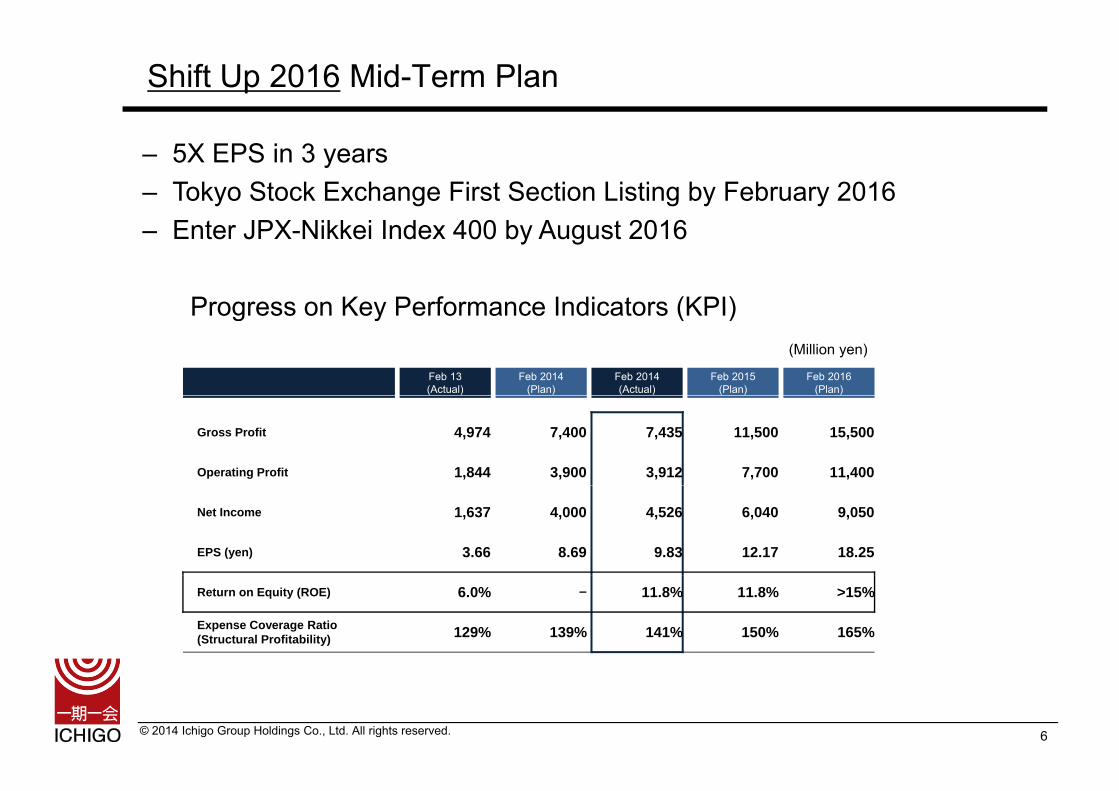
Shift Up 2016 Mid-Term Plan
‒ 5X EPS in 3 years‒ Tokyo Stock Exchange First Section Listing by February 2016‒ Enter JPX-Nikkei Index 400 by August 2016
Progress on Key Performance Indicators (KPI)Progress on Key Performance Indicators (KPI)(Million yen)
Feb 13(Actual)
Feb 2014(Plan)
Feb 2014(Actual)
Feb 2015(Plan)
Feb 2016(Plan)
Gross Profit 4,974 7,400 7,435 11,500 15,500
Operating Profit 1,844 3,900 3,912 7,700 11,400
Net Income 1,637 4,000 4,526 6,040 9,050
EPS (yen) 3.66 8.69 9.83 12.17 18.25
Return on Equity (ROE) 6.0% - 11.8% 11.8% >15%
Expense Coverage Ratio(Structural Profitability) 129% 139% 141% 150% 165%
© 2014 Ichigo Group Holdings Co., Ltd. All rights reserved. 6

Shift Up 2016 Mid-Term Business Plan‒ New ROE Targets
Commitment: 100% Shift Up 2016 Achievement‒ H1 Operating Profit 1.4X, Recurring Profit 1.3X Year-on-Year‒ Highly-Productive Asset Sales‒ Segment P&L Breakdown
Full-Service Real Estate‒ Segment Asset BreakdownSegment Asset Breakdown‒ Asset Acquisition Detail – Fukuoka Retail ‒ Value-Add Detail – Kyoto Hotel
Clean EnergyClean Energy‒ Solar Expansion on Track‒ Two New Solar Plants Operating from October‒ Near-Term Solar Earningsg‒ Long-Term Solar Earnings
Appendices: Financial & Real Estate DataAbout Ichigo Group
© 2014 Ichigo Group Holdings Co., Ltd. All rights reserved.
About Ichigo Group
7
Commitment: 100% Shift Up 2016 Achievement
© 2014 Ichigo Group Holdings Co., Ltd. All rights reserved. 8

H1 Operating Profit 1.4X, Recurring Profit 1.3X Year-on-Year
‒ 32% operating margin driven by highly-productive asset sales‒ Asset acquisitions driving higher on-going stable rental income‒ Decline in net profit due to non-repetition of FY14/2 H1’s large
extraordinary gains (JPY 673M) (Million yen)Feb 14 H1 Feb 15 H1 YOY Full -Year vs Full -Year Feb 14
Actual Actual YOY Forecast Forecast Actual
Revenues 20,586 9,879 -52.0% 42,000 23.5% 35,101
Gross Profit 3,940 5,110 +29.7% 11,742 43.5% 7,435
Operating Profit 2,243 3,124 +39.3% 7,700 40.6% 3,912
Recurring Profit 2,157 2,715 +25.9% 6,500 41.8% 3,597
Net Income 2,755 2,491 -9.6% 6,055 41.1% 4,526
EPS ( en) 6 14 5 01 18 4% 12 17 41 2% 9 83EPS (yen) 6.14 5.01 -18.4% 12.17 41.2% 9.83
Fixed Revenues 2,271 3,423 +50.7% - - 4,917
Fixed Expenses(Fixed SG&A + Interest Expense)
1,686 2,159 +28.1% - - 3,499Expense)
SG&A 1,550 1,736 +12.0% - - -
Interest Expense 136 423 +211.0% - - -
© 2014 Ichigo Group Holdings Co., Ltd. All rights reserved. 9
Expense Coverage Ratio(Structural Profitability) 134.7% 158.5% +17.7% 150% - 140.5%

Highly-Productive Asset Sales
(Million yen)
Revenues
Cost of goodssold
13,647 Revenues
14,867
Cost of goods31.9%
increaseGross profit Gross profit
1 609
Revenues3,544
Cost of goodssold
1,935
© 2014 Ichigo Group Holdings Co., Ltd. All rights reserved. 10
Feb 2014 H1
p1,220 1,609
Feb 2015 H1

Segment P&L Breakdown
‒ Growth Investments Driving Operating Profit in Real Estate and Value-Add‒ Newly Operational Solar Plants in Clean Energy
(Million yen)(Million yen)
Feb 14 H1Cumulative
Feb 15 H1Cumulative
Change (YoY)Feb 15
Full-Year(Forecast)
vs. Full-YearForecast
Feb 14 H1Cumulative
Feb 15 H1Cumulative
Change (YoY)Feb 15
Full-Year(Forecast)
vs. Full-YearForecast
・AM FeeREIT 382 ( 28) P i t 66 ( 82)
Segment
Revenues Operating ProfitEarnings Drivers
(YoY JPY change is shown inparentheses)
Asset Management 2,129 2,042 -4.1% 3,634 56.2% 584 208 -64.3% 536 38.8% REIT: 382 (+28), Private: 66 (-82)・Upfront/Disposition Fee: 196 (+23)・One-Off Income: 61 (-242)
Real Estate 2,559 2,435 -4.8% 15,591 15.6% 683 1,377 +101.7% 3,000 45.9% ・Rental Income: 1,226 (+467)・Capital Gains: 504 (+300)
Value-Add 15,185 5,082 -66.5% 21,983 23.1% 1,187 1,881 +58.5% 4,905 38.3% ・Rental Income: 1,217 (+611)・Capital Gains: 1,104 (+88)
Clean Energy 43 294 +583.7% 793 37.1% -140 -43 - -157 - ・Solar Electricity Sales: 108 (+118)
Other 666 24 -96.4% 0 - 123 -23 - -43 - ・ Legacy Equity Investment Sales 0 (-149)
Total 20,586 9,879 -52.0% 42,000 23.5% 2,438 3,401 +39.5% 8,241 41.3% -, , % , % , , % , %Adjustment (including offsets ofcross-segment transactions) - - - - - -195 -277 - -541 - -
Total 20,586 9,879 -52.0% 42,000 23.5% 2,243 3,124 +39.3% 7,700 40.6% -
© 2014 Ichigo Group Holdings Co., Ltd. All rights reserved. 11
Full-Service Real Estate
© 2014 Ichigo Group Holdings Co., Ltd. All rights reserved. 12

Real Estate Segment Asset Breakdown
H1 acquired 7 assets, acquisition cost of JPY 12.3B, forecast NOI of JPY 700M
No. Asset Class Asset Type LocationBuilding
AgeAcquisition Price
AcquiredDate
Expected NOI/Year Depreciation IGH Investment Forecast EquityMultiple
1 Retail Fixed Asset Minato-ku, Tokyo 12 <JPY 1B 2004/08 JPY 29M JPY 5M JPY 12M -
2 Other Fixed Asset Matsudo City, Chiba 42 JPY 2B-3B 2005/06 JPY 265M JPY 39M JPY 1,900M -
3 Retail Fixed Asset Minato-ku, Tokyo 45 JPY 2B-3B 2005/10 JPY 141M JPY 6M JPY 1,033M -
4 Retail Fixed Asset Yokohama City, Kanagawa 9 JPY 1B-2B 2006/09 JPY 50M JPY 7M JPY 1,157M -
5 Hotel Fixed Asset Kobe City Hyogo 6 <JPY 1B 2006/09 JPY 94M JPY 24M JPY 811M -5 Hotel Fixed Asset Kobe City, Hyogo 6 <JPY 1B 2006/09 JPY 94M JPY 24M JPY 811M
6 Office Real Estate for Sale Fukuoka City, Fukuoka 6 >JPY 3B 2006/12 JPY 381M - JPY 1,339M -
7 Retail Fixed Asset Toshima-ku, Tokyo 3 >JPY 3B 2013/03 JPY 234M JPY 31M JPY 340M -
8 Retail Fixed Asset Shibuya-ku, Tokyo 28 <JPY 1B 2013/05 JPY 51M JPY 6M JPY 154M -
9 Retail Real Estate for Sale Chofu City, Tokyo 29 JPY 1B-2B 2013/06 JPY 134M - JPY 310M -
10 Retail Fixed Asset Kobe City, Hyogo 14 JPY 1B-2B 2013/09 JPY 147M JPY 39M JPY 616M -
11 Retail Fixed Asset Tokorozawa City, Saitama 6 JPY 1B-2B 2013/11 JPY 69M JPY 11M JPY 92M -
12 Office Real Estate for Sale Saitama City, Saitama 27 >JPY 3B 2013/11 JPY 215M - JPY 1,285M -
13 Office Real Estate for Sale Sendai City, Miyagi 5 JPY 1B-2B 2013/12 JPY 127M - JPY 352M -
14 Hotel Real Estate for Sale Hamamatsu City, Shizuoka 4 JPY 1B-2B 2013/12 JPY 98M - JPY 393M -
15 Ground Lease Real Estate for Sale Chiba City, Chiba 2 JPY 2B-3B 2014/02 JPY 126M - JPY 342M -
16 Office Real Estate for Sale Shinagawa-ku, Tokyo 22 >JPY 3B 2014/03 JPY 187M - JPY 710M 1.18 x
17 Office Real Estate for Sale Koriyama City, Fukushima 13 JPY 1B-2B 2014/03 JPY 104M - JPY 282M 1.92 x
18 Office Real Estate for Sale Shinjuku-ku, Tokyo 20 JPY 1B-2B 2014/03 JPY 80M - JPY 445M 1.13 x
19 Retail Fixed Asset Fukuoka City Fukuoka 8 JPY 1B 2B 2014/04 JPY 58M JPY 5M JPY 273M19 Retail Fixed Asset Fukuoka City, Fukuoka 8 JPY 1B-2B 2014/04 JPY 58M JPY 5M JPY 273M -
20 Retail Real Estate for Sale Yokohama City, Kanagawa 12 JPY 1B-2B 2014/05 JPY 98M - JPY 480M 1.78 x
21 Retail Fixed Asset Fukuoka City, Fukuoka 10 <JPY 1B 2014/07 JPY 50M JPY 3M JPY 213M -
22 Retail Real Estate for Sale Kawaguchi City, Saitama 16 JPY 2B-3B 2014/07 JPY 134M - JPY 560M 1.20 x
Total 22 Assets JPY 45,716M JPY 2,872M JPY 177M JPY 13,099M -
© 2014 Ichigo Group Holdings Co., Ltd. All rights reserved. 13
Assets acquired in FY15/2 7 Assets JPY 12,345M JPY 711M JPY 9M JPY 2,963M 1.38 x
* Forecast Equity Multiple is based on the business plan of each asset and is the expected sum of rental income and capital gain divided by IGH Investment. The total Forecast Equity Multiple for FY15/2 reflects only Real Estate for Sale assets and excludes the two Fixed Investments.

Value-Add Segment Asset Breakdown (1)
H1 acquired 14 assets, acquisition cost of JPY 22.9B, forecast NOI of JPY 1.5B
* No. Asset Class Asset Type LocationBuilding
Age Acquisition PriceAcquired
Date Expected NOI/Year Depreciation IGH Investment Forecast EquityMultiple
1 Retail Real Estate for Sale Minato-ku, Tokyo 29 >JPY 3B 2006/03 JPY 169M - JPY 1,356M -
2 Office Real Estate for Sale Sendai City, Miyagi 6 >JPY 3B 2006/10 JPY 254M - JPY 1,042M -
3 Other Fixed Asset Isumi City, Chiba - JPY 1B-2B 2007/02 JPY 0M - JPY 1,055M -
4 Retail Real Estate for Sale Fukuoka City, Fukuoka 5 >JPY 3B 2007/03 JPY 207M - JPY 792M -
5 R id R l E t t f S l Oht k T k 9 JPY 1B 2B 2007/04 JPY 59M JPY 403M5 Residence Real Estate for Sale Ohta-ku, Tokyo 9 JPY 1B-2B 2007/04 JPY 59M - JPY 403M -
6 Retail Real Estate for Sale Chiyoda-ku, Tokyo 34 <JPY 1B 2007/06 JPY 86M - JPY 240M -
7 Retail Real Estate for Sale Chiyoda-ku, Tokyo 33 <JPY 1B 2007/06 JPY 121M - JPY 233M -
8 Retail Real Estate for Sale Chiyoda-ku, Tokyo 50 JPY 2B-3B 2007/06 JPY 262M - JPY 554M -
9 Office Fixed Asset Minato-ku, Tokyo 41 >JPY 3B 2007/11 JPY 339M JPY 55M JPY 2,049M -
10 Ground Lease Real Estate for Sale Atsugi City, Kanagawa - JPY 1B-2B 2011/06 JPY 175M - JPY 147M -
11 Retail Real Estate for Sale Minato-ku, Tokyo 28 <JPY 1B 2011/11 JPY 26M - JPY 66M -
12 Office/Retail Real Estate for Sale Hiratsuka City, Kanagawa 18 <JPY 1B 2012/02 JPY 76M - JPY 172M -
13 Retail Real Estate for Sale Yokohama City, Kanagawa 0 <JPY 1B 2012/10 JPY 33M - JPY 171M -
14 R id R l E t t f S l Kit k T k 25 JPY 1B 2013/06 JPY 2M JPY 31M14 Residence Real Estate for Sale Kita-ku, Tokyo 25 <JPY 1B 2013/06 JPY 2M - JPY 31M -
15 Other Real Estate for Sale Minato-ku, Tokyo - <JPY 1B 2013/06 JPY 44M - JPY 203M -
16 Residence Real Estate for Sale Osaka City, Osaka 11 <JPY 1B 2013/07 JPY 31M - JPY 81M -
17 Residence Real Estate for Sale Kobe City, Hyogo 16 <JPY 1B 2013/07 JPY 51M - JPY 134M -
18 Office Real Estate for Sale Chiyoda-ku, Tokyo 23 JPY 1B-2B 2013/08 JPY 87M - JPY 520M -
19 Residence Real Estate for Sale Osaka City, Osaka 7 <JPY 1B 2013/08 JPY 49M - JPY 81M -
20 Residence Real Estate for Sale Osaka City, Osaka 9 <JPY 1B 2013/08 JPY 41M - JPY 90M -
21 Office Real Estate for Sale Minato-ku, Tokyo 2 JPY 1B-2B 2013/09 JPY 84M - JPY 237M
22 Office/Retail Real Estate for Sale Shibuya-ku, Tokyo 4 >JPY 3B 2013/11 JPY 249M - JPY 750M
© 2014 Ichigo Group Holdings Co., Ltd. All rights reserved. 14
23 Hotel Real Estate for Sale Kyoto City, Kyoto 5 JPY 1B-2B 2014/02 JPY 120M - JPY 690M

Value-Add Segment Asset Breakdown (2)
No. Asset Class Asset Type LocationBuilding
Age Acquisition PriceAcquired
Date Expected NOI/Year Depreciation IGH InvestmentForecast Equity
Multipleyp Age q Date p p Multiple
24 Ground Lease Real Estate for Sale Fujisawa City, Kanagawa - JPY 1B-2B 2014/03 JPY 113M - JPY 273M 7.52 x
25 Office/Retail Real Estate for Sale Shibuya-ku, Tokyo 30 <JPY 1B 2014/03 JPY 51M - JPY 108M 6.95 x
26 Office Real Estate for Sale Shibuya-ku, Tokyo 3 JPY 1B-2B 2014/04 JPY 56M - JPY 1,090M 1.25 x
27 Office Real Estate for Sale Shinagawa ku Tokyo 25 JPY 2B 3B 2014/05 JPY 151M JPY 530M 2 04 x27 Office Real Estate for Sale Shinagawa-ku, Tokyo 25 JPY 2B-3B 2014/05 JPY 151M - JPY 530M 2.04 x
28 Office Real Estate for Sale Shinagawa-ku, Tokyo 21 JPY 1B-2B 2014/05 JPY 127M - JPY 515M 2.27 x
29 Office/Retail Real Estate for Sale Minato-ku, Tokyo 5 JPY 2B-3B 2014/05 JPY 137M - JPY 425M 3.08 x
30 Residence Real Estate for Sale Kumamoto City, Kumamoto 7 >JPY 3B 2014/06 JPY 204M - JPY 476M 3.52 x
31 Office Real Estate for Sale Minato-ku, Tokyo 25 <JPY 1B 2014/06 JPY 49M - JPY 251M 1.36 x31 Office Real Estate for Sale Minato ku, Tokyo 25 JPY 1B 2014/06 JPY 49M JPY 251M 1.36 x
32 Office Real Estate for Sale Shinjuku-ku, Tokyo 27 JPY 1B-2B 2014/06 JPY 68M - JPY 356M 1.35 x
33 Office Real Estate for Sale Chiyoda-ku, Tokyo 20 <JPY 1B 2014/06 JPY 42M - JPY 228M 1.21 x
34 Office Real Estate for Sale Chuo-ku, Tokyo 38 JPY 2B-3B 2014/06 JPY 138M - JPY 790M 1.10 x
35 Retail Real Estate for Sale Minato-ku, Tokyo 42 <JPY 1B 2014/07 JPY 47M - JPY 76M 10.47 xy
36 Hotel Real Estate for Sale Fukuoka City, Fukuoka 20 JPY 1B-2B 2014/07 JPY 87M - JPY 151M 3.12 x
37 Retail Real Estate for Sale Shinjuku-ku, Tokyo 38 >JPY 3B 2014/07 JPY 209M - JPY 645M 3.32 x
Total 37 Assets JPY 62,700M JPY 4,042M JPY 55M JPY 17,011M -
Assets acquired in FY15/2 14 Assets JPY 22,915M JPY 1,478M - JPY 5,914M 2.50 x
© 2014 Ichigo Group Holdings Co., Ltd. All rights reserved. 15

Asset Acquisitions Ahead of Plan
‒ H1 focus on new asset acquisitions to drive growth‒ JPY42.2B real estate acquisitions completed
Another JPY 8 2B in advanced highly likely pipeline Another JPY 8.2B in advanced highly likely pipelineOf the JPY 80B target growth investment in FY15/2, JPY 70B = real estate,
so 72% of full-year acquisition target either already complete or in highly likely pipelinelikely pipeline
仮
© 2014 Ichigo Group Holdings Co., Ltd. All rights reserved. 16
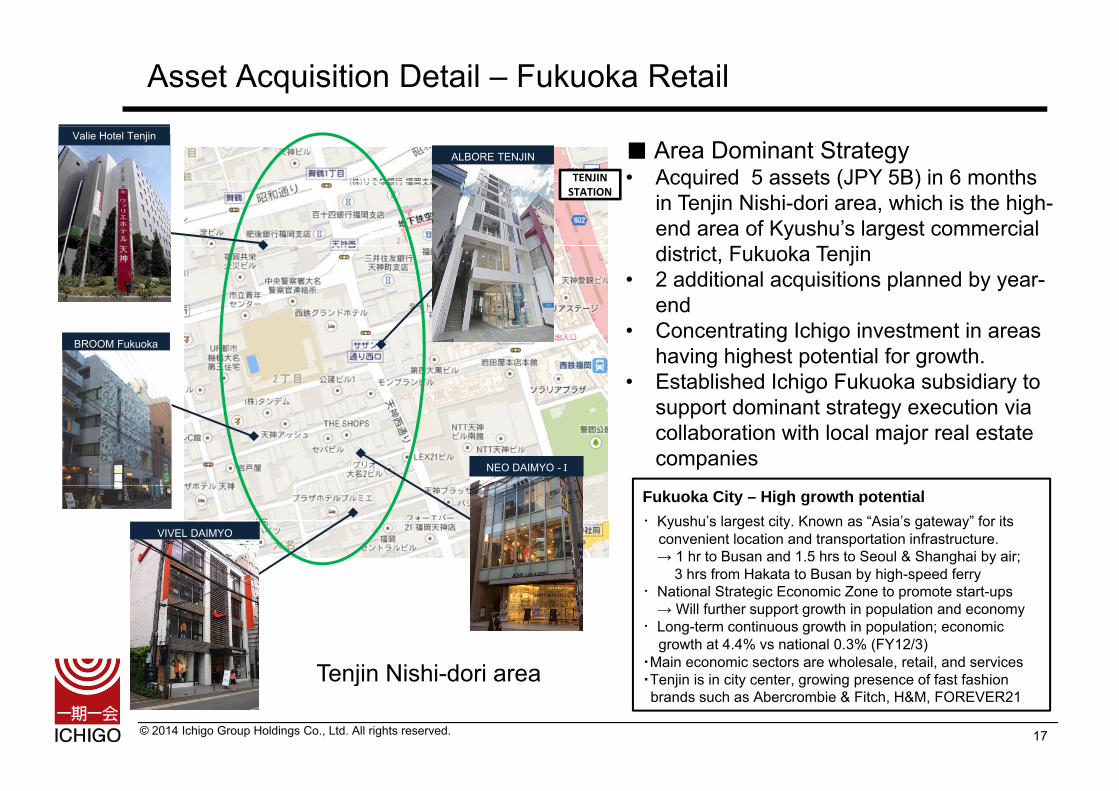
Asset Acquisition Detail – Fukuoka Retail
■ Area Dominant Strategy• Acquired 5 assets (JPY 5B) in 6 months
in Tenjin Nishi-dori area, which is the high-
ALBORE TENJIN
TENJIN STATION
Valie Hotel Tenjin
end area of Kyushu’s largest commercial district, Fukuoka Tenjin
• 2 additional acquisitions planned by year-endend
• Concentrating Ichigo investment in areas having highest potential for growth.
• Established Ichigo Fukuoka subsidiary to
BROOM Fukuoka
support dominant strategy execution via collaboration with local major real estate companiesNEO DAIMYO - I
Fukuoka City – High growth potential・Kyushu’s largest city. Known as “Asia’s gateway” for its
convenient location and transportation infrastructure.→ 1 hr to Busan and 1.5 hrs to Seoul & Shanghai by air;
3 hrs from Hakata to Busan by high-speed ferry
VIVEL DAIMYO
T ji Ni hi d i
3 hrs from Hakata to Busan by high-speed ferry・National Strategic Economic Zone to promote start-ups→ Will further support growth in population and economy
・Long-term continuous growth in population; economic growth at 4.4% vs national 0.3% (FY12/3)
・Main economic sectors are wholesale retail and services
© 2014 Ichigo Group Holdings Co., Ltd. All rights reserved. 17
Tenjin Nishi-dori area Main economic sectors are wholesale, retail, and services・Tenjin is in city center, growing presence of fast fashion brands such as Abercrombie & Fitch, H&M, FOREVER21

Value-Add Detail – Kyoto Hotel
• Acquired hotel in great location on Kyoto Shijo-dori, conveniently accessible to major tourist spots
• Rebranded and renovated all rooms and exterior and changed operator
• No downtime during renovation, completed in June 100% occupancy for 3 consecutiveJune, 100% occupancy for 3 consecutive months
• Improved hard and soft services and increased occupancy and average daily rate (ADR)
3-Year Operating Forecast
Occupancy: +5%ADR: +26.3%NOI: >2X
Address Shijo, Shimogyo-ku Kyoto CityZoning RetailL d A 200 51 T b (662 83㎡)
Property Summary
NOI 3.3% at acquisition → NOI 6.7%(+3.4%)
Land Area 200.51 Tsubo (662.83㎡)Building Area 1,479.78 Tsubo (4,891.84㎡) (Total floor area)Structure RC/SRC B1F/10FUse Hotel (138 rooms)Year Built February 1991Property right Ownership
© 2014 Ichigo Group Holdings Co., Ltd. All rights reserved. 18
Property right OwnershipAccess 5 min. walk from either Shijo Station or Karasumaru Station
Clean Energy
© 2014 Ichigo Group Holdings Co., Ltd. All rights reserved. 19
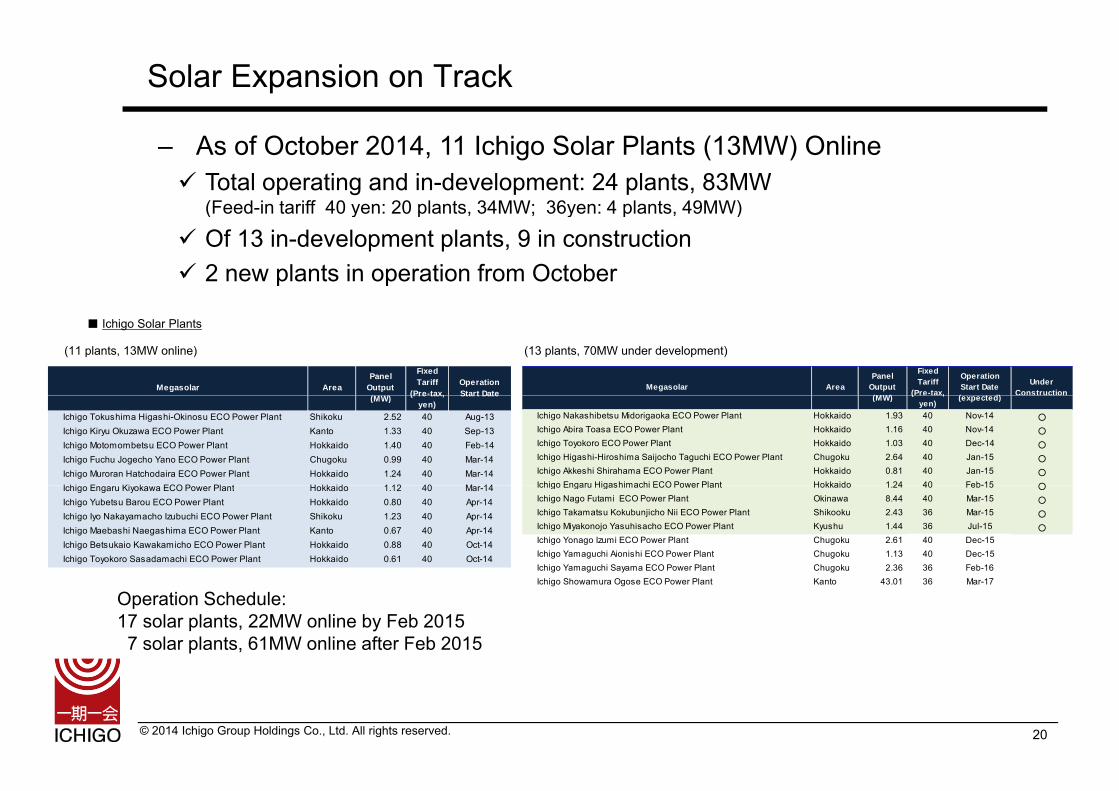
Solar Expansion on Track
‒ As of October 2014, 11 Ichigo Solar Plants (13MW) Online Total operating and in-development: 24 plants, 83MW
(Feed-in tariff 40 yen: 20 plants, 34MW; 36yen: 4 plants, 49MW)( y p , ; y p , )
Of 13 in-development plants, 9 in construction 2 new plants in operation from October
■ Ichigo Solar Plants
(11 plants, 13MW online) (13 plants, 70MW under development)
Megasolar AreaPanel
Output(MW)
FixedTariff
(Pre-tax,
OperationStart Date( t d)
UnderConstructionMegasolar Area
PanelOutput(MW)
FixedTariff
(Pre-tax,OperationStart Date (MW) ( ,
yen)(expected)
Ichigo Nakashibetsu Midorigaoka ECO Power Plant Hokkaido 1.93 40 Nov-14 ○
Ichigo Abira Toasa ECO Power Plant Hokkaido 1.16 40 Nov-14 ○
Ichigo Toyokoro ECO Power Plant Hokkaido 1.03 40 Dec-14 ○
Ichigo Higashi-Hiroshima Saijocho Taguchi ECO Power Plant Chugoku 2.64 40 Jan-15 ○
Ichigo Akkeshi Shirahama ECO Power Plant Hokkaido 0.81 40 Jan-15 ○
Ichigo Engaru Higashimachi ECO Power Plant Hokkaido 1 24 40 Feb-15 ○
(MW) (Pre tax,yen)
Start Date
Ichigo Tokushima Higashi-Okinosu ECO Power Plant Shikoku 2.52 40 Aug-13Ichigo Kiryu Okuzawa ECO Power Plant Kanto 1.33 40 Sep-13Ichigo Motomombetsu ECO Power Plant Hokkaido 1.40 40 Feb-14Ichigo Fuchu Jogecho Yano ECO Power Plant Chugoku 0.99 40 Mar-14Ichigo Muroran Hatchodaira ECO Power Plant Hokkaido 1.24 40 Mar-14I hi E Ki k ECO P Pl t H kk id 1 12 40 M 14 Ichigo Engaru Higashimachi ECO Power Plant Hokkaido 1.24 40 Feb-15 ○
Ichigo Nago Futami ECO Power Plant Okinawa 8.44 40 Mar-15 ○
Ichigo Takamatsu Kokubunjicho Nii ECO Power Plant Shikooku 2.43 36 Mar-15 ○
Ichigo Miyakonojo Yasuhisacho ECO Power Plant Kyushu 1.44 36 Jul-15 ○
Ichigo Yonago Izumi ECO Power Plant Chugoku 2.61 40 Dec-15Ichigo Yamaguchi Aionishi ECO Power Plant Chugoku 1.13 40 Dec-15Ichigo Yamaguchi Sayama ECO Power Plant Chugoku 2.36 36 Feb-16
Ichigo Engaru Kiyokawa ECO Power Plant Hokkaido 1.12 40 Mar-14Ichigo Yubetsu Barou ECO Power Plant Hokkaido 0.80 40 Apr-14Ichigo Iyo Nakayamacho Izubuchi ECO Power Plant Shikoku 1.23 40 Apr-14Ichigo Maebashi Naegashima ECO Power Plant Kanto 0.67 40 Apr-14Ichigo Betsukaio Kawakamicho ECO Power Plant Hokkaido 0.88 40 Oct-14Ichigo Toyokoro Sasadamachi ECO Power Plant Hokkaido 0.61 40 Oct-14
Operation Schedule:17 solar plants, 22MW online by Feb 20157 solar plants, 61MW online after Feb 2015
Ichigo Showamura Ogose ECO Power Plant Kanto 43.01 36 Mar-17
© 2014 Ichigo Group Holdings Co., Ltd. All rights reserved. 20

Two New Solar Plants Operating from October
■ Ichigo Betsukai Kawakamicho ECO Power Plant ■ Ichigo Toyokoro Sasadamachi ECO Power Plant
Betsukai Kawakamicho Betsukaicho Notsuke Gun Toyokoro Sasadamachi Toyokorocho NakagawaAddress Betsukai Kawakamicho, Betsukaicho, Notsuke Gun,Hokkaido
Operator Ichigo ECO Energy Co., Ltd.
EPC Nippon Densetsu Kogyo
Area 19,011m2
Address Toyokoro Sasadamachi, Toyokorocho, NakagawaGun, Hokkaido
Operator Ichigo ECO Energy
EPC Toko Electrical Construction
Area 15,781m2ea 19,011m
Number of Panels 3,456
Panel Output 0.88MW
Annual Energy Output 1,097,223MWh (provides power for 300 households)
Area 15,781m
Number of Panels 2,380
Panel Output 0.61MW
Annual Energy Output 760,880MWh (provides power for 200 households)
© 2014 Ichigo Group Holdings Co., Ltd. All rights reserved. 21
FIT (fixed for 20 years) 40 yen/kWh + Consumption Tax
Former Use Unused Land
FIT (fixed for 20 years) 40 yen/kWh + Consumption Tax
Former Use Out of Use, Former School Ground

Near-Term Solar Earnings
‒ Substantial revenue and gross profit growth‒ Operating profit on track to turn positive next year (FY16/2)
(Million yen)Feb 14(12M)
Feb 15 Q1(3M)
Feb 15 H1Cumulative (6M)
Feb 15 Full-YearForecast (12M)
vs. Full-YearForecast
Revenues 126 125 294 793 37 1%Revenues 126 125 294 793 37.1%
Cost of Goods Sold 123 85 185 596 -
Gross Profit 3 39 109 197 55.3%
SG&A 266 81 153 363 -
Adjustment (including offsets ofcross-segment transactions) 8 - - 8 -
Operating Profit -253 -41 -43 -157 -Operating Profit 253 41 43 157
Reference: Interest Expense 6 8 23 132 -
Forecast
Solar Power Plant Schedule
9 Plants Online11.30MW
9 Plants Online11.30MW
3 Plants Online5.25MW
Total operating and in-development: 24 plants, 83.02MW
17 Plants 21.60MW
Forecast
© 2014 Ichigo Group Holdings Co., Ltd. All rights reserved. 22
p g p p ,
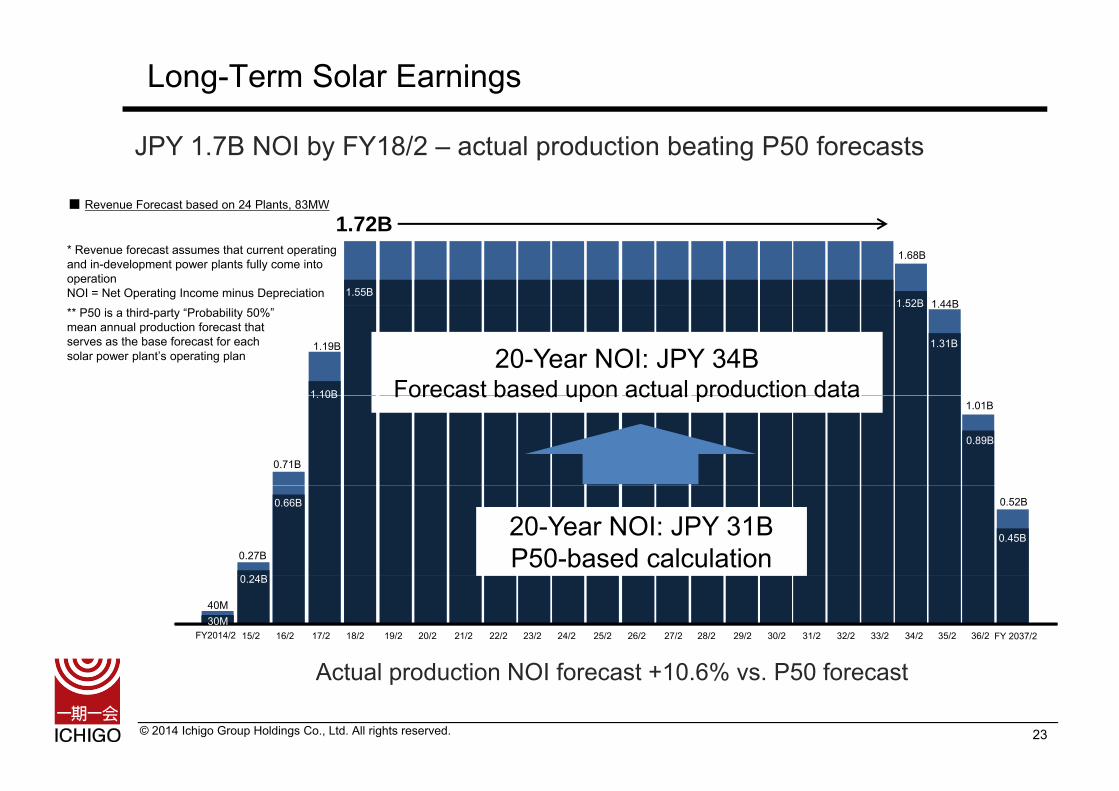
Long-Term Solar Earnings
JPY 1.7B NOI by FY18/2 – actual production beating P50 forecasts
■ Revenue Forecast based on 24 Plants, 83MW
1 2B* Revenue forecast assumes that current operating and in-development power plants fully come into operationNOI = Net Operating Income minus Depreciation 1.55B
1.52B
1.72B1.68B
1 44B** P50 is a third-party “Probability 50%” mean annual production forecast that serves as the base forecast for each solar power plant’s operating plan
1 10B
1.52B
1.31B
20-Year NOI: JPY 34BForecast based upon actual production data
1.19B
1.44B
1.10B
0.89B
Forecast based upon actual production data
0.71B
1.01B
0 24B
0.66B
0.45B20-Year NOI: JPY 31BP50-based calculation0.4 0.27B
0.52B
A t l d ti NOI f t 10 6% P50 f t
FY2014/2 15/2 16/2 17/2 18/2 19/2 20/2 21/2 22/2 23/2 24/2 25/2 26/2 27/2 28/2 29/2 30/2 31/2 32/2 33/2 34/2 35/2 36/2 FY 2037/2
40M
0.24B
30M
© 2014 Ichigo Group Holdings Co., Ltd. All rights reserved.
Actual production NOI forecast +10.6% vs. P50 forecast
23
Appendix: Financial & Real Estate Data
© 2014 Ichigo Group Holdings Co., Ltd. All rights reserved. 24

Note on More Detailed Consolidated and Asset Disclosure
As of FY14/2 full-year financials, we have increased our disclosure with respect to our statutory consolidated financials and assets, including risk-based disclosure of our balance sheet that separates out client and non-recourse assets and liabilities and discontinuing “Pro Forma” financial reporting. We take investor feedback p gseriously and that feedback has been that more detailed disclosure with respect to our consolidated P&L financials and assets is needed in lieu of Pro Forma numbersneeded in lieu of Pro Forma numbers.
© 2014 Ichigo Group Holdings Co., Ltd. All rights reserved. 25
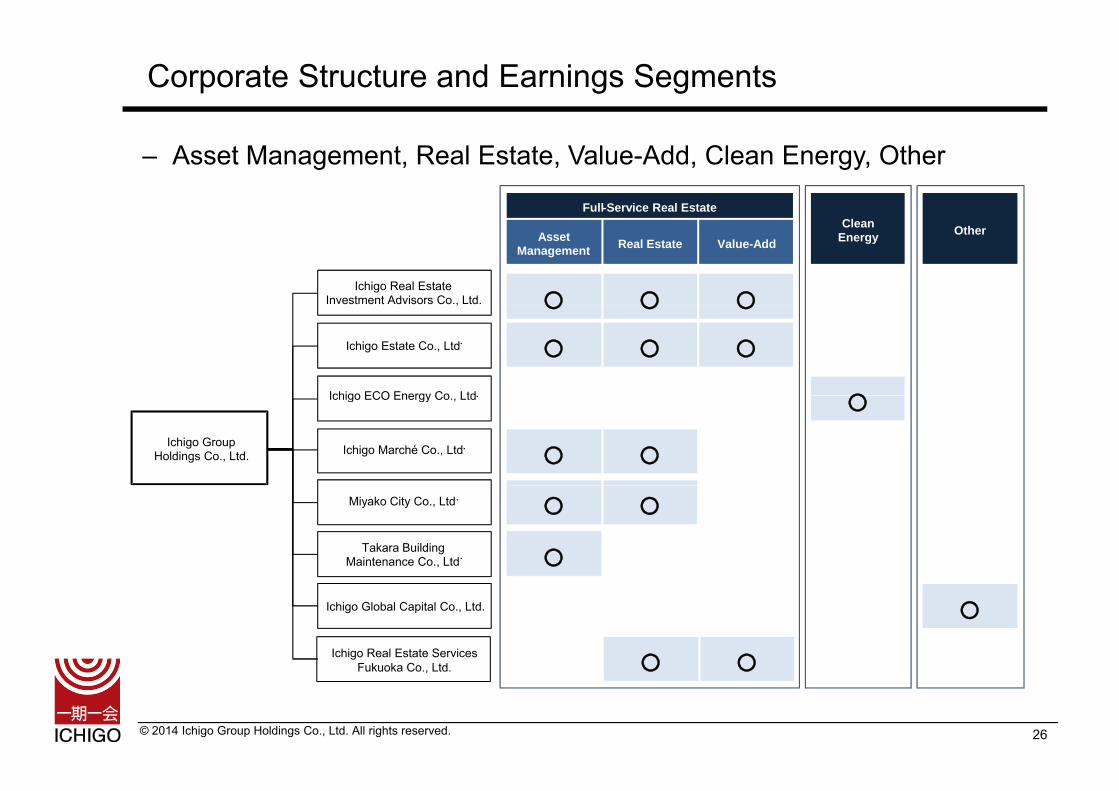
Corporate Structure and Earnings Segments
‒ Asset Management, Real Estate, Value-Add, Clean Energy, Other
Full-Service Real Estate
Ichigo Real Estate Investment Advisors Co., Ltd.
Clean EnergyReal Estate Value-AddAsset
ManagementOther
○ ○○
Ichigo Estate Co., Ltd.
Ichigo ECO Energy Co Ltd
○ ○○
○
○ ○○
Ichigo ECO Energy Co., Ltd.
Ichigo Marché Co., Ltd.Ichigo Group Holdings Co., Ltd.
○
○○
Miyako City Co., Ltd.
Takara Building Maintenance Co., Ltd.
○○
○
Ichigo Global Capital Co., Ltd. ○
Ichigo Real Estate Services F k k C Ltd ○○
© 2014 Ichigo Group Holdings Co., Ltd. All rights reserved. 26
Fukuoka Co., Ltd. ○○
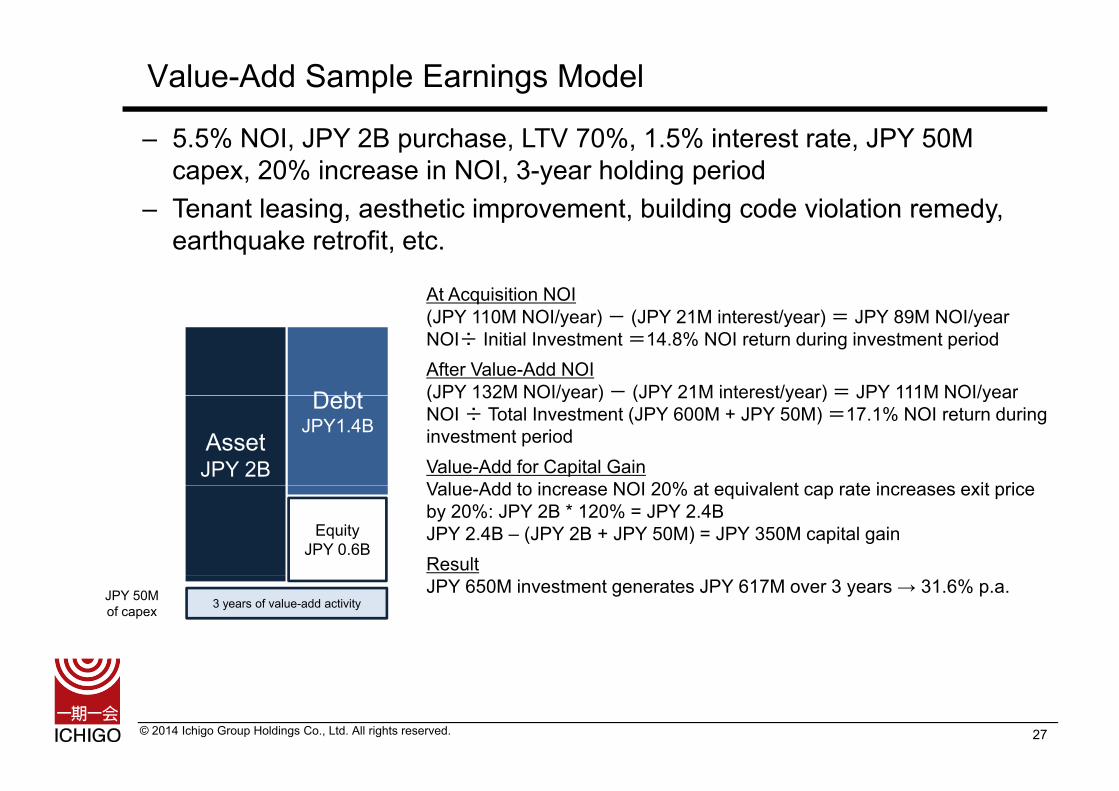
Value-Add Sample Earnings Model
‒ 5.5% NOI, JPY 2B purchase, LTV 70%, 1.5% interest rate, JPY 50M capex, 20% increase in NOI, 3-year holding period
‒ Tenant leasing, aesthetic improvement, building code violation remedy,Tenant leasing, aesthetic improvement, building code violation remedy, earthquake retrofit, etc.
At Acquisition NOI
D bt
(JPY 110M NOI/year) - (JPY 21M interest/year) = JPY 89M NOI/yearNOI÷ Initial Investment =14.8% NOI return during investment period.
After Value-Add NOI(JPY 132M NOI/year) - (JPY 21M interest/year) = JPY 111M NOI/year
AssetJPY 2B
DebtJPY1.4B
(JPY 132M NOI/year) (JPY 21M interest/year) JPY 111M NOI/yearNOI ÷ Total Investment (JPY 600M + JPY 50M) =17.1% NOI return during investment period.
Value-Add for Capital GainV l Add t i NOI 20% t i l t t i it i
Equity JPY 0.6B
Value-Add to increase NOI 20% at equivalent cap rate increases exit price by 20%: JPY 2B * 120% = JPY 2.4BJPY 2.4B – (JPY 2B + JPY 50M) = JPY 350M capital gain.
ResultJPY 650M investment generates JPY 617M over 3 years → 31.6% p.a.
3 years of value-add activityJPY 50M of capex
© 2014 Ichigo Group Holdings Co., Ltd. All rights reserved. 27

Consolidated Balance Sheet
(Million yen)
B/SOutside
Investors'Unrealized
GainFeb 14 Feb 15 Q1
Feb 15 H1Quarter-on-
Quarter Market Value
Interests
Cash and Cash Equivalents 24,991 20,493 20,264 673 -229 20,264 0Operating Loans Receivable 1,100 2,100 2,100 - 0 2,100 0
Real Estate 1,100 1,100 1,100 - 0 1,100 0
Value-Add 0 1 000 1 000 - 0 1 000 0Value Add 0 1,000 1,000 0 1,000 0
Operational Investments in Securities 3,583 2,247 1,657 - -590 1,993 335Real Estate 369 0 0 - 0 74 74
Value-Add 2,125 999 392 - -607 651 259
Other 1,090 1,248 1,265 - +17 1,267 1
Real Estate For Sale 54,084 70,168 86,288 - +16,120 99,915 13,626Real Estate 17,187 25,226 27,624 - +2,398 29,640 2,015
Value-Add 36,897 44,943 58,663 3,360 +13,720 70,275 11,611
Fixed Assets 21,300 30,614 32,892 - +2,278 35,600 2,707Asset Management 48 49 47 - -2 48 1Asset Management 48 49 47 2 48 1
Real Estate 16,876 17,950 18,905 - +955 21,197 2,292
Value-Add 371 7,027 7,028 - +1 7,441 413
Clean Energy 3,939 5,526 6,852 - +1,326 6,852 0
Unallocated* 66 63 59 - -4 59 0
Intangible Assets 2,686 2,669 2,632 - -37 2,632 0Investments in Securities 4,278 4,409 4,578 - +169 4,593 14
Other 4,278 4,409 4,578 - +169 4,593 14
Other Assets 2,922 3,707 3,617 21 -90 3,617 0Total Assets 114 944 136 407 154 033 4 054 +17 626 170 717 16 683
© 2014 Ichigo Group Holdings Co., Ltd. All rights reserved. 28
* Company assets that are not allocated to above segments
Total Assets 114,944 136,407 154,033 4,054 +17,626 170,717 16,683

Consolidated Balance Sheet: Segment Breakdown
(Million yen)Cash and
CashEquivalents
OperatingLoans
Receivable
OperationalInvestments in
Securities
Real EstateFor Sale Fixed Assets Intangible
AssetsInvestmentsin Securities Other Assets Total AssetsSegment
Equivalents Receivable Securities
Asset Management 442 - - - 47 1,805 - 464 2,758
Real Estate 2,798 1,100 0 27,624 18,905 198 - 557 51,185
Value Add 5 035 1 000 392 58 663 7 028 747 72 866Value-Add 5,035 1,000 392 58,663 7,028 - - 747 72,866
Clean Energy 1,567 - - - 6,852 606 - 458 9,484
Other* 10,421 - 1,265 - 59 22 4,578 1,390 17,737
Total 20,264 2,100 1,657 86,288 32,892 2,632 4,578 3,617 154,033
© 2014 Ichigo Group Holdings Co., Ltd. All rights reserved. 29
* Includes company assets that are not allocated to above segments

Consolidated Risk-Based Balance Sheet
Risk-Based Shareholder Equity Ratio 43.6%Consolidated Balance Sheet Consolidated Risk-Based Balance Sheet
Total Assets
Shareholder Equity Ratio 32.9%
JPY 154.0B
Non-Recourse Loans& Related Liabilities
JPY 37.9BNon-Recourse Loan-
Related AssetsTotal AssetsJPY 116 0BJPY 49.4B
Cash & Cash Equivalents
JPY 16.0B DebtCorporate Loans
JPY 57 0B
Non-Recourse Loan-Related IGH Equity
JPY 11.5B
JPY 116.0B
Corporate Loans
JPY 57.0BCash & Cash Equivalents
JPY 16.0B
Operating Investments in Loans JPY 2.1B
Operational Investments in Securities JPY 1.6B
DebtJPY
65.4BDebtJPY
103.3B
JPY 57.0B
Guarantee Deposits Received JPY 3.6B
Guarantee Deposits Received JPY 3.6B
Operating Investments in Loans JPY 2.1B
Operational Investments in Securities JPY 1.6B
Shareholder
Real Estate For Sale
JPY 49.8 B
Fixed Assets
Other JPY 4.7B
Shareholder
Other JPY 4.7BReal Estate For Sale
JPY 49.8B
Fixed Assets
EquityJPY 50.6B
Fixed Assets
JPY 24.4BInvestments in Securities
JPY 4.5B
Other JPY 5.8B
EquityJPY 50.6B
JPY 24.4BInvestments in Securities
JPY 4.5B
Other JPY 5.8B
© 2014 Ichigo Group Holdings Co., Ltd. All rights reserved. 30

Corporate Loan Detail■ Weighted Average Interest Rate and Average Loan Period
11.0 3.0%(Interest Rate) (Loan Period, Year)
Weighted Average Interest Rate
2.57% 2.56%
2.22% 7.8 Year
9.0 2.5%
Average Loan Period
1.96% 1.81%5.9 Year
5.0
7.0
1.5%
2.0%
3.3 Year3.6 Year 4.7 Year
3.0 1.0%Feb FY11 Feb FY12 Feb FY13 Feb FY14 Feb 15 H1
■ Long/Short-Term Ratio
58%(JPY 6 2B)
42% (JPY 4.6B)Long-Term
Short-Term 79%(JPY 7.4B)
21% (JPY 1.9B)
79%(JPY 5.5B)
21% (JPY 1.5B)
86%(JPY 26.1B)
14% (JPY 4.1B)
92%(JPY 52.3B)
8% (JPY 4.7B) 100%
(JPY 6.2B)( ) ( )
■ Megabank Ratio
Megabank 74.5% 66.1% 74.7%49.1% 52.2%
100%
© 2014 Ichigo Group Holdings Co., Ltd. All rights reserved. 31
Non-Megabank
25.5% 33.9% 25.3%50.9% 47.8%

Asset Management AUM Detail
Have shrunk low-profitability private equity real estate funds to drive higher AM fee levels and profitability
Feb 11(12M)
Feb 12(12M)
Feb 13(12M)
Feb 14(12M)
Feb 15 H1Cumulative (6M)
Ichigo REIT AUM (Fiscal Year End) 114billion yen 106billion yen 104billion yen 121billion yen 114billion yen
AM Fee % (Average) 0.56% 0.61% 0.63% 0.65% 0.66%
AM Gross Profit (Actual) 54million yen 719million yen 663million yen 733million yen 381million yen
AUM (Fiscal Year End) 187billion yen 213billion yen 170billion yen 63billion yen 28billion yen
AM Fee % (Average) 0.15% 0.15% 0.15% 0.26% 0.34%
Private Equity RealEstate Funds
(excluding IGH consolidated)
AM Gross Profit (Actual) 290million yen 284million yen 285million yen 257million yen 66million yen
AUM (Fiscal Year End) 301billion yen 319billion yen 274billion yen 184billion yen 142billion yenTotal(excluding IGH consolidated)
AM Fee % (Average) 0.17% 0.33% 0.33% 0.47% 0.58%
AM Gross Profit (Actual) 344million yen 1,004million yen 948million yen 989million yen 448million yen
© 2014 Ichigo Group Holdings Co., Ltd. All rights reserved. 32

Consolidated P&L: Gross Profit Segment Breakdown
(Million yen)
Feb 14 H1Cumulative
Feb 15 H1Cumulative Change Feb 14 H1
CumulativeFeb 15 H1Cumulative Change
Revenues Gross Profit YoY(Gross Profit)
Asset Management 2,129 2,042 -87 1,217 930 -287 -23.6%
Asset Management Fees 760 712 -48 687 652 -35 -5.2%
PM / BM Fees 1,054 1,264 +209 226 216 -9 -4.4%
Oth 314 65 249 303 61 242 79 9%Other 314 65 -249 303 61 -242 -79.9%
Real Estate 2,559 2,435 -124 963 1,731 +768 +79.8%
Rental Income 1,297 1,930 +633 758 1,226 +467 +61.7%
Real Estate Sales 1,262 504 -757 204 504 +300 +147.1%Real Estate Sales 1,262 504 757 204 504 300 147.1%
Value-Add 15,185 5,082 -10,103 1,607 2,322 +714 +44.5%
Rental Income 1,580 2,042 +461 605 1,217 +611 +101.0%
Real Estate Sales 13,604 3,039 -10,565 1,015 1,104 +88 +8.7%
Other - - - -14 - +14 -
Clean Energy 43 294 +250 -7 109 +117 -
Other 666 24 -642 159 16 -143 -89.6%
Ad i F 21 25 4 21 25 4 22 8%Advisory Fees 21 25 +4 21 25 +4 +22.8%
Securities Sales 645 -1 -646 147 -1 -148 -
Other 0 0 0 -8 -7 0 -
Total 20,586 9,879 -10,706 3,940 5,110 +1,169 +29.7%
© 2014 Ichigo Group Holdings Co., Ltd. All rights reserved. 33
Note: Operating Profit Segment Breakdown on p. 11
Total 20,586 9,879 10,706 3,940 5,110 1,169 29.7%

Consolidated P&L: Segment H1 Actual vs Full-Year Forecast
(Million yen)
Revenues vs. Full-YearForecast
Gross Profit vs. Full-YearForecast
Operating Profit vs. Full-YearForecast
Revenues Gross Profit Operating ProfitSegment
Feb 15 H1 Cumulative (6M) Feb 15 Full-Year Forecast (12M)
Asset Management 2,042 56.2% 930 55.8% 208 39.0% 3,634 1,667 536Asset Management Fees 712 57.7% 652 55.1% - -% 1,234 1,185 -PM / BM Fees 1,264 52.8% 216 45.4% - -% 2,393 477 -Other 65 1093.7% 61 1018.0% - -% 6 6 -
R l E t t 2 435 15 6% 1 731 42 6% 1 377 45 9% 15 591 4 064 3 000Real Estate 2,435 15.6% 1,731 42.6% 1,377 45.9% 15,591 4,064 3,000Rental Income 1,930 36.4% 1,226 34.3% - -% 5,307 3,574 -Real Estate Sales 504 4.9% 504 103.0% - -% 10,284 490 -
Value-Add 5,082 23.1% 2,322 39.9% 1,881 38.4% 21,983 5,813 4,905Rental Income 2 042 52 8% 1 217 52 2% - -% 3 870 2 333 -Rental Income 2,042 52.8% 1,217 52.2% - -% 3,870 2,333 -Real Estate Sales 3,039 16.8% 1,104 31.7% - -% 18,113 3,480 -Other 0 -% 0 -% - -% - - -
Clean Energy 294 37.2% 109 55.7% -43 27.9% 793 197 -157Other 24 -% 16 -% -23 53.9% 0 0 -43
Advisory Fees 25 -% 25 -% - -% 0 0 -Securities Sales -1 -% -1 -% - -% 0 0 -Other 0 -% -7 -% - -% 0 0 -
Total 9,879 23.5% 5,110 43.5% 3,401 41.3% 42,000 11,742 8,241
- - - - -277 - - - -541
9,879 23.5% 5,110 43.5% 3,124 40.6% 42,000 11,742 7,700
Adjustment (including offsets ofcross-segment transactions)
Total
© 2014 Ichigo Group Holdings Co., Ltd. All rights reserved. 34

Consolidated Balance Sheet: Unrealized Gains
Real estate directly held by IGH (either on IGH balance sheet or in SPCs where IGH is sole equity holder)(Million yen)
Cap Rate Appraisal ValueBook Value Cap Rate Appraisal ValueNOI / Book Value af ter write-down as of August 2014
Tokyo 53,967 3,413 6.6% 63,335 +9,367
Outside Tokyo 49,855 3,457 7.1% 55,855 +6,000
Unrealized GainLocationBook Value
as of August 2014 NOI
(Note) Excludes two development assets (c. JPY 1,150M) which are not currently generating NOI
Total 103,823 6,840 6.9% 119,190 +15,367
Real estate held by IGH within IGH-managed funds (SPCs) where there are other non-IGH equity holders
Book Valueas of August 2014
Appraisal Valueas of August 2014
Unrealized Gain
Equity Investments(Non-Consolidated) 368 702 +333
E it I t tEquity Investments(Consolidated) 852 1,135 +283
Total 1,220 1,837 +617
© 2014 Ichigo Group Holdings Co., Ltd. All rights reserved. 35
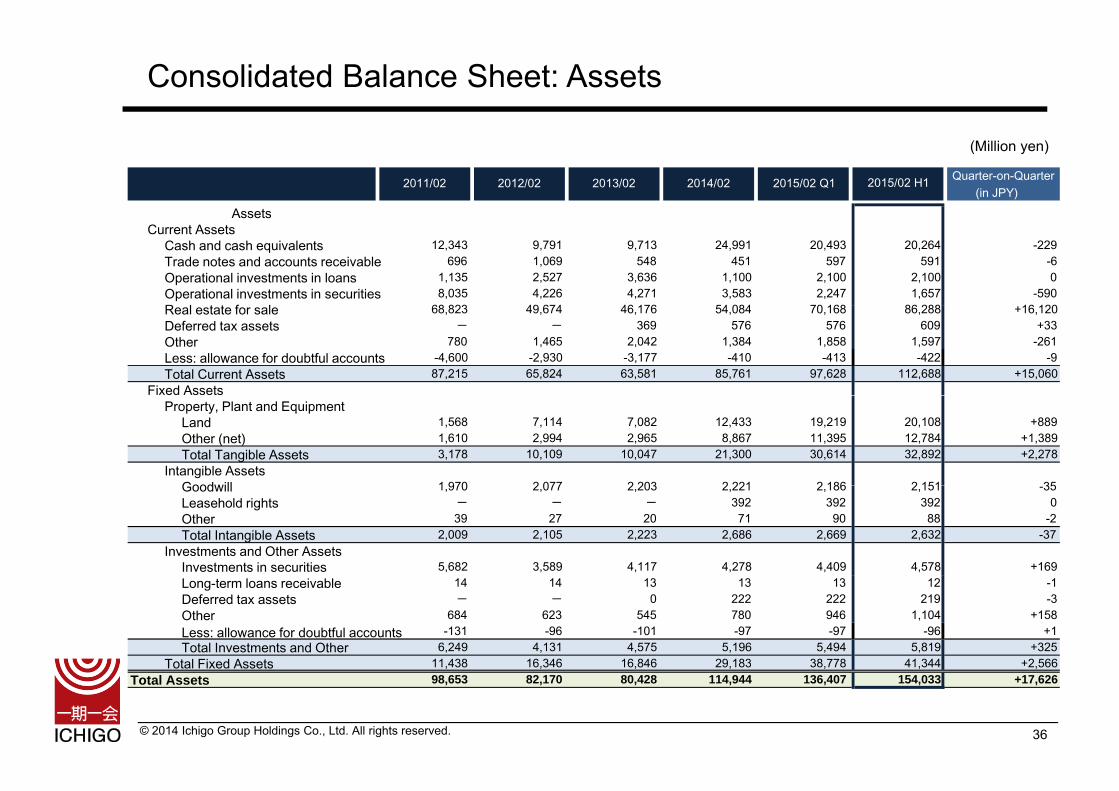
Consolidated Balance Sheet: Assets
2011/02 2012/02 2013/02 2014/02 2015/02 Q1 2015/02 H1 Quarter-on-Quarter(in JPY)
Assets
(Million yen)
AssetsCurrent Assets
Cash and cash equivalents 12,343 9,791 9,713 24,991 20,493 20,264 -229Trade notes and accounts receivable 696 1,069 548 451 597 591 -6Operational investments in loans 1,135 2,527 3,636 1,100 2,100 2,100 0Operational investments in securities 8,035 4,226 4,271 3,583 2,247 1,657 -590R l t t f l 68 823 49 674 46 176 54 084 70 168 86 288 16 120Real estate for sale 68,823 49,674 46,176 54,084 70,168 86,288 +16,120Deferred tax assets - - 369 576 576 609 +33Other 780 1,465 2,042 1,384 1,858 1,597 -261Less: allowance for doubtful accounts -4,600 -2,930 -3,177 -410 -413 -422 -9Total Current Assets 87,215 65,824 63,581 85,761 97,628 112,688 +15,060
Fixed AssetsProperty, Plant and Equipment
Land 1,568 7,114 7,082 12,433 19,219 20,108 +889Other (net) 1,610 2,994 2,965 8,867 11,395 12,784 +1,389Total Tangible Assets 3,178 10,109 10,047 21,300 30,614 32,892 +2,278
Intangible AssetsGoodwill 1 970 2 077 2 203 2 221 2 186 2 151 35Goodwill 1,970 2,077 2,203 2,221 2,186 2,151 -35Leasehold rights - - - 392 392 392 0Other 39 27 20 71 90 88 -2Total Intangible Assets 2,009 2,105 2,223 2,686 2,669 2,632 -37
Investments and Other AssetsInvestments in securities 5,682 3,589 4,117 4,278 4,409 4,578 +169Long-term loans receivable 14 14 13 13 13 12 -1Deferred tax assets - - 0 222 222 219 -3Other 684 623 545 780 946 1,104 +158Less: allowance for doubtful accounts -131 -96 -101 -97 -97 -96 +1Total Investments and Other 6,249 4,131 4,575 5,196 5,494 5,819 +325
Total Fixed Assets 11 438 16 346 16 846 29 183 38 778 41 344 +2 566
© 2014 Ichigo Group Holdings Co., Ltd. All rights reserved. 36
Total Fixed Assets 11,438 16,346 16,846 29,183 38,778 41,344 +2,566Total Assets 98,653 82,170 80,428 114,944 136,407 154,033 +17,626

Consolidated Balance Sheet: Liabilities & Net Assets (Milli )(Million yen)
Quarter-on-Quarter2011/02 2012/02 2013/02 2014/02 2015/02 1Q 2015/02 2Q(This quarter)
vs 2015/02 1Q(increase/decrease)
Liabilities Current Liabilities
Trade notes and accounts payable 47 57 64 132 152 178 +26Short-term borrowings 1,293 170 484 950 765 1,454 +689Short-term non-recourse loans - - - - - 48 +48Corporate bond (due within one year) 400 - - - - - -
Non-recourse corporate bond (due within 1,280 - - - - - -
Long-term borrowings (due within one 2,874 1,768 966 3,123 2,760 3,231 +471Long-term non-recourse loans (due within 25,243 8,793 2,263 428 1,277 1,230 -47Income taxes payable 99 115 65 96 178 120 -58yDeferred tax liabilities - - 15 24 32 32 0Accrued bonuses 24 22 25 14 141 118 -23Other current liabilities 4,155 2,974 3,419 2,817 3,270 3,196 -74Total Current Liabilities 35,417 13,902 7,304 7,588 8,578 9,610 +1,032
Long-Term Liabilities -
Non-recourse bonds - - - - 100 100 0Long-term borrowings 6,215 7,413 5,456 26,126 40,874 52,342 +11,468Long term borrowings 6,215 7,413 5,456 26,126 40,874 52,342 ,Long-term non-recourse loans 25,390 28,899 32,776 24,178 26,908 30,745 +3,837Deferred tax liabilities - 6 277 1,213 1,212 1,214 +2Long-term security deposits received 3,392 3,362 3,230 4,770 6,016 6,531 +515Negative goodwill 451 360 270 180 157 135 -22Other long-term liabilities 13 36 46 44 61 73 +12Total Long-Term Liabilities 35,463 40,080 42,056 56,513 75,331 91,143 +15,812
Total Liabilities 70 881 53 982 49 361 64 102 83 910 100 754 +16 844Total Liabilities 70,881 53,982 49,361 64,102 83,910 100,754 +16,844Net Assets
Shareholders’ Equity Capital 18,078 18,078 18,113 26,443 26,443 26,446 +3Capital surplus 2,447 2,395 2,429 10,808 10,813 10,817 +4Retained earnings 5,155 6,298 7,923 10,891 12,306 12,933 +627Treasury stock -36 -187 -187 -92 -84 -82 +2Total Shareholders’ Equity 25 644 26 584 28 279 48 050 49 479 50 114 +635Total Shareholders’ Equity 25,644 26,584 28,279 48,050 49,479 50,114 +635
Accumulated Other Comprehensive Income Unrealized gain on other securities, net 362 -604 160 400 456 561 +105Deferred loss on hedges - - - - -16 -28 -12Foreign currency translation adjustment -492 -7 16 9 8 7 -1Total Accumulated Other Comprehensive -130 -612 177 409 448 539 +91
Stock Options 80 116 143 121 151 182 +312 177 2 099 2 466 2 261 2 418 2 441 23
© 2014 Ichigo Group Holdings Co., Ltd. All rights reserved. 37
Minority Interests 2,177 2,099 2,466 2,261 2,418 2,441 +23Total Net Assets 27,771 28,187 31,066 50,842 52,497 53,278 +781Total Liabilities and Net Assets 98,653 82,170 80,428 114,944 136,407 154,033 +17,626
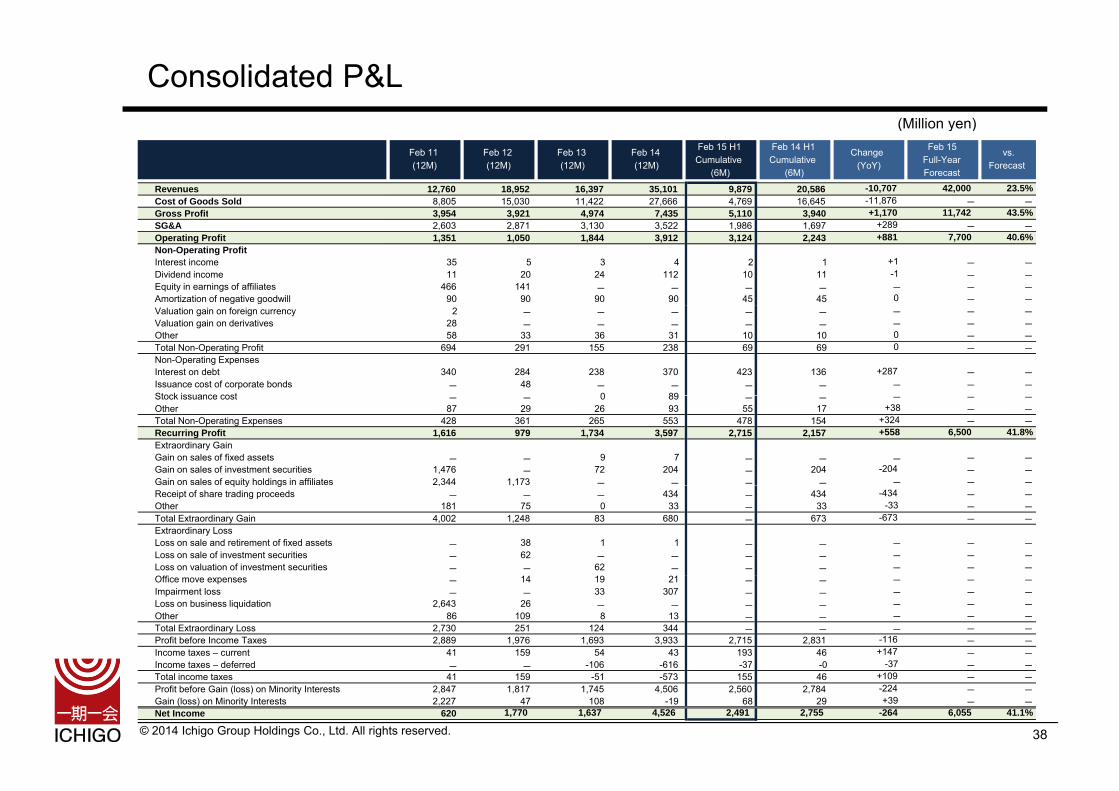
Consolidated P&L(Million yen)(Million yen)
Feb 11(12M)
Feb 12(12M)
Feb 13(12M)
Feb 14(12M)
Feb 15 H1Cumulative
(6M)
Feb 14 H1Cumulative
(6M)
Change(YoY)
Feb 15Full-YearForecast
vs.Forecast
Revenues 12,760 18,952 16,397 35,101 9,879 20,586 -10,707 42,000 23.5%Cost of Goods Sold 8,805 15,030 11,422 27,666 4,769 16,645 -11,876 - -Gross Profit 3,954 3,921 4,974 7,435 5,110 3,940 +1,170 11,742 43.5%Gross Profit 3,954 3,921 4,974 7,435 5,110 3,940 , ,SG&A 2,603 2,871 3,130 3,522 1,986 1,697 +289 - -Operating Profit 1,351 1,050 1,844 3,912 3,124 2,243 +881 7,700 40.6%Non-Operating ProfitInterest income 35 5 3 4 2 1 +1 - -Dividend income 11 20 24 112 10 11 -1 - -Equity in earnings of affiliates 466 141 - - - - - - -Amortization of negative goodwill 90 90 90 90 45 45 0 - -Valuation gain on foreign currency 2 - - - - - - - -Valuation gain on derivatives 28 - - - - - - - -Other 58 33 36 31 10 10 0 - -Total Non-Operating Profit 694 291 155 238 69 69 0 - -Non-Operating ExpensesInterest on debt 340 284 238 370 423 136 +287 - -Issuance cost of corporate bonds - 48 - - - - - - -Stock issuance cost 0 89Stock issuance cost - - 0 89 - - - - -Other 87 29 26 93 55 17 +38 - -Total Non-Operating Expenses 428 361 265 553 478 154 +324 - -Recurring Profit 1,616 979 1,734 3,597 2,715 2,157 +558 6,500 41.8%Extraordinary GainGain on sales of fixed assets - - 9 7 - - - - -Gain on sales of investment securities 1,476 - 72 204 - 204 -204 - -Gain on sales of equity holdings in affiliates 2,344 1,173 - - - - - - -q y g , ,Receipt of share trading proceeds - - - 434 - 434 -434 - -Other 181 75 0 33 - 33 -33 - -Total Extraordinary Gain 4,002 1,248 83 680 - 673 -673 - -Extraordinary LossLoss on sale and retirement of fixed assets - 38 1 1 - - - - -Loss on sale of investment securities - 62 - - - - - - -Loss on valuation of investment securities - - 62 - - - - - -Office move expenses - 14 19 21 - - - - -Impairment loss - - 33 307 - - - - -Loss on business liquidation 2,643 26 - - - - - - -Other 86 109 8 13 - - - - -Total Extraordinary Loss 2,730 251 124 344 - - - - -Profit before Income Taxes 2,889 1,976 1,693 3,933 2,715 2,831 -116 - -Income taxes – current 41 159 54 43 193 46 +147 - -Income taxes deferred 106 616 37 0 -37
© 2014 Ichigo Group Holdings Co., Ltd. All rights reserved. 38
Income taxes – deferred - - -106 -616 -37 -0 -37 - -Total income taxes 41 159 -51 -573 155 46 +109 - -Profit before Gain (loss) on Minority Interests 2,847 1,817 1,745 4,506 2,560 2,784 -224 - -Gain (loss) on Minority Interests 2,227 47 108 -19 68 29 +39 - -Net Income 620 1,770 1,637 4,526 2,491 2,755 -264 6,055 41.1%

Consolidated Cash Flows from Operating Activities(Milli )(Million yen)
Feb 11(12M)
Feb 12(12M)
Feb 13(12M)
Feb 14(12M)
Feb 15 H1Cumulative (6M)
Cash Flows from Operating Activities:Income before income taxes 2,889 1,976 1,693 3,933 2,715Depreciation 168 166 230 304 256pShare-based compensation expenses 47 37 49 69 66Amortization of goodwill 45 107 114 139 69Amortization of negative goodwill -90 -90 -90 -90 -45Increase (decrease) in accrued bonuses -20 -2 3 -11 104Increase (decrease) in allowance for doubtful accounts 216 -3,529 195 33 14Increase (decrease) in other allowances 143 -135 -11 - -Interest and dividend income -47 -26 -28 -116 -13Interest on debt 340 284 238 370 423Issuance cost of corporate bonds - 48 - - -Foreign currency translation adjustment 3 - - - -Equity in earnings of affiliates (gain) -466 -141 - - -Loss (gain) on sales of equity holdings in affiliates -2,344 -1,173 - - -Loss (gain) on sales of investment securities 1 476 62 72 204Loss (gain) on sales of investment securities -1,476 62 -72 -204 -Loss (gain) on sales/retirement of fixed assets 27 38 -8 -6 -Impairment Loss - - 33 307 -Loss on valuation of investment securities 0 - 62 - -Decrease (increase) in trading notes and receivable 14 -269 515 97 -140Decrease (increase) in operating loans receivable -471 454 -1,100 218 -1,000Decrease (increase) in operational investments in securities -250 3,068 723 1,635 1,098( ) p , , ,Loss on valuation of investment securities 250 139 63 114 -Decrease (increase) in operational investment -5 - - - -Decrease (increase) in real estate for sale 1,609 610 2,556 -6,729 -32,203Evaluation loss in real estate for sale 1,463 471 119 - -Valuation loss on investments - 41 1 12 -Decrease (increase) in accounts receivable 371 -179 -380 -255 180Increase (decrease) in accounts payable 105 -137 -39 -139 142Increase (decrease) in accrued expenses 726 1,067 519 137 -173Increase (decrease) in advances received 131 -141 11 38 -Increase (decrease) in security deposits received -263 -81 -253 1,230 1,554Others 593 -240 -239 522 22Sub-total 3,713 2,425 4,908 1,611 -26,927Interest and dividend income received 817 171 28 116 13
© 2014 Ichigo Group Holdings Co., Ltd. All rights reserved. 39
Interest and dividend income received 817 171 28 116 13Interest expenses paid -355 -315 -220 -378 -401Income taxes paid -81 -154 -106 -94 -22Cash Flows from Operating Activities: 4,094 2,127 4,609 1,254 -27,338

Consolidated Cash Flows from Investing & Financing Activities(Milli )(Million yen)
Feb 11(12M)
Feb 12(12M)
Feb 13(12M)
Feb 14(12M)
Feb 15 H1Cumulative (6M)
Cash Flows from Investing Activities: Payments into time deposits - -352 0 0 -325Proceeds from withdrawal of time deposits 40 - 151 - -
Acquisition of investment securities 15 167Acquisition of investment securities - - -15 - -167Proceeds from sales of investment securities 1,596 137 76 282 -
Proceeds from redemption of investment securities - 40 30 2 -
Proceeds from sale of securities in affiliates 2,499 3,327 - - -
Proceeds from capital decrease in affiliates 176 - - - -
Acquisition of property and equipment -72 -63 -124 -7,150 -5,515Proceeds from sale of property and equipment - 9 17 72 -
Acquisition of intangible assets -20 -7 -0 -389 -22Acquisition of intangible assets -20 -7 -0 -389 -22Payments for investments in capital - - -4 -5 -3Proceeds from redemption of investments - - 0 7 0Proceeds from sale of investments - 4 - - -
Payments of deposits - - - - -123Payments for acquisitions of subsidiaries resulting in thechange of consolidation scope
-2,346 -271 -218 -1,389 -
Payments of loans receivable -30 - - - -Payments of loans receivable 30Collection of loans receivable 982 - - - 0Others 62 -14 60 -40 0Cash Flows from Investing Activities: 2,889 2,808 -27 -8,610 -6,156Cash Flows from Financing Activities: Increase (decrease) in short-term bank loans, net -2,298 -1,123 314 465 503Increase (decrease) in short-term non-recourse loans,
- - - - 48net
48
Proceeds from issuance of corporate bonds 7,400 6,059 - - -
Redemption on corporate bonds -8,750 -6,500 - - -
Proceeds from issuance of non-recourse bonds 300 2,100 - - -
Redemption of non-recourse bonds -878 -2,455 - - -
Proceeds from long-term loans 4,860 2,900 5,440 26,777 29,872Repayment of long-term loans -2,625 -2,807 -8,199 -5,388 -3,549Proceeds from long-term non-recourse loans 3,500 11,610 12,346 5,675 4,200Repayment of long-term non-recourse loans -4,810 -14,231 -13,885 -19,030 -2,073Proceeds from issuance of common shares - - - 16,387 -
Payment on share buyback - -935 - - -
Proceeds from exercise of stock option - - 48 242 17Cash dividends paid 0 0 - -445 -542Share issuance to minority shareholders - - 20 - -
© 2014 Ichigo Group Holdings Co., Ltd. All rights reserved. 40
yPayments to minority shareholders for redemption ofcommon stock
-1,161 -30 -19 - -
Cash dividends paid to minority shareholders -613 -65 0 - -
Cash Flows from Financing Activities: -5,078 -5,480 -3,935 24,682 28,476
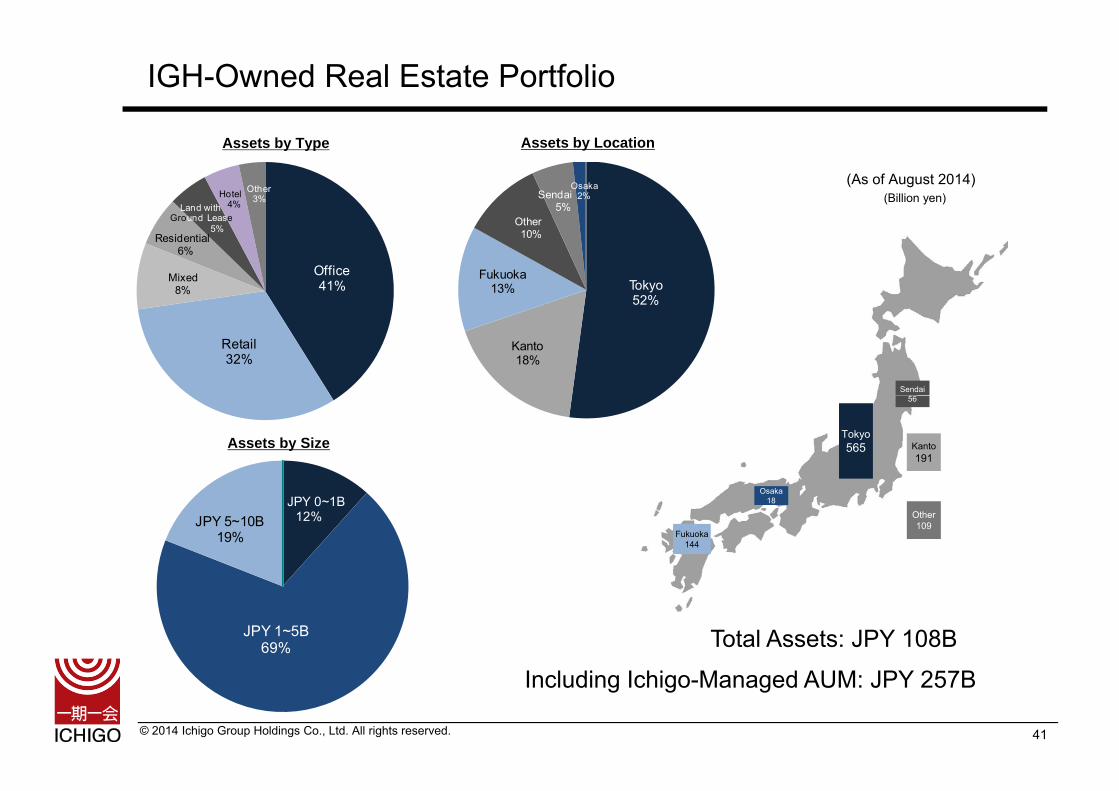
IGH-Owned Real Estate Portfolio
(As of August 2014) (Billion yen)
Assets by Type Assets by Location
Land withGro nd Lease
Hotel4%
Other3% Sendai
5%
Osaka2%
Office41%
Mixed8%
Residential6%
Ground Lease5%
Tokyo52%
Fukuoka13%
Other10%
Sendai
Retail32%
Kanto18%
Tokyo565
56
Kanto191
Assets by Size
Osaka18
Other109
Fukuoka144
JPY 0~1B12%JPY 5~10B
19%
Total Assets: JPY 108BJPY 1~5B69%
© 2014 Ichigo Group Holdings Co., Ltd. All rights reserved. 41
Including Ichigo-Managed AUM: JPY 257B
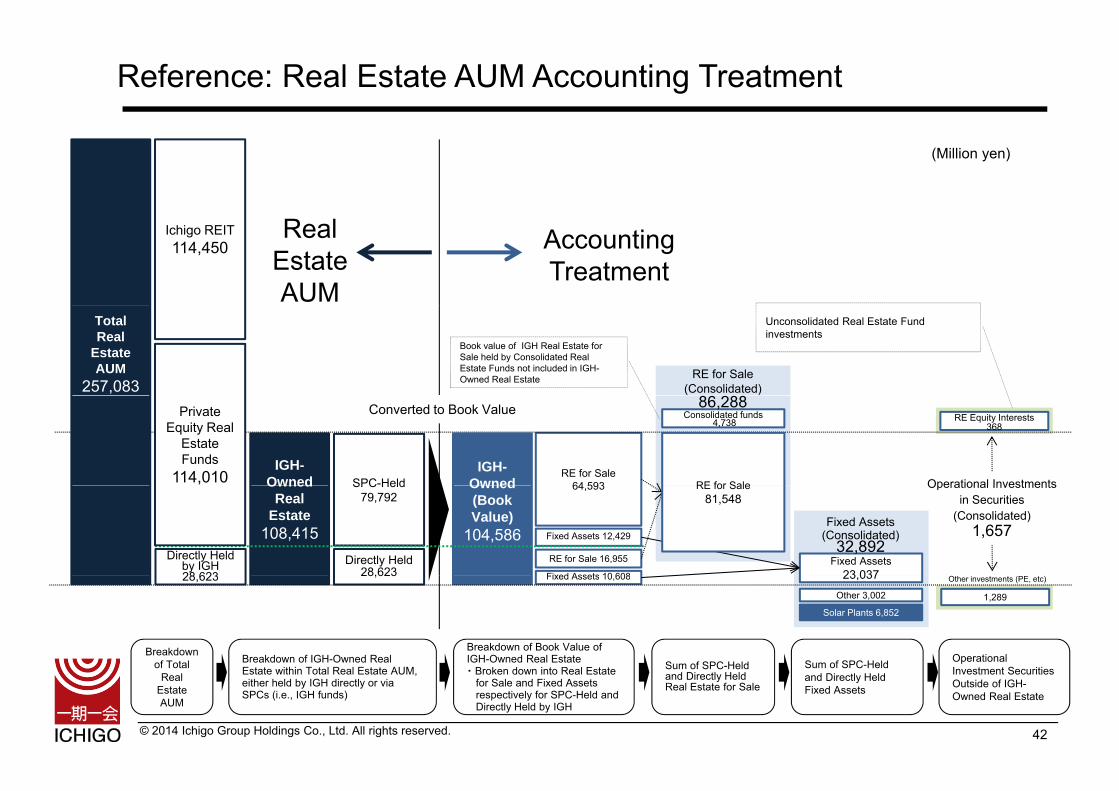
Reference: Real Estate AUM Accounting Treatment
(Million yen)
Ichigo REIT114,450
Real EstateAUM
Accounting Treatment
RE for Sale(Consolidated)
Book value of IGH Real Estate for Sale held by Consolidated Real Estate Funds not included in IGH-Owned Real Estate
Total Real
EstateAUM
257,083
Unconsolidated Real Estate Fund investments
IGH-Owned SPC-Held
Consolidated funds4,738
86,288
RE for Sale64 593
IGH-Owned RE for Sale
RE Equity Interests 368
Operational Investments
Converted to Book ValuePrivate Equity Real
Estate Funds
114,010 Owned Real
Estate108,415
SPC Held79,792
Directly Held 28,623
64,593
Fixed Assets 12,429
RE for Sale 16,955
Fixed Assets 10 608Fixed Assets
23 037
Fixed Assets (Consolidated)
32,892
Owned (Book Value)
104,586
RE for Sale81,548
Operational Investments in Securities
(Consolidated)1,657
Directly Held by IGH28 623 28,623 Fixed Assets 10,608 23,037
Other 3,002
Solar Plants 6,8521,289
28,623
Breakdown of Total Breakdown of IGH-Owned Real
Breakdown of Book Value of IGH-Owned Real Estate Sum of SPC Held Sum of SPC-Held Operational
Other investments (PE, etc)
© 2014 Ichigo Group Holdings Co., Ltd. All rights reserved. 42
of Total Real
Estate AUM
Estate within Total Real Estate AUM, either held by IGH directly or via SPCs (i.e., IGH funds)
・ Broken down into Real Estate for Sale and Fixed Assets respectively for SPC-Held and Directly Held by IGH
Sum of SPC-Held and Directly Held Real Estate for Sale
Sum of SPC-Held and Directly Held Fixed Assets
Investment SecuritiesOutside of IGH-Owned Real Estate
Appendix: About Ichigo Group
© 2014 Ichigo Group Holdings Co., Ltd. All rights reserved. 43

Full Service Real Estate & Clean EnergyI hi f i t J bIchigo comes from an ancient Japanese proverb, Ichigo Ichie, meaning “One lifetime, one encounter”
As the core company of the Ichigo Group, Ichigo Group Holdings seeks to serve the needs of society by investing in Japanese real estate We drawserve the needs of society by investing in Japanese real estate. We draw upon our extensive experience in real estate and financial services to provide our shareholders and clients secure long-term returns. As Japan’s first zero-carbon public real estate firm, we are deeply committed to supporting the balanced, green, and ecologically-responsible development of Japan’s economy and society through our real estate investmentof Japan s economy and society through our real estate investment activities.
We were established in March 2000 and listed on NASDAQ Japan (now JASDAQ) in November 2002. We are focused on stable and profitable growth for our shareholders.
Kenji IwasakiScott Callon To strengthen Ichigo Group’s capabilities as a real estate owner/operator, we merged our key real estate subsidiaries on July 1, 2012. The mergers bring together our J-REIT and private equity real estate asset management companies, providing more scale to our teams and enabling us to add further value to small to mid sized assets and ground leases In addition
Scott CallonChairman & Representative Statutory Executive Officer
Callon has lived in Japan since 1994. Previous to Ichigo, he was with he Japan Development Bank Bankers Trust and the UK Prudential Group further value to small-to-mid-sized assets and ground leases. In addition,
Ichigo Group entered the clean energy industry in November of the same year, enabling the Group to promote ecologically-friendly value enhancement of its properties. We operate and add value across the full spectrum of Japanese real estate assets, including a Tokyo Stock Exchange listed J REIT (Ichigo REIT 8975) private equity
Japan Development Bank, Bankers Trust, and the UK Prudential Group, and was Managing Director & Head of Equities of Morgan Stanley Japan. He established Ichigo Asset Management in 2006. He has been Chairman and Representative Statutory Executive Officer since October 2008. Callon is one of three judges for the Tokyo Stock Exchange’s annual Corporate Value Improvement Award, as well as a member of the Ministry of Economy, Trade, and Industry’s (METI) Ito Review – Competitiveness
d I ti f S t i bl G th B ildi F bl R l ti hi Exchange-listed J-REIT (Ichigo REIT, 8975), private equityreal estate funds, property management, and facility management.
We look forward to building upon our track record as a Japanese real estate services provider,
and Incentives for Sustainable Growth: Building Favorable Relationship between Companies and Investors Project.
Kenji IwasakiPresident & Representative Statutory Executive Officer
Iwasaki has been President and Representative Statutory Executive Officer since October 2008 with 18 years of real estate experience
© 2014 Ichigo Group Holdings Co., Ltd. All rights reserved.
p p ,creating success for our clients and our shareholdersand working to be prudential stewards on behalf of societyand our shared environment.
44
Officer since October 2008, with 18 years of real estate experience. From 2004-2008, he was the head of the Company’s real estate fund business. Prior to joining the Company in 2001, he was engaged in urban development projects at Fujita Corporation.

Corporate HistoryA Pioneer in the Real Estate Securitization and Fund Businesses in JapanA Pioneer in the Real Estate Securitization and Fund Businesses in Japan2000 March Establish PI Technology Co., Ltd.
April Establish Asset Managers Co., Ltd.2001 August Asset Managers arranges the securitization of assets from the Ikebukuro store of The Seibu Department Stores, Ltd.
September Merger between Asset Managers and PI Technology
Successful Public Listing Accelerated Business ExpansionSuccessful Public Listing, Accelerated Business Expansion
2002 November List on NASDAQ Japan (now JASDAQ, Ticker:2337)2006 May Set up a board committee system to support corporate governance
December Acquire an equity stake in CITIC International Assets Management Limited, part of the CITIC Group, China's largest banking and financial services group
2007 April Establish private equity real estate fund management company2007 April Establish private equity real estate fund management company2008 March Establish Group holding company
Ichigo Trust Becomes Major Shareholder, Focus on the Core Business of Japanese Real Estate Asset Management
2008 August Bolster capital through a third-party allotment of new shares to Ichigo TrustOctober Appoint Scott Callon and Kenji Iwasaki as Chairman and President, respectively
2009 F b Wi t h ld l t t th G b l h t b i i t f th Z C C tibl N t d M h 18 20112009 February Win noteholder approval to strengthen Group balance sheet by revising terms of the Zero Coupon Convertible Notes due March 18, 2011
Full-Service Real Estate and Clean Energy
2010 February Ichigo Trust becomes our controlling shareholderSeptember Change in Company Name to Ichigo Group Holdings Co., Ltd.
2011 January Acquire Japan Office Advisors, Inc., the asset manager of a J-REIT, Japan Office Investment Corporation (Ticker: 8983)y q p , , g , p p ( )Establish Ichigo Estate Co., Ltd., specializing in small-sized assets and ground leases
March Japan Office REIT renamed Ichigo Real Estate Investment Corporation (Ticker: 8983)August Acquire Fund Creation REIT Advisers Co., Ltd., the asset manager of a J-REIT, FC Residential Investment Corporation (”FCR”, Ticker: 8975)November Merger between FCR and Ichigo Real Estate Investment Corporation (New REIT name: Ichigo Real Estate Investment Corporation, Ticker:
8975)Merger between the two REIT asset management companiesMerger between the two REIT asset management companies
2012 July Merger between J-REIT and private equity real estate fund management companies (New name: Ichigo Real Estate Investment AdvisorsCo., Ltd.)Merger between Ichigo Estate and Ichigo Solutions Co., Ltd. (New name: Ichigo Estate Co., Ltd.) Establish Ichigo Global Capital Co., Ltd. specializing in cross-border fundraising and M&A advisoryIchigo’s Miyake wins a silver medal at London Olympics, the first Japanese medalist in women’s weightlifting
© 2014 Ichigo Group Holdings Co., Ltd. All rights reserved.
November Establish Ichigo ECO Energy Co., Ltd., specializing in clean energy2013 November Ichigo Group and Ichigo REIT simultaneous PO (Japan’s first double PO)2014 January Announce Shift Up 2016 mid-term business plan
45

Ichigo Group Holdings Co., Ltd. Company Profile
Name
Address
Established
Ichigo Group Holdings Co., Ltd.The Imperial Hotel Tower, 1-1-1 Uchisaiwaicho, Chiyoda-ku, Tokyo 100-0011
March 17, 2000 Board andSenior Executives
8 Directors, of which 5 Independent Directors12 Executive Officers
Paid-in Capital
Major Shareholder
Business
26,446 million yen (as of August 2014)
Ichigo Trust (as of August 2014)
Full-Service Real Estate and Clean Energy
Scott Callon Chairman & Representative Statutory Executive Officer Kenji Iwasaki President & Representative Statutory Executive Officer Minoru Ishihara Executive Vice President & Statutory Executive Officer
(Real Estate Services) Takashi Minamikawa Executive Managing Director & Statutory Executive
Officer (Finance)
Registrations & Licenses
First-class Architectural Firm, Tokyo Metropolitan Government registration #55543Real Estate Business, Tokyo Metropolitan Government (2) registration #90527Construction Licenses, Tokyo Metropolitan
Statutory Executive Officers(as of March 1, 2014)
Officer (Finance)Eri Murai Senior Statutory Executive Officer (Administration & HR)Katsuhiko Hattori Statutory Executive Officer
(Engineering, Environmental & Architectural Solutions) Haruki Nakane Statutory Executive Officer (Compliance)Hiroshi Shimazu Statutory Executive Officer (Audit)Hi hi T t St t t E ti Offi (Fi )
Listed Exchange
Consolidated Subsidiaries
Government (26) registration #141677
JASDAQ (Security code: 2337)
63 companies (as of August 2014)
Hisayoshi Towata Statutory Executive Officer (Finance)Kenichi Nagao Statutory Executive Officer (Business Development,
Special Projects) Takeyuki Yoshimatsu Statutory Executive Officer (Business Management) Masaaki Yajima Statutory Executive Officer (Real Estate Services)
Company’s Shareholders’ Meeting
Audit Committee
Nominating Committee
Compensation Committee
Compliance Committee
P id t
Board of Directors
ChairmanGroup Management
Committee Audit
Website www.ichigo-holdings.co.jp/english
PR & IRSystemsBusiness DevelopmentLegal & Risk Management
Finance
President
Business Planning FinanceAccountingSpecial Projects
Business Management
Committee
Real Estate Services
Office AssetsResidential AssetsRetail/Hotel AssetsInternational Sales
Compliance
Administration & HR
AdministrationHRIchigo UniversityCash Management
© 2014 Ichigo Group Holdings Co., Ltd. All rights reserved. 46
Legal & Risk Management Special ProjectsInternational SalesEngineeringEnvironmental & Architectural SolutionsPM&BM Development
Cash Management

C B i F ll S i R l E t t d Cl E
Group Structure
‒ Core Businesses = Full-Service Real Estate and Clean Energy ‒ Actively Promoting CSR through Environmental Activities and Sports
Sponsorship
Hiromi Miyake
Ichigo Group Holdings Co Ltd
Full-Service Real Estate and Clean Energy
Ichigo Group Holdings Co., Ltd.JASDAQ:2337
Real Estate & Value-Add Investment
Ichigo Real Estate Investment Advisors
Co Ltd
Ichigo Estate Co., Ltd.Real estate solutions business in small-sized assets & ground
Real Estate Solutions Business ECO Energy BusinessAM Business
Ichigo ECO Energy Co., Ltd.
FM Business
Takara Building Maintenance Co., Ltd.
C h i F iliti
Retail PM Business
Ichigo Marché Co., Ltd. Operates Matsudo Nanbu Wholesale Market in ChibaCo., Ltd.
AM for Ichigo REIT (8975) and private equity RE funds
small sized assets & ground leasesBridge funds for Ichigo REIT
Clean energy businesses, including nationwide utility-scale solar power production, ECO-related consulting, energy conservation, and LED exterior lighting enhancements
Comprehensive Facilities Management (FM) Business
Wholesale Market in Chiba
Miyako City Co., Ltd.Operates Miyako City, large-scale shopping mall in Miyazaki Prefecture, Kyushu
© 2014 Ichigo Group Holdings Co., Ltd. All rights reserved. 47
MEMO
© 2014 Ichigo Group Holdings Co., Ltd. All rights reserved. 48

MEMO
© 2014 Ichigo Group Holdings Co., Ltd. All rights reserved. 49

MEMO
© 2014 Ichigo Group Holdings Co., Ltd. All rights reserved. 50

These materials were prepared to explain the Company’s businesses and are not for the purpose ofsoliciting investment in marketable securities issued by the Company. The Company does notguarantee the accuracy of the figures, information, estimates or other statements included herein, andg y g , , ,accepts no responsibility for damages or losses arising through the use of the figures, information,estimates or other statements contained herein.
These materials are based upon information available as of the publication date, and may containp p , yforward-looking statements pertaining to the Company’s expectations, targets, plans and strategies.Such forward-looking statements are not facts, but are the result of management’s judgment based oninformation currently available. Actual operating results or developments concerning the Companymay differ substantially from those indicated by forward-looking statements. The information enclosedy y y gis subject to revision without prior notice.
Contact:Ichigo Group Holdings Co., Ltd.Investor Relations
TEL: +81-3-3502-4818 FAX:+81-3-3502-4801E-mail: [email protected]/englishIchigo Group is Japan’s first zero-carbon listed real estate company. We are
© 2014 Ichigo Group Holdings Co., Ltd. All rights reserved.
g p p p ytaking responsibility for our environmental footprint by offsetting our carbon emissions as well as working with organizations to invest in low-carbon technologies.
51