ici waste characterization program - metro vancouver · 10 . 11 : 2 – east (including burnaby,...
TRANSCRIPT
2014 ICI WASTE CHARACTERIZATION PROGRAM
June 1, 2015ISSUED FOR USE
FILE: ENVSWM03362-01

This page intentionally left blank.
Metro Vancouver ICI Waste Characterization Program.docx

ICI WASTE CHARACTERIZATION PROGRAM FILE: 704-ENVSWM03362-01 | JUNE 2015 | ISSUED FOR USE
EXECUTIVE SUMMARY Tetra Tech EBA Inc. (Tetra Tech EBA) was retained by Metro Vancouver to conduct an institutional, commercial, and light-industrial (ICI) Waste Characterization Study. Sampling was conducted from November 2014 to January 2015.
The objectives of the study were to establish current data on the composition of solid waste disposed by a subset of businesses across the region, and to provide information about the types of diversion activities they practice. The following four industry groups, which are major sources of solid waste, were selected by Metro Vancouver – ICI establishments were categorized using the North American Industry Classification System1 (NAICS):
Accommodation and Food Services;
Business Commercial Services;
Manufacturing; and
Retail Trade.
The majority of garbage samples handled for the study were collected directly from participating establishments by Tetra Tech EBA and transported to Vancouver South Transfer Station (VSTS) where the sorting was conducted. A handful were sorted in situ at the business location. This report is split into three sections as detailed below:
Section 1.0 Introduction – outlines project objectives and the background and rationale for the study.
Section 2.0 Methodology – summarizes the methodology utilized for business selection and recruitment, garbage sampling and sorting, and data analysis.
Section 3.0 Results and Discussion – provides the results of the waste characterization data by category and subsector. It also provides key data collected from ICI establishments including tonnages and diversion practices.
A total of 98 samples weighing 7,274 kg, an average of 74 kg per sample, were sorted into 128 material subcategories within 12 primary categories. Of these, 92 samples were sorted at the VSTS and the remaining six were sorted in situ at the business location. The table below shows the distribution of samples.
Table E1: Sampling Distribution by Business Category and Location
Zone Accommodation & Food
Business Commercial Manufacturing Retail Trade
1 – Central/North (including Vancouver and North Shore) 15 15 10 11
2 – East (including Burnaby, Tri-Cities, Maple Ridge) 5 3 4 9
3 – South (including Richmond, Surrey, Delta) 5 7 9 5
Total 25 25 23 25
1 The North American Industry Classification System (NAICS) is the standard used by Federal statistical agencies in classifying business establishments for the purpose of collecting, analyzing, and publishing statistical data related to the U.S. business economy. NAICS was adopted in 1997 to replace the Standard Industrial Classification (SIC) system. http://www.census.gov/eos/www/naics/
i
Metro Vancouver ICI Waste Characterization Program.docx

ICI WASTE CHARACTERIZATION PROGRAM FILE: 704-ENVSWM03362-01 | JUNE 2015 | ISSUED FOR USE
The total ICI tonnage disposed of in Metro Vancouver in 2013 was estimated at 414,191 tonnes2 (excluding demolition, land-clearing, and construction waste). The four categories sampled for this study are depicted in Figure 1 below as a percentage of the overall ICI annual tonnage. Estimated annual tonnages for each business category3 are as follows:
Accommodation & Food – 38,900 tonnes;
Business Commercial Services – 28,800 tonnes;
Manufacturing – 42,700 tonnes; and
Retail Trade – 14,800 tonnes.
Figure E1: Regional Tonnage by Business Category
Overall, the categories selected for this study represented approximately 30% of the total ICI waste stream. The other 70% includes education, health care, construction, public administration, retail food and beverage, and wholesale. Of the categories selected for this study, Manufacturing represented the greatest proportion of the ICI waste stream at 10%, and Retail Trade represented the least at 4%. However, several types of retail, most notably grocery stores, were not included in the scope of this study.
The overall waste characterization results for the four primary business categories are presented in the figure and table below.
2 Metro Vancouver, 2013. Metro Vancouver Recycling and Solid Waste Management – 2013 Summary. http://www.metrovancouver.org/services/solid-waste/SolidWastePublications/2013_Solid_Waste_Management_Annual_Summary.pdf
3 For each category, a ‘waste disposal per employee’ figure was calculated from the average of samples collected for this study (i.e., estimated annual tonnage for business A, divided by total number of employees). This was multiplied by the total number of employees in that category, as per the Dun and Bradstreet database.
Accommodation & Food, 9%
Business & Commercial Services,
7%
Manufacturing, 10%
Retail Trade, 4%
Other, 70%
ii
Metro Vancouver ICI Waste Characterization Program.docx
ICI WASTE CHARACTERIZATION PROGRAM FILE: 704-ENVSWM03362-01 | JUNE 2015 | ISSUED FOR USE
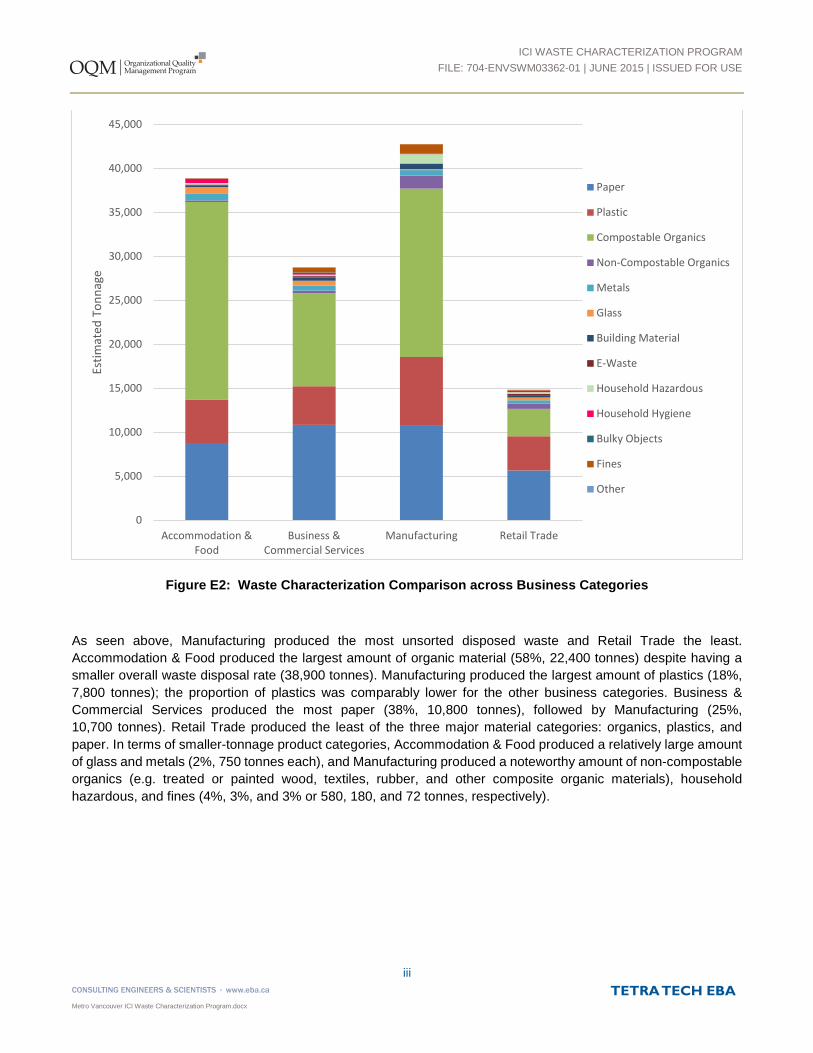
Figure E2: Waste Characterization Comparison across Business Categories
As seen above, Manufacturing produced the most unsorted disposed waste and Retail Trade the least. Accommodation & Food produced the largest amount of organic material (58%, 22,400 tonnes) despite having a smaller overall waste disposal rate (38,900 tonnes). Manufacturing produced the largest amount of plastics (18%, 7,800 tonnes); the proportion of plastics was comparably lower for the other business categories. Business & Commercial Services produced the most paper (38%, 10,800 tonnes), followed by Manufacturing (25%, 10,700 tonnes). Retail Trade produced the least of the three major material categories: organics, plastics, and paper. In terms of smaller-tonnage product categories, Accommodation & Food produced a relatively large amount of glass and metals (2%, 750 tonnes each), and Manufacturing produced a noteworthy amount of non-compostable organics (e.g. treated or painted wood, textiles, rubber, and other composite organic materials), household hazardous, and fines (4%, 3%, and 3% or 580, 180, and 72 tonnes, respectively).
0
5,000
10,000
15,000
20,000
25,000
30,000
35,000
40,000
45,000
Accommodation &Food
Business &Commercial Services
Manufacturing Retail Trade
Estim
ated
Ton
nage
Paper
Plastic
Compostable Organics
Non-Compostable Organics
Metals
Glass
Building Material
E-Waste
Household Hazardous
Household Hygiene
Bulky Objects
Fines
Other
iii
Metro Vancouver ICI Waste Characterization Program.docx

ICI WASTE CHARACTERIZATION PROGRAM FILE: 704-ENVSWM03362-01 | JUNE 2015 | ISSUED FOR USE
Table E2: Waste Characterization of NAICS Categories by Primary Materials
Primary Category
Combined Accommodation & Food Services
Business Services
Manufacturing Retail Trade
(N=98) (N=25) (N=25) (N=23) (N=25)
Estimated Annual Tonnage* 125,200 38,900 28,800 42,700 14,800
Estimated kg per Employee 300 500 100 1,000 200
Weighted Mean (%)
Paper 30.5% 22.6% 37.7% 25.1% 38.2%
Plastics 18.0% 12.7% 15.3% 18.3% 26.2%
Compostable Organics 40.3% 57.8% 36.7% 44.8% 21.0%
Non-Compostable Organics 2.2% 0.5% 1.1% 3.5% 3.9%
Metals 2.0% 1.9% 2.0% 1.5% 2.7%
Glass 1.6% 1.9% 1.9% 0.3% 2.1%
Building Material 1.2% 0.6% 1.3% 1.3% 1.8%
Electronic Waste 0.5% 0.2% 0.6% 0.1% 1.1%
Household Hazardous 1.1% 0.4% 0.5% 2.5% 1.2%
Household Hygiene 0.7% 1.2% 0.2% 0.2% 1.1%
Bulky Objects 0.2% 0.0% 0.6% 0.0% 0.1%
Fines 1.2% 0.2% 2.0% 2.4% 0.5%
*Data provided by participating companies then extrapolated to represent each industry category in the study. Kg per employee amounts were calculated from the estimated tonnages, and are comparable to other studies that have estimated kg per employee.
Section 3.2 of the report details the waste characterization, as broken down by NAICS subsectors.
Out of the 98 samples sorted, 53% came from buildings with organics management programs already in place. Of the samples which came from buildings managed by property managers (malls and office towers combined), 58% had organics management programs in place. Each participating business was provided with a Business Assessment Sheet that summarized the characterization of their sample and provided key tips and resources for improving waste diversion programs. This summary was a key tool for incentivising businesses to participate. A template for the Business Assessment Sheet can be found in Appendix F.
Knowledge of waste characterization, management practices and tonnage data of different business categories will enable Metro Vancouver to better understand the waste disposal of key generators and further support the development of waste prevention, reduction and diversion initiatives.
iv
Metro Vancouver ICI Waste Characterization Program.docx
ICI WASTE CHARACTERIZATION PROGRAM FILE: 704-ENVSWM03362-01 | JUNE 2015 | ISSUED FOR USE
ACKNOWLEDGEMENTS
This study would not have been possible without assistance from the Vancouver South Transfer Station and its staff, who let us sort samples at their facility between November 2014 and January 2015. The collaboration of participating businesses, and speedy responses to requests for information, was also essential.
v
Metro Vancouver ICI Waste Characterization Program.docx

ICI WASTE CHARACTERIZATION PROGRAM FILE: 704-ENVSWM03362-01 | JUNE 2015 | ISSUED FOR USE
TABLE OF CONTENTS EXECUTIVE SUMMARY ........................................................................................................................ i
1.0 INTRODUCTION .......................................................................................................................... 1 1.1 Report Outline ........................................................................................................................................ 1 1.2 Background ............................................................................................................................................ 1
2.0 METHODOLOGY ......................................................................................................................... 2 2.1 Sampling Framework ............................................................................................................................. 3 2.2 Business Recruitment ............................................................................................................................ 4 2.3 Sampling Events .................................................................................................................................... 4 2.4 Sample Selection and Handling............................................................................................................. 5 2.5 Data Analysis ......................................................................................................................................... 6 2.6 Business Assessment Sheet ................................................................................................................. 6
3.0 RESULTS AND DISCUSSION ..................................................................................................... 7 3.1 Overall Waste Characterization Results ................................................................................................ 8 3.2 Results by Business Category and Subsector ...................................................................................... 9
3.2.1 Business Commercial Services .............................................................................................. 10 3.2.2 Retail Trade ............................................................................................................................ 12 3.2.3 Accommodation & Food Services .......................................................................................... 16 3.2.4 Manufacturing ......................................................................................................................... 19
4.0 CLOSURE .................................................................................................................................. 22
LIST OF TABLES IN TEXT
Table E1: Sampling Distribution by Business Category and Location ..................................................... i Table E2: Waste Characterization of NAICS Categories by Primary Materials ...................................... iv Table 1: Sampling Distribution by Business Category ........................................................................... 3 Table 2: Sampling Distribution by Business Category and Location ...................................................... 4 Table 3: Sampling Method by Building Type and Bin Set-up ................................................................. 5 Table 4: Material Categories Defined by Diversion Potential ................................................................. 6 Table 5: Waste Characterization of NAICS Categories by Primary Materials ........................................ 9 Table 6: Key Summary Information Business Commercial Services ................................................... 10 Table 7: Waste Characterization for Business Commercial Services .................................................. 12 Table 8: Key Summary Information Retail Trade ................................................................................. 13 Table 9: Waste Characterization for Retail Trade ................................................................................ 15 Table 10: Key Summary Information Accommodation & Food Services .............................................. 16 Table 11: Waste Characterization for Accommodation and Food Services ......................................... 18 Table 12: Key Summary Information Manufacturing ........................................................................... 19 Table 13: Waste Characterization for Manufacturing .......................................................................... 21
vi
Metro Vancouver ICI Waste Characterization Program.docx
ICI WASTE CHARACTERIZATION PROGRAM FILE: 704-ENVSWM03362-01 | JUNE 2015 | ISSUED FOR USE
LIST OF FIGURES IN TEXT
Figure E1: Regional Tonnage by Business Category ............................................................................. ii Figure E2: Waste Characterization Comparison across Business Categories ....................................... iii Figure 1: Regional Tonnage by Business Category .............................................................................. 7 Figure 2: Waste Characterization Comparison across Business Categories ......................................... 8 Figure 3: Business Commercial Services Waste Characterization ...................................................... 11 Figure 4: Retail Trade Waste Characterization ................................................................................... 14 Figure 5: Accommodation & Food Services Waste Characterization ................................................... 17 Figure 6: Manufacturing Waste Characterization ................................................................................ 20 APPENDIX SECTIONS
TABLES
Table A Complete Waste Composition Results
APPENDICES
Appendix A Appendix B Appendix C Appendix D Appendix E Appendix F
Tetra Tech EBA’s General Conditions Invitation to Participate in the Study List of Material Categories Data Template Select Sample Photographs Example of Business Assessment Sheet
vii
Metro Vancouver ICI Waste Characterization Program.docx

ICI WASTE CHARACTERIZATION PROGRAM FILE: 704-ENVSWM03362-01 | JUNE 2015 | ISSUED FOR USE
ACRONYMS & TERMINOLOGY
Acronym Definition
CCME Canadian Council of Ministers of the Environment
DLC Demolition, Land-clearing, and Construction
EPR Extended Producer Responsibility
HDPE High Density Polyethylene (#2 plastic, rigid container and flexible film) – most often in the form of non-beverage bottles
Kg Kilogram
ICI (Light) Industrial, Commercial and Institutional
ISWRMP Integrated Solid Waste and Resource Management Plan
LDPE Low-density Polyethylene (#4 plastic, rigid items and flexible film)
MSW Municipal Solid Waste
NAICS North American Industry Classification System
OCC Old Corrugated Cardboard
PETE Polyethylene Terephthalate (#1, rigid bottles and thermoforms)
PP Polypropylene (#5 rigid container) – a thermoplastic polymer used in a variety of food packaging applications principally for its heat resistance properties
PS Polystyrene (#6 rigid and expanded) – Some examples of rigid PS include coffee cup lids, disposable plastic cutlery and CD cases, which, for the most part are two-dimensional objects similar to paper
PVC Polyvinyl Chloride (#3 rigid container) – not often used as a beverage or non-beverage container due to the chlorine content that complicates the recycling process; if found in the MRF it is sorted into Mixed Plastic stream
VSTS Vancouver South Transfer Station
Terminology Definition
Hauler Vehicle delivering the waste
Load Amount of waste contained in a hauler truck
Load Source Origin of a specific sample
Sample Portion of the load that was sorted and weighed
Business Categories Types of businesses assessed (classified by NAICS)
Material Categories Types of materials groupings assessed for the waste characterization
viii
Metro Vancouver ICI Waste Characterization Program.docx
ICI WASTE CHARACTERIZATION PROGRAM FILE: 704-ENVSWM03362-01 | JUNE 2015 | ISSUED FOR USE
LIMITATIONS OF REPORT This report and its contents are intended for the sole use of Metro Vancouver and their agents. Tetra Tech EBA Inc. (Tetra Tech EBA) does not accept any responsibility for the accuracy of any of the data, the analysis, or the recommendations contained or referenced in the report when the report is used or relied upon by any Party other than Metro Vancouver, or for any Project other than the proposed development at the subject site. Any such unauthorized use of this report is at the sole risk of the user. Use of this report is subject to the terms and conditions stated in Tetra Tech EBA’s Services Agreement. Tetra Tech EBA’s General Conditions are provided in Appendix A of this report.
NOTE TO THE READER The samples collected and audited for this study are “snapshots” in time, meaning the reported quantities are estimates and only represent the conditions for the period of time in which they were collected. Seasonal and annual variability, weather, and other factors can affect the amount and characterization of waste and recyclables generated by the various sectors at any given time. Even with combined educational, regulatory and financial initiatives the reader should not assume that it is necessarily easy, practical, or economical to recover a substantial portion of a disposed material from a mixed waste stream or at its source
ix
Metro Vancouver ICI Waste Characterization Program.docx

ICI WASTE CHARACTERIZATION PROGRAM FILE: 704-ENVSWM03362-01 | JUNE 2015 | ISSUED FOR USE
1.0 INTRODUCTION Tetra Tech EBA Inc. (Tetra Tech EBA) was retained by Metro Vancouver to conduct an institutional, commercial, and light-industrial (ICI) Waste Characterization Study in October 2014. The sampling was conducted between November 2014 and January 2015.
The objectives of the study were to establish current data on the composition of solid waste disposed by a subset of industries across the region, as well as to provide information about the types of diversion activities they practice. The following four industry groups, which are major sources of solid waste, were selected by Metro Vancouver – ICI establishments were categorized using the North American Industry Classification System (NAICS)1:
Accommodation and Food Services;
Business Commercial Services;
Manufacturing; and
Retail Trade.
The majority of garbage samples handled for the study were collected directly from participating establishments by Tetra Tech EBA and transported to Vancouver South Transfer Station (VSTS) where the sorting was conducted. A handful of samples were sorted in-situ at the business location.
This report discusses the methodology employed for the characterization study and provides the results and analysis from the sort. This information can be used as the basis for planning and implementing waste diversion programs in the ICI sector, to help achieve the goals of the Integrated Solid Waste and Resource Management Plan (ISWRMP) for Metro Vancouver.
1.1 Report Outline
This report is split into three sections as detailed below:
Section 1.0 Introduction – provides an introduction to the project including the overall objectives and the background and rationale for the study.
Section 2.0 Methodology – summarizes the methodology utilized for business selection and recruitment, garbage sampling and sorting, and data analysis.
Section 3.0 Results and Discussion – provides the results of the waste characterization data by category and subsector. It also provides key data collected from ICI establishments including tonnages and diversion practices.
1.2 Background
Metro Vancouver provides essential services, including Municipal Solid Waste (MSW) management, for over two million residents in the lower mainland of British Columbia. Metro Vancouver’s waste management system includes a waste-to-energy facility in Burnaby, six transfer stations, and a long-haul landfill in Cache Creek. Combined with the City of Vancouver’s transfer station and local landfill, this public-sector system provides transfer and disposal services to residents, agencies, and businesses in the region. Within the region there are also private facilities which manage recycling, demolition, land-clearing, and construction (DLC) waste.
1 The North American Industry Classification System (NAICS) is the standard used by Federal statistical agencies in classifying business establishments for the purpose of collecting, analyzing, and publishing statistical data related to the U.S. business economy. NAICS was adopted in 1997 to replace the Standard Industrial Classification (SIC) system. http://www.census.gov/eos/www/naics/ 1
Metro Vancouver ICI Waste Characterization Program.docx
ICI WASTE CHARACTERIZATION PROGRAM FILE: 704-ENVSWM03362-01 | JUNE 2015 | ISSUED FOR USE
Metro Vancouver has a goal of diverting 70% of its waste from disposal by the year 2015, with an aspirational goal of 80% diversion by the year 2020. Waste characterization studies are used to track the progress in achieving the desired diversion targets and to identify areas where more resources are required to achieve the region’s diversion goals. The most recent regional waste characterization study was conducted in 2013, which included samples from the ICI sector. In the past few years, Metro Vancouver has conducted waste characterization studies for specific subsectors including hospitals, grocery stores and distributors, filming set locations, parks, entertainment venues, and schools.
Metro Vancouver estimates that ICI waste accounts for more than 44% of the MSW entering the region’s disposal system (excluding DLC waste). The management, collection, and transportation of ICI waste materials, which are handled by the private sector, are complex due to the diverse nature of waste materials generated in this sector. ICI sector waste is collected in commingled loads from multiple businesses and multi-family residences and it is therefore difficult to isolate loads at solid waste facilities for monitoring by industry type.
Metro Vancouver chose four ICI sector categories for inclusion in the study, as outlined in the introduction. These industry groups were chosen because they represent a significant portion of the overall ICI waste tonnage generated in the region, and present opportunities for further waste minimization. As mentioned above, Metro Vancouver already has waste characterization data for other large ICI generators, including grocery stores and hospitals, which were not included in this study. ICI participants were categorized using NAICS, the standard used by North American federal agencies for collecting statistical data. The four NAICS categories were then subcategorized to enhance the comparability between industry types2. Regional industry demographics on employment and number of businesses were obtained from the Duns & Bradstreet database.
On January 1, 2015, the Organics Disposal Ban came into effect across the Metro Vancouver region. This policy, which prohibits the residential and ICI sectors from disposing of organic material in the garbage, is a key regulatory tool for promoting source separation and achieving regional diversion targets.
2.0 METHODOLOGY A total of 98 samples weighing 7,274 kg, an average of 74 kg per sample, were collected from businesses’ garbage bins; recycling and organics samples were not collected and characterized as part of this study. The samples were sorted into 128 material subcategories within 12 primary categories. The waste characterization sampling of 92 samples was carried out at VSTS. The remaining six samples were sorted in situ at the business location.
The waste study was conducted as follows:
Identified, contacted, and recruited businesses to participate in the study;
Gathered data regarding garbage tonnage, fees, business size, and recycling practices;
Collected samples from at least one business cycle (up to a maximum of 100 kg);
Sorted material into 12 primary categories and 128 secondary categories; and
Combined and analyzed data across categories and subsectors to calculate weighted average characterization and per-employee disposal results.
2 Only some subsectors within each of the four NAICS categories were included in the study. Subsectors included can be found in Table 1.
2
Metro Vancouver ICI Waste Characterization Program.docx

ICI WASTE CHARACTERIZATION PROGRAM FILE: 704-ENVSWM03362-01 | JUNE 2015 | ISSUED FOR USE
2.1 Sampling Framework
The Tetra Tech EBA project team prepared a sampling framework and protocol customized for this study, working from data completeness, scheduling, safety, and budgetary perspectives. Sampling and sorting was conducted in accordance with the methodology set out in the Recommended Waste Characterization Methodology for Direct Waste Analysis Studies in Canada (Canadian Council of Ministers of Environment [CCME], 1999).
The samples were distributed evenly across the four business categories, i.e., approximately 25 samples per category, to support data comparison (Table 1). The number of samples collected from each category influences the level of confidence or reliability of the data. Tetra Tech EBA anticipated that the Business Commercial Services, Accommodation & Food Services, and Retail Trade categories would have relatively homogenous waste streams at roughly 30% to 50% variability between businesses. At this level of variability, by sorting 25 samples, the data would have an uncertainty range between 15% and 25%3. The Manufacturing category was anticipated to have a less homogenous waste stream across subsectors, with roughly 60% to 90% variability. At this level of variability, sorting 25 samples across the category, the data would have an uncertainty range between 25% and 50%.
Representation of different subsectors within each of the four categories was determined by looking at the total number of employees as a proxy for the size of the businesses. It was assumed that the number of employees is proportional to waste disposal and, therefore, the expected tonnage. The subsector representation determined in this manner was used as a target, allowing for some variance depending on the uptake by businesses.
Table 1: Sampling Distribution by Business Category
No. Category and Subsector Description NAICS Category No. of Businesses in the Region* No. of Samples
1 Business Commercial Services 54/55/56 32,261 25
2 Accommodation & Food Services 72 8,151 25
Accommodation 6
Food Services 19
3 Retail Trade 44/45 8,941 25
Malls 17
Clothing and Sports 5
Miscellaneous and Other 3
4 Manufacturing 31/32/33 2,819 23
Food and Beverage 15
Other 8
TOTAL 98
*From Dun & Bradstreet database. Retrieved January 2015
3 A table showing the variability between samples and the corresponding uncertainty range can be found in the in Appendix C, CCME, (1999). Recommended Waste Characterization Methodology for Direct Waste Analysis Studies in Canada, Report Prepared by SENES Consultants Limited.
3
Metro Vancouver ICI Waste Characterization Program.docx
ICI WASTE CHARACTERIZATION PROGRAM FILE: 704-ENVSWM03362-01 | JUNE 2015 | ISSUED FOR USE
2.2 Business Recruitment
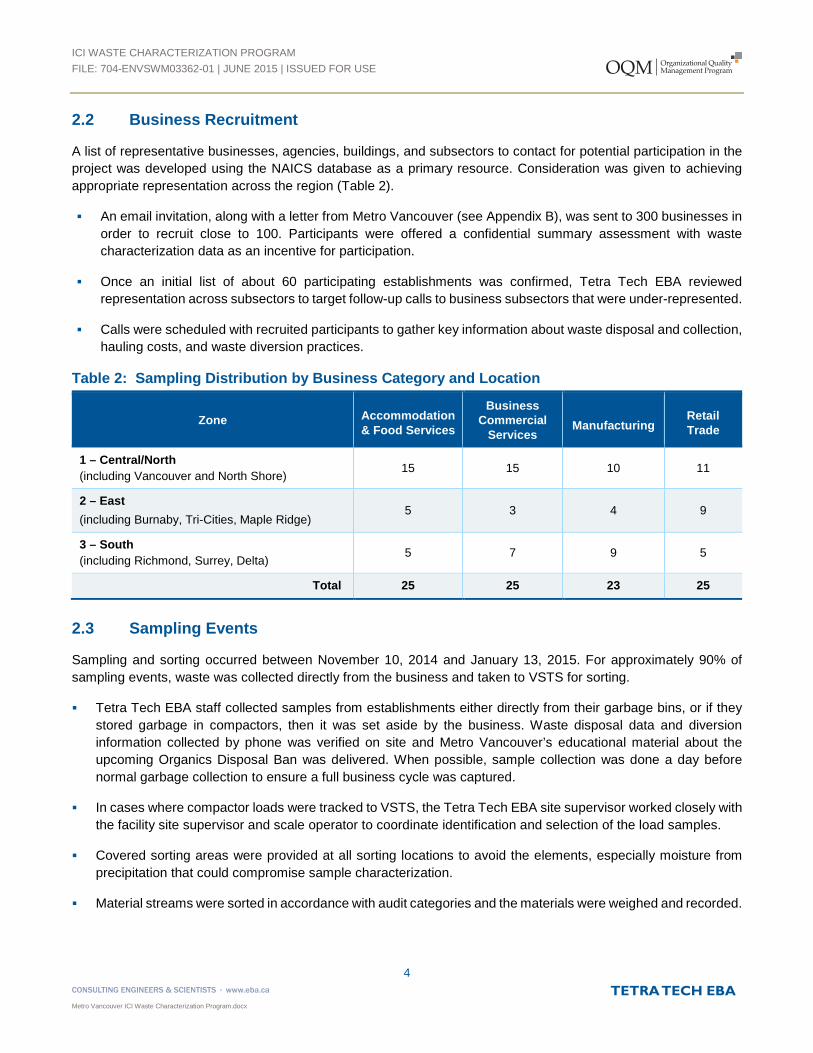
A list of representative businesses, agencies, buildings, and subsectors to contact for potential participation in the project was developed using the NAICS database as a primary resource. Consideration was given to achieving appropriate representation across the region (Table 2).
An email invitation, along with a letter from Metro Vancouver (see Appendix B), was sent to 300 businesses in order to recruit close to 100. Participants were offered a confidential summary assessment with waste characterization data as an incentive for participation.
Once an initial list of about 60 participating establishments was confirmed, Tetra Tech EBA reviewed representation across subsectors to target follow-up calls to business subsectors that were under-represented.
Calls were scheduled with recruited participants to gather key information about waste disposal and collection, hauling costs, and waste diversion practices.
Table 2: Sampling Distribution by Business Category and Location
Zone Accommodation & Food Services
Business Commercial
Services Manufacturing
Retail Trade
1 – Central/North (including Vancouver and North Shore) 15 15 10 11
2 – East (including Burnaby, Tri-Cities, Maple Ridge)
5 3 4 9
3 – South (including Richmond, Surrey, Delta) 5 7 9 5
Total 25 25 23 25
2.3 Sampling Events
Sampling and sorting occurred between November 10, 2014 and January 13, 2015. For approximately 90% of sampling events, waste was collected directly from the business and taken to VSTS for sorting.
Tetra Tech EBA staff collected samples from establishments either directly from their garbage bins, or if they stored garbage in compactors, then it was set aside by the business. Waste disposal data and diversion information collected by phone was verified on site and Metro Vancouver’s educational material about the upcoming Organics Disposal Ban was delivered. When possible, sample collection was done a day before normal garbage collection to ensure a full business cycle was captured.
In cases where compactor loads were tracked to VSTS, the Tetra Tech EBA site supervisor worked closely with the facility site supervisor and scale operator to coordinate identification and selection of the load samples.
Covered sorting areas were provided at all sorting locations to avoid the elements, especially moisture from precipitation that could compromise sample characterization.
Material streams were sorted in accordance with audit categories and the materials were weighed and recorded.
4
Metro Vancouver ICI Waste Characterization Program.docx

ICI WASTE CHARACTERIZATION PROGRAM FILE: 704-ENVSWM03362-01 | JUNE 2015 | ISSUED FOR USE
2.4 Sample Selection and Handling
Tetra Tech EBA staff coordinated with businesses, property managers, and haulers to collect and transport samples. Collection schedules were arranged with businesses ahead of time and then confirmed the day before collection. Random sample selection techniques were used to pull a sample from a portion of the bin or load. More specific sampling methodologies for different business (and property management) types are provided in Table 3 below.
Table 3: Sampling Method by Building Type and Bin Set-up
Scenario Transportation Sampling Method
Business with own (non-shared) front-load bin
Collected by Tetra Tech EBA staff
Front-load bin was envisaged as a grid with 8 sections – a section was pre-selected at random for sampling.
If the weight was insufficient, another section was selected until a 100 kg sample or all of the garbage was taken.
Business with shared front-load bin
Collected by Tetra Tech EBA staff
Participating businesses tagged garbage bags before placing in bins. Tagged bags were identified and removed from the bin using the grid methodology until a 100 kg sample or all of the tagged garbage bags were taken.
Office tower (multi-tenanted) managed by Property Managers
Collected by Tetra Tech EBA staff
One day’s garbage (a full business cycle) was collected and put aside by janitorial staff.
The grid method was used to select bags randomly until a 100 kg sample or all of the bags were taken.
Mall with multiple (shared) loading docks
Hauler delivered compactor load to VSTS
Compactor loads were delivered directly to VSTS. The grid methodology was used to select a section randomly. Bags were then removed from this section and weighed until a 100 kg sample was taken.
Collected by Tetra Tech EBA staff
Specific businesses (i.e., from one subsector) were asked set aside garbage for one day.
The grid method was used to select bags randomly until a 100 kg sample or all of the bags were taken.
The sample collection and sorting was overseen by a Tetra Tech EBA site supervisor and project management team, along with four waste sorters who were trained on safety and material sorting procedures prior to the field work. Personal protective equipment (PPE) was used by staff according to the specifications of Tetra Tech EBA’s Health and Safety Plan, which factored in special requirements for collecting samples directly from businesses and working at VSTS. Safety meetings were conducted daily to emphasize key concerns including how to handle material hazards such as sharp or hazardous materials, safe lifting of garbage bags, and working around vehicles.
After the sample was selected and delivered to the sorting area, the materials were sorted into bins. Sample weights for each material category were recorded and the tare weight of each bin was subtracted to determine the net sample weight. The 128 categories of solid waste were then sorted and weighed using a calibrated electronic scale and then disposed of at the VSTS. Photos were taken of each sample, including the sample number and date, to document samples. A full list of material categories can be found in Appendix C and select sample photographs in Appendix E.
5
Metro Vancouver ICI Waste Characterization Program.docx

ICI WASTE CHARACTERIZATION PROGRAM FILE: 704-ENVSWM03362-01 | JUNE 2015 | ISSUED FOR USE
2.5 Data Analysis
Data collection logs and scale tickets (if applicable) were reviewed daily to ensure accuracy, and then photographed and scanned. Data was compiled manually throughout the course of the field work and then quality assurance and control methods were employed for accuracy. The data template for recording sample weights can be found in Appendix D. The Tetra Tech EBA team analyzed the data to determine: 1) the weighted mean characterization on by primary material category, and 2) per-employee disposal rate for each business category and subsector.
As well as presenting the characterization by primary material, the data was also characterized according to diversion potential i.e. the primary streams that materials can be source separated into: recycling (conventional and other), compostable organics, and garbage (going to landfill or waste-to-energy). See Table 4 below for diversion potential category definitions. Qualitative data collected during phone interviews was also compiled and analyzed at the business category level to provide information about hauling costs and diversion practices.
Table 4: Material Categories Defined by Diversion Potential
Material Categories Defined by Diversion Potential
Recycling Recycling collection service. Includes “conventional” recycling items such as: cardboard, paper, mixed containers (glass, metal, plastic), rigid plastics (e.g., plastic utensils), foil wrap, beverage containers.
Compostable Organics Compostable organics collection service. Includes food scraps, food-soiled paper, napkins/ paper towels, yard debris.
Other Recycling
Collection programs and drop-off locations available by product. Includes donatable food, waste cooking oil, Styrofoam, soft plastics, scrap metal, and product stewardship items (e.g., electronics, batteries, appliances and tools, light bulbs, paints, solvents, pharmaceuticals).
Garbage Collection service to landfill or waste-to-energy. Materials not yet easily recyclable or compostable (i.e., wasted resources).
2.6 Business Assessment Sheet
Each participating business was provided with a Business Assessment Sheet that summarized the characterization of their sample and provided key tips and resources for improving waste diversion programs. As mentioned in the methodology, this was a key tool for incentivising businesses to participate. A template for the Business Assessment Sheet can be found in Appendix F.
6
Metro Vancouver ICI Waste Characterization Program.docx
ICI WASTE CHARACTERIZATION PROGRAM FILE: 704-ENVSWM03362-01 | JUNE 2015 | ISSUED FOR USE
3.0 RESULTS AND DISCUSSION This section describes the findings for each of the four business categories and their subsectors. Pie charts showing the characterization by primary material are presented in Section 3.1 below for category to category comparison. Section 3.2 dives deeper in individual category and subsector analysis. Each subheading provides a summary table with key metrics for the category and subsector, as well as pie charts comparing the characterization by primary material category, and the same data characterized by diversion potential (as defined in Table 4 above). Results tables provide a comparison of waste characterization by primary material for the different sub-sectors within each business category.
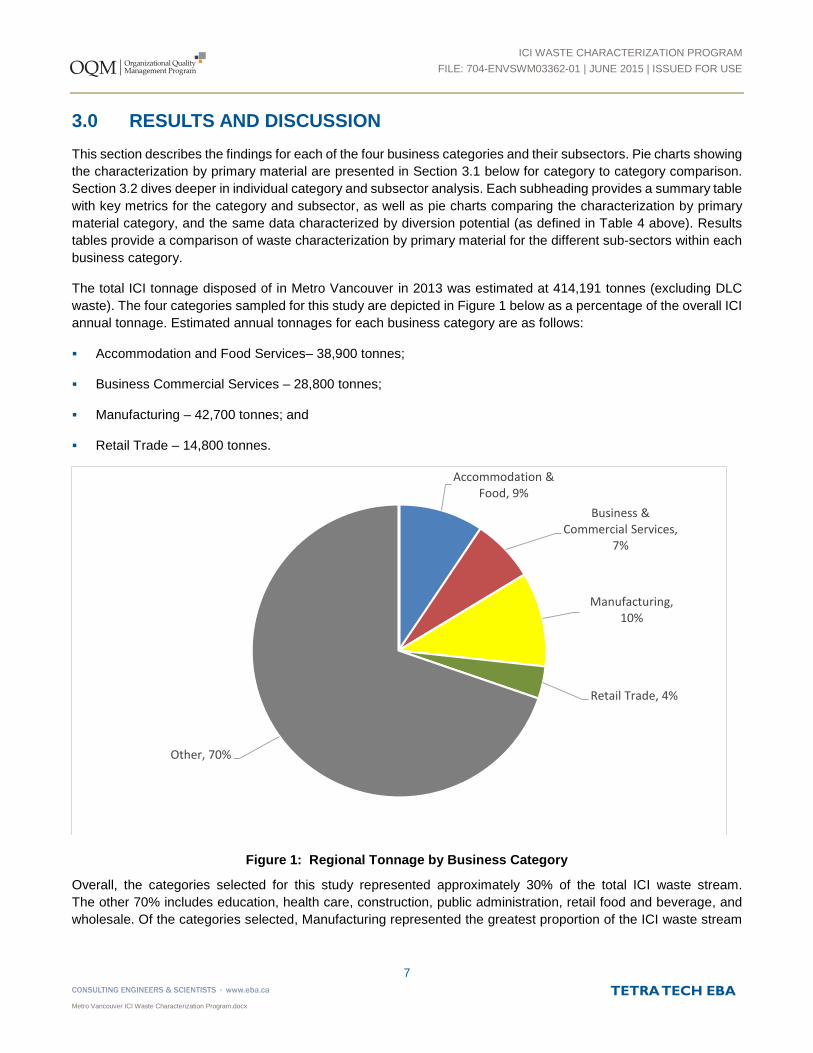
The total ICI tonnage disposed of in Metro Vancouver in 2013 was estimated at 414,191 tonnes (excluding DLC waste). The four categories sampled for this study are depicted in Figure 1 below as a percentage of the overall ICI annual tonnage. Estimated annual tonnages for each business category are as follows:
Accommodation and Food Services– 38,900 tonnes;
Business Commercial Services – 28,800 tonnes;
Manufacturing – 42,700 tonnes; and
Retail Trade – 14,800 tonnes.
Figure 1: Regional Tonnage by Business Category
Overall, the categories selected for this study represented approximately 30% of the total ICI waste stream. The other 70% includes education, health care, construction, public administration, retail food and beverage, and wholesale. Of the categories selected, Manufacturing represented the greatest proportion of the ICI waste stream
Accommodation & Food, 9%
Business & Commercial Services,
7%
Manufacturing, 10%
Retail Trade, 4%
Other, 70%
7
Metro Vancouver ICI Waste Characterization Program.docx

ICI WASTE CHARACTERIZATION PROGRAM FILE: 704-ENVSWM03362-01 | JUNE 2015 | ISSUED FOR USE
at 10%, and Retail Trade represented the least at 4%. However, several types of retail, most notably grocery stores, were not included in the scope of this study.
3.1 Overall Waste Characterization Results
The overall waste characterization results for the four business categories are presented in Figure 2 and Table 5 below.
Figure 2: Waste Characterization Comparison across Business Categories
As seen above, Manufacturing produced the most unsorted disposed waste and Retail Trade the least. Accommodation and Food produced the largest amount of organics (58%, 22,400 tonnes) despite having a smaller overall waste disposal rate (38,900 tonnes). Manufacturing produced the largest amount of plastics (18%, 7,800 tonnes); the proportion of plastics was comparably lower for the other business categories. Business Commercial Services produced the most paper (38%, 10,800 tonnes), followed by Manufacturing (25%, 10,700 tonnes). Retail Trade produced the least of the three major product categories, organics, plastics, and paper. In terms of smaller-tonnage product categories, Accommodation and Food produced a relatively large amount of glass and metals (2%, 750 tonnes each), and Manufacturing produced a noteworthy amount of non-compostable organics (treated or painted wood, textiles, rubber and other composite organic materials), household hazardous, and fines (4%, 3%, and 3% or 580, 180 and 72 tonnes, respectively).
0
5,000
10,000
15,000
20,000
25,000
30,000
35,000
40,000
45,000
Accommodation &Food
Business &Commercial Services
Manufacturing Retail Trade
Estim
ated
Ton
nage
Paper
Plastic
Compostable Organics
Non-Compostable Organics
Metals
Glass
Building Material
E-Waste
Household Hazardous
Household Hygiene
Bulky Objects
Fines
Other
8
Metro Vancouver ICI Waste Characterization Program.docx

ICI WASTE CHARACTERIZATION PROGRAM FILE: 704-ENVSWM03362-01 | JUNE 2015 | ISSUED FOR USE
Table 5: Waste Characterization of NAICS Categories by Primary Materials
Primary Category Combined Accommodation & Food Services
Business Services
Manufacturing Retail Trade
(N=98) (N=25) (N=25) (N=23) (N=25)
Estimated Annual Tonnage* 125,200 38,900 28,800 42,700 14,800
Estimated kg per Employee 300 500 100 1,000 200
Weighted Mean (%)
Paper 30.5% 22.6% 37.7% 25.1% 38.2%
Plastics 18.0% 12.7% 15.3% 18.3% 26.2%
Compostable Organics 40.3% 57.8% 36.7% 44.8% 21.0%
Non-Compostable Organics 2.2% 0.5% 1.1% 3.5% 3.9%
Metals 2.0% 1.9% 2.0% 1.5% 2.7%
Glass 1.6% 1.9% 1.9% 0.3% 2.1%
Building Material 1.2% 0.6% 1.3% 1.3% 1.8%
Electronic Waste 0.5% 0.2% 0.6% 0.1% 1.1%
Household Hazardous 1.1% 0.4% 0.5% 2.5% 1.2%
Household Hygiene 0.7% 1.2% 0.2% 0.2% 1.1%
Bulky Objects 0.2% 0.0% 0.6% 0.0% 0.1%
Fines 1.2% 0.2% 2.0% 2.4% 0.5%
*Data provided by participating companies then extrapolated to represent each industry category in the study. Kg per employee amounts were calculated from the estimated tonnages, and are comparable to other studies that have estimated kg per employee.
3.2 Results by Business Category and Subsector
The following subsections describe the four industry categories. Waste characterization results are presented and discussed at the NAICS category and subsector level. In addition to graphically presenting waste characterization results by primary material category, a second pie chart shows the waste characterized according to diversion potential, i.e., the primary streams that materials can be source separated into: recycling (conventional and other), compostable organics, and garbage (going to landfill or waste-to-energy). A description of these diversion potential categories can be found in Section 2.5, Table 4. In the diversion potential pie charts, the characterization looks slightly different since Other Paper (food soiled paper, napkins and tissue paper) is categorized as compostable. Paper, some metal, and some plastic are characterized as recyclable, while other non-recyclable plastics are characterized as garbage.
Qualitative data collected during phone interviews was also compiled and analyzed at the business category level to provide information about hauling costs and diversion practices. Key quantitative and qualitative data collected during phone surveys are also shown in summary tables.
9
Metro Vancouver ICI Waste Characterization Program.docx
ICI WASTE CHARACTERIZATION PROGRAM FILE: 704-ENVSWM03362-01 | JUNE 2015 | ISSUED FOR USE
There was a significant difference across categories with respect to interest in participating in the study. In general, property managers (both from office towers and shopping malls) were keen to join the study. They wanted better information on the performance of existing programs, particularly where organics collection was already in place, or good baseline data to support the implementation of new programs. In many cases, property managers were trying different program approaches in different buildings, and this study served as an opportunity to compare results. Businesses in the Accommodation and Food category were the most interested in participating in the study, acknowledging that they are large producers of organics and need to develop or improve programs ahead of the Organics Disposal Ban. Manufacturers were the hardest to recruit. Detailed reasons for participation or non-participation are outlined in category summary tables.
Out of the 98 samples sorted, 53% came from buildings with organics management programs already in place. Of the samples which came from buildings managed by property managers (malls and office towers combined), 58% had organics management programs in place.
3.2.1 Business Commercial Services
The majority of large offices in Metro Vancouver are in buildings taken care of by property managers. For this study, 20% of the samples in the Business Commercial Services category came from individual businesses that manage their own waste, and 80% from large offices that are managed by property management companies. Out of the Business Commercial Services samples collected, 72% already had organics management programs in place. Key summary information is listed below in Table 6, and waste characterization results are summarized in Table 7 and Figure 3.
Table 6: Key Summary Information Business Commercial Services
Data Type Results
Number of Samples 25
Estimated Annual Waste Disposal of Category* 28,800 tonnes per year
Waste Disposal Per Employee* 100 kg per year
Recycling Services Cardboard, paper, mixed containers, food scraps, yard debris, cooking oil, EPR materials (beverage containers, small appliances and power tools, batteries, paints, solvents, pesticides, used oil and antifreeze, tires, CFLs, major appliances and outdoor power equipment)
Reasons for Participation in the Study See if current system is being used properly by employees Identify gaps in their current system Baseline data to develop or improve program Potential for cost savings
Reasons for Non-Participation in the Study
Already tracking waste adequately Part of a larger corporation that approves sustainability approach Waste managed by a property manager – do not have control over
system
*Average calculated from businesses sampled in this category.
10
Metro Vancouver ICI Waste Characterization Program.docx
ICI WASTE CHARACTERIZATION PROGRAM FILE: 704-ENVSWM03362-01 | JUNE 2015 | ISSUED FOR USE
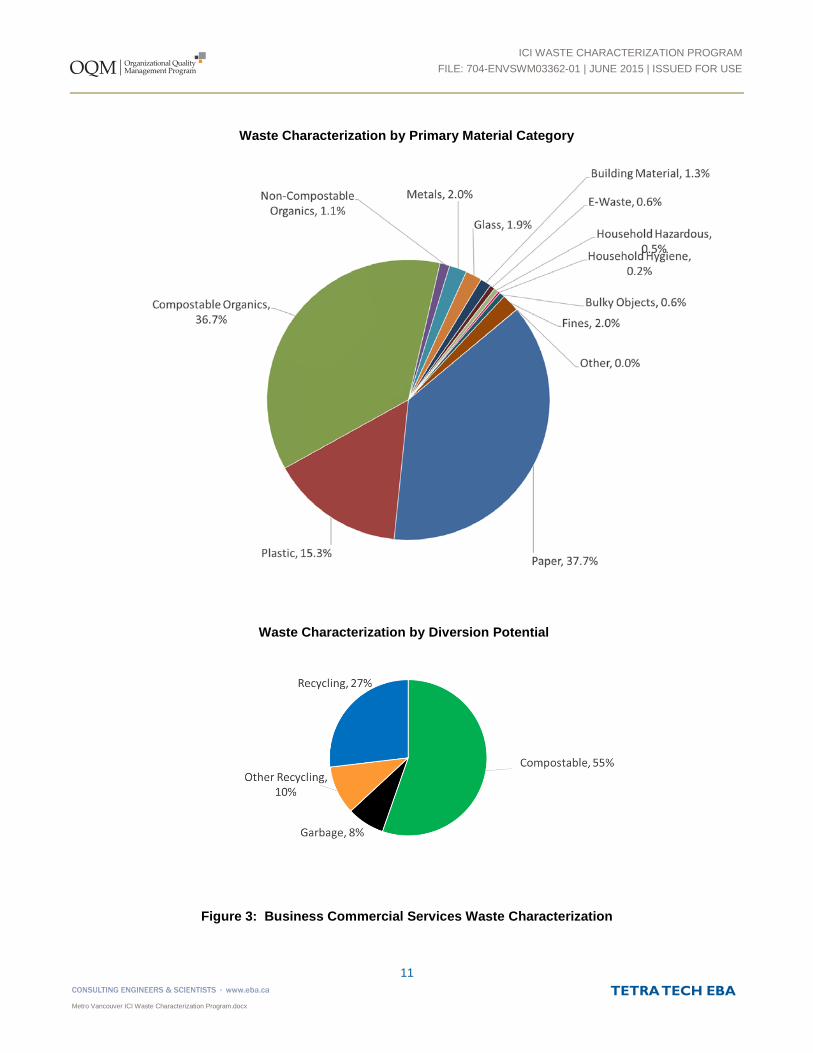
Figure 3: Business Commercial Services Waste Characterization
Waste Characterization by Diversion Potential
Waste Characterization by Primary Material Category
11
Metro Vancouver ICI Waste Characterization Program.docx

ICI WASTE CHARACTERIZATION PROGRAM FILE: 704-ENVSWM03362-01 | JUNE 2015 | ISSUED FOR USE
The Waste Characterization by Primary Material Category pie chart, shows that waste disposed from the Business Commercial Services category is estimated to be primarily composed of paper (38%) and Compostable Organics (37%). The majority of paper disposed was considered Other Paper (food-soiled paper, napkins, and tissue paper). Compostable Organics was primarily composed of single serving take-out food. Plastic was the next highest contributor (15%). All types of plastic were represented with the largest contributor being consumables packaging, primarily over-wrap and packaging from office supplies and take-out food. The next highest contributors were metals, fines, and glass, each of which represented roughly 2% of the waste stream.
The Waste Characterization by Diversion Potential pie chart, shows that overall, 92% of the waste disposed could potentially have been diverted. Of that, 55% was considered compostable (i.e. Compostable Organics plus Other Paper from the material category pie), 27% conventional recycling, and 10% other recycling.
Table 7: Waste Characterization for Business Commercial Services
Category/Subsector Business Commercial Services
Number of Samples (N=25)
kg per Employee 100
Primary Category Weighted Mean (%)
Paper 37.7%
Plastics 15.3%
Compostable Organics 36.7%
Non-Compostable Organics 1.1%
Metals 2.0%
Glass 1.9%
Building Material 1.3%
Electronic Waste 0.6%
Household Hazardous 0.5%
Household Hygiene 0.2%
Bulky Objects 0.6%
Fines 2.0%
3.2.2 Retail Trade
For the purposes of this study, Retail Trade has been divided in to the following subsectors: Malls, Clothing & Sports, and Other (e.g., hardware, pharmacy, electronics, etc.). The Clothing & Sports and Other subsectors only refer to samples taken from individual retail stores, outside of larger shopping malls. The majority of samples collected (60%) were from malls, which represent a range of retail businesses types, but also may include waste from shoppers, primarily food, and beverage. Of the retail samples included in the study, 56% came from stores or malls which had an organics management program already in place.
12
Metro Vancouver ICI Waste Characterization Program.docx
ICI WASTE CHARACTERIZATION PROGRAM FILE: 704-ENVSWM03362-01 | JUNE 2015 | ISSUED FOR USE
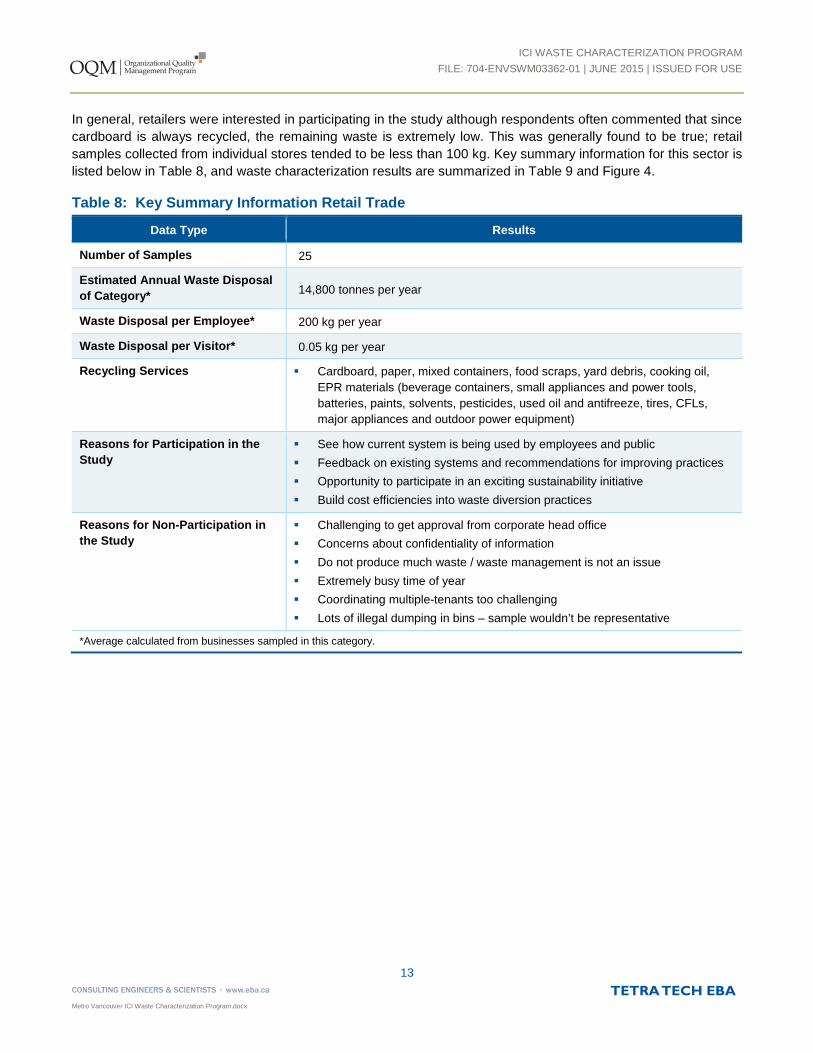
In general, retailers were interested in participating in the study although respondents often commented that since cardboard is always recycled, the remaining waste is extremely low. This was generally found to be true; retail samples collected from individual stores tended to be less than 100 kg. Key summary information for this sector is listed below in Table 8, and waste characterization results are summarized in Table 9 and Figure 4.
Table 8: Key Summary Information Retail Trade
Data Type Results
Number of Samples 25
Estimated Annual Waste Disposal of Category* 14,800 tonnes per year
Waste Disposal per Employee* 200 kg per year
Waste Disposal per Visitor* 0.05 kg per year
Recycling Services Cardboard, paper, mixed containers, food scraps, yard debris, cooking oil, EPR materials (beverage containers, small appliances and power tools, batteries, paints, solvents, pesticides, used oil and antifreeze, tires, CFLs, major appliances and outdoor power equipment)
Reasons for Participation in the Study
See how current system is being used by employees and public Feedback on existing systems and recommendations for improving practices Opportunity to participate in an exciting sustainability initiative Build cost efficiencies into waste diversion practices
Reasons for Non-Participation in the Study
Challenging to get approval from corporate head office Concerns about confidentiality of information Do not produce much waste / waste management is not an issue Extremely busy time of year Coordinating multiple-tenants too challenging Lots of illegal dumping in bins – sample wouldn’t be representative
*Average calculated from businesses sampled in this category.
13
Metro Vancouver ICI Waste Characterization Program.docx

ICI WASTE CHARACTERIZATION PROGRAM FILE: 704-ENVSWM03362-01 | JUNE 2015 | ISSUED FOR USE
Figure 4: Retail Trade Waste Characterization
Material Stream Composition
Waste Characterization by Primary Material Category
Waste Characterization by Diversion Potential
14
Metro Vancouver ICI Waste Characterization Program.docx
ICI WASTE CHARACTERIZATION PROGRAM FILE: 704-ENVSWM03362-01 | JUNE 2015 | ISSUED FOR USE
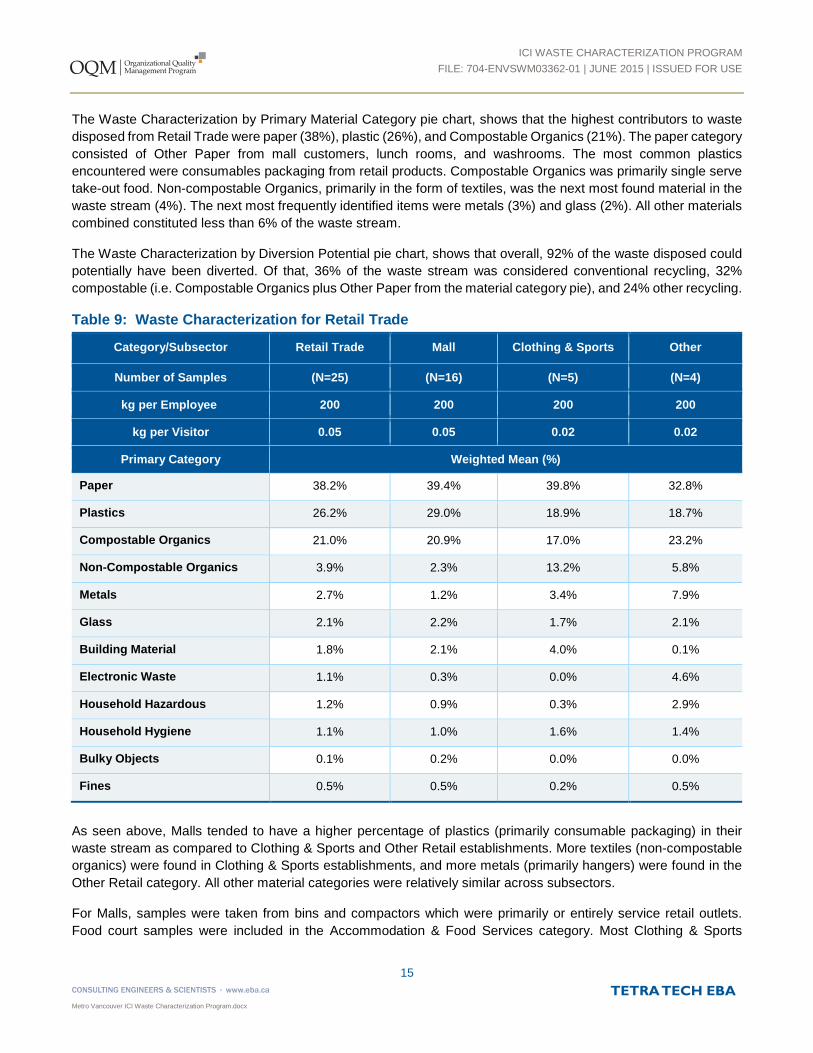
The Waste Characterization by Primary Material Category pie chart, shows that the highest contributors to waste disposed from Retail Trade were paper (38%), plastic (26%), and Compostable Organics (21%). The paper category consisted of Other Paper from mall customers, lunch rooms, and washrooms. The most common plastics encountered were consumables packaging from retail products. Compostable Organics was primarily single serve take-out food. Non-compostable Organics, primarily in the form of textiles, was the next most found material in the waste stream (4%). The next most frequently identified items were metals (3%) and glass (2%). All other materials combined constituted less than 6% of the waste stream.
The Waste Characterization by Diversion Potential pie chart, shows that overall, 92% of the waste disposed could potentially have been diverted. Of that, 36% of the waste stream was considered conventional recycling, 32% compostable (i.e. Compostable Organics plus Other Paper from the material category pie), and 24% other recycling.
Table 9: Waste Characterization for Retail Trade
Category/Subsector Retail Trade Mall Clothing & Sports Other
Number of Samples (N=25) (N=16) (N=5) (N=4)
kg per Employee 200 200 200 200
kg per Visitor 0.05 0.05 0.02 0.02
Primary Category Weighted Mean (%)
Paper 38.2% 39.4% 39.8% 32.8%
Plastics 26.2% 29.0% 18.9% 18.7%
Compostable Organics 21.0% 20.9% 17.0% 23.2%
Non-Compostable Organics 3.9% 2.3% 13.2% 5.8%
Metals 2.7% 1.2% 3.4% 7.9%
Glass 2.1% 2.2% 1.7% 2.1%
Building Material 1.8% 2.1% 4.0% 0.1%
Electronic Waste 1.1% 0.3% 0.0% 4.6%
Household Hazardous 1.2% 0.9% 0.3% 2.9%
Household Hygiene 1.1% 1.0% 1.6% 1.4%
Bulky Objects 0.1% 0.2% 0.0% 0.0%
Fines 0.5% 0.5% 0.2% 0.5%
As seen above, Malls tended to have a higher percentage of plastics (primarily consumable packaging) in their waste stream as compared to Clothing & Sports and Other Retail establishments. More textiles (non-compostable organics) were found in Clothing & Sports establishments, and more metals (primarily hangers) were found in the Other Retail category. All other material categories were relatively similar across subsectors.
For Malls, samples were taken from bins and compactors which were primarily or entirely service retail outlets. Food court samples were included in the Accommodation & Food Services category. Most Clothing & Sports
15
Metro Vancouver ICI Waste Characterization Program.docx
ICI WASTE CHARACTERIZATION PROGRAM FILE: 704-ENVSWM03362-01 | JUNE 2015 | ISSUED FOR USE
samples were taken directly from bins outside retail establishments. Four samples came from Other retail establishments, which includes all retail categories not classified as malls or Clothing & Sports.
3.2.3 Accommodation & Food Services
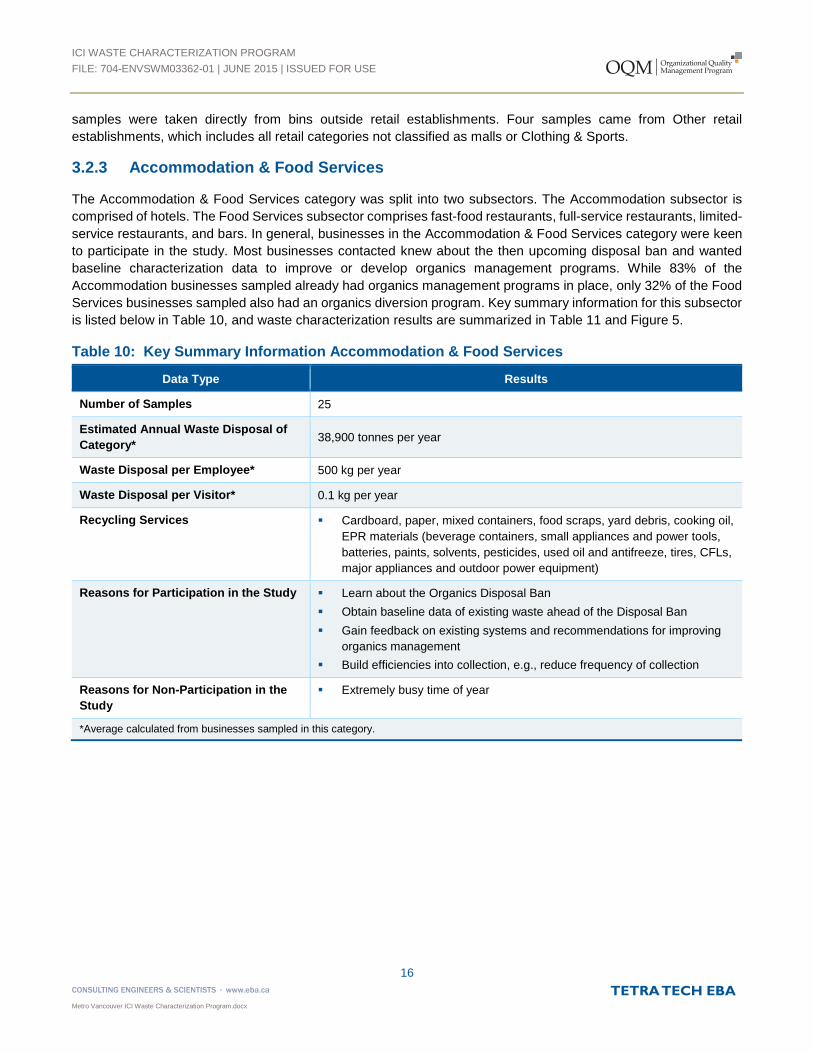
The Accommodation & Food Services category was split into two subsectors. The Accommodation subsector is comprised of hotels. The Food Services subsector comprises fast-food restaurants, full-service restaurants, limited-service restaurants, and bars. In general, businesses in the Accommodation & Food Services category were keen to participate in the study. Most businesses contacted knew about the then upcoming disposal ban and wanted baseline characterization data to improve or develop organics management programs. While 83% of the Accommodation businesses sampled already had organics management programs in place, only 32% of the Food Services businesses sampled also had an organics diversion program. Key summary information for this subsector is listed below in Table 10, and waste characterization results are summarized in Table 11 and Figure 5.
Table 10: Key Summary Information Accommodation & Food Services
Data Type Results
Number of Samples 25
Estimated Annual Waste Disposal of Category* 38,900 tonnes per year
Waste Disposal per Employee* 500 kg per year
Waste Disposal per Visitor* 0.1 kg per year
Recycling Services Cardboard, paper, mixed containers, food scraps, yard debris, cooking oil, EPR materials (beverage containers, small appliances and power tools, batteries, paints, solvents, pesticides, used oil and antifreeze, tires, CFLs, major appliances and outdoor power equipment)
Reasons for Participation in the Study Learn about the Organics Disposal Ban Obtain baseline data of existing waste ahead of the Disposal Ban Gain feedback on existing systems and recommendations for improving
organics management Build efficiencies into collection, e.g., reduce frequency of collection
Reasons for Non-Participation in the Study
Extremely busy time of year
*Average calculated from businesses sampled in this category.
16
Metro Vancouver ICI Waste Characterization Program.docx

ICI WASTE CHARACTERIZATION PROGRAM FILE: 704-ENVSWM03362-01 | JUNE 2015 | ISSUED FOR USE
Figure 5: Accommodation and Food Services Waste Characterization
Waste Characterization by Diversion Potential
Waste Characterization by Primary Material Category
17
Metro Vancouver ICI Waste Characterization Program.docx

ICI WASTE CHARACTERIZATION PROGRAM FILE: 704-ENVSWM03362-01 | JUNE 2015 | ISSUED FOR USE
The Waste Characterization by Primary Material Category pie chart, shows that the majority of the Accommodation & Food Services waste stream was composed of Compostable Organics (58%). Compostable Organics were primarily post-consumer materials, such as uneaten restaurant meals. Paper (23%, mostly Other Paper) and Plastic (13%, mostly food packaging) were the next highest contributors, followed by metal (2%), glass (2%), and household hygiene (1%). The other categories combined constituted only 7%.
The Waste Characterization by Diversion Potential pie chart, shows that overall, 96% of the waste disposed could potentially have been diverted. Of that, 71% of the waste stream was considered compostable (i.e. Compostable Organics plus Other Paper from the material category pie), 17% was conventional recycling, and 9% other recycling.
Table 11: Waste Characterization for Accommodation and Food Services
Accommodation & Food Services Accommodation Food Services
Number of Samples (N=25) (N=6) (N=19)
kg per Employee 500 1,000 500
kg per Visitor 0.1 0.4 0.1
Primary Category Weighted Mean (%)
Paper 22.6% 25.1% 22.0%
Plastics 12.7% 13.8% 12.5%
Compostable Organics 57.8% 45.2% 60.6%
Non-Compostable Organics 0.5% 0.5% 0.5%
Metals 1.9% 2.6% 1.8%
Glass 1.9% 6.6% 0.9%
Building Material 0.6% 1.1% 0.5%
Electronic Waste 0.2% 0.6% 0.2%
Household Hazardous 0.4% 1.8% 0.1%
Household Hygiene 1.2% 2.2% 1.0%
Bulky Objects 0.0% 0.0% 0.0%
Fines 0.2% 0.4% 0.1%
As expected, food services establishments had a higher proportion of Compostable Organics in the existing waste stream as compared to accommodation establishments (61% versus 45%), however the type of Compostable Organics (post-consumer food) were similar. Types of paper and plastics found were similar, however higher proportions of single serving cups and lower percentages of office paper were found in the food service subcategory. Accommodation had more than six times as much glass per sample, likely due to hotel-provided glassware and damaged guest room fixtures. All other categories were relatively similar across both subsectors combined.
Six Accommodation samples were obtained from hotels. The overall waste disposal rate per employee was relatively high for Accommodation when compared to Food Services, likely due to the small number of employees
18
Metro Vancouver ICI Waste Characterization Program.docx
ICI WASTE CHARACTERIZATION PROGRAM FILE: 704-ENVSWM03362-01 | JUNE 2015 | ISSUED FOR USE
required to operate a large hotel. Nineteen food service establishments were sampled, including food courts, restaurants, and cafes. The waste disposal rate per employee in Food Service was relatively high when compared to Business Commercial Services and Retail Trade, however, it was only half that of Accommodation.
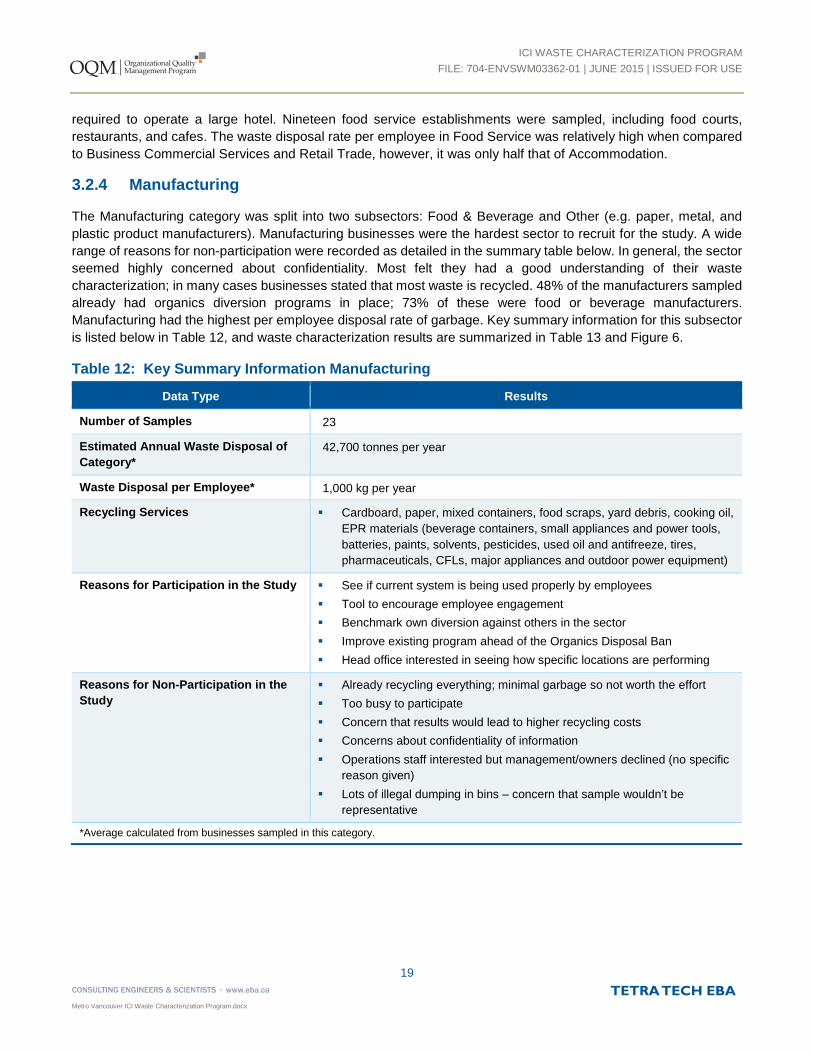
3.2.4 Manufacturing
The Manufacturing category was split into two subsectors: Food & Beverage and Other (e.g. paper, metal, and plastic product manufacturers). Manufacturing businesses were the hardest sector to recruit for the study. A wide range of reasons for non-participation were recorded as detailed in the summary table below. In general, the sector seemed highly concerned about confidentiality. Most felt they had a good understanding of their waste characterization; in many cases businesses stated that most waste is recycled. 48% of the manufacturers sampled already had organics diversion programs in place; 73% of these were food or beverage manufacturers. Manufacturing had the highest per employee disposal rate of garbage. Key summary information for this subsector is listed below in Table 12, and waste characterization results are summarized in Table 13 and Figure 6.
Table 12: Key Summary Information Manufacturing
Data Type Results
Number of Samples 23
Estimated Annual Waste Disposal of Category*
42,700 tonnes per year
Waste Disposal per Employee* 1,000 kg per year
Recycling Services Cardboard, paper, mixed containers, food scraps, yard debris, cooking oil, EPR materials (beverage containers, small appliances and power tools, batteries, paints, solvents, pesticides, used oil and antifreeze, tires, pharmaceuticals, CFLs, major appliances and outdoor power equipment)
Reasons for Participation in the Study See if current system is being used properly by employees Tool to encourage employee engagement Benchmark own diversion against others in the sector Improve existing program ahead of the Organics Disposal Ban Head office interested in seeing how specific locations are performing
Reasons for Non-Participation in the Study
Already recycling everything; minimal garbage so not worth the effort Too busy to participate Concern that results would lead to higher recycling costs Concerns about confidentiality of information Operations staff interested but management/owners declined (no specific
reason given) Lots of illegal dumping in bins – concern that sample wouldn’t be
representative
*Average calculated from businesses sampled in this category.
19
Metro Vancouver ICI Waste Characterization Program.docx

ICI WASTE CHARACTERIZATION PROGRAM FILE: 704-ENVSWM03362-01 | JUNE 2015 | ISSUED FOR USE
Figure 6: Manufacturing Waste Characterization
The Waste Characterization by Primary Material Category pie chart shows that Compostable Organics represented the highest proportion of the manufacturing category waste stream at 45%. Compared to other business categories, a much higher percentage (8%) of donatable food waste was found. Paper and plastics (25% and 18%, respectively) were the next highest contributors. Paper was mostly Other Paper and receipt or sticker paper. Plastics were mostly
Waste Characterization by Diversion Potential
Waste Characterization by Primary Material Category
20
Metro Vancouver ICI Waste Characterization Program.docx

ICI WASTE CHARACTERIZATION PROGRAM FILE: 704-ENVSWM03362-01 | JUNE 2015 | ISSUED FOR USE
packaging materials. Non-compostable Organics (4%), household hazardous materials (3%), and fines (2%) were the next most frequently found items. All other materials constituted less than 4% of the waste stream.
The Waste Characterization by Diversion Potential pie chart, shows that overall, 93% of the waste disposed could potentially have been diverted. Of that, 60% of the waste stream was considered compostable (i.e. Compostable Organics plus Other Paper from the material category pie), 19% was other recycling, and 14% conventional recycling.
Table 13: Waste Characterization for Manufacturing
Category/Subsector Combined Manufacturing Food and Beverage Other
Number of Samples (N=23) (N=15) (N=8)
kg per Employee 1,000 2,000 400
Primary Category Weighted Mean (%)
Paper 25.1% 24.2% 26.5%
Plastics 18.3% 16.7% 20.7%
Compostable Organics 44.8% 54.5% 30.6%
Non-Compostable Organics 3.5% 1.3% 6.5%
Metals 1.5% 1.1% 1.9%
Glass 0.3% 0.2% 0.4%
Building Material 1.3% 1.7% 0.8%
Electronic Waste 0.1% 0.0% 0.3%
Household Hazardous 2.5% 0.1% 6.0%
Household Hygiene 0.2% 0.1% 0.4%
Bulky Objects 0.0% 0.0% 0.0%
Fines 2.4% 0.1% 5.7%
As expected, Food & Beverage manufacturers produced a higher proportion of compostable organics than Other Manufacturers, most notably donatable food items as opposed to post-consumer food scraps. Other manufacturers produced a higher proportion of non-compostable organics such as treated wood and textiles. Other manufacturers also produced a high proportion of fines (small difficult to sort particles) compared to other ICI categories. Most other material types had relatively similar secondary material category characterization within manufacturing subsectors.
Fifteen of the 23 manufacturing samples were obtained from Food & Beverage manufacturers. Details are provided in the table below. Food & Beverage manufacturers showed the highest waste disposal rate per employee of all subsectors, approximately six times higher than all other manufacturers. Eight of the 23 manufacturing samples were collected from non-food and non-beverage manufacturers, which belong to the other Manufacturing category. Food & Beverage manufacturers produced more waste per employee than all other NAICS categories and subsectors (2,000 kg per employee), followed by Other Manufacturers and Accommodation (1,000 kg per employee).
21
Metro Vancouver ICI Waste Characterization Program.docx

ICI WASTE CHARACTERIZATION PROGRAM FILE: 704-ENVSWM03362-01 | JUNE 2015 | ISSUED FOR USE
4.0 CLOSURE We trust this report meets your present requirements. If you have any questions or comments, please contact the undersigned.
Respectfully submitted, Tetra Tech EBA Inc. Prepared by: Prepared by: Jessica Frank, MSc. Belinda Li, E.I.T. Project Manager – Waste Management Project Engineer – Waste Management Environment Practice Environment Practice Direct Line: 778.945.5776 Direct Line: 604.608.8905 [email protected] [email protected] Prepared by: Reviewed by: Terry Fulton, E.I.T. Tamara Shulman, BA, MSc. Candidate Environmental Engineer – Waste Management Environmental Planner – Waste Management Environment Practice Environment Practice Direct Line: 604.608.8638 Direct Line: 604.608.8636 [email protected] [email protected] /sy
22
Metro Vancouver ICI Waste Characterization Program.docx

ICI WASTE CHARACTERIZATION PROGRAM FILE: 704-ENVSWM03362-01 | JUNE 2015 | ISSUED FOR USE
TABLES
Table A Complete Waste Characterization Results
Metro Vancouver ICI Waste Characterization Program.docx
ICI WASTE CHARACTERIZATION PROGRAM FILE: 704-ENVSWM03362-01 | JUNE 2015 | ISSUED FOR USE
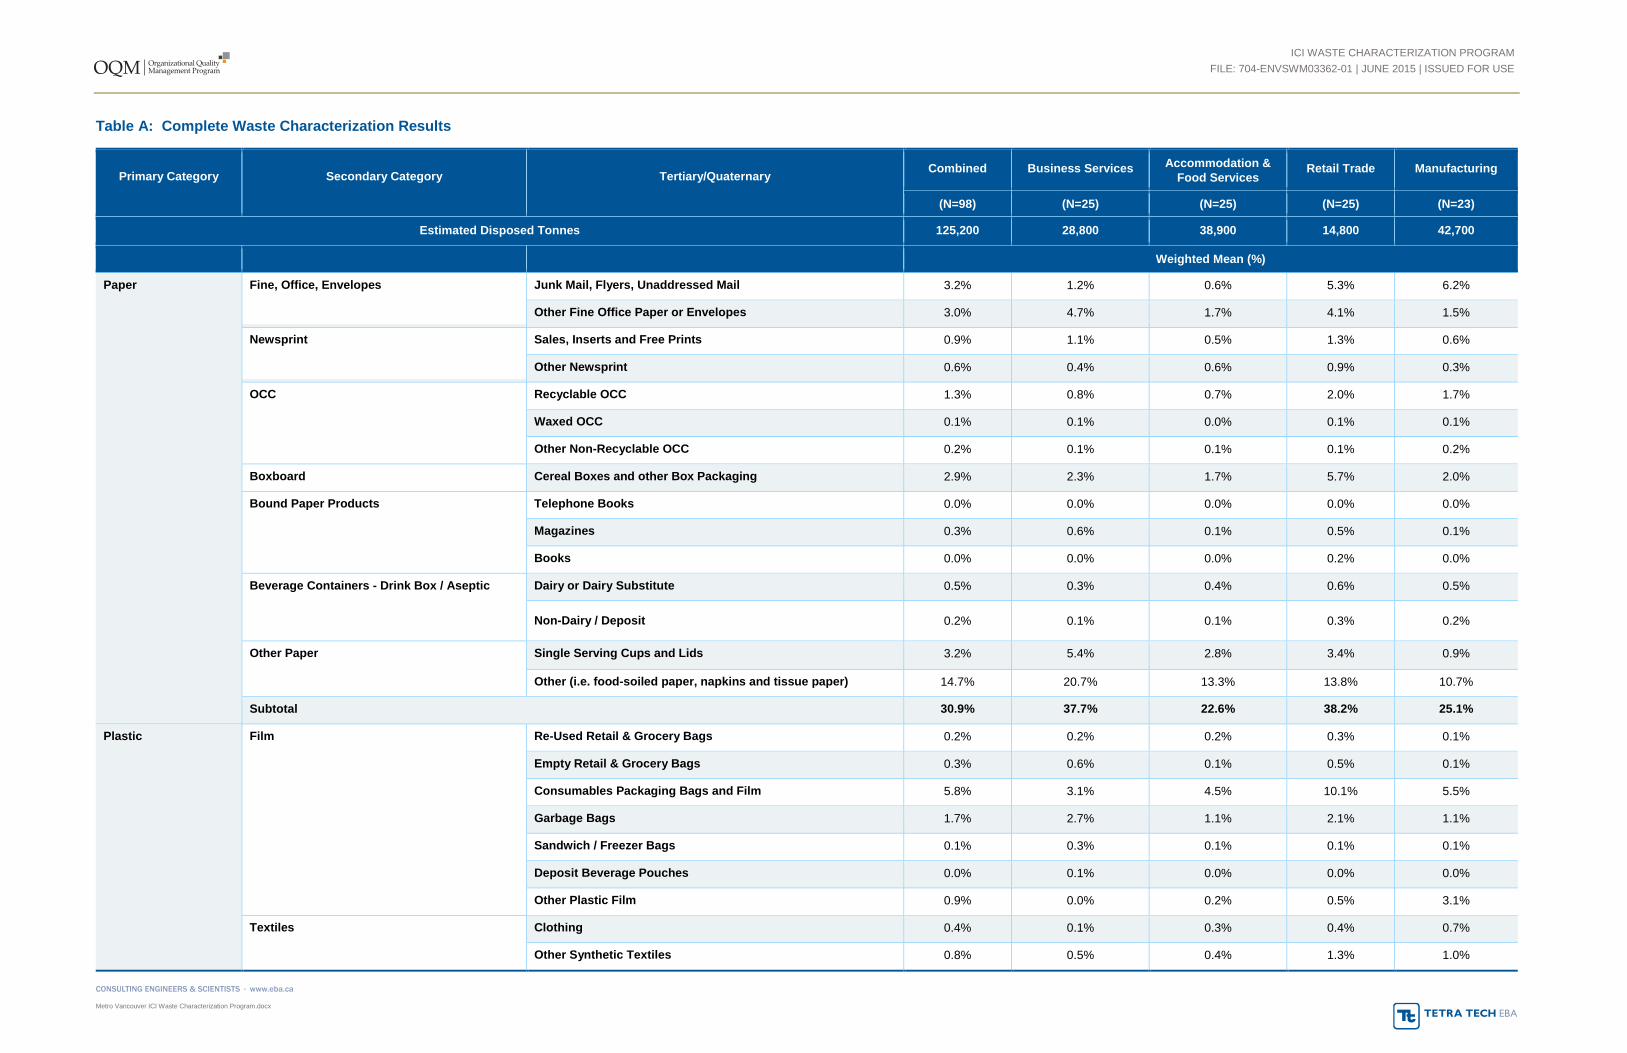
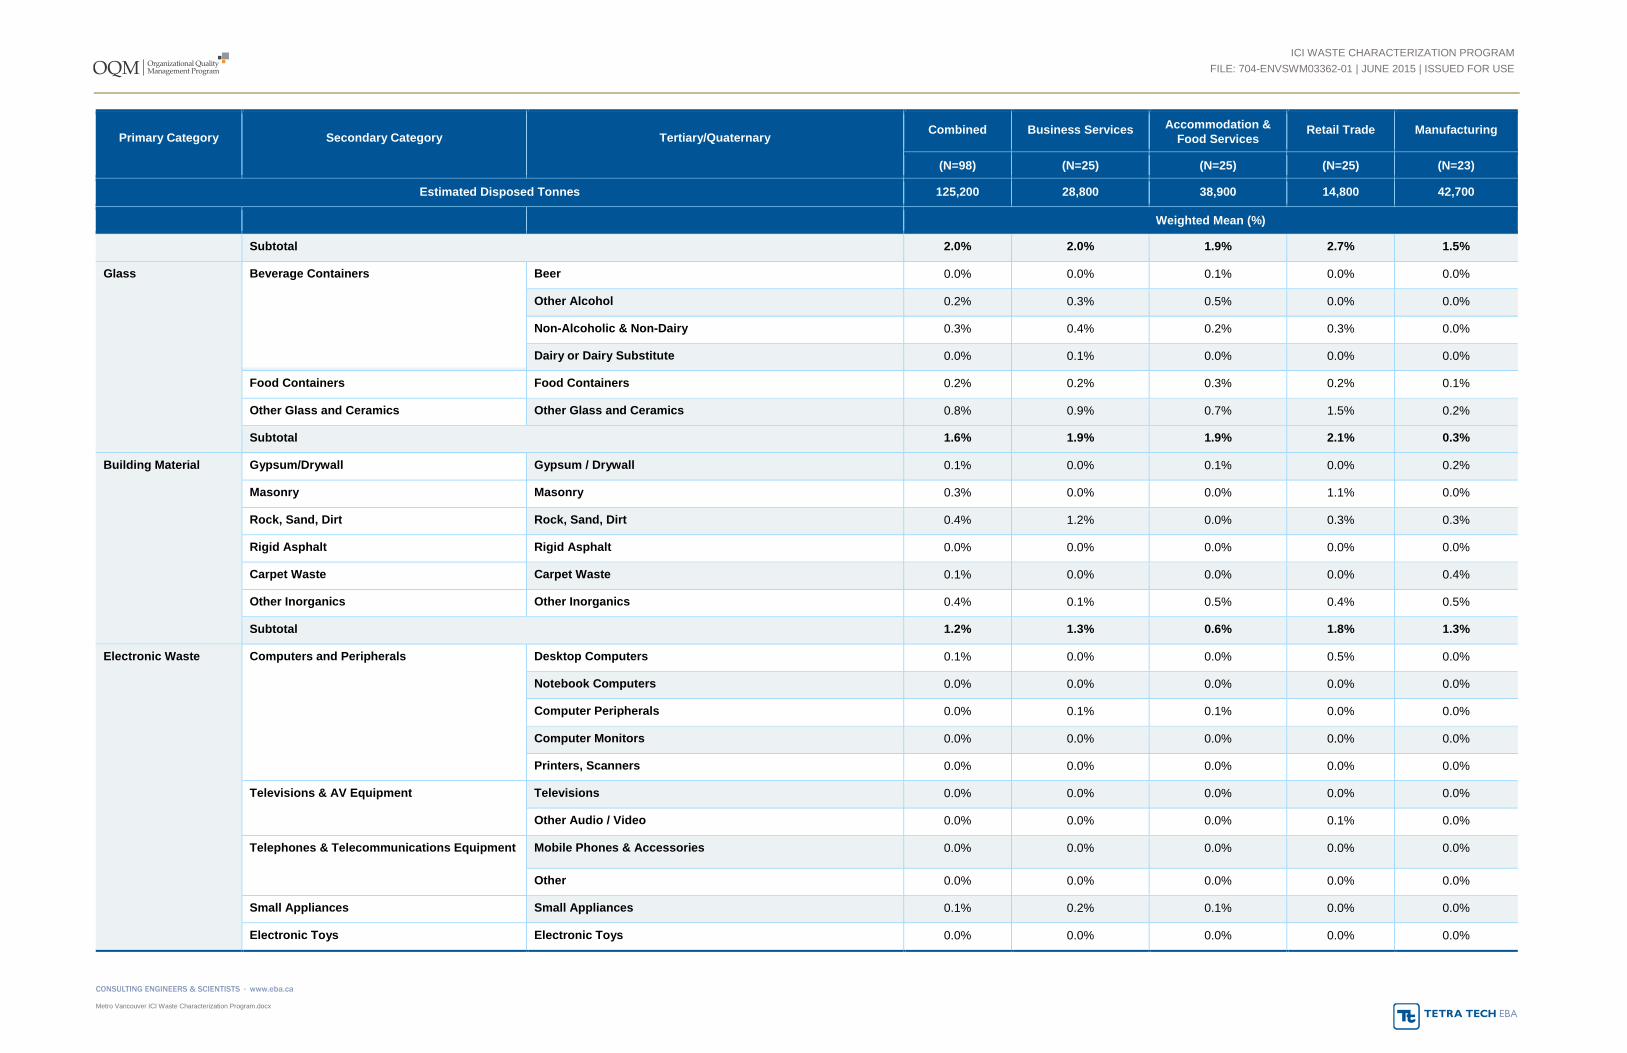
Table A: Complete Waste Characterization Results
Primary Category Secondary Category Tertiary/Quaternary Combined Business Services Accommodation & Food Services
Retail Trade Manufacturing
(N=98) (N=25) (N=25) (N=25) (N=23)
Estimated Disposed Tonnes 125,200 28,800 38,900 14,800 42,700
Weighted Mean (%)
Paper Fine, Office, Envelopes Junk Mail, Flyers, Unaddressed Mail 3.2% 1.2% 0.6% 5.3% 6.2%
Other Fine Office Paper or Envelopes 3.0% 4.7% 1.7% 4.1% 1.5%
Newsprint Sales, Inserts and Free Prints 0.9% 1.1% 0.5% 1.3% 0.6%
Other Newsprint 0.6% 0.4% 0.6% 0.9% 0.3%
OCC Recyclable OCC 1.3% 0.8% 0.7% 2.0% 1.7%
Waxed OCC 0.1% 0.1% 0.0% 0.1% 0.1%
Other Non-Recyclable OCC 0.2% 0.1% 0.1% 0.1% 0.2%
Boxboard Cereal Boxes and other Box Packaging 2.9% 2.3% 1.7% 5.7% 2.0%
Bound Paper Products Telephone Books 0.0% 0.0% 0.0% 0.0% 0.0%
Magazines 0.3% 0.6% 0.1% 0.5% 0.1%
Books 0.0% 0.0% 0.0% 0.2% 0.0%
Beverage Containers - Drink Box / Aseptic Dairy or Dairy Substitute 0.5% 0.3% 0.4% 0.6% 0.5%
Non-Dairy / Deposit 0.2% 0.1% 0.1% 0.3% 0.2%
Other Paper Single Serving Cups and Lids 3.2% 5.4% 2.8% 3.4% 0.9%
Other (i.e. food-soiled paper, napkins and tissue paper) 14.7% 20.7% 13.3% 13.8% 10.7%
Subtotal 30.9% 37.7% 22.6% 38.2% 25.1%
Plastic Film Re-Used Retail & Grocery Bags 0.2% 0.2% 0.2% 0.3% 0.1%
Empty Retail & Grocery Bags 0.3% 0.6% 0.1% 0.5% 0.1%
Consumables Packaging Bags and Film 5.8% 3.1% 4.5% 10.1% 5.5%
Garbage Bags 1.7% 2.7% 1.1% 2.1% 1.1%
Sandwich / Freezer Bags 0.1% 0.3% 0.1% 0.1% 0.1%
Deposit Beverage Pouches 0.0% 0.1% 0.0% 0.0% 0.0%
Other Plastic Film 0.9% 0.0% 0.2% 0.5% 3.1%
Textiles Clothing 0.4% 0.1% 0.3% 0.4% 0.7%
Other Synthetic Textiles 0.8% 0.5% 0.4% 1.3% 1.0%
Metro Vancouver ICI Waste Characterization Program.docx
ICI WASTE CHARACTERIZATION PROGRAM FILE: 704-ENVSWM03362-01 | JUNE 2015 | ISSUED FOR USE
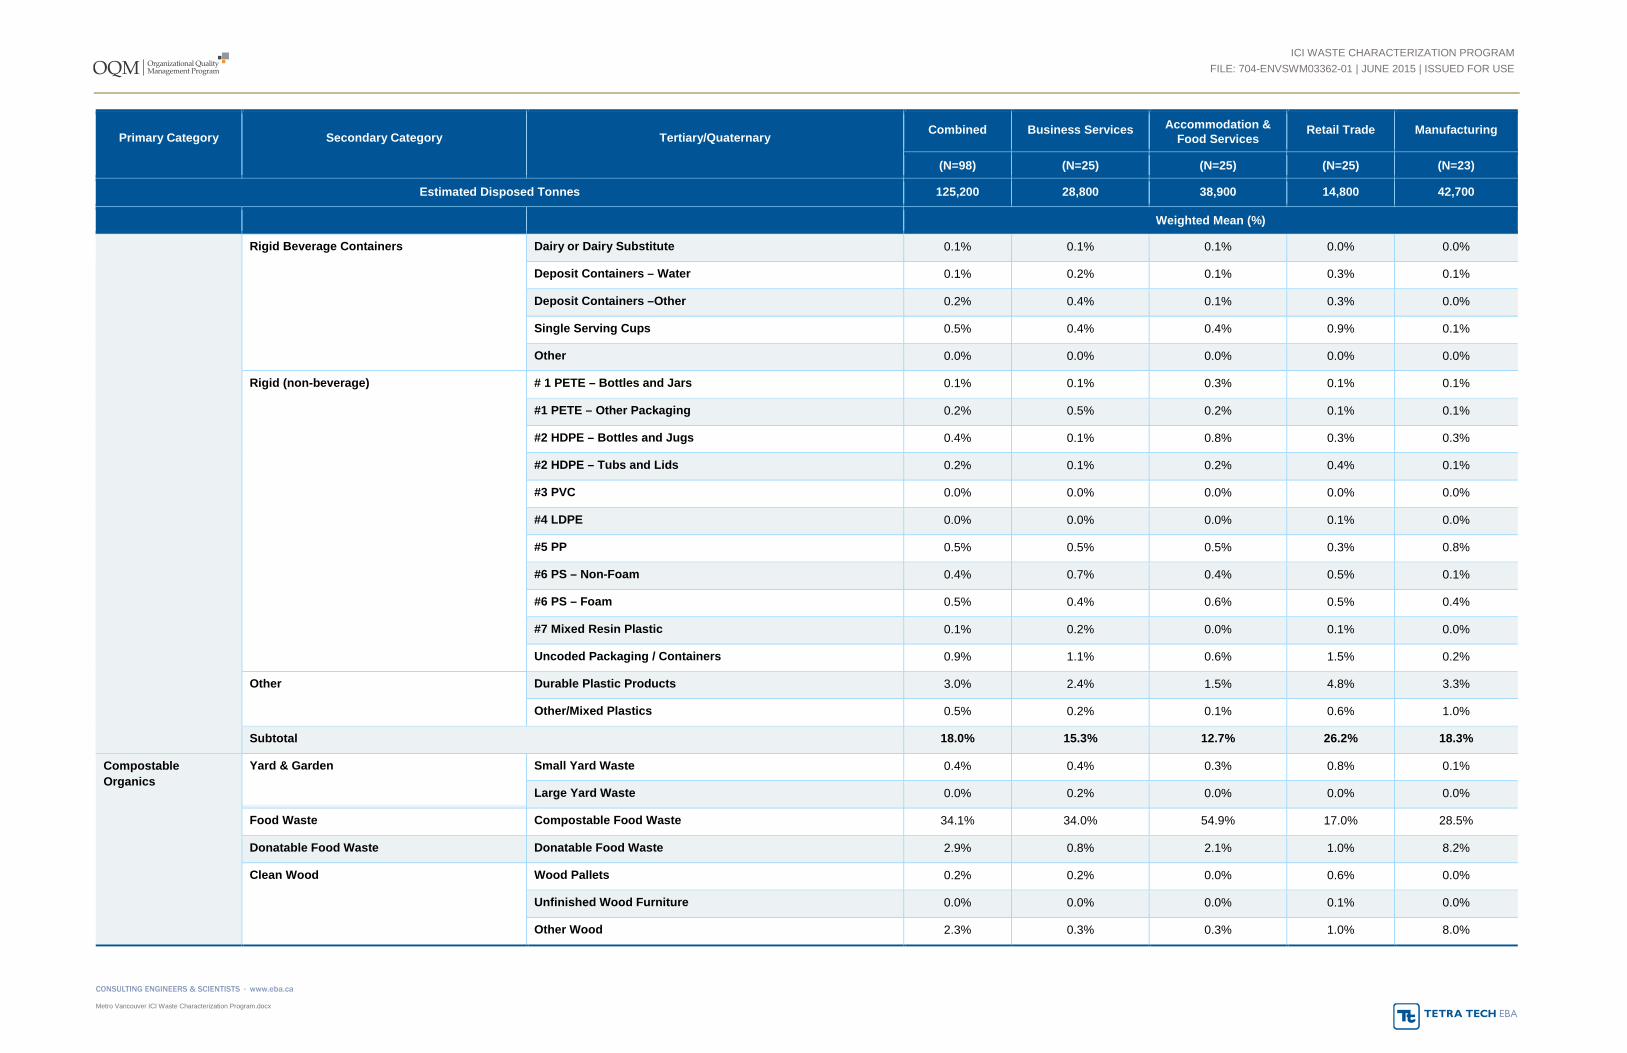
Primary Category Secondary Category Tertiary/Quaternary Combined Business Services Accommodation & Food Services
Retail Trade Manufacturing
(N=98) (N=25) (N=25) (N=25) (N=23)
Estimated Disposed Tonnes 125,200 28,800 38,900 14,800 42,700
Weighted Mean (%)
Rigid Beverage Containers Dairy or Dairy Substitute 0.1% 0.1% 0.1% 0.0% 0.0%
Deposit Containers – Water 0.1% 0.2% 0.1% 0.3% 0.1%
Deposit Containers –Other 0.2% 0.4% 0.1% 0.3% 0.0%
Single Serving Cups 0.5% 0.4% 0.4% 0.9% 0.1%
Other 0.0% 0.0% 0.0% 0.0% 0.0%
Rigid (non-beverage) # 1 PETE – Bottles and Jars 0.1% 0.1% 0.3% 0.1% 0.1%
#1 PETE – Other Packaging 0.2% 0.5% 0.2% 0.1% 0.1%
#2 HDPE – Bottles and Jugs 0.4% 0.1% 0.8% 0.3% 0.3%
#2 HDPE – Tubs and Lids 0.2% 0.1% 0.2% 0.4% 0.1%
#3 PVC 0.0% 0.0% 0.0% 0.0% 0.0%
#4 LDPE 0.0% 0.0% 0.0% 0.1% 0.0%
#5 PP 0.5% 0.5% 0.5% 0.3% 0.8%
#6 PS – Non-Foam 0.4% 0.7% 0.4% 0.5% 0.1%
#6 PS – Foam 0.5% 0.4% 0.6% 0.5% 0.4%
#7 Mixed Resin Plastic 0.1% 0.2% 0.0% 0.1% 0.0%
Uncoded Packaging / Containers 0.9% 1.1% 0.6% 1.5% 0.2%
Other Durable Plastic Products 3.0% 2.4% 1.5% 4.8% 3.3%
Other/Mixed Plastics 0.5% 0.2% 0.1% 0.6% 1.0%
Subtotal 18.0% 15.3% 12.7% 26.2% 18.3%
Compostable Organics
Yard & Garden Small Yard Waste 0.4% 0.4% 0.3% 0.8% 0.1%
Large Yard Waste 0.0% 0.2% 0.0% 0.0% 0.0%
Food Waste Compostable Food Waste 34.1% 34.0% 54.9% 17.0% 28.5%
Donatable Food Waste Donatable Food Waste 2.9% 0.8% 2.1% 1.0% 8.2%
Clean Wood Wood Pallets 0.2% 0.2% 0.0% 0.6% 0.0%
Unfinished Wood Furniture 0.0% 0.0% 0.0% 0.1% 0.0%
Other Wood 2.3% 0.3% 0.3% 1.0% 8.0%
Metro Vancouver ICI Waste Characterization Program.docx

ICI WASTE CHARACTERIZATION PROGRAM FILE: 704-ENVSWM03362-01 | JUNE 2015 | ISSUED FOR USE
Primary Category Secondary Category Tertiary/Quaternary Combined Business Services Accommodation & Food Services
Retail Trade Manufacturing
(N=98) (N=25) (N=25) (N=25) (N=23)
Estimated Disposed Tonnes 125,200 28,800 38,900 14,800 42,700
Weighted Mean (%)
Other Compostable Organics Other Compostable Organics 0.3% 0.8% 0.1% 0.5% 0.0%
Subtotal 40.3% 36.7% 57.8% 21.0% 44.8%
Non-Compostable Organics
Treated or Painted Wood Pressure Treated Wood 0.0% 0.0% 0.0% 0.0% 0.0%
Finished Wood 0.1% 0.1% 0.0% 0.2% 0.0%
Finished Wood furniture 0.3% 0.3% 0.0% 0.9% 0.0%
Textiles Natural Fiber Clothing 0.1% 0.0% 0.0% 0.4% 0.0%
Other Textile Products 0.1% 0.0% 0.0% 0.4% 0.0%
Rubber Tires 0.0% 0.0% 0.0% 0.0% 0.0%
Other rubber 1.3% 0.4% 0.5% 1.3% 3.2%
Leather / Multiple/Composite Organic Materials Leather 0.0% 0.0% 0.0% 0.0% 0.0%
Composite Organic Materials 0.3% 0.4% 0.0% 0.7% 0.3%
Subtotal 2.2% 1.1% 0.5% 3.9% 3.5%
Metals Ferrous Alcoholic 0.0% 0.0% 0.0% 0.0% 0.0%
Non-Alcoholic 0.0% 0.1% 0.0% 0.0% 0.0%
Food Containers 0.3% 0.2% 0.6% 0.1% 0.2%
Other Ferrous 0.1% 0.1% 0.2% 0.1% 0.0%
Bimetallic Food Containers 0.0% 0.0% 0.0% 0.0% 0.0%
Other Bimetallic 0.0% 0.0% 0.0% 0.1% 0.0%
Non-Ferrous (copper, aluminum, brass) Alcoholic 0.0% 0.0% 0.0% 0.0% 0.0%
Non-Alcoholic 0.1% 0.3% 0.1% 0.1% 0.0%
Food Containers 0.0% 0.1% 0.0% 0.0% 0.0%
Foil Trays, Wrap 0.2% 0.3% 0.3% 0.2% 0.2%
Other Non-Ferrous 0.1% 0.0% 0.1% 0.1% 0.1%
Non-Consumable Mixed Metals Household 0.6% 0.3% 0.5% 1.4% 0.1%
Machine Parts 0.0% 0.0% 0.1% 0.0% 0.0%
Construction / Industrial 0.5% 0.6% 0.1% 0.6% 0.9%
Metro Vancouver ICI Waste Characterization Program.docx
ICI WASTE CHARACTERIZATION PROGRAM FILE: 704-ENVSWM03362-01 | JUNE 2015 | ISSUED FOR USE
Primary Category Secondary Category Tertiary/Quaternary Combined Business Services Accommodation & Food Services
Retail Trade Manufacturing
(N=98) (N=25) (N=25) (N=25) (N=23)
Estimated Disposed Tonnes 125,200 28,800 38,900 14,800 42,700
Weighted Mean (%)
Subtotal 2.0% 2.0% 1.9% 2.7% 1.5%
Glass Beverage Containers Beer 0.0% 0.0% 0.1% 0.0% 0.0%
Other Alcohol 0.2% 0.3% 0.5% 0.0% 0.0%
Non-Alcoholic & Non-Dairy 0.3% 0.4% 0.2% 0.3% 0.0%
Dairy or Dairy Substitute 0.0% 0.1% 0.0% 0.0% 0.0%
Food Containers Food Containers 0.2% 0.2% 0.3% 0.2% 0.1%
Other Glass and Ceramics Other Glass and Ceramics 0.8% 0.9% 0.7% 1.5% 0.2%
Subtotal 1.6% 1.9% 1.9% 2.1% 0.3%
Building Material Gypsum/Drywall Gypsum / Drywall 0.1% 0.0% 0.1% 0.0% 0.2%
Masonry Masonry 0.3% 0.0% 0.0% 1.1% 0.0%
Rock, Sand, Dirt Rock, Sand, Dirt 0.4% 1.2% 0.0% 0.3% 0.3%
Rigid Asphalt Rigid Asphalt 0.0% 0.0% 0.0% 0.0% 0.0%
Carpet Waste Carpet Waste 0.1% 0.0% 0.0% 0.0% 0.4%
Other Inorganics Other Inorganics 0.4% 0.1% 0.5% 0.4% 0.5%
Subtotal 1.2% 1.3% 0.6% 1.8% 1.3%
Electronic Waste Computers and Peripherals Desktop Computers 0.1% 0.0% 0.0% 0.5% 0.0%
Notebook Computers 0.0% 0.0% 0.0% 0.0% 0.0%
Computer Peripherals 0.0% 0.1% 0.1% 0.0% 0.0%
Computer Monitors 0.0% 0.0% 0.0% 0.0% 0.0%
Printers, Scanners 0.0% 0.0% 0.0% 0.0% 0.0%
Televisions & AV Equipment Televisions 0.0% 0.0% 0.0% 0.0% 0.0%
Other Audio / Video 0.0% 0.0% 0.0% 0.1% 0.0%
Telephones & Telecommunications Equipment Mobile Phones & Accessories 0.0% 0.0% 0.0% 0.0% 0.0%
Other 0.0% 0.0% 0.0% 0.0% 0.0%
Small Appliances Small Appliances 0.1% 0.2% 0.1% 0.0% 0.0%
Electronic Toys Electronic Toys 0.0% 0.0% 0.0% 0.0% 0.0%
Metro Vancouver ICI Waste Characterization Program.docx

ICI WASTE CHARACTERIZATION PROGRAM FILE: 704-ENVSWM03362-01 | JUNE 2015 | ISSUED FOR USE
Primary Category Secondary Category Tertiary/Quaternary Combined Business Services Accommodation & Food Services
Retail Trade Manufacturing
(N=98) (N=25) (N=25) (N=25) (N=23)
Estimated Disposed Tonnes 125,200 28,800 38,900 14,800 42,700
Weighted Mean (%)
Smoke Detectors Smoke Detectors 0.0% 0.0% 0.0% 0.0% 0.0%
Other Electronics Other Electronics 0.3% 0.3% 0.1% 0.5% 0.1%
Subtotal 0.5% 0.6% 0.2% 1.1% 0.1%
Household Hazardous Batteries Lead Acid 0.0% 0.0% 0.0% 0.0% 0.0%
All Other Batteries 0.0% 0.1% 0.0% 0.0% 0.0%
Medical/Biological Sharps 0.0% 0.0% 0.0% 0.0% 0.0%
Animal Carcass (pets) 0.0% 0.0% 0.0% 0.0% 0.0%
Other 0.2% 0.2% 0.0% 0.4% 0.0%
HHW Stains / Preservatives 0.0% 0.0% 0.0% 0.0% 0.0%
Latex Paint 0.0% 0.1% 0.0% 0.0% 0.0%
Oil-Based Paint 0.0% 0.0% 0.0% 0.0% 0.0%
Paint Aerosols 0.0% 0.0% 0.0% 0.0% 0.0%
Solvents 0.0% 0.0% 0.0% 0.0% 0.0%
Cleaners, Soaps, etc. 0.7% 0.0% 0.3% 0.5% 2.3%
Pesticides / Herbicides / Preservatives 0.0% 0.0% 0.0% 0.0% 0.0%
Motor Oil 0.0% 0.0% 0.0% 0.0% 0.0%
Oil Filters 0.0% 0.0% 0.0% 0.0% 0.0%
Antifreeze 0.0% 0.0% 0.0% 0.0% 0.0%
Pharmaceuticals 0.0% 0.0% 0.0% 0.0% 0.0%
Other Petroleum Based Products 0.0% 0.0% 0.0% 0.0% 0.0%
Other 0.1% 0.1% 0.0% 0.0% 0.2%
Mercury Containing Items Thermostats and Switches 0.0% 0.0% 0.0% 0.0% 0.0%
CFLs 0.0% 0.0% 0.0% 0.0% 0.0%
Other HHW Other HHW 0.1% 0.0% 0.1% 0.1% 0.0%
Subtotal 1.1% 0.5% 0.4% 1.2% 2.5%
Household Hygiene Biological Diapers 0.3% 0.0% 0.4% 0.9% 0.1%
Metro Vancouver ICI Waste Characterization Program.docx

ICI WASTE CHARACTERIZATION PROGRAM FILE: 704-ENVSWM03362-01 | JUNE 2015 | ISSUED FOR USE
Primary Category Secondary Category Tertiary/Quaternary Combined Business Services Accommodation & Food Services
Retail Trade Manufacturing
(N=98) (N=25) (N=25) (N=25) (N=23)
Estimated Disposed Tonnes 125,200 28,800 38,900 14,800 42,700
Weighted Mean (%)
Pet Waste 0.3% 0.1% 0.8% 0.0% 0.0%
Other 0.1% 0.1% 0.0% 0.3% 0.1%
Subtotal 0.7% 0.2% 1.2% 1.1% 0.2%
Bulky Objects White Goods Large Appliances 0.0% 0.0% 0.0% 0.0% 0.0%
Furniture Mattresses, Box Springs 0.0% 0.0% 0.0% 0.0% 0.0%
Other Upholstered Furniture 0.0% 0.0% 0.0% 0.0% 0.0%
Other Furniture 0.2% 0.6% 0.0% 0.1% 0.0%
Subtotal 0.2% 0.6% 0.0% 0.1% 0.0%
Fines Fines Fines 1.2% 2.0% 0.2% 0.5% 2.4%
Other Other Personal Care Products 0.0% 0.0% 0.0% 0.0% 0.0%
Metro Vancouver ICI Waste Characterization Program.docx

ICI WASTE CHARACTERIZATION PROGRAM FILE: 704-ENVSWM03362-01 | JUNE 2015 | ISSUED FOR USE
APPENDIX A TETRA TECH EBA’S GENERAL CONDITIONS
Metro Vancouver ICI Waste Characterization Program.docx
GENERAL CONDITIONS
GEOENVIRONMENTAL REPORT This report incorporates and is subject to these “General Conditions”.
1.0 USE OF REPORT AND OWNERSHIP
This report pertains to a specific site, a specific development, and a specific scope of work. It is not applicable to any other sites, nor should it be relied upon for types of development other than those to which it refers. Any variation from the site or proposed development would necessitate a supplementary investigation and assessment.
This report and the assessments and recommendations contained in it are intended for the sole use of Tetra Tech EBA’s client. Tetra Tech EBA does not accept any responsibility for the accuracy of any of the data, the analysis or the recommendations contained or referenced in the report when the report is used or relied upon by any party other than Tetra Tech EBA’s Client unless otherwise authorized in writing by Tetra Tech EBA. Any unauthorized use of the report is at the sole risk of the user.
This report is subject to copyright and shall not be reproduced either wholly or in part without the prior, written permission of Tetra Tech EBA. Additional copies of the report, if required, may be obtained upon request.
2.0 ALTERNATE REPORT FORMAT
Where Tetra Tech EBA submits both electronic file and hard copy versions of reports, drawings and other project-related documents and deliverables (collectively termed Tetra Tech EBA’s instruments of professional service), only the signed and/or sealed versions shall be considered final and legally binding. The original signed and/or sealed version archived by Tetra Tech EBA shall be deemed to be the original for the Project.
Both electronic file and hard copy versions of Tetra Tech EBA’s instruments of professional service shall not, under any circumstances, no matter who owns or uses them, be altered by any party except Tetra Tech EBA. The Client warrants that Tetra Tech EBA’s instruments of professional service will be used only and exactly as submitted by Tetra Tech EBA.
Electronic files submitted by Tetra Tech EBA have been prepared and submitted using specific software and hardware systems. Tetra Tech EBA makes no representation about the compatibility of these files with the Client’s current or future software and hardware systems.
3.0 NOTIFICATION OF AUTHORITIES
In certain instances, the discovery of hazardous substances or conditions and materials may require that regulatory agencies and other persons be informed and the client agrees that notification to such bodies or persons as required may be done by Tetra Tech EBA in its reasonably exercised discretion.
4.0 INFORMATION PROVIDED TO TETRA TECH EBA BY OTHERS
During the performance of the work and the preparation of the report, Tetra Tech EBA may rely on information provided by persons other than the Client. While Tetra Tech EBA endeavours to verify the accuracy of such information when instructed to do so by the Client, Tetra Tech EBA accepts no responsibility for the accuracy or the reliability of such information which may affect the report.
1
ICI WASTE CHARACTERIZATION PROGRAM FILE: 704-ENVSWM03362-01 | JUNE 2015 | ISSUED FOR USE
APPENDIX B INVITATION TO PARTICIPATE IN THE STUDY
Metro Vancouver ICI Waste Characterization Program.docx

October 16, 2014
Dear Sir or Madam:
Metro Vancouver would like to invite you to participate in a study to improve our understanding of commercial sector waste and to identify opportunities to increase recycling in businesses.
Metro Vancouver has set a waste diversion target of 70% by 2015 and an ambitious target of 80% by 2020. Since the commercial sector accounts for more than a third of Metro Vancouver’s waste, ensuring that businesses have effective waste diversion programs in place is central to achieving these goals. Based on previous composition studies, a significant proportion of the commercial waste stream consists of food scraps, paper and other recyclable items, making these targets achievable, should they be recycled.
Metro Vancouver is embarking on a study of 100 businesses from across the region to characterize commercial sector waste and identify opportunities to support businesses in enhancing waste diversion. Metro Vancouver has retained Tetra Tech EBA to carry out this work.
Should you agree to participate in the study, you will be contacted in October to complete a brief, confidential phone survey on waste collection. In November or December, Tetra Tech EBA staff will visit participants to conduct a short questionnaire on waste management practices and collect a garbage sample.
All information provided by survey participants will be kept strictly confidential. Survey findings will be presented in aggregate form only and all company-specific data will be retained by the consultant. Once the study is complete, participants will receive a summary of waste composition results for their business as well as access to the finalized study.
If you would like to participate in the survey, please contact Project Coordinator Jessica Frank at [email protected] or 604.685.0017 ext. 349. If you have any questions or concerns about the study or Metro Vancouver’s Integrated Solid Waste and Resource Management Plan, please contact Veronica Baker at (604) 436-6769 or [email protected].
Thank you for your time. Best regards,
Veronica Baker
ICI WASTE CHARACTERIZATION PROGRAM FILE: 704-ENVSWM03362-01 | JUNE 2015 | ISSUED FOR USE
APPENDIX C LIST OF MATERIAL CATEGORIES
Metro Vancouver ICI Waste Characterization Program.docx
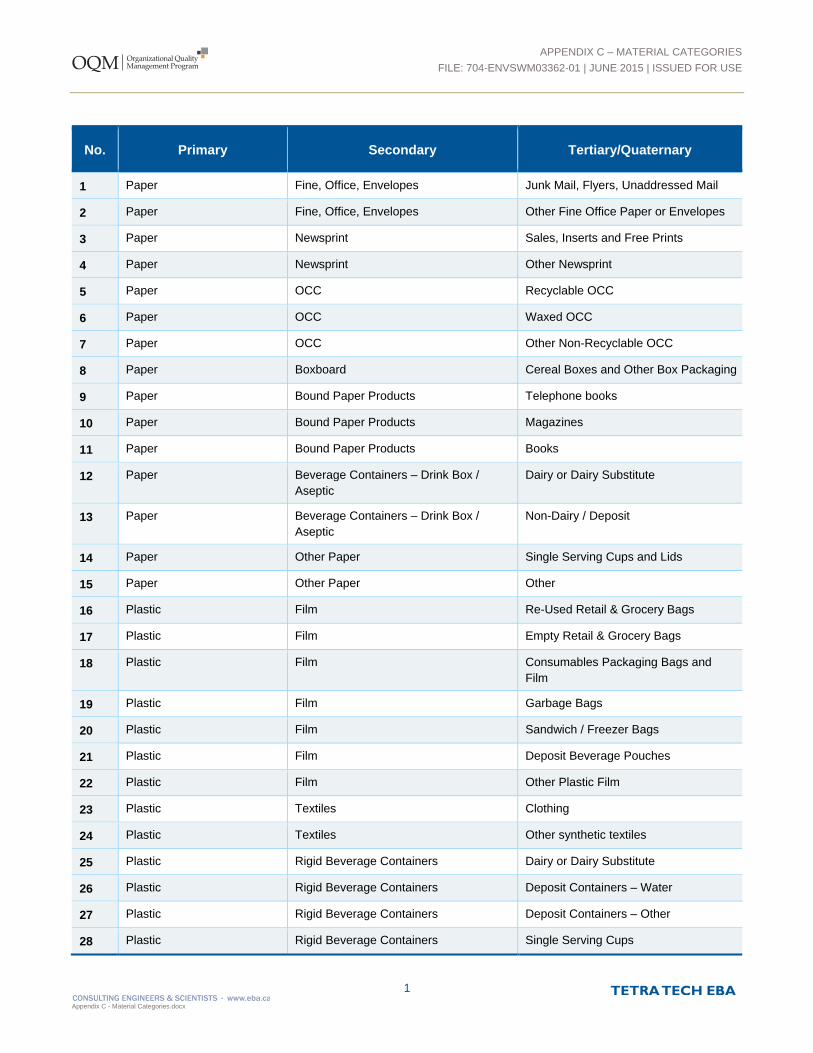
APPENDIX C – MATERIAL CATEGORIES
FILE: 704-ENVSWM03362-01 | JUNE 2015 | ISSUED FOR USE
1
Appendix C - Material Categories.docx
No. Primary Secondary Tertiary/Quaternary
1 Paper Fine, Office, Envelopes Junk Mail, Flyers, Unaddressed Mail
2 Paper Fine, Office, Envelopes Other Fine Office Paper or Envelopes
3 Paper Newsprint Sales, Inserts and Free Prints
4 Paper Newsprint Other Newsprint
5 Paper OCC Recyclable OCC
6 Paper OCC Waxed OCC
7 Paper OCC Other Non-Recyclable OCC
8 Paper Boxboard Cereal Boxes and Other Box Packaging
9 Paper Bound Paper Products Telephone books
10 Paper Bound Paper Products Magazines
11 Paper Bound Paper Products Books
12 Paper Beverage Containers – Drink Box /
Aseptic
Dairy or Dairy Substitute
13 Paper Beverage Containers – Drink Box /
Aseptic
Non-Dairy / Deposit
14 Paper Other Paper Single Serving Cups and Lids
15 Paper Other Paper Other
16 Plastic Film Re-Used Retail & Grocery Bags
17 Plastic Film Empty Retail & Grocery Bags
18 Plastic Film Consumables Packaging Bags and
Film
19 Plastic Film Garbage Bags
20 Plastic Film Sandwich / Freezer Bags
21 Plastic Film Deposit Beverage Pouches
22 Plastic Film Other Plastic Film
23 Plastic Textiles Clothing
24 Plastic Textiles Other synthetic textiles
25 Plastic Rigid Beverage Containers Dairy or Dairy Substitute
26 Plastic Rigid Beverage Containers Deposit Containers – Water
27 Plastic Rigid Beverage Containers Deposit Containers – Other
28 Plastic Rigid Beverage Containers Single Serving Cups

APPENDIX C – MATERIAL CATEGORIES
FILE: 704-ENVSWM03362-01 | JUNE 2015 | ISSUED FOR USE
2
Appendix C - Material Categories.docx
No. Primary Secondary Tertiary/Quaternary
29 Plastic Rigid Beverage Containers Other
30 Plastic Rigid (non-beverage) # 1 PETE – Bottles and Jars
31 Plastic Rigid (non-beverage) #1 PETE – Other Packaging
32 Plastic Rigid (non-beverage) #2 HDPE – Bottles and Jugs
33 Plastic Rigid (non-beverage) #2 HDPE – Tubs and Lids
34 Plastic Rigid (non-beverage) #3 PVC
35 Plastic Rigid (non-beverage) #4 LDPE
36 Plastic Rigid (non-beverage) #5 PP
37 Plastic Rigid (non-beverage) #6 PS – Non-Foam
38 Plastic Rigid (non-beverage) #6 PS – Foam
39 Plastic Rigid (non-beverage) #7 Mixed Resin Plastic
40 Plastic Rigid (non-beverage) Uncoded Packaging / Containers
41 Plastic Other Durable Plastic Products
42 Plastic Other Other / Mixed Plastics
43 Compostable Organics Yard & Garden Small Yard Waste
44 Compostable Organics Yard & Garden Large Yard Waste
45 Compostable Organics Food Waste Compostable Food Waste
46 Compostable Organics Food Waste DO NOT USE
47 Compostable Organics Donatable Food Waste Donatable Food Waste
48 Compostable Organics Donatable Food Waste DO NOT USE
49 Compostable Organics Clean Wood Wood Pallets
50 Compostable Organics Clean Wood Unfinished Wood Furniture
51 Compostable Organics Clean Wood Other Wood
52 Compostable Organics Other Compostable Organics Other Compostable Organics
53 Non-Compostable Organics Treated or Painted Wood Pressure Treated Wood
54 Non-Compostable Organics Treated or Painted Wood Finished Wood
55 Non-Compostable Organics Treated or Painted Wood Finished Wood Furniture
56 Non-Compostable Organics Textiles Natural Fiber Clothing
57 Non-Compostable Organics Textiles Other Textile Products
58 Non-Compostable Organics Rubber Tires

APPENDIX C – MATERIAL CATEGORIES
FILE: 704-ENVSWM03362-01 | JUNE 2015 | ISSUED FOR USE
3
Appendix C - Material Categories.docx
Appendix C - Material Categories.docx
No. Primary Secondary Tertiary/Quaternary
59 Non-Compostable Organics Rubber Other rubber
60 Non-Compostable Organics Leather / Multiple/Composite Organic
Materials
Leather
61 Non-Compostable Organics Leather / Multiple/Composite Organic
Materials
Composite Organic Materials
62 Metals Ferrous Alcoholic
63 Metals Ferrous Non-Alcoholic
64 Metals Ferrous Food Containers
65 Metals Ferrous Other Ferrous
66 Metals Bimetallic Food Containers
67 Metals Bimetallic Other Bimetallic
68 Metals Non-Ferrous (copper, aluminum, brass) Alcoholic
69 Metals Non-Ferrous (copper, aluminum, brass) Non-Alcoholic
70 Metals Non-Ferrous (copper, aluminum, brass) Food containers
71 Metals Non-Ferrous (copper, aluminum, brass) Foil trays, Wrap
72 Metals Non-Ferrous (copper, aluminum, brass) Other Non-Ferrous
73 Metals Non-Consumable Mixed Metals Household
74 Metals Non-Consumable Mixed Metals Machine Parts
75 Metals Non-Consumable Mixed Metals Construction / Industrial
76 Glass Beverage Containers Beer
77 Glass Beverage Containers Other Alcohol
78 Glass Beverage Containers Non-Alcoholic & Non-Dairy
79 Glass Beverage Containers Dairy or Dairy Substitute
80 Glass Food Containers Food Containers
81 Glass Other Glass and Ceramics Other Glass and Ceramics
82 Building Material Gypsym / Drywall Gypsym / Drywall
83 Building Material Masonry Masonry
84 Building Material Rock, Sand, Dirt Rock, Sand, Dirt
85 Building Material Rigid Asphalt Rigid Asphalt
86 Building Material Carpet Waste Carpet Waste
87 Building Material Other Inorganics Other Inorganics

APPENDIX C – MATERIAL CATEGORIES
FILE: 704-ENVSWM03362-01 | JUNE 2015 | ISSUED FOR USE
4
Appendix C - Material Categories.docx
No. Primary Secondary Tertiary/Quaternary
88 Electronic Waste Computers and Peripherals Desktop Computers
89 Electronic Waste Computers and Peripherals Notebook Computers
90 Electronic Waste Computers and Peripherals Computer Peripherals
91 Electronic Waste Computers and Peripherals Computer Monitors
92 Electronic Waste Computers and Peripherals Printers, Scanners
93 Electronic Waste Televisions & AV Equipment Televisions
94 Electronic Waste Televisions & AV Equipment Other Audio / Video
95 Electronic Waste Telephones & Telecommunications
Equipment
Mobile Phones & Accessories
96 Electronic Waste Telephones & Telecommunications
Equipment
Other
97 Electronic Waste Small Appliances Small Appliances
98 Electronic Waste Electronic Toys Electronic Toys
99 Electronic Waste Smoke Detectors Smoke Detectors
100 Electronic Waste Other Electronics Other Electronics
101 Household Hazardous Batteries Lead Acid
102 Household Hazardous Batteries All other Batteries
103 Household Hazardous Medical / Biological Sharps
104 Household Hazardous Medical / Biological Animal Carcass (pets)
105 Household Hazardous Medical / Biological Other
106 Household Hazardous HHW Stains / Preservatives
107 Household Hazardous HHW Latex Paint
108 Household Hazardous HHW Oil-Based Paint
109 Household Hazardous HHW Paint Aerosols
110 Household Hazardous HHW Solvents
111 Household Hazardous HHW Cleaners, Soaps etc.
112 Household Hazardous HHW Pesticides / Herbicides / Preservatives
113 Household Hazardous HHW Motor Oil
114 Household Hazardous HHW Oil Filters
115 Household Hazardous HHW Antifreeze
116 Household Hazardous HHW Pharmaceuticals

APPENDIX C – MATERIAL CATEGORIES
FILE: 704-ENVSWM03362-01 | JUNE 2015 | ISSUED FOR USE
5
Appendix C - Material Categories.docx
Appendix C - Material Categories.docx
No. Primary Secondary Tertiary/Quaternary
117 Household Hazardous HHW Other Petroleum Based Products
118 Household Hazardous HHW Other
119 Household Hazardous Mercury Containing Items Thermostats and switches
120 Household Hazardous Mercury Containing Items CFLs
121 Household Hazardous Other HHW Other HHW
122 Household Hygiene Biological Diapers
123 Household Hygiene Biological Pet Waste
124 Household Hygiene Biological Other
125 Bulky Objects White Goods Large Appliances
126 Bulky Objects Furniture Mattresses, Box Springs
127 Bulky Objects Furniture Other Upholstered Furniture
128 Bulky Objects Furniture Other Furniture
129 Fines Fines Fines
130 Other Other Personal Care Products

ICI WASTE CHARACTERIZATION PROGRAM FILE: 704-ENVSWM03362-01 | JUNE 2015 | ISSUED FOR USE
APPENDIX D DATA TEMPLATE
Metro Vancouver ICI Waste Characterization Program.docx

APPENDIX D - FIELD DATA LOG TEMPLATESFILE: 704-ENVSWM03362-01 | JUNE 2015 | ISSUED FOR USE
BUSINESS: Circle One: BSAMPLE ID: ADATE: RTIME: MLOGGED BY:
Primary Secondary Tertiary/Quaternary# Small
Bins (blue)
# Small Bins
(black)# Large
BinsComments:
Specific materials, quantities, etc.1 Junk Mail, Flyers, Unaddressed Mail2 Other Fine Office Paper or Envelopes3 Sales, Inserts and Free Prints4 Other Newsprint5 Recyclable OCC6 Waxed OCC7 Other Non-Recycable OCC
Boxboard 8 Cereal Boxes and Other Box Packaging9 Telephone Books
10 Magazines11 Books12 Dairy or Dairy Substitute13 Non-Dairy / Deposit14 Single Serving Cups and Lids15 Other16 Re-Used Retail & Grocery Bags17 Empty Retail & Grocery Bags18 Consumables Packaging Bags and Film19 Garbage Bags20 Sandwich / Freezer Bags21 Deposit Beverage Pouches22 Other Plastic Film23 Clothing24 Other Synthetic Textiles25 Dairy or Dairy Substitute26 Deposit Containers - Water27 Deposit Containers - Other28 Single Serving Cups29 Other30 # 1 PETE - Bottles and Jars31 #1 PETE - Other Packaging32 #2 HDPE - Bottles and Jugs33 #2 HDPE - Tubs and Lids34 #3 PVC35 #4 LDPE36 #5 PP37 #6 PS - Non-Foam38 #6 PS - Foam39 #7 Mixed Resin Plastic40 Uncoded Packaging / Containers41 Durable Plastic Products42 Other / Mixed Plastics
kg
Fine, Office, Envelopes
Newsprint
OCC
Bound Paper ProductsBeverage Containers - Drink Box / Aseptic
Other Paper
Film
Textiles
Rigid Beverage Containers
Rigid (non-beverage)
Other
Paper
Plastic

APPENDIX D - FIELD DATA LOG TEMPLATESFILE: 704-ENVSWM03362-01 | JUNE 2015 | ISSUED FOR USE
BUSINESS: Circle One: BSAMPLE ID: ADATE: RTIME: MLOGGED BY:
Primary Secondary Tertiary/Quaternary# Small
Bins (blue)
# Small Bins
(black)# Large
BinsComments:
Specific materials, quantities, etc.kg
43 Small Yard Waste44 Large Yard Waste45 Compostable Food Waste4647 Donatable Food Waste4849 Wood Pallets50 Unfinished Wood Furniture51 Other Wood
Other Compostable Organics 52 Other Compostable Organics53 Pressure Treated Wood54 Finished Wood55 Finished Wood furniture56 Natural Fiber Clothing57 Other Textile Products58 Tires59 Other Rubber60 Leather61 Composite Organic Materials62 Alcoholic63 Non-Alcoholic64 Food Containers65 Other Ferrous66 Food Containers67 Other Bimetallic68 Alcoholic69 Non-Alcoholic70 Food Containers71 Foil Trays, Wrap72 Other Non-Ferrous73 Household74 Machine Parts75 Construction / Industrial76 Beer77 Other Alcohol78 Non-Alcoholic & Non-Dairy79 Dairy or Dairy Substitute
Food Containers 80 Food ContainersOther Glass and Ceramics 81 Other Glass and CeramicsGypsym/Drywall 82 Gypsym / DrywallMasonry 83 MasonryRock, Sand, Dirt 84 Rock, Sand, DirtRigid Asphalt 85 Rigid AsphaltCarpet Waste 86 Carpet WasteOther Inorganics 87 Other Inorganics
Yard & Garden
Leather/Multiple/Composite Organic Materials
Ferrous
Non-Consumable Mixed Metals
Bimetallic
Non-Ferrous (copper, aluminum, brass)
Food Waste
Clean Wood
Treated or Painted Wood
Textiles
Rubber
Donatable Food Waste
Glass
Building Material
Compostable Organics
Non-Compostable Organics
Metals
Beverage Containers
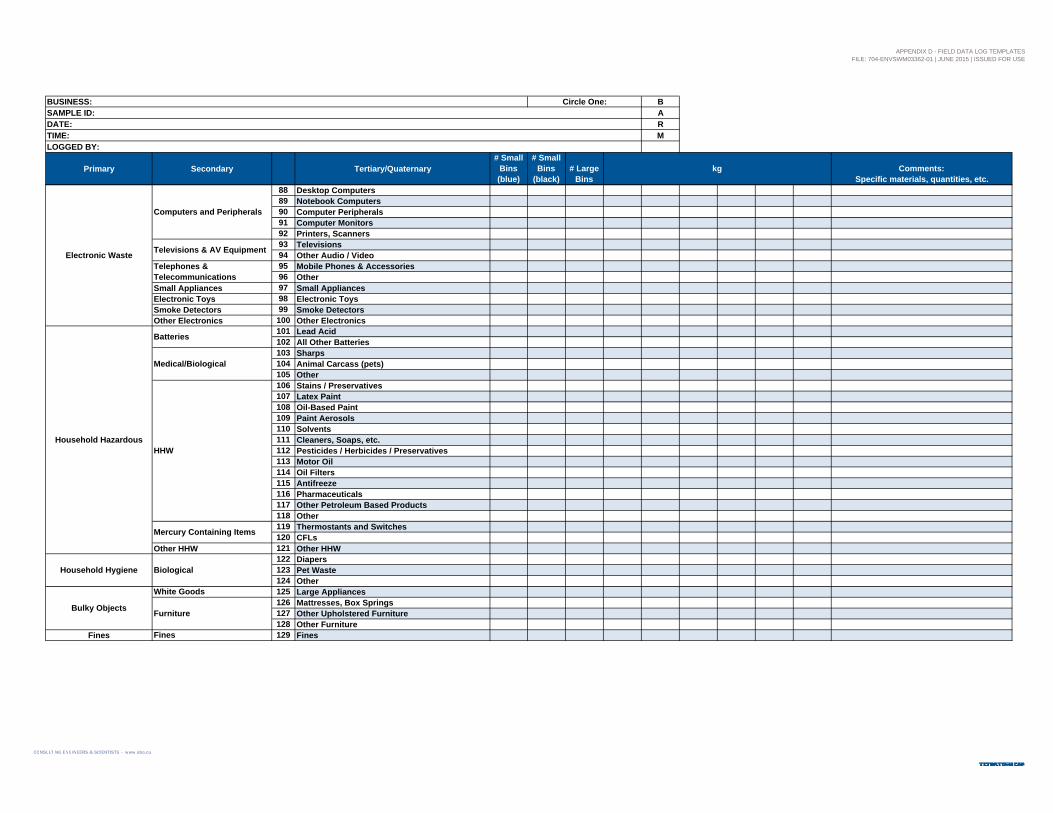
APPENDIX D - FIELD DATA LOG TEMPLATESFILE: 704-ENVSWM03362-01 | JUNE 2015 | ISSUED FOR USE
BUSINESS: Circle One: BSAMPLE ID: ADATE: RTIME: MLOGGED BY:
Primary Secondary Tertiary/Quaternary# Small
Bins (blue)
# Small Bins
(black)# Large
BinsComments:
Specific materials, quantities, etc.kg
88 Desktop Computers89 Notebook Computers90 Computer Peripherals91 Computer Monitors92 Printers, Scanners93 Televisions94 Other Audio / Video95 Mobile Phones & Accessories96 Other
Small Appliances 97 Small AppliancesElectronic Toys 98 Electronic ToysSmoke Detectors 99 Smoke DetectorsOther Electronics 100 Other Electronics
101 Lead Acid102 All Other Batteries103 Sharps104 Animal Carcass (pets)105 Other106 Stains / Preservatives107 Latex Paint108 Oil-Based Paint109 Paint Aerosols110 Solvents111 Cleaners, Soaps, etc.112 Pesticides / Herbicides / Preservatives 113 Motor Oil114 Oil Filters115 Antifreeze116 Pharmaceuticals117 Other Petroleum Based Products118 Other119 Thermostants and Switches120 CFLs
Other HHW 121 Other HHW122 Diapers123 Pet Waste124 Other
White Goods 125 Large Appliances126 Mattresses, Box Springs127 Other Upholstered Furniture128 Other Furniture
Fines Fines 129 Fines
Household Hygiene
Bulky Objects
Mercury Containing Items
Biological
Furniture
Batteries
Electronic Waste
Household Hazardous
Medical/Biological
HHW
Computers and Peripherals
Televisions & AV Equipment
Telephones & Telecommunications
ICI WASTE CHARACTERIZATION PROGRAM FILE: 704-ENVSWM03362-01 | JUNE 2015 | ISSUED FOR USE
APPENDIX E SELECT SAMPLE PHOTOGRAPHS
Metro Vancouver ICI Waste Characterization Program.docx
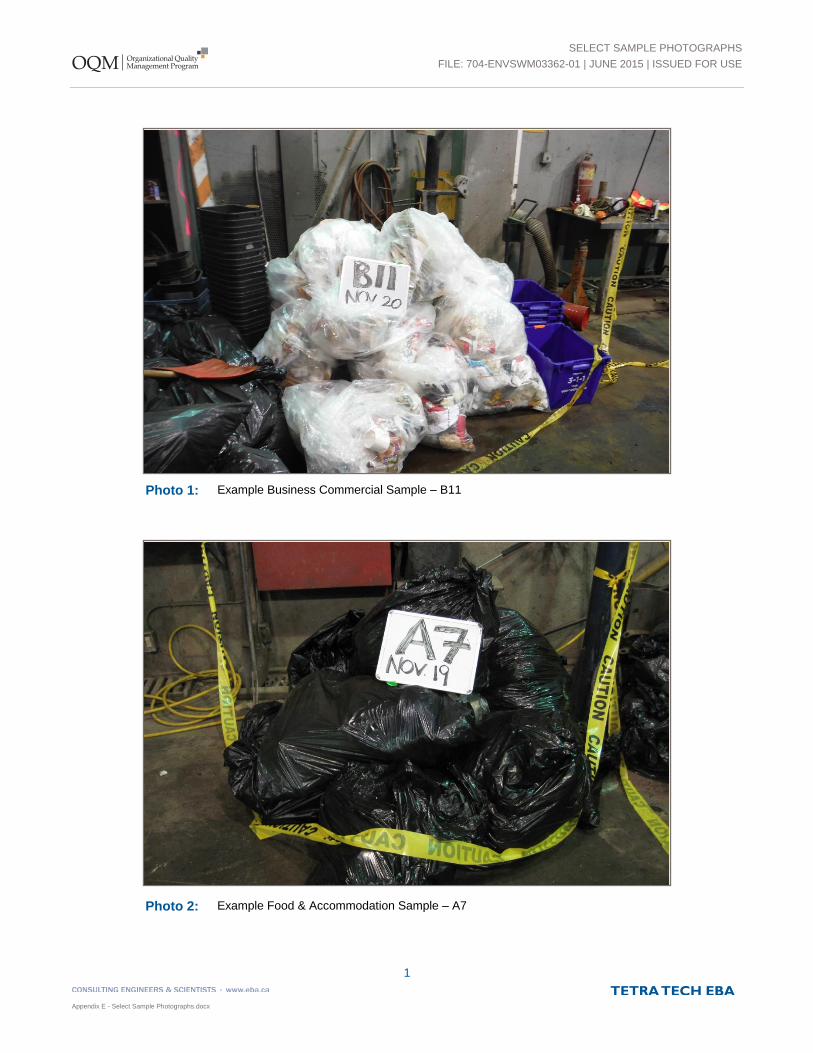
SELECT SAMPLE PHOTOGRAPHS
FILE: 704-ENVSWM03362-01 | JUNE 2015 | ISSUED FOR USE
1
Appendix E - Select Sample Photographs.docx
Photo 1: Example Business Commercial Sample – B11
Photo 2: Example Food & Accommodation Sample – A7

SELECT SAMPLE PHOTOGRAPHS
FILE: 704-ENVSWM03362-01 | JUNE 2015 | ISSUED FOR USE
2
Appendix E - Select Sample Photographs.docx
Photo 4: Example Retail Sample – R20
Photo 3: Example Manufacturing Sample – M2
ICI WASTE CHARACTERIZATION PROGRAM FILE: 704-ENVSWM03362-01 | JUNE 2015 | ISSUED FOR USE
APPENDIX F EXAMPLE OF BUSINESS ASSESSMENT SHEET
Metro Vancouver ICI Waste Characterization Program.docx
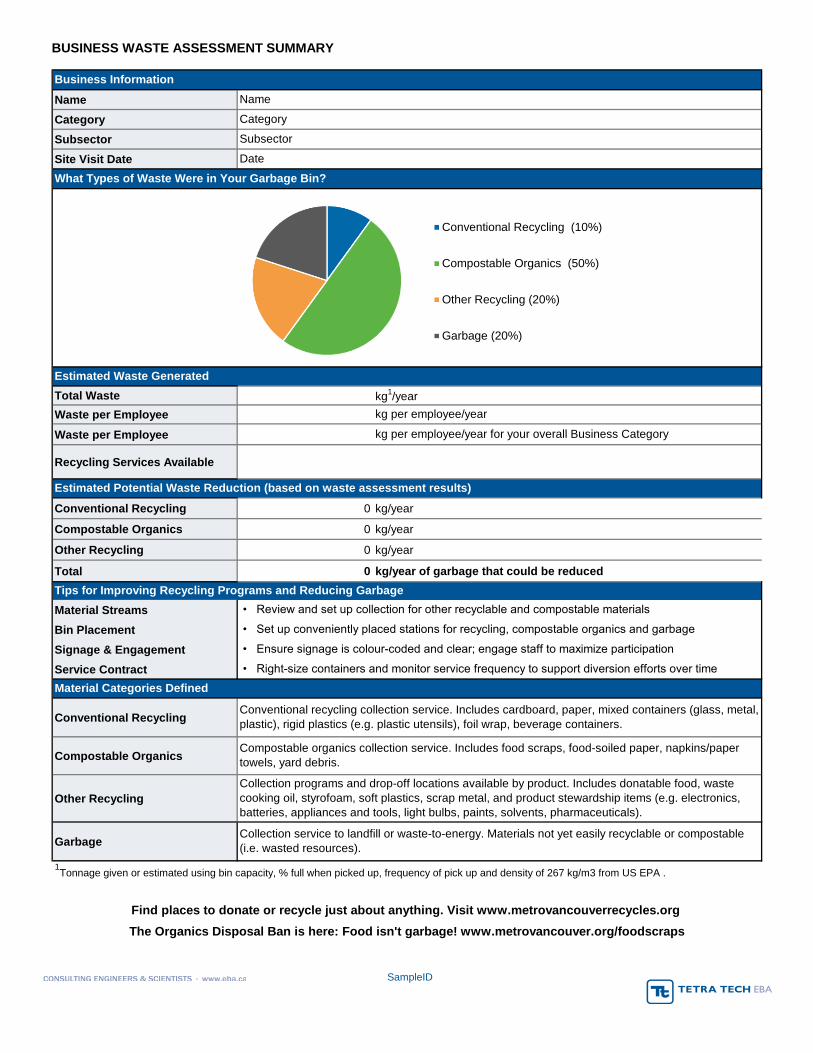
BUSINESS WASTE ASSESSMENT SUMMARY
Name
Category
Subsector
Site Visit Date
Total Waste
Waste per Employee
Waste per Employee
Recycling Services Available
Conventional Recycling 0 kg/year
Compostable Organics 0 kg/year
Other Recycling 0 kg/year
Total 0 kg/year of garbage that could be reduced
Material Streams
Bin Placement
Signage & Engagement
Service Contract
Conventional Recycling
Compostable Organics
Other Recycling
Garbage
SampleID
kg1/year
Estimated Potential Waste Reduction (based on waste assessment results)
Tips for Improving Recycling Programs and Reducing Garbage
kg per employee/year for your overall Business Category
kg per employee/year
• Set up conveniently placed stations for recycling, compostable organics and garbage
• Ensure signage is colour-coded and clear; engage staff to maximize participation
• Review and set up collection for other recyclable and compostable materials
• Right-size containers and monitor service frequency to support diversion efforts over time
Business Information
Name
Date
Estimated Waste Generated
Category
Subsector
What Types of Waste Were in Your Garbage Bin?
The Organics Disposal Ban is here: Food isn't garbage! www.metrovancouver.org/foodscraps
Find places to donate or recycle just about anything. Visit www.metrovancouverrecycles.org
Conventional recycling collection service. Includes cardboard, paper, mixed containers (glass, metal,
plastic), rigid plastics (e.g. plastic utensils), foil wrap, beverage containers.
Compostable organics collection service. Includes food scraps, food-soiled paper, napkins/paper
towels, yard debris.
Collection programs and drop-off locations available by product. Includes donatable food, waste
cooking oil, styrofoam, soft plastics, scrap metal, and product stewardship items (e.g. electronics,
batteries, appliances and tools, light bulbs, paints, solvents, pharmaceuticals).
Collection service to landfill or waste-to-energy. Materials not yet easily recyclable or compostable
(i.e. wasted resources).
Material Categories Defined
1Tonnage given or estimated using bin capacity, % full when picked up, frequency of pick up and density of 267 kg/m3 from US EPA .
Conventional Recycling (10%)
Compostable Organics (50%)
Other Recycling (20%)
Garbage (20%)
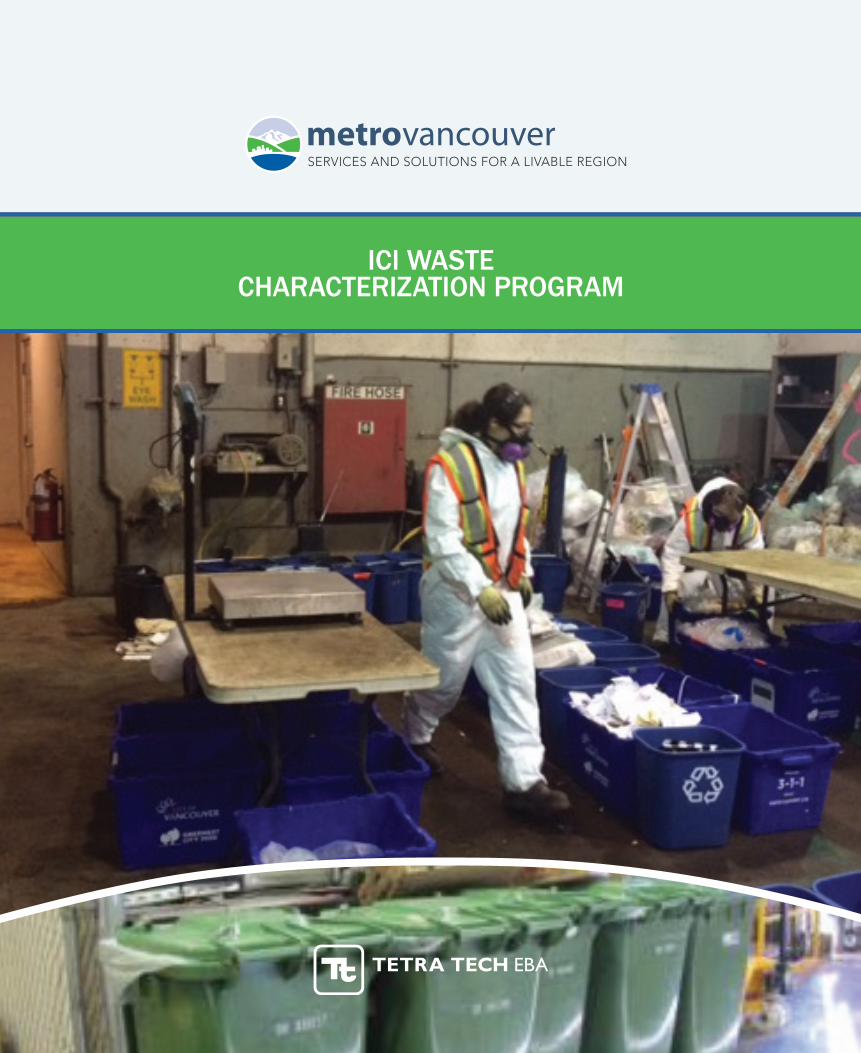
ICI WASTE CHARACTERIZATION PROGRAM