icici group - personal banking, online banking services · banking transactions refreshed &...
TRANSCRIPT

ICICI Group
Performance and Strategy
February 2016

Certain statements in these slides are forward-looking statements.
These statements are based on management's current expectations and
are subject to uncertainty and changes in circumstances. Actual results
may differ materially from those included in these statements due to a
variety of factors. More information about these factors is contained in
ICICI Bank's filings with the US Securities and Exchange Commission.
All financial and other information in these slides, other than financial
and other information for specific subsidiaries where specifically
mentioned, is on an unconsolidated basis for ICICI Bank Limited only
unless specifically stated to be on a consolidated basis for ICICI Bank
Limited and its subsidiaries. Please also refer to the statement of
unconsolidated, consolidated and segmental results required by Indian
regulations that has, along with these slides, been filed with the stock
exchanges in India where ICICI Bank’s equity shares are listed and with
the New York Stock Exchange and the US Securities and Exchange
Commission, and is available on our website www.icicibank.com
2

Significant progress in operating performance
Strong capital position
3
Substantial value creation within the ICICI Group
Strong retail franchise: leadership in technology

Significant progress in operating performance
Strong capital position
4
Substantial value creation within the ICICI Group
Strong retail franchise: leadership in technology

Excess Tier-1 ratio of 5.76% over the minimum requirement of
7.00% as per current RBI guidelines
Strong capital position
5
Capital ratios significantly higher than regulatory requirements
Consolidated Basel III total capital
adequacy ratio at 16.75%, Tier 1 ratio
at 12.73% at December 31, 20151
December 31, 20151
Tier I
CA
R
16.74%
12.76%
Standalone capital
1. Basel III capital ratios include profits for the nine months ended December 31, 2015
Maintaining Tier-1 ratio at 10.00% indicates surplus capital of
about ₹ 160.00 billion at Dec 31, 2015

Potential positives
6
BCBS: Basel Committee on Banking Supervision
CRAR: Capital to risk weighted assets ratio
Treatment of deferred
tax assets (DTA)
Aligning RBI norms to BCBS
would increase Tier-1 capital by
~₹ 25.00 bn at Dec 31, 2015
ICICI Bank’s Tier-1 capital is composed almost entirely of core
equity capital; considerable headroom to raise additional Tier-1
capital

Significant progress in operating performance
Strong capital position
7
Substantial value creation within the ICICI Group
Strong retail franchise: leadership in technology
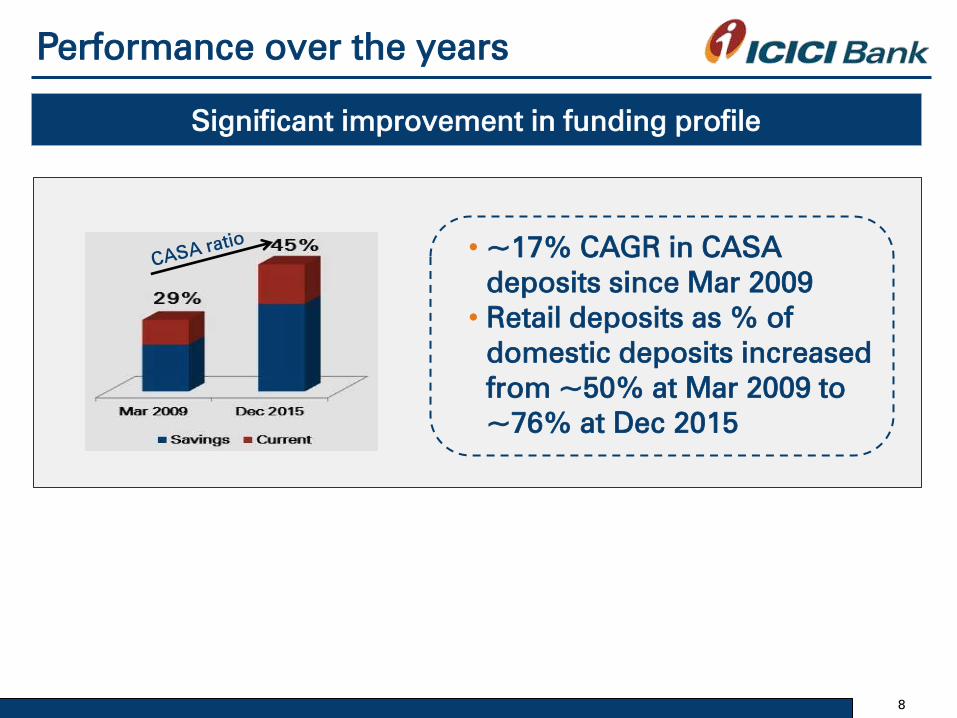
Performance over the years
Significant improvement in funding profile
• ~17% CAGR in CASA
deposits since Mar 2009
• Retail deposits as % of
domestic deposits increased
from ~50% at Mar 2009 to
~76% at Dec 2015
8

Performance over the years
Healthy loan mix & growth
• ~ 17% CAGR in
domestic loans since
Mar 2011
• ~21% CAGR in retail
loans since Mar 2012
9
Given the challenges in the operating environment and the
Bank’s cautious approach to incremental lending in corporate
segment, annualised growth in domestic portfolio decreased
to 8.8% between March 2013 and March 2015 compared to
24.3% between March 2011 and March 2013

Performance over the years
Growth driven by retail lending
10
Growth in domestic loans improved to 20.4% y-o-y at
December 31, 2015 from 17.0% y-o-y at September 30, 2015;
retail loan growth at 24.0%
Share of retail loans in total loans increased from 40.9% at
December 31, 2014 to 43.8% at December 31, 2015
14.9% y-o-y growth in corporate portfolio driven by lending
to higher rated corporates including public sector entities

Improvement in net interest margins
Performance over the years
• Margin improvement driven by
focus across businesses
• Domestic margins improved by
~90 bps since FY2010
• Overseas margins improved
from 0.41% in FY2010 to 1.65%
in FY2015 and 1.94% in 9M-2016
11
Overall NIM

Strong operating efficiency
Performance over the years
12
Domestic cost-income Branch network
Costs contained while continuing scale up in distribution and
investments in technology
1
1. Cost-to-income ratio of 9M-2016 excludes ₹ 12.43 billion of profit on sale of 4% shareholding
in ICICI Life in Q3-2016

Performance over the years
Improvement in return ratios
• About 90 bps improvement
in standalone RoA over
FY2009
• Consolidated RoE improved
from less than 8% in
FY2009 to 14.6% in 9M-
2016
13

NPA additions of ` 65.44 bn in Q3-2016; about 2/3rd on
account of cases highlighted by RBI in line with its objective of
early and conservative recognition of stress and provisioning
• Additional loans aggregating to a similar amount may slip
into NPA in Q4-2016 from the cases highlighted by RBI
NPA and restructuring trends
14
Asset quality (1/3)
FY2014
Gross NPA additions (B) 45.40
` billion FY2015
80.78
Of which: slippages from
restructured loans (C) 7.27 45.29
Restructuring additions (A) 66.33 53.94
9M-2016
102.46
25.41
23.06
Net fresh additions (A+B-C) 104.46 89.43 100.11

NPA and restructuring trends
15
Asset quality (2/3)
Dec 31, 2014
Gross restructured loans (B) 131.05
` billion Dec 31, 2015
120.37
Total (A+B) 263.36 333.93
Gross non-performing assets (A) 132.31 213.56
Total as a % of gross customer assets 5.97% 6.58%

NPA and restructuring trends
16
Asset quality (3/3)
Dec 31, 2014
Net restructured loans (B) 120.52
` billion Dec 31, 2015
112.94
Total (A+B) 168.83 213.08
Net non-performing assets (A) 48.31 100.14
Total as a % of net customer assets 3.91% 4.31%

Significant progress in operating performance
Strong capital position
17
Substantial value creation within the ICICI Group
Strong retail franchise: leadership in technology

ICICI Group
Savings
Investments
Capital
flows
Protection
Credit
Spanning the spectrum of financial services
18

Life insurance
19
• Overall market share1 has improved from
7.2% in FY2014 to 11.3% in FY2015 and
12.1% in 9M-2016
•11.1% y-o-y growth in new business
premiums1 in 9M-2016 compared to 4.5%
y-o-y for industry
Strong growth
& improvement
in market share
1. Based on retail weighted received premium
• PAT of ` 12.47 billion in 9M-2016
• Return on equity of over 30%
Sustained &
strong
profitability
• AUM at ~` 1,017 billion at Dec 31, 2015 Growth in AUM

General insurance
20
• Private sector market leadership
maintained
• Overall market share at 9.1%1 in 9M-2016
• Gross written premium grew by 19.2% y-
o-y in 9M-2016 compared to 12.9% y-o-y
growth for industry
Market
position
• PAT of ` 3.88 billion in 9M-2016
• Return on equity at ~16%
Strong
profitability
1. Based on gross written premium
2. Sale is subject to governmental and regulatory approvals

Other businesses
21
• 2nd largest AMC in India
• PAT of ` 2.46 billion in 9M-2016; 29.5% y-
o-y increase
Asset
management
• Strong platforms for leveraging
favourable markets
• ICICI Securities PD: amongst the leaders
in Indian fixed income & money markets;
PAT of ` 1.84 billion in 9M-2016
• ICICI Securities: ~3.7 million customers;
PAT of ` 1.76 billion in 9M-2016
Securities &
primary
dealership
Strong franchise across segments

22
Significant value in subsidiaries
Life & general
insurance
ICICI Bank Canada,
ICICI Bank UK and
ICICI HFC
ICICI AMC
ICICI Securities
Aggregate value of shareholding post
announced transactions at ~` 330 bn;
assuming retention of majority stake,
further pre-tax gains of ~₹ 70 bn
Second largest asset management
company in India
Largest online retail broking platform
Opportunity for reallocating capital

Significant progress in operating performance
Strong capital position
23
Substantial value creation within the ICICI Group
Strong retail franchise: leadership in technology

24
Strong retail franchise
Healthy
growth in
fee
income
Sustained
growth in
granular
deposits
Robust
loan
portfolio
growth
Stable
asset
quality
trends
The Bank continues to scale up its retail business and
invest in strengthening the franchise and distribution
infrastructure
Leveraging digitization & mobility to strengthen
franchise & improve performance

Extensive geographical presence
25
Significant investments made in distribution
~52% of branches in semi-
urban and rural areas
Supplemented by
13,372 ATMs
Branch network
Focus on cross-sell along
with customer service at
branches

Significant presence in rural & semi-urban markets
Network Technology
solutions
Branches
Gramin branches
BCs1 & CSPs
2
Aadhaar integration
for DBT1
Partner linkages
2,169 branches in rural & semi-urban markets
Focus on rural business (1/2)
Mobile based
remittance services
Bank on wheels &
micro ATMs
26
1. BCs: Business correspondents
2. CSPs: Customer service points
Approach to
lending
Selective geographical
approach
Collateral based
lending
Granular portfolio

Diverse product suite & granular lending
Focus on growth to continue while monitoring risks
27
Key products include loans against gold jewelry, farm
equipment loans, kisan credit card, agri term loans and
loans to Self Help Groups (SHG)
Portfolio contributes~14%
to retail loans
~25% y-o-y growth at
December 31, 2015
Focus on rural business (2/2)

Leadership in technology
Digitizing
channels
Digitizing
experience
Digitizing
core
28

• One of the largest bouquets of
seamless services
• Online dashboard - ‘My View’
• Investment management & tax services
tools
29
Digitizing channels (1/2)
Over 60% of total transactions for our savings account customers
done through new age digital channels
iMobile
• Integrated view of all ICICI Bank relationships
• About 140 services available
• Market leadership based on value of mobile
banking transactions
Refreshed & intuitive
website

30
Digitizing channels (2/2)
e-wallet for all -
whether customer
or not
•Significant interest from non-ICICI users
•Services available include shopping, bill
payments, booking movie tickets
•Linked prepaid card for POS
transactions
India’s First Digital Bank: 3.1 million downloads
Presence on social media
Innovative offerings to improve customer convenience
•Banking services available on Facebook and
•Fan base of over 4.0 million on Facebook
•Highest among banks in India
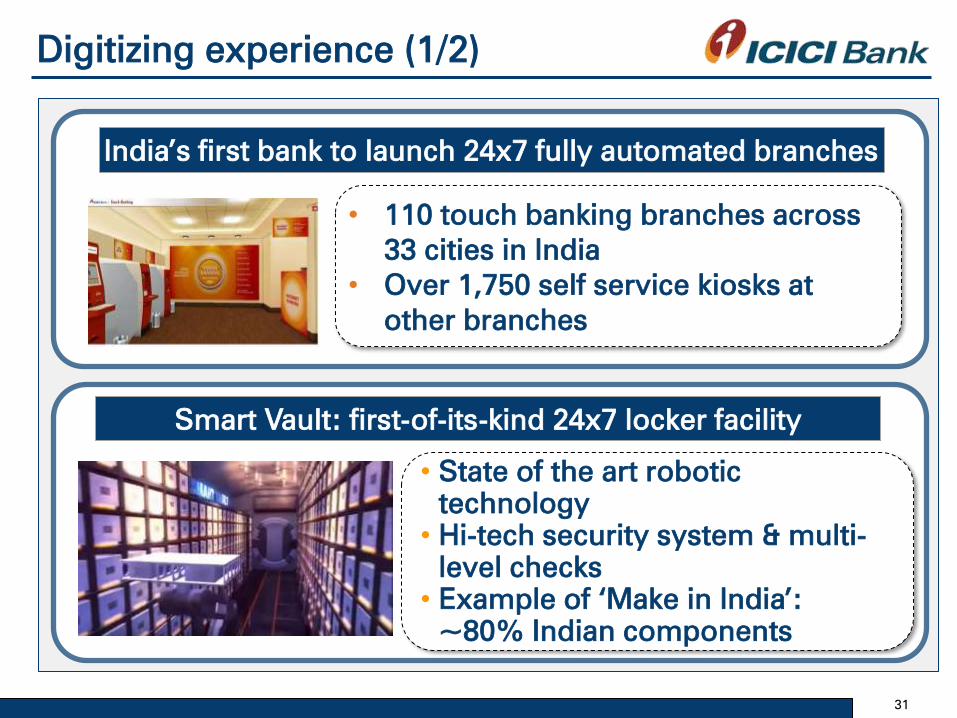
Digitizing experience (1/2)
31
India’s first bank to launch 24x7 fully automated branches
• 110 touch banking branches across
33 cities in India
• Over 1,750 self service kiosks at
other branches
• State of the art robotic
technology
• Hi-tech security system & multi-
level checks
• Example of ‘Make in India’:
~80% Indian components
Smart Vault: first-of-its-kind 24x7 locker facility

Digitizing experience (2/2)
32
Debit & credit cards using near field communication
Contactless payments
Toll and transit solutions
• Transit Metro solutions
• Debit & credit cards with NFC metro smart card chip
• Auto-top up facility on low balance
• Easy recharge using SMS/internet
• Solutions for road transport
• Prepaid card with dual wallet (RFID1 chip & magnetic chip)
• Single card for bus ticket payments & retail purchases
• Electronic toll collection: prepaid RFID1 tags for vehicles
1. RFID: Radio-frequency identification

Digitizing core
Front office
• KYC through
scanned documents
• Demo videos for
products & services
• Upsell of mutual
funds & insurance
• Being introduced for
loan products
~3.4 million
savings accounts
sourced through
Tab banking
• Video banking app
• 24X7 face-to-face
banking
• Insta-banking
• Pre-processing of
transactions
• EFT cheques
• App-based cheque
issuance & image
based processing
• Image-based
processing of
documents
• OCR1 to reduce
data entry & error
rates
• Automated
processing
Mid office
Branch services
shifting to
customers’ mobiles
Back office
Digitizing
operations
33
1. OCR: Optical Character Recognition

Looking ahead
34

35
Way forward
Retail & rural business: sustain strong franchise and
performance
Continue to expand branch and ATM network
Focus on maintaining technology leadership
Drive operating efficiency & productivity across businesses
Maintaining robust growth in the retail portfolio while monitoring
risks

36
Way forward
Corporate business: selective approach to incremental business
Limits on single borrower/group exposures significantly lower
than the regulatory limit for lower rated companies/groups
Limits on project finance exposures
Growth in corporate loans (including international) to be limited
to about 10% y-o-y
Negative list of groups/ sponsors
Formation of separate credit administration group within
business; independent of relationship team
Key measures
Increase in proportion of higher rated exposures in portfolio

37
In summary
Strong capital position supported by healthy operating
earnings
Significant value in subsidiaries; demonstrated with recent
transactions in insurance business
Key strengths
Growth to be driven by strong retail and rural franchise
Focus on resolution of corporate exposures and selective
fresh lending
Focus areas
Thank you
38