iclr forecast webex: 2015 hurricane season (june 8, 2015)
TRANSCRIPT

2015 Hurricane Briefing
for the
Institute for Catastrophic
Loss Reduction
Bob Robichaud
Warning Preparedness Meteorologist
Canadian Hurricane Centre
Environment Canada

Contents
• Tropical Cyclone Primer
• Summary of the 2014 Hurricane Season
• Hurricane Readiness - Monitoring tropical cyclones during hurricane season
• Outlook for the 2015 Hurricane Season

• A relatively large and long-lasting low pressure system with well-defined centre
• No fronts attached (unlike a winter storm)
• Intensity is driven by water temperature
• Classified by maximum sustained surface wind speed
Tropical Cyclones

Tropical Cyclones – Nature’s Heat Engine

Tropical Cyclone Climatology
Tropical Cyclone
distribution
by month

Current Water Temperature

Tropical vs. Extratropical
• Symmetric around the centre
• No cold sections – no fronts
• Driven by warm water temperature
• Has a cold section and a warm section – i.e. has fronts
• Driven by horizontal temperature difference
Tropical Extra-Tropical

From Tropical to Post-Tropical R
ain
W
ind
Purely Tropical Extra-tropical transition Post-Tropical

Tropical Cyclone Hazards Storm Surge • Abnormal rise in water
generated by a storm, over and
above the astronomical tide
• Caused primarily by force of
wind blowing across water
surface
• Contribution by low pressure
within center of storm is minimal
Large Waves
• On occasion a particular
phenomenon can give rise to
extreme wave heights
• This threat is most significant
along the Atlantic coast associated
with accelerating post-tropical
storms
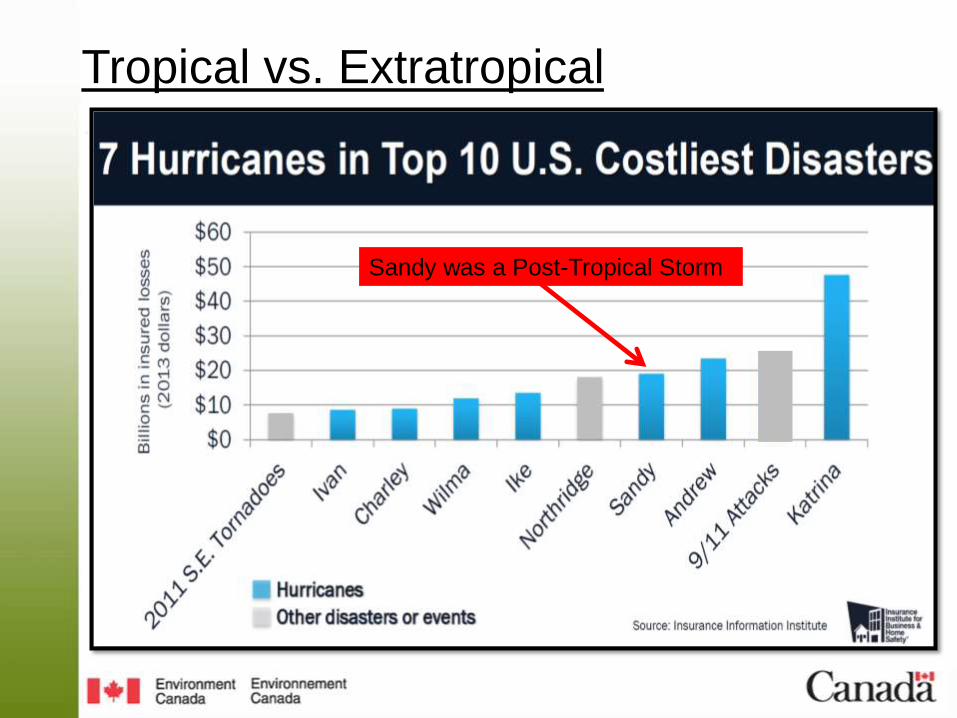
Tropical vs. Extratropical
Sandy was a Post-Tropical Storm

Tropical Cyclone Hazards

Hurricane Season 2014 in Review

2014 Season in Review

2014 Season in Review – CHC Response Zone

• Formed on July 1st off the coast of Florida
• Arthur became the first hurricane of the 2014 season at 6 am on July 3rd
• Upgraded to category 2 status later that evening
• Made landfall along the Outer Banks of North Carolina on during the night of the 3rd into the 4th of July
• Declared post-tropical on the morning of July 5th
• Made landfall near Meteghan NS around 0730 on July 5th
2014 Season in Review – Arthur

2014 Season in Review – Bertha
• Formed on August 1st.
• Became a hurricane early on
August 4th then later weakened
to a tropical storm.
• Merged with a trough and
became post-tropical August
6th.
• No impact to Atlantic Canada
except for some swell along
the Atlantic Coast of Nova
Scotia and Newfoundland.

• Formed on August 24th and
became a hurricane on August
25th.
• Reached maximum intensity of
140 km/h August 29th south of St.
Johns
•Became post-tropical but still at
hurricane force while rapidly
exiting the eastern edge of the
Grand Banks.
• Impacts primarily limited to wind
and waves offshore.
2014 Season in Review – Cristobal

2014 Season in Review – Gonzalo
• Formed on October 12th.
• Intensified to Category 4
strength on October 15th.
•Peak intensity of 230 km/h on
October 16th.
•Passed directly over Bermuda as
a Category 2 hurricane.
• Tracked rapidly and came within
60 km Cape Race early on
October 19th.
• Produced gusty winds, rain and
large waves reaching over 20 m
Hurricane Gonzalo

Hurricane Readiness

Hurricane Weather Products - Monitoring • A good tool to check overall tropical activity is the Tropical Weather
Outlook issued by the NHC
5-day GTWO Operational in 2015
www.nhc.noaa.gov/gtwo_atl.shtml
48 hour GTWO

Hurricane Weather Products – beyond 120 hrs
• Tropical Weather Outlook (NHC)
still a good place to start
• CHC will show the track as issued
by the NHC on the CHC website but
generally no text products are issued
beyond 5 days
• All tracks will be displayed on the
CHC hurricane track map
- Red tracks are NHC-issued
tracks
www.nhc.noaa.gov
www.hurricanes.ca

Hurricane Weather Products – 96 to 120 hrs
• CHC will issue preliminary bulletins
4 or 5 day before the storm’s arrival to
provide an overview for Canadian
territory
• All tracks will be displayed on the
CHC hurricane track map
- Red tracks are NHC-issued
tracks
www.nhc.noaa.gov
www.hurricanes.ca

Hurricane Weather Products – 72 hrs or less
www.hurricanes.ca
• CHC will typically begin to issue regularly
scheduled information bulletins every 6 hours
about 72 hours prior to the storm entering the
response zone
• Issue times are 3 and 9 am and pm
- All tracks will be displayed on the
CHC hurricane track map - Blue tracks are CHC-issued tracks
- Red tracks are NHC-issued tracks
Bulletin Structure
1) Summary information on initial
position, intensity, motion
2) Public impacts
• warnings broken down by
hazard (wind, rainfall,
surge/waves)
3) Marine impacts and warning
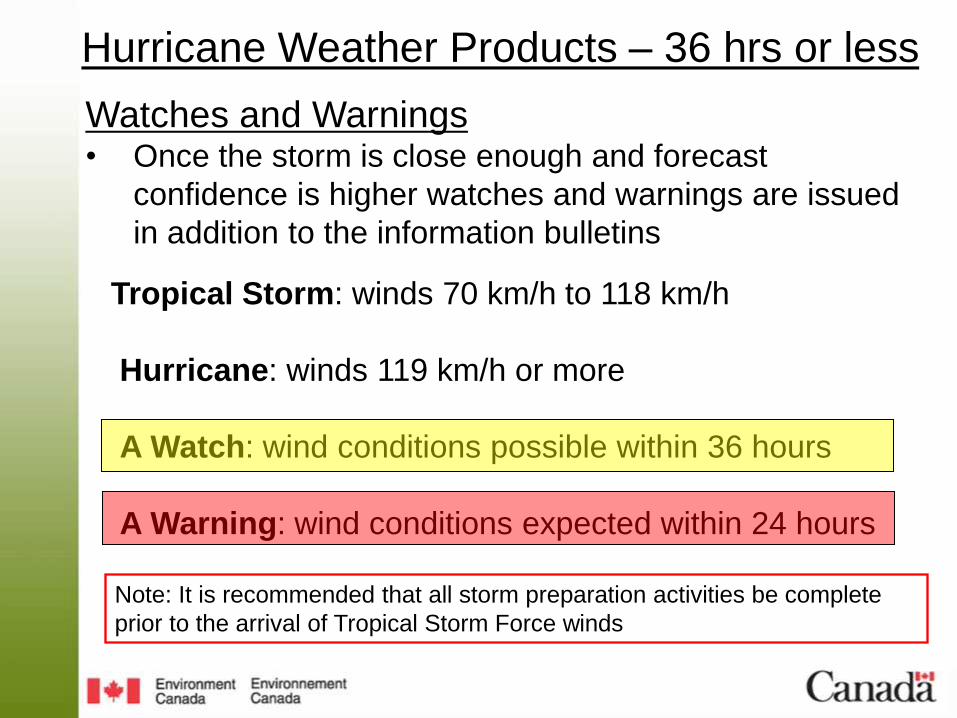
Tropical Storm: winds 70 km/h to 118 km/h
Hurricane: winds 119 km/h or more
A Watch: wind conditions possible within 36 hours
A Warning: wind conditions expected within 24 hours
Watches and Warnings • Once the storm is close enough and forecast
confidence is higher watches and warnings are issued
in addition to the information bulletins
Note: It is recommended that all storm preparation activities be complete
prior to the arrival of Tropical Storm Force winds
Hurricane Weather Products – 36 hrs or less

@environmentca
• Using Twitter again this year to
point to updates in the hurricane
status
• We will continue to experiment
with YouTube to post short
updates on active storms
approaching Canada
Operational Response to Hurricanes Social Media

• First stop of the
2015 HAT was in
Halifax on May 3rd
• USAF C-130
Hercules and
NOAA G-IV on
display
• Extensive
attendance and
media coverage to
promote hurricane
awareness
Public Awareness – HAT 2015 in Halifax
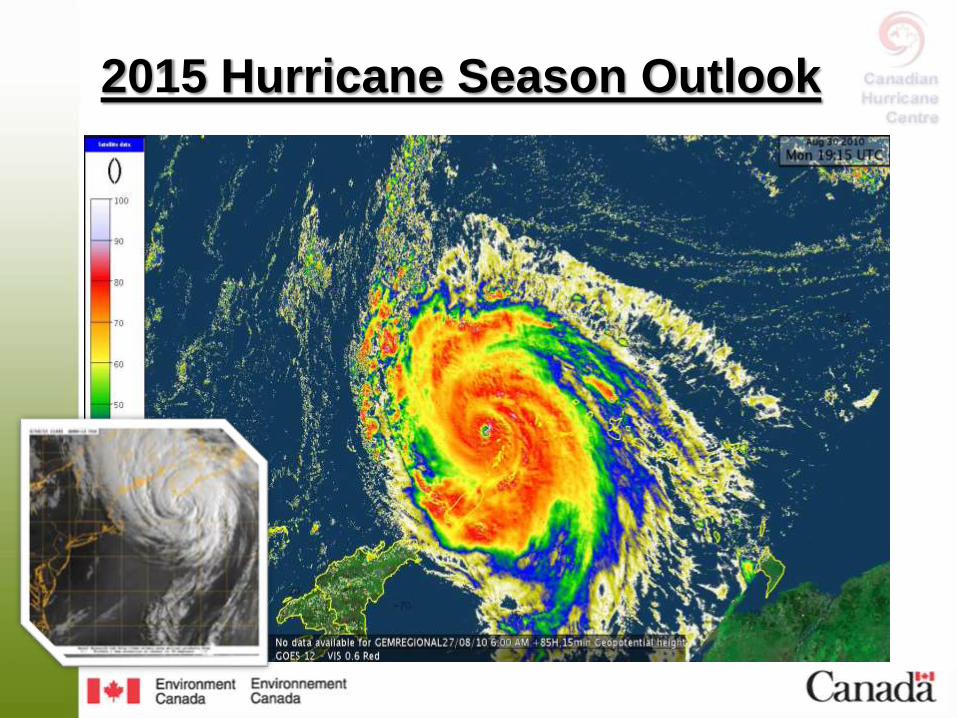
2015 Hurricane Season Outlook

2015 Hurricane Season Outlook
Named
Storms
Hurricanes
Category 1 to 5
Major
Hurricanes
Category 3-5
National Oceanic and
Atmospheric
Administration (US)
6-11
3-6
0-2
Colorado State
University 10 4 1
Tropical Storm Risk 8 3 1
1981-2010 Average 12 6 2 - 3
1961-2010 Average 11 6 2

Global Sea Surface Temperatures
Warming sea surface
temperatures indicate El
Nino conditions which
suppresses hurricane
activity in the Atlantic
Cooler water temperatures over the Atlantic means fewer storms

List of Atlantic Storm Names 2015 2016 2017 2018 2019 2020
Ana Alex Arlene Alberto Andrea Arthur
Bill Bonnie Bret Beryl Barry Bertha
Claudette Colin Cindy Chris Chantal Cristobal
Danny Danielle Don Debby Dorian Dolly
Erika Earl Emily Ernesto Erin Edouard
Fred Fiona Franklin Florence Fernand Fay
Grace Gaston Gert Gordon Gabrielle Gonzalo
Henri Hermine Harvey Helene Humberto Hanna
Ida Ian Irma Isaac Imelda Isaias
Joaquin Julia Jose Joyce Jerry Josephine
Kate Karl Katia Kirk Karen Kyle
Larry Lisa Lee Leslie Lorenzo Laura
Mindy Matthew Maria Michael Melissa Marco
Nicholas Nicole Nate Nadine Nestor Nana
Odette Otto Ophelia Oscar Olga Omar
Peter Paula Philippe Patty Pablo Paulette
Rose Richard Rina Rafael Rebekah Rene
Sam Shary Sean Sara Sebastien Sally
Teresa Tobias Tammy Tony Tanya Teddy
Victor Virginie Vince Valerie Van Vicky
Wanda Walter Whitney William Wendy Wilfred

….it only takes one storm to
make it a bad year!